potential use of rosemary extract to increase the quality
TRANSCRIPT

*Corresponding author.Email: [email protected]
International Food Research Journal 28(3): 554 - 565 (June 2021)Journal homepage: http://www.ifrj.upm.edu.my
© All Rights Reserved
Abstract
A commercial rosemary extract was evaluated for antioxidant effectiveness in rendered chicken fat and antibacterial activity against selected foodborne pathogens. Four treatments were used in the experiment comprising of 25 and 50 ppm rosemary extract (RE), 200 ppm butylated hydroxyanisole (BHA; commercial antioxidant as positive control), and a negative control without antioxidant. All treatments were subjected to oxidative stability analysis tests including free fatty acid (FFA), peroxide value (PV), p-Anisidine value (AV), and total oxidation value (TOTOX), which were analysed weekly for a total period of seven weeks. In addition, RE was tested for antibacterial activity against Bacillus cereus, Escherichia coli, Klebsiella pneumoniae, Listeria monocytogenes, Salmonella enterica, and Staphylococcus aureus using disc diffusion assay (DDA). The results showed that the addition of 50 ppm of RE yielded the most potent antioxidant effect as evidenced by the lowest amounts for negative oxidation indicators (i.e., FFA, PV, AV, and TOTOX) as compared to the other treatments. BHA showed significant antioxidant effect between treatments for FFA and PV, and 25 ppm RE showed significant antioxidant effect between treatments for FFA only. DDA resulted in inhibition zones against all the tested bacteria ranging from 7.7 ± 0.6 mm (S. enterica; weakest inhibition) to 11.8 ± 0.4 mm (K. pneumonia; strongest inhibition). The findings showed that rosemary extract can be used as a natural antioxidant that effectively delays oxidation and exhibits antibacterial properties.
Keywords
Article history
Received: 20 April 2020Received in revised form: 19 November 2020Accepted:2 December 2020
rosemary extract, chicken fat, oxidative stability, natural antioxidant, foodborne pathogens
Introduction
Over the past few decades, food manufacturers and researchers have developed various methods to inhibit or delay lipid oxidation. One of the common methods used is by adding antioxidants. There are two major groups of antioxidants: synthetic antioxidants and natural antioxidants. These groups differ in terms of their origins, chemical structures, and mechanisms of action. Antioxidants play a vital role in combating oxidation which leads to rancidity, thus extending the shelf life of foods. Examples of common synthetic antioxidants used in the food industry are butylated hydroxyanisole (BHA), butylated hydroxytoluene (BHT), tertiarybutylhydroxyquinone (TBHQ), and propyl gallate (PG). Their main role is to slow down, reduce, or hinder oxidative deterioration by donating a hydrogen atom to free radicals, thus preventing the initiation of fatty acid radicals (Casarotti and Jorge, 2014). These synthetic antioxidants are extensively used by the industry due to their low cost and high oxidative stability that delays oxidation in products. Despite that, there is a growing demand for the use of
natural antioxidants to preserve foods since natural antioxidants lack the toxicity problems that may arise from the use of synthetic antioxidants. Studies have also shown that post activity of synthetic antioxidants causes them to be potential carcinogenic compounds especially when used at higher concentrations (Lourenço et al., 2019). This has prompted strict legislation on the levels permitted to be used for synthetic antioxidants. Furthermore, synthetic antioxidants are also restricted by the temperature whereby they are only effective at low temperatures (Nenadis et al., 2013). When synthetic antioxidants are subjected to high temperatures above 175°C, the heat causes the synthetic antioxidants to become highly volatile and unstable (Santos-Sanchez et al., 2019). In rendered chicken fat, this poses a problem as it could lead to the fat not being provided with sufficient protection against lipid oxidation at elevated temperatures (Guo et al., 2016). Rendered chicken fat is the fat obtained from raw chicken fat after it undergoes the rendering process. Heat is applied during the rendering process, usually over a long period of time, to extract the moisture, sterilise, and separate the
Department of Food Science, Faculty of Food Science and Technology, Universiti Putra Malaysia, 43400 UPM Serdang, Selangor, Malaysia
Badrul, S. and *Jaafar, A. H.
Potential use of rosemary extract to increase the quality and safety of rendered chicken fat

555 Badrul, S. and Jaafar, A. H./IFRJ 28(3) : 554 - 565
fats to produce stabilised by-products. This is essential because of the high water content and high microbial load of raw animal by-products (Firman, 2006). With the increasing negative consumers’ perception on synthetic antioxidants and health evidence relating to the post activity of these compounds, the interest in using natural antioxidants, such as plant extracts, is rapidly growing (Erkan et al., 2008). Plant extracts consist of many phytochemicals that can slow down the lipid oxidation, thus causing them to be good natural antioxidants. Among the plant extracts that have been studied, rosemary extract (RE) has shown the capability to be used industrially as an antioxidant (Chammem et al., 2015). Bioactive constituents in RE such as carnosic acid, diterpenes, caffeic acid, rosmarinic acid, carnosal, and its essential oil components have been documented to play importance in antioxidant functions (Rašković et al., 2014; Stojiljkovic et al., 2018; Gazwi et al., 2020). Moreover, synergistic activity between carnosic acid and carnosal in RE was found to act as vital scavengers of peroxyl radicals in the membrane lipids, and the peroxidation effect is higher as compared to the artificial antioxidants such as BHT, BHA, and propyl gallate (Nieto et al., 2018). In addition to antioxidant, RE has also been shown to have antibacterial activity in various assays against both Gram-positive and Gram-negative bacteria (Hussain et al., 2010; Kloy et al., 2020). The antimicrobial effect of RE determined using disc diffusion assay followed by modified resazurin assay against eight strains of bacteria has shown that RE was more potent towards Gram-posi-tive bacteria (Stojiljkovic et al., 2018). With regards to its antioxidant and antimicrobial activities, natural extract such as RE offers big potential to be used in food industry. Therefore, the objectives of the present work were to investigate the antioxidant activities of RE in rendered chicken fat, and their antibacterial activity against selected foodborne pathogens.
Materials and methods
Materials Commercial rosemary extract (RE) was obtained from Synthite Industries Ltd. (India). The code and product name for the RE used was 4010000691 Oleoresin Rosemary, and it was produced from solvent extraction of the dried aerial parts of rosemary (Salvia rosmarinus Spenn.) herb. BHA was purchased from Euro Chemo-Pharma Sdn. Bhd. (Malaysia). The RE was kept in a cool dry place at room temperature before use. Commercialised raw chicken was purchased from Aqina Jaya Sdn. Bhd. (Malaysia). The raw chicken fat was kept in a chest
freezer at -18°C before use. Preparation of rendered chicken fat The rendering of raw chicken fat was carried out at Savory Specialities Sdn. Bhd., Kuala Lumpur, Malaysia. The raw chicken fat was first thawed in a chiller at 4°C. A visual and smell quality check was conducted on the raw chicken fat for any discoloration, mould growth, or rancid smell before proceeding to rendering. The raw chicken fat was then washed and sorted to remove any foreign physical matters such as feather, stone, bone, and excess chicken meat. The washed raw chicken fat was then placed in perforated stainless-steel trays, and rinsed twice with water. The washed raw chicken fat was then weighed, and evenly distributed into filter baskets in the cooking tank where it was subjected to cooking at 130°C. The temperature was held for 5 min to ensure sterilisation of rendered chicken fat before concluding the cooking. Samples for quality checks were taken and evaluated using an in-house moisture analyser to ensure that the moisture content of the rendered chicken fat was less than 0.5%. Once the samples passed the quality checks, the rendered chicken fat was pumped into the mixing tank through connected pipes. The liquid fat was passed through 5 and 3 mm sieve size filters, respectively. The rendered chicken fat was mixed for 15 min before the antioxidants were added into the mixture. The rendered chicken fat was then filled into white high-density polyethylene pails where it passed through the final 1 mm sieve size filter, and was then weighed, packed, and stored. The raw chicken fat rendering process is summarised in Figure 1. For the experiment, four treatments were used as follows: (a) a negative control with no added antioxidants, (b) 25 ppm RE, (c) 50 ppm RE, and (d) 200 ppm BHA (commercial antioxidant; positive control). The end products (250 g) were stored in 500 mL sealed glass jar, and keep at room temperature for seven weeks of storage experiment. Three independent replications were prepared per treatment.
Oxidative stability analysesFree fatty acid (FFA) The method used to determine the free fatty acids (FFA) of rendered chicken fat was adopted from American Oil Chemists’ Society Official Method Cd 1-25 (AOCS, 1998). Briefly, 4 g of rendered chicken fat sample was weighed in a 250 mL conical flask, and then liquefied with 50 mL of isopropanol-ethanol solvent. A total of three drops of phenolphthalein indicator were added before the sample was titrated with 0.5 N sodium hydroxide until the endpoint was reached when the indicator changed to pink colour for

Badrul, S. and Jaafar, A. H./IFRJ 28(3) : 554 - 565 556
at least 10 s. The FFA (%) was calculated using Eq. 1:
(Eq.1)
where, v = volume of sodium hydroxide solution required, N = normality of sodium hydroxide, M = molecular weight of fatty acid (g/mol), and w = weight of sample (g).
Peroxide value (PV) The method used to determine the peroxide value (PV) of rendered chicken fat was adopted from American Oil Chemists’ Society Official Method Cd 8b-90 (AOCS, 1998) and Kuntom et al. (2004). Briefly, 5 g of rendered chicken fat sample was weighed into 250 mL flask before adding 30 mL of acetic acid-chloroform solution. The mixture was swirled until the sample dissolved. Next, 0.5 mL of saturated potassium iodide was added using a graduated pipette followed by 30 mL of distilled water. The mixture was titrated with 0.01 N sodium thiosulphate solution by adding it in gradually with constant and vigorous shaking until the endpoint to liberate all the iodine from the chloroform layers. Then, 0.01 N sodium thiosulphate was dropped until the blue colour disappeared. A blank test was carried out in parallel.
The (PV), expressed in milliequivalent of active oxygen per kilogram of sample, was calculated using Eq. 2:
(Eq.2)
where V = volume in mL of sodium thiosulphate solution for the determination, V0 = volume in mL of sodium thiosulphate solution for the blank test, c = normality of the sodium thiosulphate solution, and m = normality of the sodium thiosulphate solution.
p-Anisidine value (AV) The method used to determine the p-Anisidine value (PV) of rendered chicken fat was adopted from American Oil Chemists’ Society Official Method Cd 18-90 (AOCS, 1998) and Kuntom et al. (2004). Briefly, 1.5 g of rendered chicken fat sample was weighed into 250 mL volumetric flask, dissolved, and added with iso-octane solvent. The spectrophotometer was zeroed at 350 nm using the solvent. The absorbance of the sample solution was measured at 350 nm in the sample cell, using the reference cell filled with solvent as a blank. About 5 mL of fat solution and 5 mL of solvent was pipetted into a test tube, respectively, before adding 1 mL of p-Anisidine reagent to each test tube. The test tubes were shaken using a vortex mixer to homogenise the solution and reagent. After 10 min, the absorbance at 350 nm was taken using the solution in the fat solution test tube and solvent test tube as the blank in the reference sample. The (PV), expressed in milliequivalents of active oxygen per kilogram of sample, was calculated using Eq. 3:
(Eq.3)
where As = absorbance of the sample solution after reaction with reagent, Ab = absorbance of the sample solution, and m = mass or weight, in grams, of the test portion.
Total oxidation value (TOTOX) The total oxidation (TOTOX) value of rendered chicken fat was calculated based on the PV and AV values (De Abreu et al., 2010). The TOTOX, expressed in milliequivalent of active oxygen per kilogram of sample, was calculated using Eq. 4:
(Eq.4)
where, PV = peroxide value, and AV = p-Anisidine value.
Figure 1. Flowchart of raw chicken fat renderingprocess.
= 10
= ( − 0 ) × 1000 ×
− value = 25 × (1.2 − )
= 2 +

557 Badrul, S. and Jaafar, A. H./IFRJ 28(3) : 554 - 565
Antibacterial susceptibility analysis The antibacterial activity of RE was conducted against selected foodborne pathogens (Bacillus cereus ATCC33019, Escherichia coli ATCC43895, Klebsiella pneumoniae ATCC13773, Listeria monocytogenes ATCC19112, Salmonella enterica ATCC14028, and Staphylococcus aureus ATCC29737), and the inhibition activity was determined using disc diffusion assay (DDA). Bacterial strains were obtained from the Laboratory of Food Microbiology, Department of Food Science, Faculty Food Science and Technology, Universiti Putra Malaysia. To activate, the bacterial cultures were streaked on Mueller-Hinton agar (MHA; Oxoid, UK), and incubated at 37°C for 24 h prior to inoculation. To prepare the MHA, 38 mg of MHA powder was added to 1 L of distilled water in a flat-bottomed conical flask, before being heated with frequent agitation, and boiled for 1 min to completely dissolve the agar powder. The mixture was then autoclaved for 15 min, 121°C, and 15 psi. Afterwards, the mixture was left to cool to room temperature. The sterilised medium was aseptically poured into 90 mm Ø Petri plates, left at room temperature until solidified, and refrigerated at 4°C until bacterial inoculation. The method used to perform the DDA was adopted from Opinde (2012) with slight modifications. Whatman qualitative filter paper No. 2 (Whatman International Ltd., UK) was used to prepare discs of 6 mm Ø by using a hole puncher. The prepared discs were placed inside a glass bottle before being sterilised by autoclaving for 15 min, 121°C, and 15 psi. The discs were then air-dried in hot air oven at 50°C to remove residual moisture. The previously prepared MHA was separately spread with the bacterial cultures using sterilised cotton swabs. A total of five prepared test discs were placed on the surface of the inoculated MHA with three discs in a line at the centre of the agar and the other two discs on the top and bottom of the agar, respectively, and labelled accordingly. Next, 0.01 mL of RE was applied on the three discs in a line at the centre using a micropipette. Then, 0.01 mL of positive control (0.1% chlorhexidine) and negative control (10% dimethyl sulfoxide) was applied on the discs on the top and bottom of the agar, respectively. The inoculated MHA plates were incubated at 37°C for 24 h, and the inhibition zone surrounding the discs was measured in two directions perpendicular to each other, and the average values were used to obtain the final inhibition zones.
Statistical analysis All experiments were conducted in triplicates
(n = 3), and presented as means ± standard deviations (SD). One-way Analysis of Variance (ANOVA) was performed using Minitab® Version 17 for Windows (Minitab Inc., Pennsylvania, USA) followed by a post-hoc analysis, Dunnett’s test. Significance was taken at p < 0.05. Results and discussion
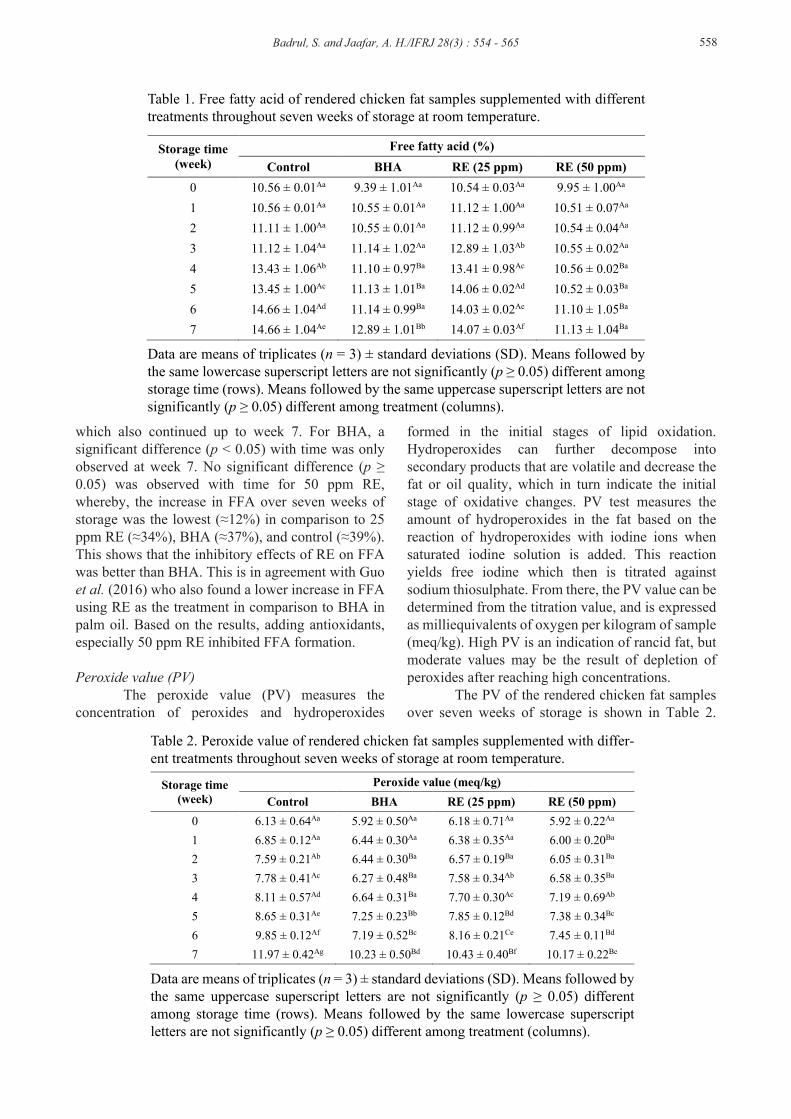
Oxidative stability analysisFree fatty acid (FFA) Free fatty acid (FFA) is the percentage by weight of a specified fatty acid. FFA is formed in fats and oils by the hydrolysis of triglycerides. It is considered a key indicator for quality and the economic value of edible fats and oils, as the higher the level of FFA, the more prone the fat or oil is to oxidation that ultimately causes rancidity (O’Keefe and Pike, 2010). FFA is the hydrolysis product typically formed when the fat or oil is subjected to either long term storage or processed at high temperatures. The rate of FFA formation is proportional with the increase of moisture content, storage time, storage temperature, and processes such as heating and frying (Mahesar et al., 2014). In the present work, the storage time was manipulated while the storage temperature and processing were controlled. The finished quality control check of rendered chicken fat samples ensured that the moisture content was less than 0.5%. The FFA content of the rendered chicken fat samples over seven weeks of storage is shown in Table 1. It can be seen that there was a steady increase in the FFA content over time. Initially, it was observed that there was no significant difference (p ≥ 0.05) between the FFA content of different treatments of rendered chicken fat. At week 4, however, it was observed that there was a significant difference (p < 0.05) as compared to the control for rendered chicken fat treated with BHA and 50 ppm RE which continued until the end of the experiment. At the end of the experiment, the FFA of all the rendered chicken fat samples increased as follows: control (14.66 ± 1.04%) > 25 ppm RE (14.07 ± 0.03%) > BHA (12.89 ± 1.01%) > 50 ppm RE (11.13 ± 1.04%). BHA, 25 ppm RE, and 50 ppm RE demonstrated a decrease in FFA by 12, 4, and 24%, respectively, when compared with the control at the end of the storage period of seven weeks. Over time, the earliest significant difference (p < 0.05) was demonstrated in 25 ppm RE at week 3, which continued up to week 7, with a gradual increase in the FFA. The control showed a significant difference (p < 0.05) with time starting from week 4,
Badrul, S. and Jaafar, A. H./IFRJ 28(3) : 554 - 565 558
which also continued up to week 7. For BHA, a significant difference (p < 0.05) with time was only observed at week 7. No significant difference (p ≥ 0.05) was observed with time for 50 ppm RE, whereby, the increase in FFA over seven weeks of storage was the lowest (≈12%) in comparison to 25 ppm RE (≈34%), BHA (≈37%), and control (≈39%). This shows that the inhibitory effects of RE on FFA was better than BHA. This is in agreement with Guo et al. (2016) who also found a lower increase in FFA using RE as the treatment in comparison to BHA in palm oil. Based on the results, adding antioxidants, especially 50 ppm RE inhibited FFA formation.
Peroxide value (PV) The peroxide value (PV) measures the concentration of peroxides and hydroperoxides
formed in the initial stages of lipid oxidation. Hydroperoxides can further decompose into secondary products that are volatile and decrease the fat or oil quality, which in turn indicate the initial stage of oxidative changes. PV test measures the amount of hydroperoxides in the fat based on the reaction of hydroperoxides with iodine ions when saturated iodine solution is added. This reaction yields free iodine which then is titrated against sodium thiosulphate. From there, the PV value can be determined from the titration value, and is expressed as milliequivalents of oxygen per kilogram of sample (meq/kg). High PV is an indication of rancid fat, but moderate values may be the result of depletion of peroxides after reaching high concentrations. The PV of the rendered chicken fat samples over seven weeks of storage is shown in Table 2.
Storage time (week)
Free fatty acid (%) Control BHA RE (25 ppm) RE (50 ppm)
0 10.56 ± 0.01Aa 9.39 ± 1.01Aa 10.54 ± 0.03Aa 9.95 ± 1.00Aa 1 10.56 ± 0.01Aa 10.55 ± 0.01Aa 11.12 ± 1.00Aa 10.51 ± 0.07Aa 2 11.11 ± 1.00Aa 10.55 ± 0.01Aa 11.12 ± 0.99Aa 10.54 ± 0.04Aa 3 11.12 ± 1.04Aa 11.14 ± 1.02Aa 12.89 ± 1.03Ab 10.55 ± 0.02Aa 4 13.43 ± 1.06Ab 11.10 ± 0.97Ba 13.41 ± 0.98Ac 10.56 ± 0.02Ba 5 13.45 ± 1.00Ac 11.13 ± 1.01Ba 14.06 ± 0.02Ad 10.52 ± 0.03Ba 6 14.66 ± 1.04Ad 11.14 ± 0.99Ba 14.03 ± 0.02Ae 11.10 ± 1.05Ba 7 14.66 ± 1.04Ae 12.89 ± 1.01Bb 14.07 ± 0.03Af 11.13 ± 1.04Ba
Table 1. Free fatty acid of rendered chicken fat samples supplemented with different treatments throughout seven weeks of storage at room temperature.
Data are means of triplicates (n = 3) ± standard deviations (SD). Means followed by the same lowercase superscript letters are not significantly (p ≥ 0.05) different among storage time (rows). Means followed by the same uppercase superscript letters are not significantly (p ≥ 0.05) different among treatment (columns).
Storage time (week)
Peroxide value (meq/kg) Control BHA RE (25 ppm) RE (50 ppm)
0 6.13 ± 0.64Aa 5.92 ± 0.50Aa 6.18 ± 0.71Aa 5.92 ± 0.22Aa 1 6.85 ± 0.12Aa 6.44 ± 0.30Aa 6.38 ± 0.35Aa 6.00 ± 0.20Ba 2 7.59 ± 0.21Ab 6.44 ± 0.30Ba 6.57 ± 0.19Ba 6.05 ± 0.31Ba 3 7.78 ± 0.41Ac 6.27 ± 0.48Ba 7.58 ± 0.34Ab 6.58 ± 0.35Ba 4 8.11 ± 0.57Ad 6.64 ± 0.31Ba 7.70 ± 0.30Ac 7.19 ± 0.69Ab 5 8.65 ± 0.31Ae 7.25 ± 0.23Bb 7.85 ± 0.12Bd 7.38 ± 0.34Bc 6 9.85 ± 0.12Af 7.19 ± 0.52Bc 8.16 ± 0.21Ce 7.45 ± 0.11Bd 7 11.97 ± 0.42Ag 10.23 ± 0.50Bd 10.43 ± 0.40Bf 10.17 ± 0.22Be
Table 2. Peroxide value of rendered chicken fat samples supplemented with differ-ent treatments throughout seven weeks of storage at room temperature.
Data are means of triplicates (n = 3) ± standard deviations (SD). Means followed by the same uppercase superscript letters are not significantly (p ≥ 0.05) different among storage time (rows). Means followed by the same lowercase superscript letters are not significantly (p ≥ 0.05) different among treatment (columns).

Badrul, S. and Jaafar, A. H./IFRJ 28(3) : 554 - 565559
Like FFA, initially there was no significant difference (p ≥ 0.05) among the PV of different treatments. Throughout the storage period, the PV of all the samples gradually increased, and were as follows at the end of the experiment: control (11.97 ± 0.42 meq/kg) > 25 ppm RE (10.43 ± 0.40 meq/kg) > BHA (10.23 ± 0.50 meq/kg) > 50 ppm RE (10.17 ± 0.22 meq/kg). From Table 2, it can be seen that there was a slow increase in PV for all treatments over time, with a spike during week 7 where the rate of oxidation increased. There was a slight drop in PV which might be due to the decomposition of hydroperoxides, which are unstable and susceptible to decomposition (Yang et al., 2016). However, there was no reduction trend in PV observed in all the samples which indicated that the samples were in the early stage of oxidation. The earliest significant difference (p < 0.05) with time was observed at week 2 (control), week 3 (25 ppm RE), week 4 (50 ppm RE), and week 5 (BHA). BHA delayed lipid oxidation longer as compared to the treatments with RE. This could be due to the mechanism of BHA that prevents lipid oxidation by donating a hydrogen atom to free radicals, thereby preventing initiation (Branen, 1975). In RE, phenolic compounds (i.e., carnosol and carnosic acid) prevent lipid oxidation by preventing scavenging radicals to begin chain inhibition during propagation (Dorman et al., 2003). When comparing the different treatments with the control, significant difference (p < 0.05) was observed as early as week 2, thus showing a clear antioxidant effect on lowering the PV. BHA showed the highest antioxidant effect while the antioxidant effect for RE increased with the concentration. This is supported by a previous study which compared rosemary essential oil with BHA, and found that while rosemary essential oil had a strong antioxidant effect as compared to the control, BHA was found to be more effective despite it exhibited no antioxidant effect on the first few days of storage (Özcan and Arslan, 2011). In the present work, however, there was no significant difference (p ≥ 0.05) when comparing between BHA and 50 ppm RE, thus showing that both treatments had equal effect on PV reduction. BHA, 25 ppm RE, and 50 ppm RE demonstrated a decrease in PV by 15, 13, and 15%, respectively, when compared with the control at the end of the storage period of seven weeks. Despite that, at the end of the experiment, the PV of rendered chicken fat sample treated with 50 ppm RE was slightly lower than BHA. This contrasts with findings from Yang et al. (2016) who reported
that soybean, cottonseed, and rice bran oil added with RE exhibited considerably lower PV values as compared to oils treated with synthetic antioxidants (BHA + BHT). Furthermore, treatment with 50 ppm RE in the present work showed a slow increment from week 0 to week 2, followed by a steady increment from week 2 onwards, while BHA showed a steady increase over the storage period with a slight drop from week 2 to week 3. A slower increase of PV implies a higher oxidative stability. Both treatments showed a sudden hike at the end of the experiment. Without any antioxidants, it could be seen that there was a steady hike between each week from week 0 to week 7. The results suggest that RE at concentration 50 ppm was able to slow down the formation of hydroperoxides in rendered chicken fat samples as effectively as BHA, thus delaying the lipid oxidation. p-Anisidine value (AV) The p-Anisidine value (AV) should be monitored concurrently with PV to ensure effective observation of the lipid oxidation in rendered chicken fat (Poiana, 2012). AV quantifies the secondary products formed when the primary products (hydroperoxides) decompose to carbonyls, aldehydes, and other components. This is the stage that leads to the rancid flavour of the fat or oil (Laguerre et al., 2007). The AV test measures the aldehyde produced from lipid oxidation through colour quantification using a spectrophotometer. When fat is dissolved in iso-octane and added with p-Anisidine reagent, a reaction occurs between the p-Anisidine and aldehyde in the fat to produce a yellow-coloured solution. The absorbance of the yellow-coloured solution is then measured at 350 nm using a spectrophotometer to obtain the AV. A high AV is an indicator of excessive deterioration, while a lower AV value indicates a better quality of oil. The AV of the rendered chicken fat samples over seven weeks of storage is shown in Table 3. It is apparent that, initially, no significant difference (p ≥ 0.05) was observed among the AV of different treatments of the rendered chicken fat samples. At week 3, there was a significant increase (p < 0.05) in AV of rendered chicken fat samples treated with BHA, 25 ppm RE, and 50 ppm RE. The negative control showed a significant difference (p < 0.05) at week 2 as compared to week 0. This shows that without any treatments, the decomposition of hydroperoxides occurred sooner. BHA, 25 ppm RE, and 50 ppm RE decreased the AV by 9, 1, and 15%, respectively, when compared with the control at the end of the storage period of seven weeks. This shows that a lower
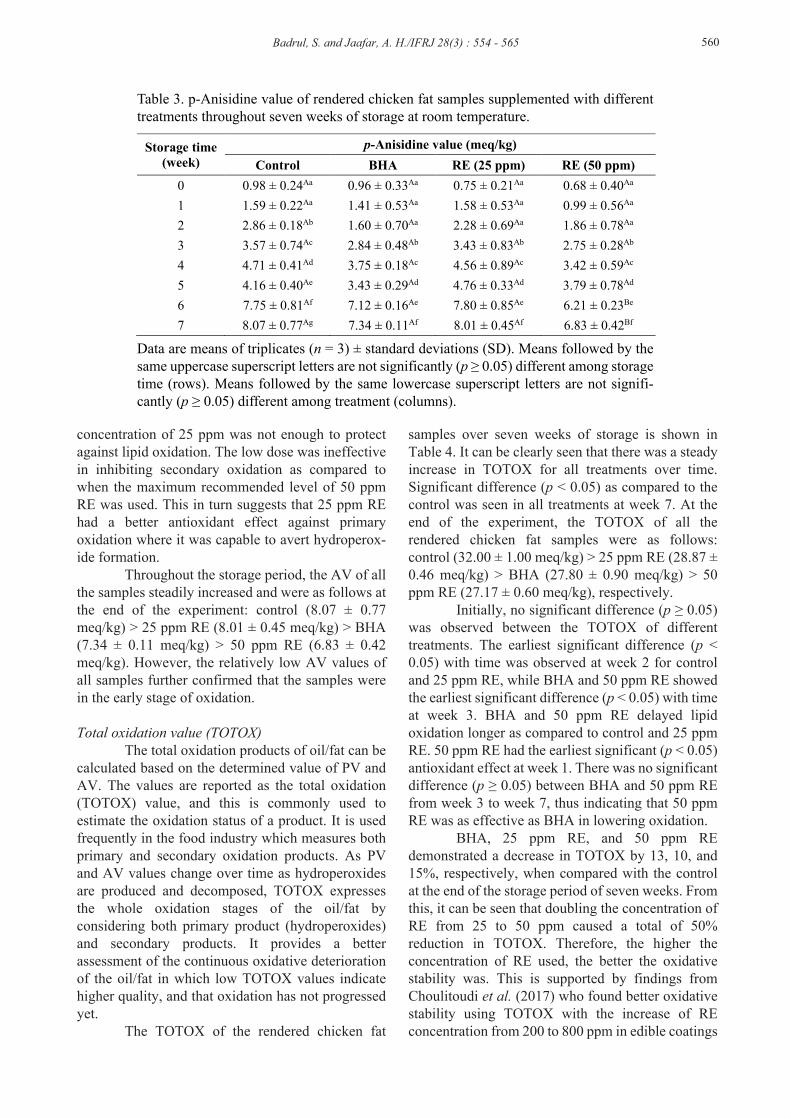
concentration of 25 ppm was not enough to protect against lipid oxidation. The low dose was ineffective in inhibiting secondary oxidation as compared to when the maximum recommended level of 50 ppm RE was used. This in turn suggests that 25 ppm RE had a better antioxidant effect against primary oxidation where it was capable to avert hydroperox-ide formation. Throughout the storage period, the AV of all the samples steadily increased and were as follows at the end of the experiment: control (8.07 ± 0.77 meq/kg) > 25 ppm RE (8.01 ± 0.45 meq/kg) > BHA (7.34 ± 0.11 meq/kg) > 50 ppm RE (6.83 ± 0.42 meq/kg). However, the relatively low AV values of all samples further confirmed that the samples were in the early stage of oxidation.
Total oxidation value (TOTOX) The total oxidation products of oil/fat can be calculated based on the determined value of PV and AV. The values are reported as the total oxidation (TOTOX) value, and this is commonly used to estimate the oxidation status of a product. It is used frequently in the food industry which measures both primary and secondary oxidation products. As PV and AV values change over time as hydroperoxides are produced and decomposed, TOTOX expresses the whole oxidation stages of the oil/fat by considering both primary product (hydroperoxides) and secondary products. It provides a better assessment of the continuous oxidative deterioration of the oil/fat in which low TOTOX values indicate higher quality, and that oxidation has not progressed yet. The TOTOX of the rendered chicken fat
samples over seven weeks of storage is shown in Table 4. It can be clearly seen that there was a steady increase in TOTOX for all treatments over time. Significant difference (p < 0.05) as compared to the control was seen in all treatments at week 7. At the end of the experiment, the TOTOX of all the rendered chicken fat samples were as follows: control (32.00 ± 1.00 meq/kg) > 25 ppm RE (28.87 ± 0.46 meq/kg) > BHA (27.80 ± 0.90 meq/kg) > 50 ppm RE (27.17 ± 0.60 meq/kg), respectively. Initially, no significant difference (p ≥ 0.05) was observed between the TOTOX of different treatments. The earliest significant difference (p < 0.05) with time was observed at week 2 for control and 25 ppm RE, while BHA and 50 ppm RE showed the earliest significant difference (p < 0.05) with time at week 3. BHA and 50 ppm RE delayed lipid oxidation longer as compared to control and 25 ppm RE. 50 ppm RE had the earliest significant (p < 0.05) antioxidant effect at week 1. There was no significant difference (p ≥ 0.05) between BHA and 50 ppm RE from week 3 to week 7, thus indicating that 50 ppm RE was as effective as BHA in lowering oxidation. BHA, 25 ppm RE, and 50 ppm RE demonstrated a decrease in TOTOX by 13, 10, and 15%, respectively, when compared with the control at the end of the storage period of seven weeks. From this, it can be seen that doubling the concentration of RE from 25 to 50 ppm caused a total of 50% reduction in TOTOX. Therefore, the higher the concentration of RE used, the better the oxidative stability was. This is supported by findings from Choulitoudi et al. (2017) who found better oxidative stability using TOTOX with the increase of RE concentration from 200 to 800 ppm in edible coatings
Badrul, S. and Jaafar, A. H./IFRJ 28(3) : 554 - 565 560
Storage time (week)
p-Anisidine value (meq/kg) Control BHA RE (25 ppm) RE (50 ppm)
0 0.98 ± 0.24Aa 0.96 ± 0.33Aa 0.75 ± 0.21Aa 0.68 ± 0.40Aa 1 1.59 ± 0.22Aa 1.41 ± 0.53Aa 1.58 ± 0.53Aa 0.99 ± 0.56Aa 2 2.86 ± 0.18Ab 1.60 ± 0.70Aa 2.28 ± 0.69Aa 1.86 ± 0.78Aa 3 3.57 ± 0.74Ac 2.84 ± 0.48Ab 3.43 ± 0.83Ab 2.75 ± 0.28Ab 4 4.71 ± 0.41Ad 3.75 ± 0.18Ac 4.56 ± 0.89Ac 3.42 ± 0.59Ac 5 4.16 ± 0.40Ae 3.43 ± 0.29Ad 4.76 ± 0.33Ad 3.79 ± 0.78Ad 6 7.75 ± 0.81Af 7.12 ± 0.16Ae 7.80 ± 0.85Ae 6.21 ± 0.23Be 7 8.07 ± 0.77Ag 7.34 ± 0.11Af 8.01 ± 0.45Af 6.83 ± 0.42Bf
Table 3. p-Anisidine value of rendered chicken fat samples supplemented with different treatments throughout seven weeks of storage at room temperature.
Data are means of triplicates (n = 3) ± standard deviations (SD). Means followed by the same uppercase superscript letters are not significantly (p ≥ 0.05) different among storage time (rows). Means followed by the same lowercase superscript letters are not signifi-cantly (p ≥ 0.05) different among treatment (columns).
Badrul, S. and Jaafar, A. H./IFRJ 28(3) : 554 - 565561
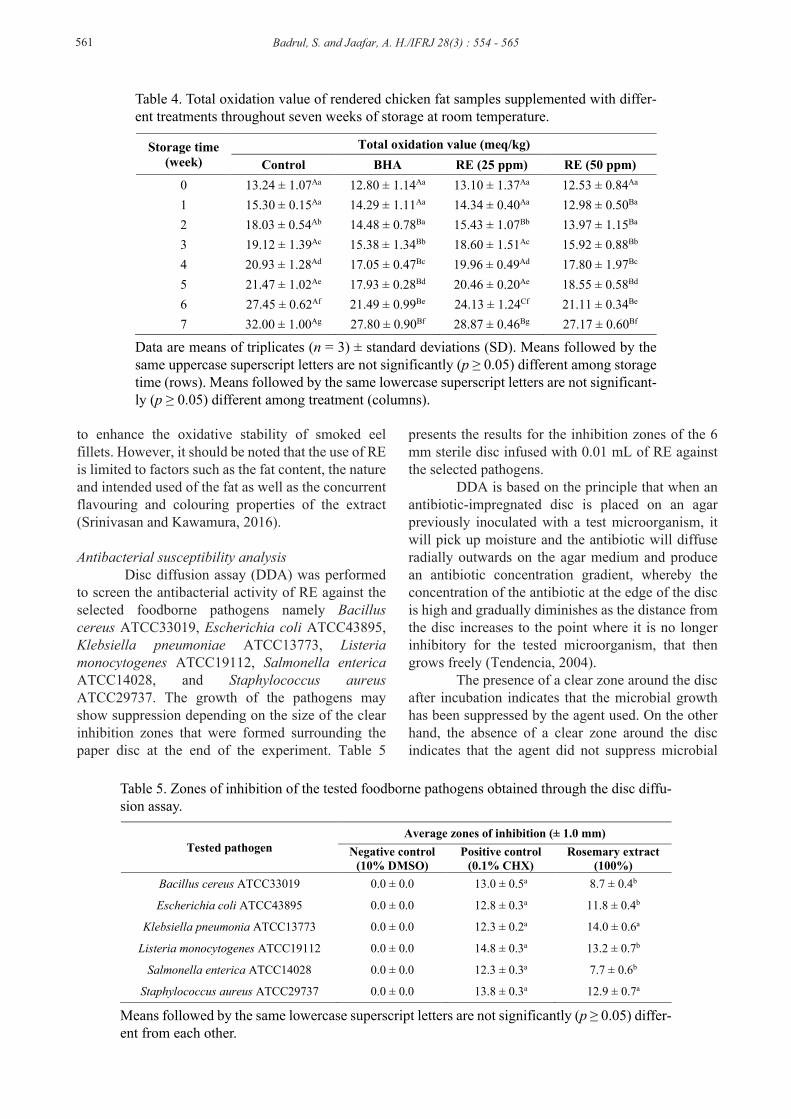
to enhance the oxidative stability of smoked eel fillets. However, it should be noted that the use of RE is limited to factors such as the fat content, the nature and intended used of the fat as well as the concurrent flavouring and colouring properties of the extract (Srinivasan and Kawamura, 2016). Antibacterial susceptibility analysis Disc diffusion assay (DDA) was performed to screen the antibacterial activity of RE against the selected foodborne pathogens namely Bacillus cereus ATCC33019, Escherichia coli ATCC43895, Klebsiella pneumoniae ATCC13773, Listeria monocytogenes ATCC19112, Salmonella enterica ATCC14028, and Staphylococcus aureus ATCC29737. The growth of the pathogens may show suppression depending on the size of the clear inhibition zones that were formed surrounding the paper disc at the end of the experiment. Table 5
presents the results for the inhibition zones of the 6 mm sterile disc infused with 0.01 mL of RE against the selected pathogens. DDA is based on the principle that when an antibiotic-impregnated disc is placed on an agar previously inoculated with a test microorganism, it will pick up moisture and the antibiotic will diffuse radially outwards on the agar medium and produce an antibiotic concentration gradient, whereby the concentration of the antibiotic at the edge of the disc is high and gradually diminishes as the distance from the disc increases to the point where it is no longer inhibitory for the tested microorganism, that then grows freely (Tendencia, 2004). The presence of a clear zone around the disc after incubation indicates that the microbial growth has been suppressed by the agent used. On the other hand, the absence of a clear zone around the disc indicates that the agent did not suppress microbial
Table 4. Total oxidation value of rendered chicken fat samples supplemented with differ-ent treatments throughout seven weeks of storage at room temperature.
Data are means of triplicates (n = 3) ± standard deviations (SD). Means followed by the same uppercase superscript letters are not significantly (p ≥ 0.05) different among storage time (rows). Means followed by the same lowercase superscript letters are not significant-ly (p ≥ 0.05) different among treatment (columns).
Storage time (week)
Total oxidation value (meq/kg) Control BHA RE (25 ppm) RE (50 ppm)
0 13.24 ± 1.07Aa 12.80 ± 1.14Aa 13.10 ± 1.37Aa 12.53 ± 0.84Aa 1 15.30 ± 0.15Aa 14.29 ± 1.11Aa 14.34 ± 0.40Aa 12.98 ± 0.50Ba 2 18.03 ± 0.54Ab 14.48 ± 0.78Ba 15.43 ± 1.07Bb 13.97 ± 1.15Ba 3 19.12 ± 1.39Ac 15.38 ± 1.34Bb 18.60 ± 1.51Ac 15.92 ± 0.88Bb 4 20.93 ± 1.28Ad 17.05 ± 0.47Bc 19.96 ± 0.49Ad 17.80 ± 1.97Bc 5 21.47 ± 1.02Ae 17.93 ± 0.28Bd 20.46 ± 0.20Ae 18.55 ± 0.58Bd 6 27.45 ± 0.62Af 21.49 ± 0.99Be 24.13 ± 1.24Cf 21.11 ± 0.34Be 7 32.00 ± 1.00Ag 27.80 ± 0.90Bf 28.87 ± 0.46Bg 27.17 ± 0.60Bf
Table 5. Zones of inhibition of the tested foodborne pathogens obtained through the disc diffu-sion assay.
Means followed by the same lowercase superscript letters are not significantly (p ≥ 0.05) differ-ent from each other.
Tested pathogen Average zones of inhibition (± 1.0 mm)
Negative control (10% DMSO)
Positive control (0.1% CHX)
Rosemary extract (100%)
Bacillus cereus ATCC33019 0.0 ± 0.0 13.0 ± 0.5a 8.7 ± 0.4b
Escherichia coli ATCC43895 0.0 ± 0.0 12.8 ± 0.3a 11.8 ± 0.4b
Klebsiella pneumonia ATCC13773 0.0 ± 0.0 12.3 ± 0.2a 14.0 ± 0.6a
Listeria monocytogenes ATCC19112 0.0 ± 0.0 14.8 ± 0.3a 13.2 ± 0.7b
Salmonella enterica ATCC14028 0.0 ± 0.0 12.3 ± 0.3a 7.7 ± 0.6b
Staphylococcus aureus ATCC29737 0.0 ± 0.0 13.8 ± 0.3a 12.9 ± 0.7a

growth. The larger the inhibition zone formed around the disc, the greater the inhibition and the higher the antibacterial activity of the agent. In the present work, the clear inhibition zone was measured and compared to the zone created by chlorhexidine (positive control). Chlorhexidine is an active agent commonly used as a disinfectant and antiseptic for skin disinfection, and to sterilise surgical instruments. It is favourable amongst disinfectants because of its effectiveness against both Gram-posi-tive and Gram-negative bacteria, and has very few undesirable side effects (Cheung et al., 2012). As shown in Table 5, there were inhibition zones for all the tested pathogens, thus showing the antibacterial potential of RE. However, it should be noted that almost all the inhibition zones for RE were smaller than that exacted by the positive control. The diameters of the inhibition zones for the selected pathogens were as follows: K. pneumoniae > S. aureus > L. monocytogenes > E. coli > B. cereus > S. enterica. RE showed the highest inhibition zone of 14.0 ± 0.6 mm for K. pneumoniae. This inhibition zone was approximately 14% larger than the positive control but with no significant difference (p ≥ 0.05) between them. S. aureus also showed a strong inhibition of 12.9 ± 0.7 mm with RE but with no significant difference (p ≥ 0.05) from the control. This shows that RE is equally as effective as chlorhexidine in inhibiting K. pneumoniae and S. aureus. Modest inhibition by RE was shown for L. monocytogenes and E. coli with inhibition zones of 13.2 ± 0.7 and 11.8 ± 0.4 mm, respectively. However, the inhibition zone of the positive control for both pathogens were significantly larger (p < 0.05), thus indicating that RE was not as effective at suppressing the pathogens as compared to chlorhexidine. Lastly, weak inhibition was observed for B. cereus and S. enterica with inhibition zones of 8.7 ± 0.4 and 7.7 ± 0.6 mm that showed approximate-ly 33 and 37% smaller inhibition zones, respectively, as compared to the positive control. It can be seen that RE had antibacterial properties against both Gram-positive and Gram-negative bacteria. This is supported by Moreno et al. (2006) who proposed that the antibacterial activity could be attributed to carnosol and carnosic acid in RE. A study conducted by Luqman et al. (2007) observed inhibition zones of 9.0, 9.0, 10.0, and 10.0 mm for E. coli, K. pneumoniae, S. enterica, and S. aureus, respectively, using rosemary essential oil with observations that rosemary essential oil showed more antibacterial activity against Gram-positive bacteria.
Gram-positive bacteria are known to be more susceptible to essential oils than Gram-negative bacteria (Inouye et al., 2001). This is explained by the presence of an external membrane in Gram-nega-tive bacteria that prevents the penetration of compounds across the barrier (Issabeagloo et al., 2012). An antibacterial study of RE against different species of Listeria demonstrated an inhibition zone within the range of 6.00 and 8.00 mm (Rozman and Jersek, 2009). The study further concluded that the antibacterial activity of RE was dependent on the selected RE, concentration of extracts, and different species/strains of the tested microorganisms (Rozman and Jersek, 2009). DDA is a simple and low-cost method that provides easy result interpretation useful for screening enormous numbers of microorganisms and antimicrobial agents, and commonly used for antimicrobial screening of plant extracts, essential oils, and other drugs (Balouiri et al., 2016). However, DDA has its limitations. Most plant extracts are hydrophobic in nature and prevents the flow of the substances. As a result, the diffusion of the plant extract may not be uniform resulting in the antibacterial activity of the extract not being accurately measured (Rios et al., 1988). Compounds that are less polar also diffuse more slowly into the culture media and this might cause the absence of an inhibition zone (Moreno et al., 2006). Therefore, the inhibitory data obtained from DDA might not be sufficient to be used on its own, and could only serve as a preliminary screening that provides qualitative data for antimicrobial activity (Smith-Palmer et al., 1998). Based on results obtained in the present work, it can be seen that RE exhibited antibacterial properties against the tested foodborne pathogens. However, this result should only be used as a preliminary screening and could be further validated by minimal inhibitory concentration and minimal bactericidal concentration to further confirm the antibacterial activity of RE.
Conclusion
Throughout the seven weeks of treatments, the development and the inhibition pattern of the primary and secondary lipid oxidation products can be monitored at different rates depending on the treatments used. The addition of RE to the rendered chicken fats was shown to be a positive additive in stabilising the lipid oxidation, hence, prolonging the stability of the end products. The use of 50 ppm RE was shown to cause
Badrul, S. and Jaafar, A. H./IFRJ 28(3) : 554 - 565 562

Badrul, S. and Jaafar, A. H./IFRJ 28(3) : 554 - 565563
the most potent antioxidant effect as evidenced by the lowest amounts of negative oxidation indicators (FFA, PV, AV, and TOTOX) as compared to the other treatments. The concentration of RE played an important role in inhibiting lipid oxidation, as at a lower concentration of 25 ppm RE, weak oxidative stability was shown. Therefore, the higher the concentration of RE used, the better the oxidative stability. Further, 50 ppm RE was also found to be as effective as BHA in reducing the formation of FFA produced by the hydrolysis of triglycerides in the fats, and lowering the hydroperoxides formed during the initial stage of primary oxidation. Preliminary antibacterial testing using DDA resulted in inhibition zones for all the tested Gram-positive and Gram-negative foodborne pathogens, thus indicating antibacterial potential of RE. Strong inhibition zones were shown for K. pneumoniae and S. aureus which demonstrated that RE was equally effective as chlorhexidine in inhibiting these pathogens. However, the antibacteri-al activity of RE is dependent on the selected RE, concentration of extracts, and different species/strains of microorganisms. All in all, the findings of the present work showed that RE could be used as a natural antioxidant in rendered chicken fat that effectively delays lipid oxidation and exhibits antibacterial properties.
References
American Oil Chemists’ Society (AOCS). 1998. Official methods and recommended practices of the American Oil Chemists' Society. United States: AOCS.
Balouiri, M., Sadiki, M. and Ibnsouda, S. K. 2016. Methods for in vitro evaluating antimicrobial activity: a review. Journal of Pharmaceutical Analysis 6(2): 71-79.
Branen, A. L. 1975. Toxicology and biochemistry of butylated hydroxyanisole and butylated hydroxytoluene. Journal of the American Oil Chemists' Society 52(2): 59-63.
Casarotti, S. N. and Jorge, N. 2014. Antioxidant activity of rosemary extract in soybean oil under thermoxidation. Journal of Food Processing and Preservation 38(1): 136-145.
Chammem, N., Saoudi, S., Sifaoui, I., Sifi, S., de Person, M., Abderraba, M. and Hamdi, M. 2015. Improvement of vegetable oils quality in frying conditions by adding rosemary extract. Industrial Crops and Products 74: 592-599.
Cheung, H.-Y., Wong, M. M.-K., Cheung, S.-H., Liang, L. Y., Lam, Y.-W. and Chiu, S.-K. 2012.
Differential actions of chlorhexidine on the cell wall of Bacillus subtilis and Escherichia coli. PLoS One 7(5): article ID e36659.
Choulitoudi, E., Ganiari, S., Tsironi, T., Ntzimani, A., Tsimogiannis, D., Taoukis, P. and Oreopoulou, V. 2017. Edible coating enriched with rosemary extracts to enhance oxidative and microbial stability of smoked eel fillets. Food Packaging and Shelf Life 12: 107-113.
De Abreu, D. P., Losada, P. P., Maroto, J. and Cruz, J. 2010. Evaluation of the effectiveness of a new active packaging film containing natural antioxidants (from barley husks) that retard lipid damage in frozen Atlantic salmon (Salmo salar L.). Food Research International 43(5): 1277-1282.
Dorman, H. J., Peltoketo, A., Hiltunen, R. and Tikkanen, M. J. 2003. Characterisation of the antioxidant properties of de-odourised aqueous extracts from selected Lamiaceae herbs. Food Chemistry 83: 255-262.
Erkan, N., Ayranci, G. and Ayranci, E. 2008. Antioxidant activities of rosemary (Rosmarinus officinalis L.) extract, blackseed (Nigella sativa L.) essential oil, carnosic acid, rosmarinic acid and sesamol. Food Chemistry 110(1): 76-82.
Firman, J. D. 2006. Rendered product in poultry nutrition. In Meeker, D. L. (ed). Essential Rendering - All About the Animal By-Products Industry, p. 125-140. Arlington: National Renderers Association.
Gazwi, H. S. S., Mahmoud, M. E. and Hamed, M. M. 2020. Antimicrobial activity of rosemary leaf extracts and efficacy of ethanol extract against testicular damage caused by 50-Hz electromag-netic field in albino rats. Environmental Science and Pollution Research 27: 15798-15805.
Guo, Q., Guo, S., Sun, Y., Gao, Y., Wang, X. and Zhang, Z. 2016. Antioxidant efficacy of rosemary ethanol extract in palm oil during frying and accelerated storage. Industrial Crops and Products 94: 82-88.
Hussain, A. I., Anwar, F., Chatha, S. A., Jabbar, A., Mahboob, S. and Nigam, P. S. 2010. Rosmarinus officinalis essential oil: antiproliferative, antioxidant and antibacterial activities. Brazilian Journal of Microbiology 41(4): 1070-1078.
Inouye, S., Tsuruoka, T., Uchida, K. and Yamaguchi, H. 2001. Effect of sealing and Tween 80 on the antifungal susceptibility testing of essential oils. Microbiology and Immunology 45(3): 201-208.
Issabeagloo, E., Kermanizadeh, P., Taghizadieh, M. and Forughi, R. 2012. Antimicrobial effects of rosemary (Rosmarinus officinalis L.) essential

Badrul, S. and Jaafar, A. H./IFRJ 28(3) : 554 - 565 564
oils against Staphylococcus spp. African Journal of Microbiology Research 6(23): 5039-5042.
Kloy, A., Ahmad, J., Yusuf, U. and Muhammad, M. 2020. Antibacterial properties of rosemary (Rosmarinus officinalis). South Asian Research Journal of Pharmaceutical Sciences 2(1): 4-7.
Kuntom, A., Lin, S. W., Ai, T. Y., Idris, N. A., Yusof, M., Sue, T. T. and Ibrahim, N. A. 2004. MPOB test methods - a compendium of test on palm oil products, palm kernel products, fatty acids, food related products and other. Malaysia: Malaysian Palm Oil Board.
Laguerre, M., Lecomte, J. and Villeneuve, P. 2007. Evaluation of the ability of antioxidants to counteract lipid oxidation: existing methods, new trends and challenges. Progress in Lipid Research 46(5): 244-282.
Lourenço, S. C., Moldão-Martins, M. and Alves, V. D. 2019. Antioxidants of natural plant origins: from sources to food industry applications. Molecules 24(22): article ID 4132.
Luqman, S., Dwivedi, G. R., Darokar, M. P., Kalra, A. and Khanuja, S. P. 2007. Potential of rosemary oil to be used in drug-resistant infections. Alternative Therapy in Health Medicine 13(5): 54-59.
Mahesar, S. A., Kandhro, A. A., Khaskheli, A. R., Talpur, M. Y. and Sherazi, S. T. H. 2014. SB-ATR FTIR spectroscopic monitoring of free fatty acids in commercially available Nigella sativa (kalonji) oil. Journal of Spectroscopy 2014: article ID 510890.
Moreno, S., Scheyer, T., Romano, C. S. and Vojnov, A. A. 2006. Antioxidant and antimicrobial activities of rosemary extracts linked to their polyphenol composition. Free Radical Research 40(2): 223-231.
Nenadis, N., Zafiropoulou, I. and Tsimidou, M. 2013. Commonly used food antioxidants: a comparative study in dispersed systems. Food Chemistry 82: 403-407.
Nieto, G., Ros, G. and Castillo, J. 2018. Antioxidant and antimicrobial properties of rosemary (Rosmarinus officinalis L.): a review. Medicines 5(3): article no. 98.
O’Keefe, S. F. and Pike, O. A. 2010. Fat characterization. In Nielsen, S. S. (ed). Food Analysis, p. 239-260. New York: Springer Science and Business Media.
Opinde, H. R. 2012. Antimicrobial activity and qualitative phytochemical composition of crude extracts from medicinal plants against selected enteric bacterial pathogens and Candida albicans. Kenya: University of Kenyatta, MSc.
Thesis.Özcan, M. M. and Arslan, D. 2011. Antioxidant
effect of essential oils of rosemary, clove and cinnamon on hazelnut and poppy oils. Food Chemistry 129(1): 171-174.
Poiana, M. A. 2012. Enhancing oxidative stability of sunflower oil during convective and microwave heating using grape seed extract. International Journal of Molecular Sciences 13(7): 9240-9259.
Rašković, A., Milanović, I., Pavlović, N., Ćebović, T., Vukmirović, S. and Mikov, M. 2014. Antioxidant activity of rosemary (Rosmarinus officinalis L.) essential oil and its hepatoprotec-tive potential. BMC Complementary Alternative Medicine 14: article no. 225.
Rios, J. L., Recio, M. C. and Villar, A. 1988. Screening methods for natural products with antimicrobial activity: a review of the literature. Journal of Ethnopharmacology 23(2-3): 127-149.
Rozman, T. and Jersek, B. 2009. Antimicrobial activity of rosemary extracts (Rosmarinus officinalis L.) against different species of Listeria. Acta Agriculturae Slovenica 93(1): 51-58.
Santos-Sanchez, N. F., Salas-Coronado, R., Villanueva-Canongo, V. and Hernandez-Carlos, B. 2019. Antioxidant compounds and their antioxidant mechanism. In Shalaby, E. (ed). Antioxidants. London: IntechOpen.
Smith-Palmer, A., Stewart, J. and Fyfe, L. 1998. Antimicrobial properties of plant essential oils and essences against five important food-borne pathogens. Letter in Applied Microbiology 26(2): 118-122.
Srinivasan, J. R. and Kawamura, Y. 2016. Rosemary extract. In 82nd JECFA - Chemical and Technical Assessment (CTA). Rome: Food and Agriculture Organization of the United Nations (FAO).
Stojiljkovic, J. Trajchev, M. and Nakov, D. 2018. Antibacterial activities of rosemary essential oils and their components against pathogenic bacteria. Advance in Cytology and Phytology 3(4): 93-96.
Tendencia, E. A. 2004. Disk diffusion method. In Laboratory Manual of Standardized Methods for Antimicrobial Sensitivity Tests for Bacteria Isolated from Aquatic Animals and Environment, p. 13-29. Thailand: Southeast Asian Fisheries Development Center.
Yang, Y., Song, X., Sui, X., Qi, B., Wang, Z., Li, Y. and Jiang, L. 2016. Rosemary extract can be used as a synthetic antioxidant to improve vegetable

Badrul, S. and Jaafar, A. H./IFRJ 28(3) : 554 - 565565
oil oxidative stability. Industrial Crops and Products 80: 141-147.