potential of using high resolution satellite … · potential of using high resolution satellite...
TRANSCRIPT
Journal of Engineering Sciences, Assiut University, Vol. 39, No 3, pp.513 -528, May 2011
513
POTENTIAL OF USING HIGH RESOLUTION SATELLITE IMAGES FOR MAPPING APPLICATIONS
A. M. Abdelwahed1, F. A. Farrag1, A. Abdelhafiz1, and M. A. Besheer2. 1 Civil Engineering Dept., Faculty of Eng., Assiut University, EGYPT 2 Civil Engineering Dept., Faculty of Eng., Aljouf University, KSA
(Received March 26, 2011 Accepted April 26, 2011)
Cities and villages in Egypt are subjected to rapid growth. Growth can be beneficial economically, but it also has significant effects on the environment, and if it is left unchecked can have negative impacts. Rapid population increase led to replace agriculture land by buildings, roads and highways. The changes are in particularly harmful when urban expansion occurs against surrounding agricultural areas. So the expansion of cities and villages must be monitored. Recent developments in remote sensing enable us to use high resolution satellite images for different purposes. One of the main application fields for remotely sensed data is the large-scale topographic mapping and map revisions, for which it is necessary to detect and extract features from such imagery. The high resolution space images available now from IKONOS and Quick Bird do have a resolution which is partially in competition to aerial images. This paper presents an evaluation of using IKONOS satellite images for large scale mapping purpose. This evaluation has two elements, the first is geometric potential and the second is the information contents. The results of this study show that correcting IKONOS imagery using one or two Ground Control Points (GCPs) gives about 1.6m horizontal accuracy, higher accuracy can be obtained using more GCPs. The feature extraction is performed by manual on screen digitizing. The results are verified against a 1:25000 topographic map, features such as roads and canals can be extracted with about 70-99% accuracy.
KEYWORDS: Large Scale Mapping, IKONOS, Information Content of Satellite Images.
1. INTRODUCTION
When Space Imaging Corporation (now called Geoeye) successfully launched the IKONOS satellite in 1999, it was the world’s first one-meter commercial remote sensing satellite. Moving over the ground at approximately seven kilometers per second, IKONOS collects black-and white and multispectral data at a rate of over 2,000 square kilometers per minute. IKONOS satellite imagery provides access to any location on the Earth’s surface through the journeys it makes around the globe. One of the main applications of IKONOS imagery is to collect vital statistics about the Earth’s ever-changing features from fluctuations in land and water resources to the build-out of new urban areas. Applications of IKONOS images range from national security and
A. M. Abdelwahed, F. A. Farrag, A. Abdelhafiz, … 514
disaster assessment to urban planning and agricultural monitoring [Philip Cheng et al, 2008]. The main objective of this study is to evaluate the possibility of using IKONOS satellite imagery for large scale mapping.
2. METHODOLOGY
In order to achieve the objective of this study, the following steps were performed and their results are evaluated.
• Correct the image geometrically using the Rational Polynomial Coefficients (RPC) model. Then, improve the planimetric accuracy using polynomial models.
• Merge panchromatic image with multispectral image using three different merging techniques and evaluate which technique gives best visual improvement.
• Extract map feature using manual on-screen digitizing. • Evaluate the obtained results by comparing it with a 1:25000 map.
3. STUDY AREA AND USED DATA.
3.1 Study Area:
The selected site covers "Assuit" city and its surrounding area. The area of interest for this study consists of various land covers such as road networks, agricultural land, sand, bare soil, grass, residential areas, and water bodies. The main water body appears in the image is River Nile, many other water bodies can be found such as canals and drains.
3.2 IKONOS Satellite Data:
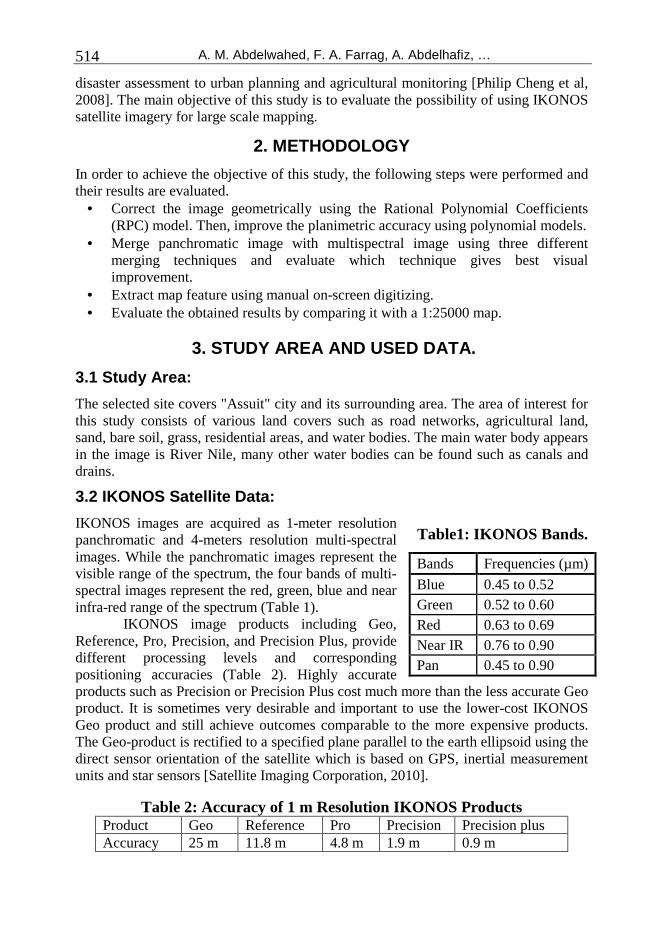
IKONOS images are acquired as 1-meter resolution panchromatic and 4-meters resolution multi-spectral images. While the panchromatic images represent the visible range of the spectrum, the four bands of multi-spectral images represent the red, green, blue and near infra-red range of the spectrum (Table 1).
IKONOS image products including Geo, Reference, Pro, Precision, and Precision Plus, provide different processing levels and corresponding positioning accuracies (Table 2). Highly accurate products such as Precision or Precision Plus cost much more than the less accurate Geo product. It is sometimes very desirable and important to use the lower-cost IKONOS Geo product and still achieve outcomes comparable to the more expensive products. The Geo-product is rectified to a specified plane parallel to the earth ellipsoid using the direct sensor orientation of the satellite which is based on GPS, inertial measurement units and star sensors [Satellite Imaging Corporation, 2010].
Table 2: Accuracy of 1 m Resolution IKONOS Products Product Geo Reference Pro Precision Precision plus Accuracy 25 m 11.8 m 4.8 m 1.9 m 0.9 m
Table1: IKONOS Bands.
Bands Frequencies (µm)
Blue 0.45 to 0.52 Green 0.52 to 0.60 Red 0.63 to 0.69 Near IR 0.76 to 0.90 Pan 0.45 to 0.90
POTENTIAL OF USING HIGH RESOLUTION SATELLITE … 515
3.3 Used Data:
High spatial resolution image obtained by the IKONOS-2 satellite of Geoeye was selected for this study. This image was ordered as Geo-product, the 11 bit raw multispectral and panchromatic satellite scene of Assuit area was acquired on February 17, 2006 at 08:59 GMT with a Nominal Collection Azimuth of 315.7160 degrees, and a Nominal Collection Elevation of 61.15005 degrees. The scene have an image dimension of 6900 by 13000 pixels.
A 25 well known and well distributed control points were selected all over the study area. The coordinates of these points obtained by using Promark3 differential GPS system, and the data from rover and base units were processed using GNSS software.
3.4 Reference Map.
A 1:25000 reference map covers the study area used to verify the results, this map was produced by the military surveying department in 2006. This map was scanned and geometrically corrected using its corners as GCP to be used as a softcopy map.
4. GEOMETRIC CORRECTION OF IKONOS IMAGE.
In order to leverage the IKONOS images for mapping applications, it is necessary to correct the images geometrically. Two methods can be used: the rigorous method and the Rational Polynomial Coefficient (RPC) method. Using rigorous method is limited by availability of sensor and orbit parameters. Instead of using rigorous method, GeoEye Corporation relies on using an empirical-statistical model called Rational Polynomial Coefficient [Büyüksalih, G. et al. 2004].
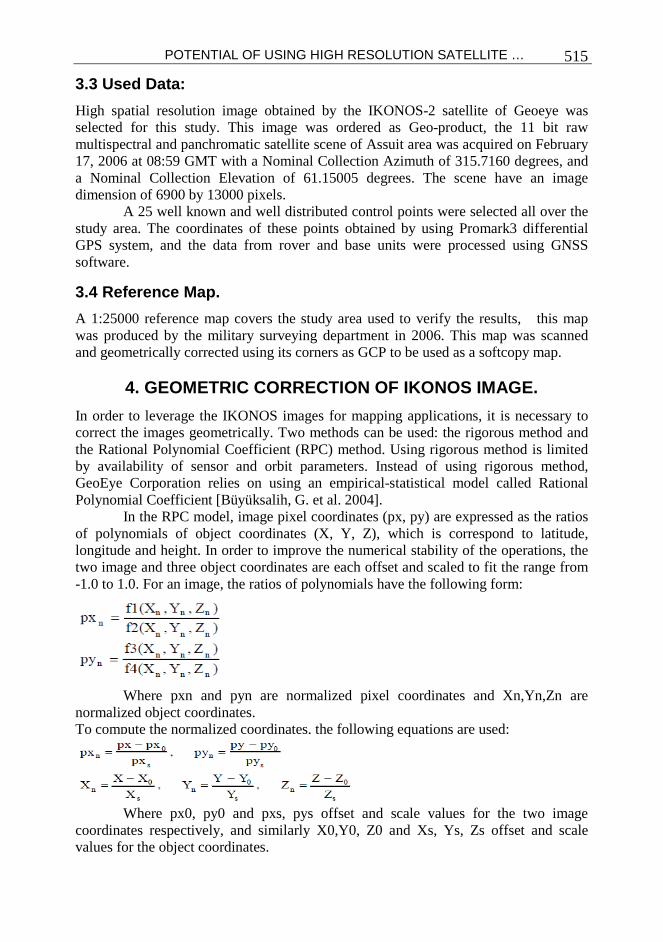
In the RPC model, image pixel coordinates (px, py) are expressed as the ratios of polynomials of object coordinates (X, Y, Z), which is correspond to latitude, longitude and height. In order to improve the numerical stability of the operations, the two image and three object coordinates are each offset and scaled to fit the range from -1.0 to 1.0. For an image, the ratios of polynomials have the following form:
Where pxn and pyn are normalized pixel coordinates and Xn,Yn,Zn are
normalized object coordinates. To compute the normalized coordinates, the following equations are used:
Where px0, py0 and pxs, pys offset and scale values for the two image coordinates respectively, and similarly X0,Y0, Z0 and Xs, Ys, Zs offset and scale values for the object coordinates.
A. M. Abdelwahed, F. A. Farrag, A. Abdelhafiz, … 516
In the RPCs, the maximum power of each object coordinate and the total power of all object coordinates are limited to 3. In such a case and following the SI definition of coefficient sequence, each polynomial has the following form (for convenience, the subscripts are omitted), which leads to the 80 RPCs per IKONOS image:
f (X,Y,Z)=c1+c2Y+c3X+c4Z+c5XY+c6YZ+c7XZ+c8Y2+c9X
2+c10Z2+c12Y
3+c11ZYX+
c13 X2Y+c14Z
2Y+c15Y2X+c16X
3+c17XZ2+c18ZY2+c19ZX2+c20Z3
With RPCs, the first coefficient of the denominator is 1, to avoid the case when the denominator becomes close to zero [Emmanuel Baltsavias et al, 2001].
4.1 Accuracy Improvement
For the Geo-products, the internal standards state that 90% of the check points must fall with 15- 25 meters of the true location on the image. This value depends on terrain characteristics. This is commonly referred to as CE90 [Glenn Reese, 2005].
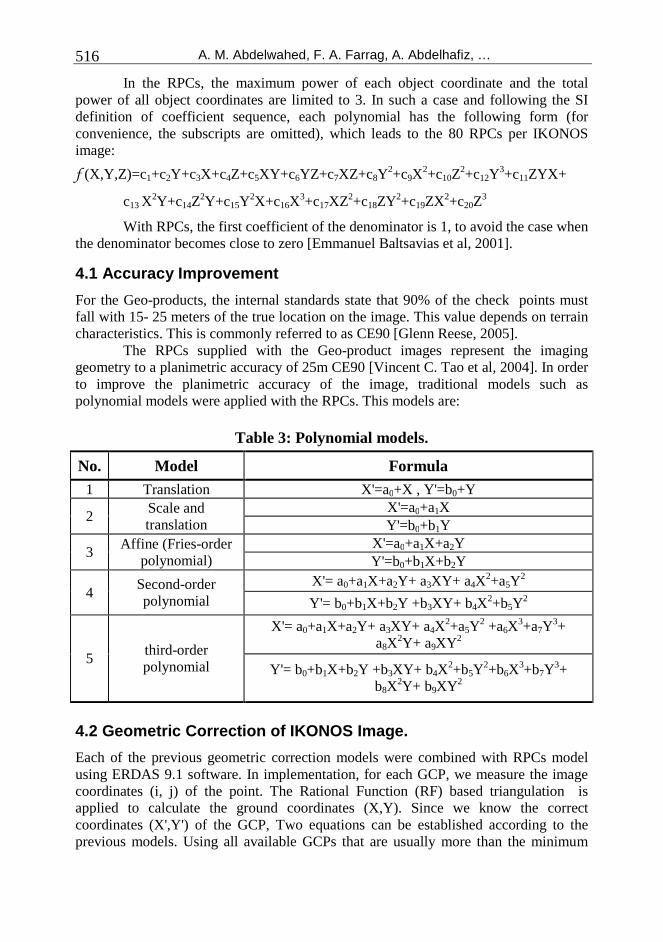
The RPCs supplied with the Geo-product images represent the imaging geometry to a planimetric accuracy of 25m CE90 [Vincent C. Tao et al, 2004]. In order to improve the planimetric accuracy of the image, traditional models such as polynomial models were applied with the RPCs. This models are:
Table 3: Polynomial models.
No. Model Formula 1 Translation X'=a0+X , Y'=b0+Y
2 Scale and translation
X'=a0+a1X Y'=b0+b1Y
3 Affine (Fries-order
polynomial) X'=a0+a1X+a2Y Y'=b0+b1X+b2Y
4 Second-order polynomial
X'= a0+a1X+a2Y+ a3XY+ a4X2+a5Y
2
Y'= b0+b1X+b2Y +b3XY+ b4X2+b5Y
2
5 third-order polynomial
X'= a0+a1X+a2Y+ a3XY+ a4X2+a5Y
2 +a6X3+a7Y
3+ a8X
2Y+ a9XY 2
Y'= b0+b1X+b2Y +b3XY+ b4X2+b5Y
2+b6X3+b7Y
3+ b8X
2Y+ b9XY 2
4.2 Geometric Correction of IKONOS Image.
Each of the previous geometric correction models were combined with RPCs model using ERDAS 9.1 software. In implementation, for each GCP, we measure the image coordinates (i, j) of the point. The Rational Function (RF) based triangulation is applied to calculate the ground coordinates (X,Y). Since we know the correct coordinates (X',Y') of the GCP, Two equations can be established according to the previous models. Using all available GCPs that are usually more than the minimum
POTENTIAL OF USING HIGH RESOLUTION SATELLITE … 517
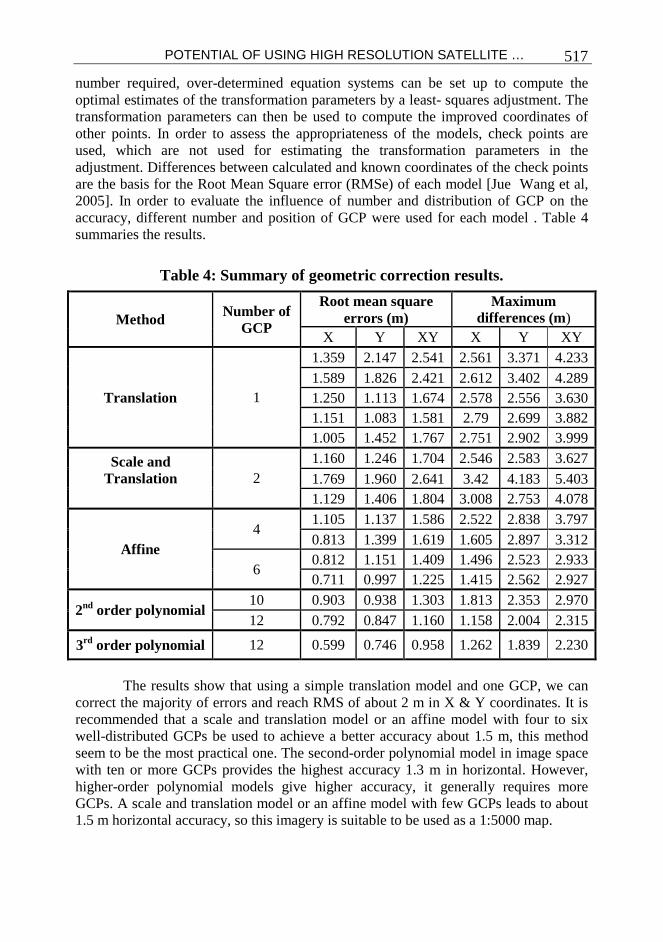
number required, over-determined equation systems can be set up to compute the optimal estimates of the transformation parameters by a least- squares adjustment. The transformation parameters can then be used to compute the improved coordinates of other points. In order to assess the appropriateness of the models, check points are used, which are not used for estimating the transformation parameters in the adjustment. Differences between calculated and known coordinates of the check points are the basis for the Root Mean Square error (RMSe) of each model [Jue Wang et al, 2005]. In order to evaluate the influence of number and distribution of GCP on the accuracy, different number and position of GCP were used for each model . Table 4 summaries the results.
Table 4: Summary of geometric correction results.
Method Number of GCP
Root mean square errors (m)
Maximum differences (m)
X Y XY X Y XY
Translation 1
1.359 2.147 2.541 2.561 3.371 4.233 1.589 1.826 2.421 2.612 3.402 4.289 1.250 1.113 1.674 2.578 2.556 3.630 1.151 1.083 1.581 2.79 2.699 3.882 1.005 1.452 1.767 2.751 2.902 3.999
Scale and Translation
2
1.160 1.246 1.704 2.546 2.583 3.627
1.769 1.960 2.641 3.42 4.183 5.403 1.129 1.406 1.804 3.008 2.753 4.078
Affine 4
1.105 1.137 1.586 2.522 2.838 3.797 0.813 1.399 1.619 1.605 2.897 3.312
6 0.812 1.151 1.409 1.496 2.523 2.933 0.711 0.997 1.225 1.415 2.562 2.927
2nd order polynomial 10 0.903 0.938 1.303 1.813 2.353 2.970 12 0.792 0.847 1.160 1.158 2.004 2.315
3rd order polynomial 12 0.599 0.746 0.958 1.262 1.839 2.230
The results show that using a simple translation model and one GCP, we can
correct the majority of errors and reach RMS of about 2 m in X & Y coordinates. It is recommended that a scale and translation model or an affine model with four to six well-distributed GCPs be used to achieve a better accuracy about 1.5 m, this method seem to be the most practical one. The second-order polynomial model in image space with ten or more GCPs provides the highest accuracy 1.3 m in horizontal. However, higher-order polynomial models give higher accuracy, it generally requires more GCPs. A scale and translation model or an affine model with few GCPs leads to about 1.5 m horizontal accuracy, so this imagery is suitable to be used as a 1:5000 map.
A. M. Abdelwahed, F. A. Farrag, A. Abdelhafiz, … 518
5. INFORMATION CONTENT
Information contents will be increased as and when the spatial and spectral resolution of the satellite improves [Radhadevi P.V. et al, 2004]. To improve the visual quality, image pan-sharpening technique was used. The merge of low-resolution multispectral and high-resolution panchromatic satellite images is an important issue for remote sensing and mapping applications [Pohl and Van Genderen 1998].
Pohl and Van Genderen provided a comprehensive review of image merging techniques. they categorize the image merging into two groups: color related and statistical/numerical techniques. Statistical/numerical techniques can also be separated into individual groups as statistical and numerical techniques [Mitchell H.B., 2010]. For this study three different techniques were used, this techniques are:
1) Intensity Hue Saturation (HIS) Technique
The IHS colour transform can effectively separate a standard RGB (Red, Green, Blue) image into spatial (I) and spectral (H, S) information. The most important steps are: (1) transform a colour image composite from the RGB space into the IHS space. (2) replace the I (intensity) component by a panchromatic image with a higher
resolution. (3) reversely transform the replaced components from IHS space back to the original
RGB space to obtain a merged image. The IHS technique has become a standard procedure in image merging.
2) Principal Component Analysis (PCA) Technique
The PCA is a statistical technique that transforms a multivariate inter-correlated data set into a new un-correlated data set. Its most important steps are: (1) Perform a principal component transformation to convert a set of multispectral
bands (three or more bands) into a set of principal components. (2) Replace one principal component, usually the first component, by a high resolution
panchromatic image. (3) Perform a reverse principal component transformation to convert the replaced
components back to the original image space. A set of merged multispectral bands is produced after the reverse transform.
3) Arithmetic Combination Technique.
Different arithmetic combinations have been employed for merging multispectral and panchromatic images. The arithmetic operations of multiplication, division, addition and subtraction have been combined in different ways to achieve a better merging effect. Brovey Transform, SVR (Synthetic Variable Ratio), and RE (Ratio Enhancement) techniques are some successful examples for SPOT pan merging. Brovey Transform uses addition, division and multiplication for the merg of three multispectral bands [Erdas imaging 9.1 field guides, 2008]. Its basic processing steps are:
(1) Add three multispectral bands together for a sum image. (2) Divide each multispectral band by the sum image. (3) Multiply each quotient by a high resolution pan. The SVR and RE techniques
are similar, but involved more sophisticated calculations for the sum image.
POTENTIAL OF USING HIGH RESOLUTION SATELLITE … 519
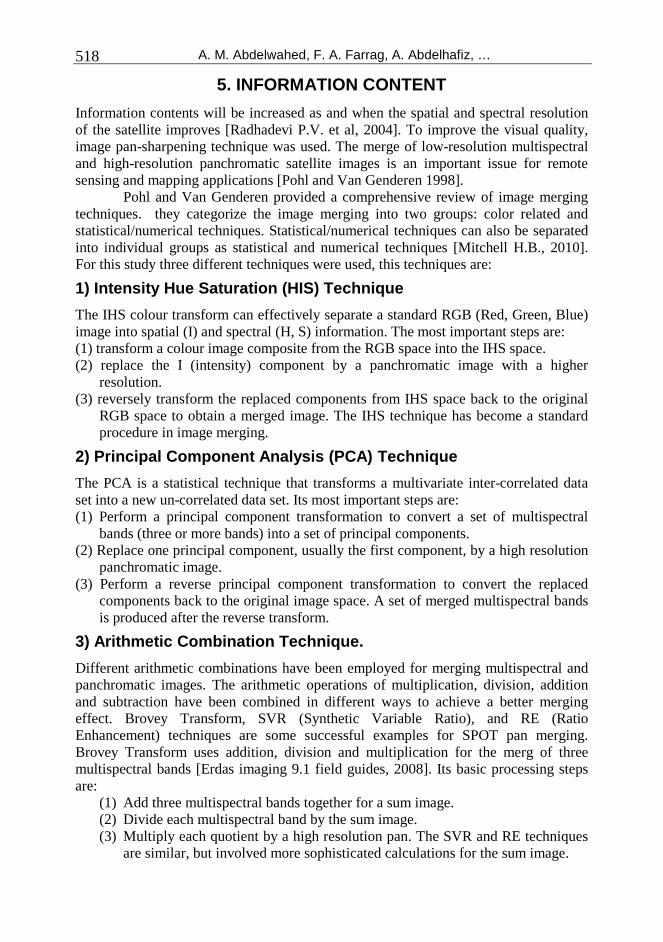
Principle Component Analysis and Intensity-Hue-Saturation methods are categorized as statistical method. On the other hand, Brovey method is categorized as an arithmetic combination. The merging process can be evaluated in terms of spatial and spectral quality, respectively. The assessment of spatial quality can be evaluated by comparing the panchromatic image and the merged image to see whether the structures of the objects in panchromatic image are injected into the multi-spectral images, the assessment of spectral quality can be checked by comparing the merged image with the original multi-spectral image to see whether the radiometry of the two images is as identical as possible. But for the time being, there are no effective ways to evaluate the merging result both qualitatively and quantitatively. Visual inspection is still the most common method to evaluate the merging result qualitatively. In additional, several quantitative indexes such as mean, median, standard deviation, correlation coefficient, etc., can be also used to assess the merging result quantitatively [Wang Zhijun et al, 2004]. In this paper, we used visual inspection to evaluate the merging results qualitatively and use statistical parameters mean, median, standard deviation, and correlation coefficient to evaluate the degree of similarity between the original images and the merged images. Figure 1 and table 5 show the evaluation results.
a. Part of the original panchromatic image b. Part of the original multispectral image
c. Merged image using HIS technique d. Merged image using PCA technique
A. M. Abdelwahed, F. A. Farrag, A. Abdelhafiz, … 520
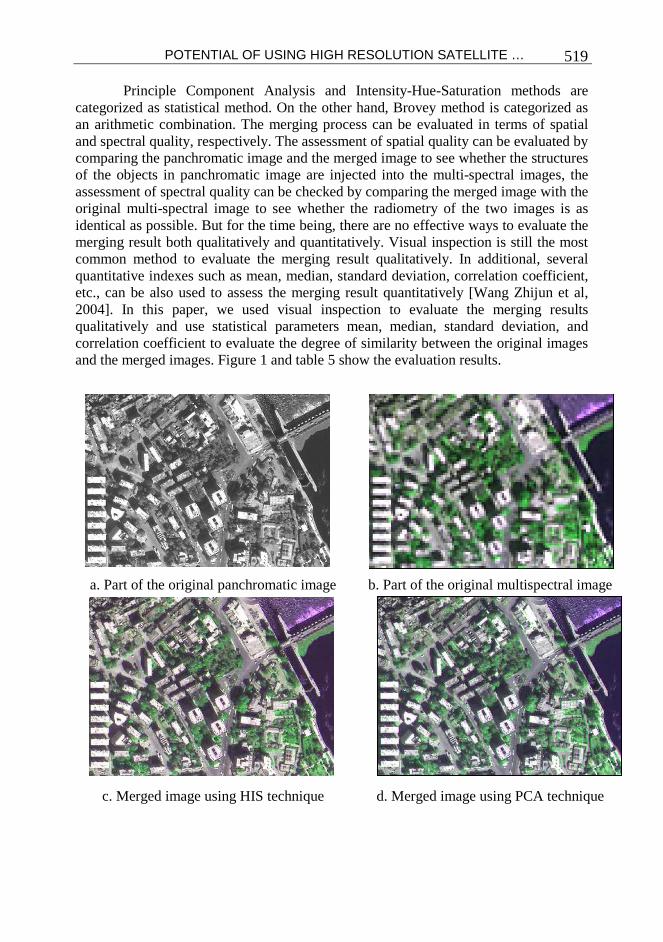
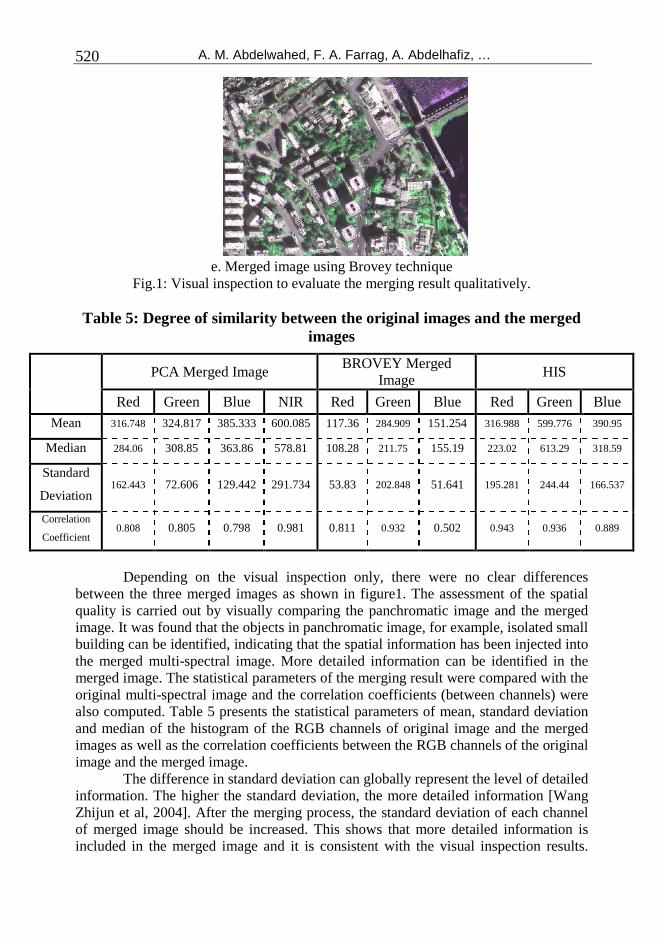
e. Merged image using Brovey technique Fig.1: Visual inspection to evaluate the merging result qualitatively.
Table 5: Degree of similarity between the original images and the merged
images
PCA Merged Image BROVEY Merged
Image HIS
Red Green Blue NIR Red Green Blue Red Green Blue
Mean 316.748 324.817 385.333 600.085 117.36 284.909 151.254 316.988 599.776 390.95
Median 284.06 308.85 363.86 578.81 108.28 211.75 155.19 223.02 613.29 318.59
Standard
Deviation 162.443 72.606 129.442 291.734 53.83 202.848 51.641 195.281 244.44 166.537
Correlation
Coefficient 0.808 0.805 0.798 0.981 0.811 0.932 0.502 0.943 0.936 0.889
Depending on the visual inspection only, there were no clear differences
between the three merged images as shown in figure1. The assessment of the spatial quality is carried out by visually comparing the panchromatic image and the merged image. It was found that the objects in panchromatic image, for example, isolated small building can be identified, indicating that the spatial information has been injected into the merged multi-spectral image. More detailed information can be identified in the merged image. The statistical parameters of the merging result were compared with the original multi-spectral image and the correlation coefficients (between channels) were also computed. Table 5 presents the statistical parameters of mean, standard deviation and median of the histogram of the RGB channels of original image and the merged images as well as the correlation coefficients between the RGB channels of the original image and the merged image.
The difference in standard deviation can globally represent the level of detailed information. The higher the standard deviation, the more detailed information [Wang Zhijun et al, 2004]. After the merging process, the standard deviation of each channel of merged image should be increased. This shows that more detailed information is included in the merged image and it is consistent with the visual inspection results.
POTENTIAL OF USING HIGH RESOLUTION SATELLITE … 521
Since the correlation coefficient represents the degree of similarity, the value of the correlation coefficient is desirable to be as higher as possible, but it cannot reach to 1 which means that the merged image is the same with the original multi-spectral image and no spatial information from panchromatic image is added to the merged image.
5.1 Evaluation of the Information Content.
In order to evaluate information content of the remotely-sensed image, two different methods were applied. 1) Using the National Imagery Interpretability Rating Scale (NIIRS), and 2) Using on-screen digitizing method.
1) National Imagery Interpretability Rating Scale (NIIRS)
U.S. Government and Contractor team created the NIIRS. The NIIRS Scale is a scale used for rating imagery acquired from various imaging systems. The NIIRS originated in the Intelligence Community and is the standard used by imagery analysts, collection managers, imagery scientists, and sensor designers [IRARS, 1996]. The concept underlying the NIIRS is that imagery analysts should be able to perform more demanding interpretation tasks as the quality or interpretability of the imagery increases. The NIIRS consists of 10 graduated levels (0 to 9), with several interpretation tasks or criteria forming each level. These criteria indicate the amount of information that can be extracted from an image at a given interpretability level. For example, analysts should be able to count railroad tracks in a NIIRS 4 image and be able to identify the type of rail car (flat car, box car, etc.) and engine (diesel, steam, etc.) in a NIIRS 5 image [Gene Dial et al, 2003].
To assign a NIIRS rating to an image, imagery analysts are asked to judge which tasks they can accomplish and which features they can see in the imagery. In making such judgments, the imagery analyst takes into account scene content and image acquisition conditions. Obviously, not every image contains the specific items mentioned in the criteria. When features referenced in the criteria are not present, the analyst must imagine these objects are present and make an educated guess as to which criteria can and cannot be accomplished on the image. In other words, the imagery analyst rates interpretability by judging what tasks could be accomplished or what features could be seen on an image of that quality, as if the information needed to do the tasks or the features included in the scale were present in the image. In this way, the imagery analyst is in fact judging the information potential of the image, rather than making judgments about what was or was not actually imaged. The 10 graduated levels of NIIRS are illustrated in details at Imagery Resolution Assessments and Reporting Standards (IRARS) and Civil National Image Interpretability Rating Scale (NIIRS) Reference Guide (http://www.fas.org/irp/imint/niirs_c/index.html).
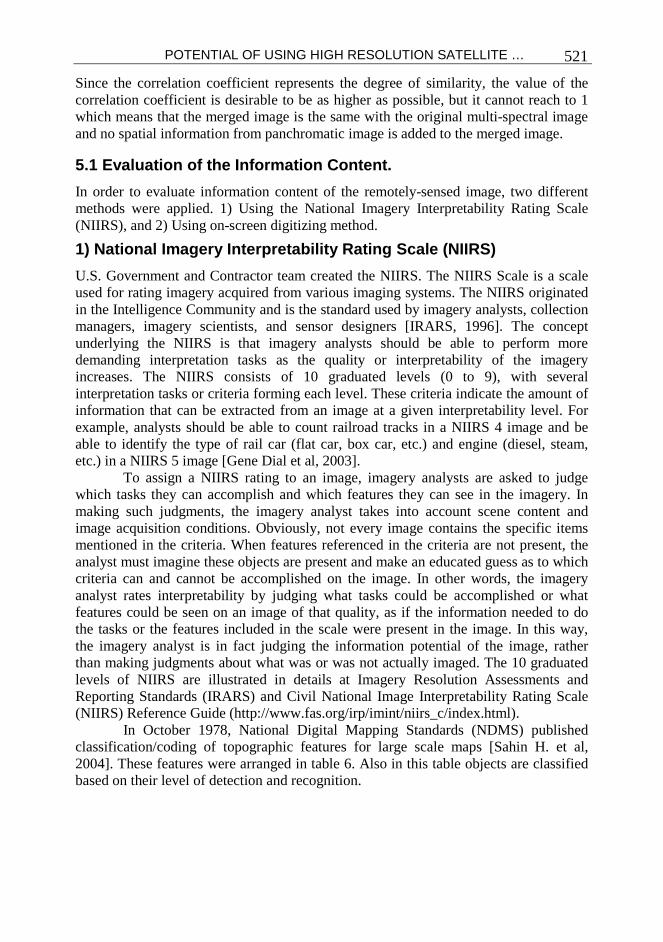
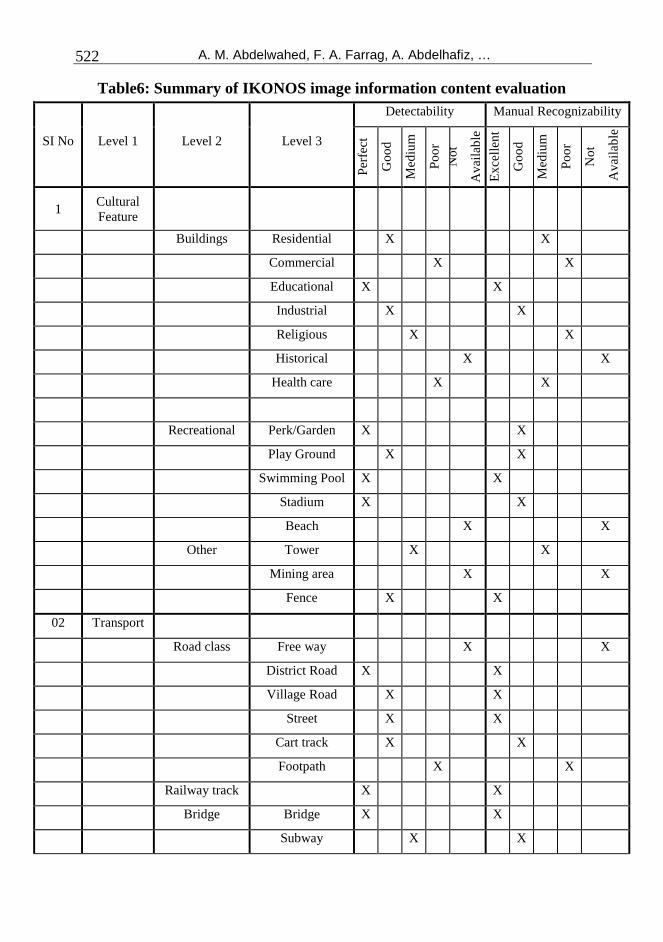
In October 1978, National Digital Mapping Standards (NDMS) published classification/coding of topographic features for large scale maps [Sahin H. et al, 2004]. These features were arranged in table 6. Also in this table objects are classified based on their level of detection and recognition.
A. M. Abdelwahed, F. A. Farrag, A. Abdelhafiz, … 522
Table6: Summary of IKONOS image information content evaluation
SI No Level 1 Level 2 Level 3
Detectability Manual Recognizability
Per
fect
Go
od
Med
ium
Po
or
No
t
Ava
ilab
le
Exc
elle
nt
Go
od
Med
ium
Po
or
No
t
Ava
ilab
le
1 Cultural Feature
Buildings Residential X X
Commercial X X
Educational X X
Industrial X X
Religious X X
Historical X X
Health care X X
Recreational Perk/Garden X X
Play Ground X X
Swimming Pool X X
Stadium X X
Beach X X
Other Tower X X
Mining area X X
Fence X X
02 Transport
Road class Free way X X
District Road X X
Village Road X X
Street X X
Cart track X X
Footpath X X
Railway track X X
Bridge Bridge X X
Subway X X
POTENTIAL OF USING HIGH RESOLUTION SATELLITE … 523
Transport
Terminal
Railway
Station X X
Airport X X
Harbor/Port X X
Others Parking area X X
Traffic island X X
03 Vegetation
Agricultural
Land X X
Tree Single X X
Grove X X
Hedge X X
04 Wasteland
Wasteland Barren X X
Rocky X X
Sandy X X
Sand dunes X X
05 Hydrograph
Water body River X X
Stream X X
Lake X X
Tank X X
Drain X X
Canal X X
Structure Aqueduct X X
Weir X X
Barrage X X
Dam X X
Others Island X X
Coral Reef X X
A. M. Abdelwahed, F. A. Farrag, A. Abdelhafiz, … 524
The previous table demonstrates that IKONOS image could be rated on NIIRS at 4.5, these results is nearly the same results obtained by other researchers as Baldridge, 2002.
2) On-Screen Digitizing.
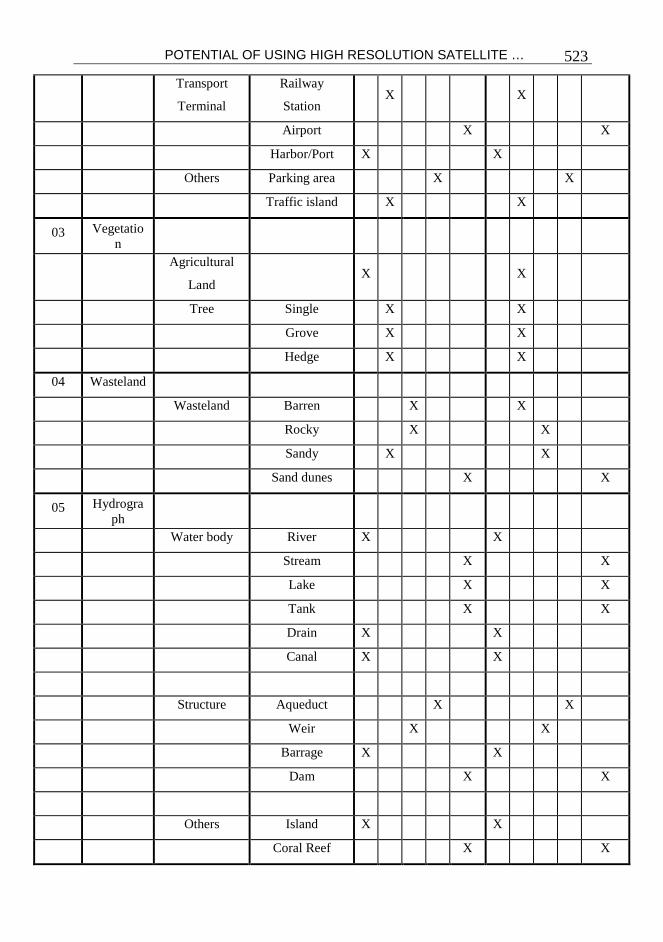
On-screen digitizing of IKONOS image was realized by Erdas imagines 9.1 software package. Obtained vectoral information was compared with on field and 1:25000 scale maps. Some linear objects such as roads, canals and railway have been evaluated quantitatively; the comparison results are shown in table 7.
Table 7: Linear feature in merged image vs. in reference map
Object
Measured Length (m)
In Merged
Image
In Reference
Map
Accuracy
%
Roads
Two Lane
Roads 18324.897 19035.579 96.27
District Roads 7959.146 7972.545 99.83
Village Roads 6095.36 6131.221 99.42
City Street 7818.485 9261.328 84.42
Unpaved Roads 6289.228 8894.824 70.71
Canals
Main Canals 9668.898 9669.222 99.99
Branched
Canals 10441.807 11543.657 90.46
Drains 9706.46 9867.327 98.37
Railway 6435.16 6435.8 99.98
This table clearly shows high possibility of using IKONOS image for feature
extraction. The accuracy of features extraction ranges from 70 to 99% depending on the width and the shape of the object.
Large scale map is not available for the study area, only a map of scale 1:25000 produced by military surveying was available, and it was used to be compared with a manual digitizing for Assuit university compass from the merged image. the results of the digitizing process is shown in Figure 2.a. then we layed over the digitized part on the same part from the map, Figure 2.b. shows the results after overlying process.

POTENTIAL OF USING HIGH RESOLUTION SATELLITE … 525
Figure 2.a: Manual digitizing results of Assiut University.
Figure 2.b: The results after overlaying process.
A. M. Abdelwahed, F. A. Farrag, A. Abdelhafiz, … 526
6. CONCLUSIONS
Based on the above experimental results, one can draw the following conclusions: 1) Large scale maps at a scale of 1:5000 can be produced from IKONOS satellite
images due to high accuracy of geometric correction process, which meet planimetric map accuracy needed.
2) According to the amount of information which can be extracted from IKONOS satellite images, IKONOS images can be rated at 4.5 on NIIRS. This means that IKONOS images have a good quality to be used for large scale mapping.
3) By using a simple translation model and one GCP, it is possible to correct the majority of errors and reach RMS of 2 m in horizontal coordinates accuracy.
4) It is recommended that a scale and translation model or an affine model with four to six well-distributed GCPs be used to achieve an accuracy of about 1.5 m. These methods seem sufficient for 1:5000 mapping.
5) The Third-order polynomial model with twelve GCPs provides the highest accuracy of 0.95 m. However, higher-order polynomial models generally require more GCPs.
6) All merging techniques used (HIS- PCA- Brovey), have shown a good detail increasing. HIS technique has the highest correlation with the original multispectral image, but using PCA technique keeps the number of bands the same before and after merge.
7. REFERENCES
1- Baldridge, B. (2002). "Civil and Commercial Applications Project (CCAP): Evaluation of Imagery Interpretability for IKONOS Pan, MSI, and Pan-sharpened Imagery". Proceedings of the 2002 High Spatial Resolution Commercial Imagery Workshop, March 25 – 27, Reston, VA, USA.
2- Büyüksalih, G., Kocak, M. G., Oruc, M., Akcin, H., Jacobsen, K. "Handling of IKONOS Images from Orientation up to DEM Generation", 2004. Hannover university. URL:
www.ipi.unihannover.de/uploads/tx_tkpublikationen/bueyuek_Ikon.pdf 3- Emmanuel Baltsavias, Maria Pateraki, Li Zhang, 2001. "Radiometric and
Geometric Evaluation of IKONOS Geo Images and Their Use for 3D Building Modeling". ISPRS Workshop “High Resolution Mapping from Space 2001”, Hannover, Germany, 19-21 September.
4- Erdas imaging 9.1 field guides, 2008. volume one, version 9.1 (Erdas), Atlanta, USA.
5- Gene Dial, Howard Bowen, Frank Gerlach, Jacek Grodecki, and Rick Oleszczuk, 2003. "IKONOS Satellite, Imagery, and Products". Remote Sensing of Environment 88, pp. 23–36
6- Glenn Reese, 2005. "IKONOS RPC Viewer Application". ASPRS 2005 Annual Conference, “Geospatial Goes Global: From Your Neighborhood to the Whole Planet” March 7-11, 2005. Baltimore, Maryland.
7- IRARS Imagery Resolution Assessments and Reporting Standards Committee 1996, March. Civil National Image Interpretability Rating Scale (NIIRS) Reference Guide (http://www.fas.org/irp/imint/niirs_c/index.html).
POTENTIAL OF USING HIGH RESOLUTION SATELLITE … 527
8- Jue Wang, Kaichang Di, and Ron Li, 2005. "Evaluation and Improvement of Geopositioning Accuracy of IKONOS Stereo Imagery". Journal of Surveying Engineering, Vol. 131, No. 2, May 1, 2005.
9- Mitchell H.B., 2010. "Image Fusion Theories, Techniques and Applications". Scientific Publishing Services Pvt. Ltd., Chennai, India, 2010 Springer-Verlag Berlin Heidelberg.
10- Philip Cheng, Francisca G ◌َmez, Michaela Weber and Christine Flingelli, 2008. "Mapping of IKONOS Images Using Minimum Ground Controls". Geo informatics magazine, issue 2, 2008. pp 52-55.
11- Pohl, C. and Van Genderen, J.L., 1998. "Multisensor Image Fusion in Remote Sensing: Concepts, Methods and Applications". International Journal of Remote Sensing, Vol.19, pp.823-854.
12- Radhadevi P.V., Nagasubramanian V., Archana Mahapatra, S.S.Solanki, Krishna Sumanth and Geeta Varadan, 2004. "Potential of High-Resolution Indian Remote Sensing Satellite Imagery for Large Scale Mapping".
http://www.isprs.org/proceedings/XXXVIII/1_4_7-W5/paper/Radhadevi-153.pdf accessed June. 18, 2010.
13- Sahin H., Buyuksalih G., Akcin H., Topan H. , Karakis S. , Marangoz A. M. 2004. "Iformation Content Analysis of KVR-1000 Ortho-Image Based on the Available Topographic Maps in the GIS Environment". EARSEL Workshop on Remote Sensing for Developing Countries, Cairo, 2004.
14- Satellite imaging corporation web site,2010. http://www.satimagingcorp.com/satellite-sensors/ikonos.html 15- Vincent C. Tao, HU Y. and Jiang W., 2004. "Photogrammetric exploitation
of IKONOS Imagery for Mapping Applications". International Journal of Remote Sensing, 20 July, 2004, VOL. 25, NO. 14, pp 2833–2853.
16- Wang Zhijun, Djemel Ziou and Costas Armenakis, 2004. "Production of High Resolution Remote Sensing Images for Navigation Information Infrastructures". Geo-spatial information science, Volume 7, number 2, pp. 129-134.
A. M. Abdelwahed, F. A. Farrag, A. Abdelhafiz, … 528
استخدام مرئيات األقمار الصناعية عالية الدقة بغرض رسم الخرائط
إن النمو الذي تشهده معظم المدن والقري فى مصر وتاثيره على الموارد اإلقتصادية وما يمثله من
وفى سبيل تحقيق ذلك تم دراسة . أعباء على موارد البيئة يجعل من الضرورى متابعة هذا النمو عن كثب
م مرئيات األقمار الصناعية عالية الدقة بغرض الحصول على خرائط ذات مقياس رسم إمكانية استخدا
.لهذه الدراسة IKONOSوقد تم إختيار مرئيات القمر الصناعى ، كبير
وتطلب ذلك إجراء عملية تصحيح هندسي للمرئية بعد تجميع إحداثيات أرضية لنقاط تحكم وتحقيق من
الطرق ومآخذ الترع باستخدام نظام تحديد المواقع العالمى باستخدام الطبيعة عند أماكن مميزة كتقاطعات
مع مراعاة أن تغطى هذه النقاط منطقة ) (DGPSوحدتي استقبال احداهما ثابتة واألخرى متحركة
وقد تم التصحيح الهندسى للمرئية بواسطة النموذج الرياضي المعروف باسم . الدراسة بتوزيع شبه منتظم
)RPC (Rational Polynomial Coefficient وتم تحسين النتائج بواسطة معادالت كثيرة الحدود
من الدرجة األولى والثانية والثالثة ومن ثم تم حساب قيمة الخطأ التربيعى المتوسط لإلحداثيات األرضية
رائط ذات لنقاط التحقق وتم التأكد من انه يتوافق مع القيم المسموح بها فى المواصفات الخاصة بإنتاج الخ
ثم تناول البحث تقييم كم المعلومات التى تحتويها مرئية القمر الصناعي . 5000:1مقياس رسم
ثم مقارنة هذه ، والعناصر التي يمكن استخراجها ورسمها كعناصر لخريطة ذات مقياس رسم كبير
ستخراج عناصر مثل الطرق والترع بدقة العناصر مع نظيراتها فى الخريطة وقد اثبتت الدراسة انه يمكن ا
وذلك بالمقارنة بمحتويات خريطة تغطى منطقة الدراسة ذات مقياس رسم % 99-70تتراوح ما بين
25000:1.