potential of battery storage systems to increase the self
TRANSCRIPT
Potential of battery storage systems to increase theself-consumption of photovoltaics in charging of electric vehicles
in residential buildings
Mahmoud Shepero, Reza Fachrizal,Joakim Munkhammar & Joakim Widen
Uppsala university
14 October 2019
1
Aims
• Evaluate the temporal mismatch between load, PV and EV.
• How much can batteries improve this temporal mismatch?
• Compare different sizes of batteries.
2
Aims
• Evaluate the temporal mismatch between load, PV and EV.
• How much can batteries improve this temporal mismatch?
• Compare different sizes of batteries.
2
Aims
• Evaluate the temporal mismatch between load, PV and EV.
• How much can batteries improve this temporal mismatch?
• Compare different sizes of batteries.
2
Data
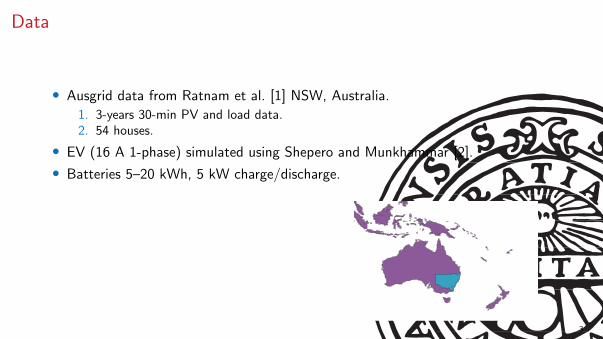
• Ausgrid data from Ratnam et al. [1] NSW, Australia.
1. 3-years 30-min PV and load data.2. 54 houses.
• EV (16 A 1-phase) simulated using Shepero and Munkhammar [2].
• Batteries 5–20 kWh, 5 kW charge/discharge.
3
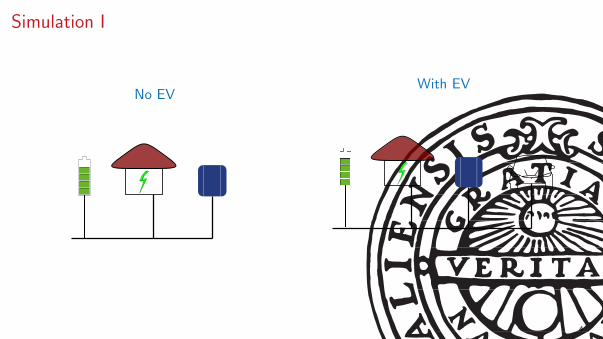
Simulation I
No EVWith EV
4
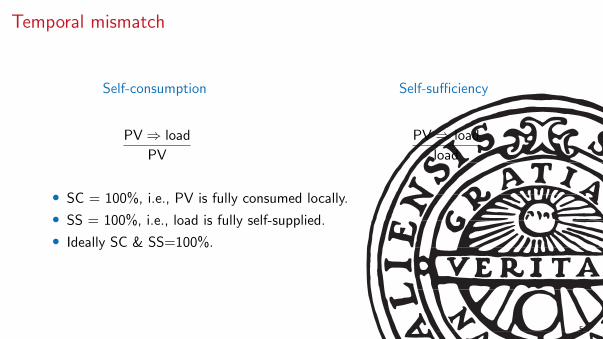
Temporal mismatch
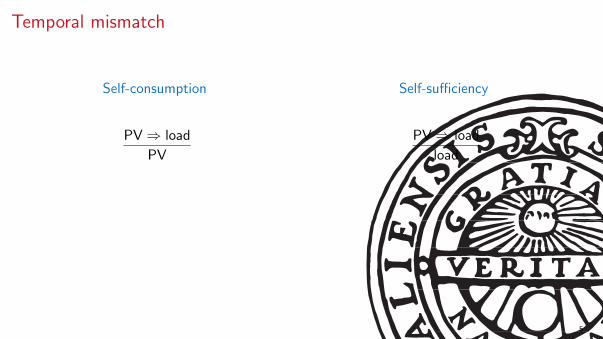
Self-consumption
PV⇒ load
PV
Self-sufficiency
PV⇒ load
load
• SC = 100%, i.e., PV is fully consumed locally.
• SS = 100%, i.e., load is fully self-supplied.
• Ideally SC & SS=100%.
5
Temporal mismatch
Self-consumption
PV⇒ load
PV
Self-sufficiency
PV⇒ load
load
• SC = 100%, i.e., PV is fully consumed locally.
• SS = 100%, i.e., load is fully self-supplied.
• Ideally SC & SS=100%.
5
Temporal mismatch II
Electricity supply from renewable resources is not always availablewhen electricity is needed, and, unlike traditional power sources, notfully adjustable to demand variations. This implies that there is a po-tential diurnal and seasonal mismatch between on-site renewableelectricity supply and power demand in buildings. Although the EPBDincludes recommendations for on-site renewable energy sources [3],the matching issue is generally not considered in definitions of ZEBswhere annual energy balances are commonly used.
A building with a PV system producing the same annual amount ofelectricity that is used in the building will occasionally suffer a shortageof self-produced electricity, especially at night and during winter inlocations at higher latitudes. The amount of surplus electricity from thePV system will at other times be significant, for example during sunny,clear days in summer.
Currently, buildings with on-site electricity production are in mostcases connected to electricity distribution grids. High levels of PV pe-netration may lead to problems in the distribution system in terms of,e.g., too high voltages and overloading of components, and may requireone or several more or less costly options for handling these issues.Therefore, building-level load management and/or possibilities to storeenergy have been addressed to improve load matching and preventthese problems, and several indicators for quantifying mismatch andgrid interaction have been proposed. An overview of load match andgrid interaction indicators can be found in [4]. Two of the most com-monly used load matching indicators are self-sufficiency ( )SS and self-consumption ( )SC [5]. The former is the share of the electricity usedwithin the building that is produced on site, and the latter is the shareof on-site produced electricity that is used within the building. Othernames for self-sufficiency and self-consumption exist, such as solarfraction [6], load and supply cover factor [4,7], on-site energymatching [8], autarky [9] and autonomy [10]. The aggregated elec-tricity exported to or imported from the grid can also be used as ameasure to evaluate the load matching for residential PV systems[11,12].
Other attempts to assess how well on-site supply and demand arematched are described in [13] as Behavior Ratio and in [14,15] as Re-newable energy use. In both of these measures the annual self-con-sumption is multiplied by the annual self-sufficiency. Thus, a valueclose to one requires both a high self-consumption and a high self-sufficiency. However, such a measure for PV production and loadmatching is limited in the sense that it does not take into accountwhether a mismatch mainly occurs in time, or in size. That is, thesemeasures give no information on if the annual PV production surplus,or shortage, is mainly due to the general level of the load, or due towhen the load occurs. The consequence of this is that a PV system thatis over-sized in relation to its local load could be considered equallymismatched to a well-sized PV system where the general levels of thevariable production and variable load are similar but the matching intime is poor.
There are also examples of other analysis methodologies that aim toextend self-sufficiency and self-consumption. In [8] a number ofmatching indices are presented. These indices take different energycarriers, as well as assumptions on primary energy and emissions ofCO2-equivalents, into account. This methodology does not provide astraightforward assessment of the matching between on-site energysupply and energy use, but rather provides a set of indices that can beused to evaluate all, or parts of, the energy flows in a complex energysystem with different energy carriers, using the traditional definitionsof self-sufficiency and self-consumption.
The aim of this paper is to introduce a conceptual innovation tographically visualize the matching of the PV production and demand inbuildings. Based on a compilation of PV system case studies in pub-lished research, the method is used to assess the general potential toimprove supply and load matching by using load shifting or batteries.Furthermore, the method is employed to investigate the potential forPV and battery systems to help buildings reach the coming Swedish
nZEB requirements. The graphical method is used to visualize thematching – both in size and in time – to evaluate the role of PV andbattery systems in the proposed nZEB regulations.
The outline of the paper is as follows: In Section 2, the novel gra-phical approach to examine and compare the matching between elec-tricity production and building is presented. This is used to analyze theresults of previous studies on detached houses with on-site PV elec-tricity production in Section 3. In Section 4, the graphical approach isused to visualize and analyze the PV-load matching in the coming nZEBlegislation. This is followed by a discussion in Section 5 and conclusionsin Section 6.
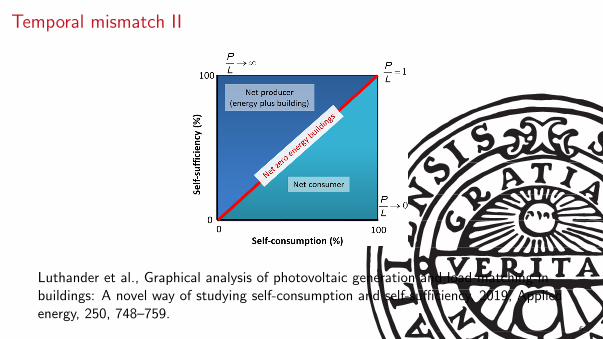
2. The energy matching chart
This section presents a graphical visualization of self-consumptionand self-sufficiency in buildings with on-site PV electricity generation inan “Energy matching chart”. Fig. 1 shows the principles of the chartwith the self-consumption (φSC) on the horizontal axis and the self-sufficiency (φSS) on the vertical axis. The matching of a system isthereby characterized with respect to the supply, i.e., the self-con-sumption, and with respect to the load, i.e., the self-sufficiency. Self-consumption, self-sufficiency, PV electricity production (P) and load (L)relates to each other according to
PL
.ss
sc=Perfect matching is achieved in the top right corner, where both the
self-consumption and self-sufficiency is 100%. Poor matching in timegives a result in the lower left corner, with both low self-consumptionand low self-sufficiency. Net zero energy buildings, which produce asmuch electricity as they consume on an annual basis, will be on thediagonal red line where φSC=φSS and thus P/L=1. This means thatnet producers of electricity (+ZEB) that have a higher annual elec-tricity production than load will be found above the red line, where theself-sufficiency is higher than the self-consumption and P/L > 1.Annual net consumers of electricity where the annual electric load ex-ceeds the PV production (i.e., P/L < 1) are found below the red line.The position in relation to the net-zero diagonal is an important featureof the chart as it provides information on the matching both in size andin time.
Another important feature of the chart is that the P/L relationshipdoes not change when measures are taken to improve the matchingwithout significantly changing the size of the PV system or the size ofthe annual load. Such measures can thus not move a system across the
Fig. 1. The principals of the Energy matching chart visualizing the matching intime and size.
R. Luthander, et al. $SSOLHG(QHUJ\²
Luthander et al., Graphical analysis of photovoltaic generation and load matching inbuildings: A novel way of studying self-consumption and self-sufficiency, 2019, Appliedenergy, 250, 748–759.
6
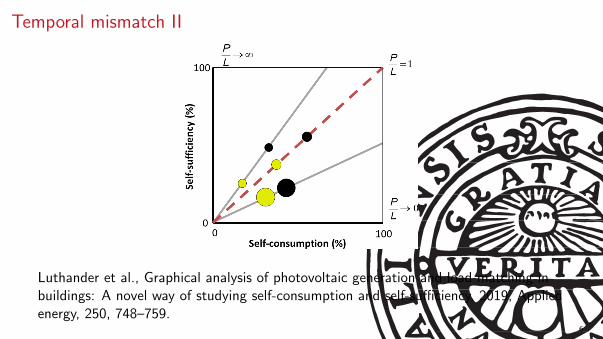
Temporal mismatch II
found in the lower left corner of the chart. The largest system in termsof load is below the dashed red line and is thus a net-consuming systemwith a P/L ratio of 0.52. The matching of the systems are all improvedfrom the measures taken. For the system with the largest load, i.e.,largest bubbles, the least increase in matching is seen.
3. Application of the energy matching chart to previous research
A review of PV self-consumption from 2015, highlighted that thenumber of papers in the field of residential PV self-consumption waslimited [5]. This has, however, changed and since 2015 much newresearch has been published. Studies on PV self-sufficiency and self-consumption were collected and compiled in order to investigate thegeneral matching between PV electricity production and buildingelectricity load, as well as the impact of battery installations and DSMon the matching. The studies (summarized in Table 1) were thereafterpresented in Energy matching charts to be analyzed (Figs. 4 and 5).Table 1 is ordered alphabetically by the country codes for the studiedPV systems. The simulations or measurements are performed for oneyear for of all included systems. A few studies include more than onehouse or PV system size, and each combination of household load andPV electricity generation is then included in the analysis. Studies whereneither self-sufficiency nor self-consumption were specified were ex-cluded from the analysis. Studies that featured self-consumption and/orself-sufficiency with battery storage and DSM are presented inAppendix A and Appendix B, respectively.
Self-consumption, self-sufficiency or other energy performancemeasures such as grid interaction were the main objective in 14 of thestudies listed in Table 1. It was, however, more common (22 studies) touse these measures as tools for economic assessments.
The results from the studies presented in Table 1, Appendix A, andAppendix B are visualized in Fig. 4 using the Energy matching chart. Inthe chart, the size of the bubble is proportional to the annual electricload L. The yellow bubbles represent systems with only PV productionand load. The red bubbles represent systems with PV and battery sto-rage. The black bubbles represent systems with PV and a load influ-enced by DSM.
When focusing on systems with only PV production and load(yellow bubbles), Fig. 4 indicates that systems with a relatively largeload can have quite large self-consumption (up to 60–70%) but do nothave self-sufficiencies above 30%. Systems with small loads generallyhave self-consumption levels of less than 40%. This follows the ex-pectation that houses on average consume more of the PV electricity ifthe overall load is high. Many of these large-load systems are also, as
expected, net-consumers. This could be explained by that larger loadsindicate smaller available roof area for PV installations due to largerbuildings and possibly with several stories. However, some large-loadsystems are found close to the net-zero diagonal. The matching isgenerally low between PV electricity production and electric load whenno batteries or DSM is used.
The effects on the matching from introducing batteries (red bubbles)seem to exceed the effects from DSM (black bubbles) in Fig. 4. Batteries,however, mainly seems to be added to systems with relatively smallloads, while DSM is more frequently implemented in large-load sys-tems.
The effects of batteries and DSM on the matching are further shownin Fig. 5. The diagrams to the left show Energy matching charts forsystems with batteries (top) and systems with DSM (bottom) separately.To illustrate how the storage capacities affect the systems, the size ofthe bubbles for the battery systems in Fig. 5a and b are relative to thebattery storage capacity normalized by the electricity production. Forthe DSM systems in Fig. 5c and d the size of the bubbles are relative tothe load. Fig. 5b and d show the increase in matching in percentagepoints.
Most systems with batteries had an increase in both self-consump-tion and self-sufficiency of 10–30 percentage points when the batterieswere added as can be seen in Fig. 5(a). Generally, PV systems with largerelative battery capacities had greater improvement in self-consump-tion and self-sufficiency. With DSM, the increase is significantly lowerthan for batteries. A majority of the systems increased the self-con-sumption and self-sufficiency with less than 10 percentage points usingDSM.
The matching in the compiled studies thus improved on averagemore when using batteries than with DSM. In [40] both batteries andDSM were investigated for the same two systems, the self-consumptionin the two systems increased with 17 and 21 percentage points withbatteries, and 15 and 9 percentage points with DSM. Furthermore, in[48], similar results were presented for one building where the increaseof the self-consumption was 20 percentage points with batteries and 12percentage points with DSM. These studies and the results presented inFigs. 4 and 5 support the conclusions in [5] that DSM has a lower po-tential than a battery storage to increase the self-consumption and self-sufficiency.
4. Application to nearly zero energy building requirements
In this section, the role of matching between PV electricity gen-eration and electric load in the requirements suggested for futureSwedish nearly zero energy buildings is investigated using the Energymatching chart. Since the EU EPBD does not state an exact definition ofa nearly zero energy building in terms of primary energy use, it is up toeach member state to draw up national plans [3]. In a proposal for theSwedish requirements on nZEB made by The Swedish National Board ofHousing, Building and Planning (Boverket), the primary energy con-sumption, EPpet, should not exceed 80 kWh m−2 year−1 in detachedhouses. The primary energy consumption in the requirements includeenergy use for space heating, domestic hot water (DHW), ventilation,cooling, and the building's property electricity (fans, circulation pumps,etc.) [54,55]. Weighting factors for primary energy and geographicallocation are used to harmonize the requirements for different energycarriers and the location of the building. According to the proposal, it ispossible to be credited for the on-site energy production that is directlyconsumed in the building. This, however, only applies to the buildingelectricity use, that is for space heating, cooling, ventilation, DHW, andthe building’s property electricity. Household electricity use for appli-ances and lighting cannot be credited. This means that a building withon-site energy production can use more energy than buildings withouton-site energy production, and still meet the requirements. Therefore, itis relevant to investigate how on-site PV electricity production affectsthe requirements of the building envelope.
Fig. 3. If P and L remain the same, the self-consumption and self-sufficiencyimprovements follow a straight line defined by the ratio P/L.
R. Luthander, et al. $SSOLHG(QHUJ\²
Luthander et al., Graphical analysis of photovoltaic generation and load matching inbuildings: A novel way of studying self-consumption and self-sufficiency, 2019, Appliedenergy, 250, 748–759.
6
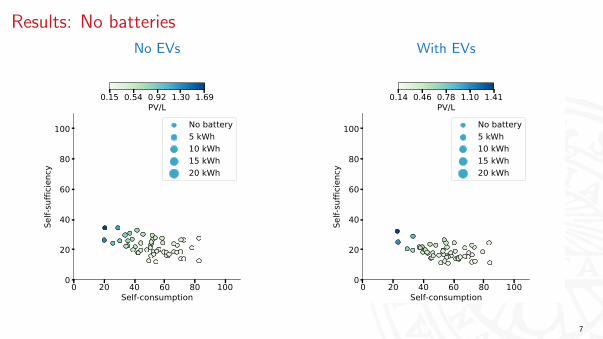
Results: No batteries
No EVs
0 20 40 60 80 100Self-consumption
0
20
40
60
80
100
Self-
suffi
cienc
y
No battery5 kWh10 kWh15 kWh20 kWh
0.15 0.54 0.92 1.30 1.69PV/L
With EVs
0 20 40 60 80 100Self-consumption
0
20
40
60
80
100
Self-
suffi
cienc
y
No battery5 kWh10 kWh15 kWh20 kWh
0.14 0.46 0.78 1.10 1.41PV/L
7
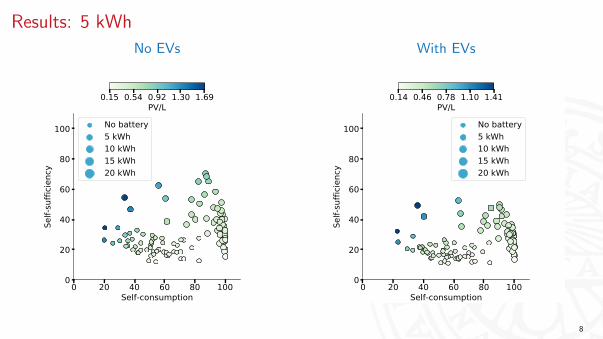
Results: 5 kWh
No EVs
0 20 40 60 80 100Self-consumption
0
20
40
60
80
100
Self-
suffi
cienc
y
No battery5 kWh10 kWh15 kWh20 kWh
0.15 0.54 0.92 1.30 1.69PV/L
With EVs
0 20 40 60 80 100Self-consumption
0
20
40
60
80
100
Self-
suffi
cienc
y
No battery5 kWh10 kWh15 kWh20 kWh
0.14 0.46 0.78 1.10 1.41PV/L
8
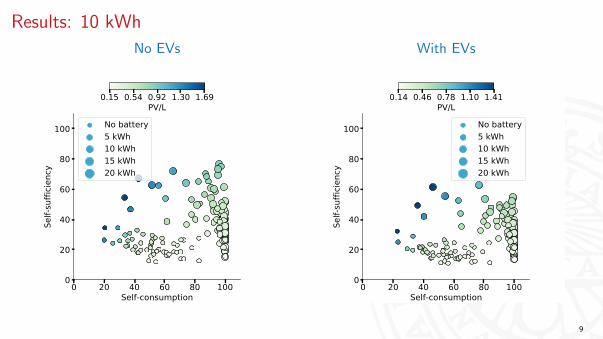
Results: 10 kWh
No EVs
0 20 40 60 80 100Self-consumption
0
20
40
60
80
100
Self-
suffi
cienc
y
No battery5 kWh10 kWh15 kWh20 kWh
0.15 0.54 0.92 1.30 1.69PV/L
With EVs
0 20 40 60 80 100Self-consumption
0
20
40
60
80
100
Self-
suffi
cienc
y
No battery5 kWh10 kWh15 kWh20 kWh
0.14 0.46 0.78 1.10 1.41PV/L
9
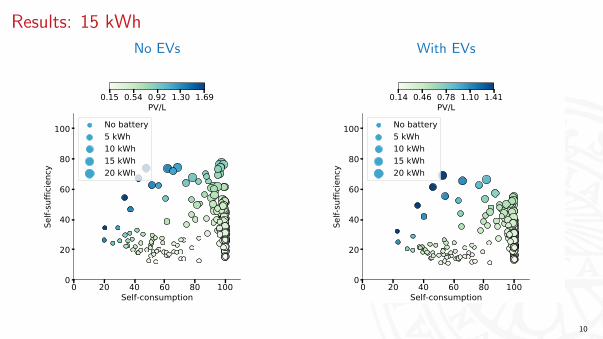
Results: 15 kWh
No EVs
0 20 40 60 80 100Self-consumption
0
20
40
60
80
100
Self-
suffi
cienc
y
No battery5 kWh10 kWh15 kWh20 kWh
0.15 0.54 0.92 1.30 1.69PV/L
With EVs
0 20 40 60 80 100Self-consumption
0
20
40
60
80
100
Self-
suffi
cienc
y
No battery5 kWh10 kWh15 kWh20 kWh
0.14 0.46 0.78 1.10 1.41PV/L
10
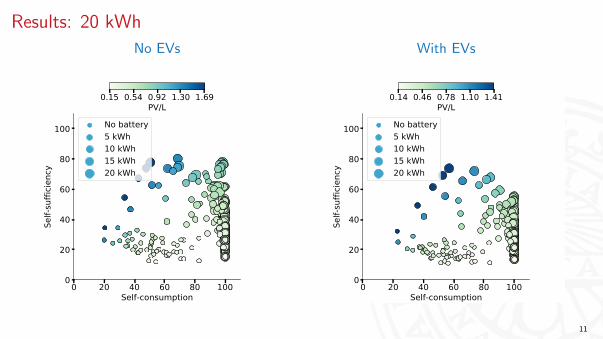
Results: 20 kWh
No EVs
0 20 40 60 80 100Self-consumption
0
20
40
60
80
100
Self-
suffi
cienc
y
No battery5 kWh10 kWh15 kWh20 kWh
0.15 0.54 0.92 1.30 1.69PV/L
With EVs
0 20 40 60 80 100Self-consumption
0
20
40
60
80
100
Self-
suffi
cienc
y
No battery5 kWh10 kWh15 kWh20 kWh
0.14 0.46 0.78 1.10 1.41PV/L
11
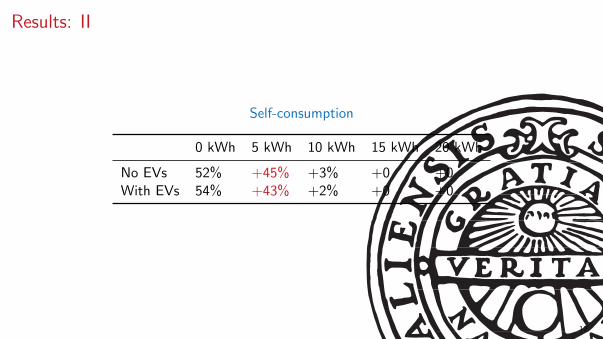
Results: II
Self-consumption
0 kWh 5 kWh 10 kWh 15 kWh 20 kWh
No EVs 52% +45% +3% +0 +0With EVs 54% +43% +2% +0 +0
12
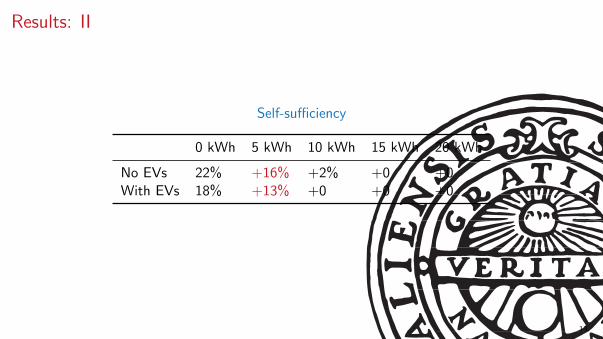
Results: II
Self-sufficiency
0 kWh 5 kWh 10 kWh 15 kWh 20 kWh
No EVs 22% +16% +2% +0 +0With EVs 18% +13% +0 +0 +0
13
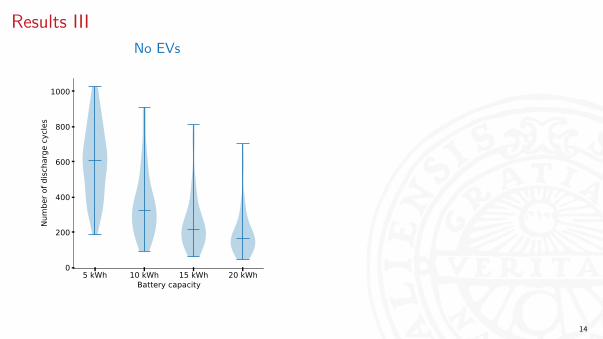
Results III
No EVs
5 kWh 10 kWh 15 kWh 20 kWhBattery capacity
0
200
400
600
800
1000
Num
ber o
f disc
harg
e cy
cles
With EVs
5 kWh 10 kWh 15 kWh 20 kWhBattery capacity
0
200
400
600
800
1000
Num
ber o
f disc
harg
e cy
cles
14
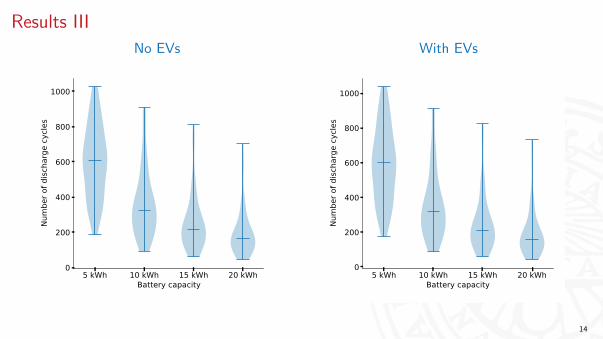
Results III
No EVs
5 kWh 10 kWh 15 kWh 20 kWhBattery capacity
0
200
400
600
800
1000
Num
ber o
f disc
harg
e cy
cles
With EVs
5 kWh 10 kWh 15 kWh 20 kWhBattery capacity
0
200
400
600
800
1000
Num
ber o
f disc
harg
e cy
cles
14
Summary
• Batteries larger than 5 kWh did not improve the temporal mismatch.
• The batteries are used to supply the load of the house, EVs had little impact.
• Batteries vary widely in their cycle-lives.
15
Summary
• Batteries larger than 5 kWh did not improve the temporal mismatch.
• The batteries are used to supply the load of the house, EVs had little impact.
• Batteries vary widely in their cycle-lives.
15
Summary
• Batteries larger than 5 kWh did not improve the temporal mismatch.
• The batteries are used to supply the load of the house, EVs had little impact.
• Batteries vary widely in their cycle-lives.
15

Open questions
• Batteries used to reduce peak power.
• Shared batteries.
16

?
17
References
[1] E. L. Ratnam, S. R. Weller, C. M. Kellett, and A. T. Murray, “Residential load androoftop PV generation: an Australian distribution network dataset,” InternationalJournal of Sustainable Energy, vol. 36, no. 8, pp. 787–806, 2017.
[2] M. Shepero and J. Munkhammar, “Spatial Markov chain model for electric vehiclecharging in cities using geographical information system (GIS) data,” Appliedenergy, vol. 231, pp. 1089–1099, 2018.
18
Sources of figures
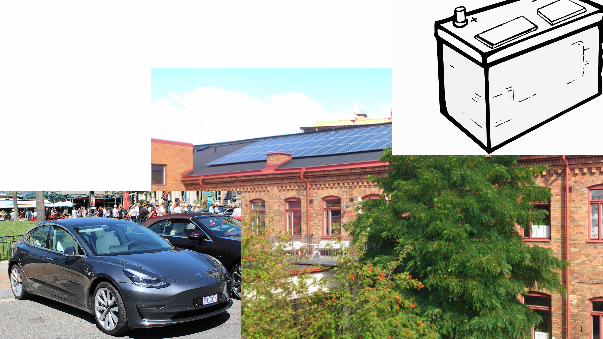
• Solar cells
• Tesla car
19