potential modulation reflectance of the passivated … modulation reflectance of passivated type 304...
TRANSCRIPT

Instructions for use
Title Potential modulation reflectance of passivated type 304 stainless steel in sulfuric acid solution
Author(s) Ohtsuka, Toshiaki; Hyono, Atsushi; Sasaki, Yuki
Citation Electrochimica Acta, 60: 384-391
Issue Date 2012-01-15
Doc URL http://hdl.handle.net/2115/48546
Type article (author version)
Additional Information There are other files related to this item in HUSCAP. Check the above URL.
File Information EA60_384-391.pdf
Hokkaido University Collection of Scholarly and Academic Papers : HUSCAP

Potential Modulation Reflectance of Passivated Type 304 Stainless Steel in Sulfuric
Acid Solution
Toshiaki Ohtsuka*, Atsushi Hyono, and Yuki Sasaki
Div. of Material Science and Engineering, Faculty of Engineering, Hokkaido University,
Kita 13 Nishi 8, Kita-ku, Sapporo 060-8628, Japan
Corresponding author; [email protected]
Tel & Fax +81-11-706-6351
1
Abstract
Potential modulation reflectance (PMR) was applied to passivated type 304
stainless steel covered by a passive oxide film in 0.1 mol dm−3
sulfuric acid solution.
The ellipsometry measurements showed that the passive oxide film was 1.0 nm thick at
the beginning of passivation at 0.1 V vs. Ag/ AgCl and increased to 1.8 nm with
potential at 0.9 V in the transpassive region. Under positive bias, the signal intensity of
PMR was proportional to the capacitance of the space charge formed in the n-type
semiconducting passive oxide. The Mott-Schottky type plot was applicable to PMR as
well as capacitance. From the plots the oxide film was found to behave as an n-type
semiconducting layer. A threshold photon energy of 2.4 eV in the PMR–wavelength
relation may correspond to the optical absorption edge of the passive oxide.
Key words: Potential modulation reflectance, Stainless steel, Passive film, ellipsometry,
semiconducting oxide.

2
1. Introduction
Passivation is one of the basic key factors with respect to the corrosion resistance
of stainless steels. Passivation is attributed to the formation of a passive film consisting
of a few nanometers thick oxide layer on a stainless steel surface. The passive film
formed on type 304 stainless steel in acidic solutions has been assumed to be
composed of oxides of chromium, iron, and nickel, in which chromium is condensed to
a ratio of 40%–60% [1-4], while it was composed of a inner chromium-rich oxide layer
and a outer iron-rich oxide layer in neutral and weakly alkaline solutions [4-7]. The
detailed dependence of film thickness on potential was estimated by Matsuda et al. by
ellipsometry [8, 9], who reported a 1–2 nm thick film in the passive potential range;
however, a much greater thickness was reported by Toniani et al. [9, 10]. It is
conceivable that, along with measuring the film growth, Toniani et al. also measured
the increase in surface roughness, which introduced a relatively large change in
ellipsometry parameters, resulting in an overestimation of the thickness of the passive
film.
The semiconducting properties of the passive film on stainless steels were studied
by various authors, who measured the impedance of passivated steels to estimate
capacitance. From the Mott-Schottky plots of capacitance, they evaluated the
semiconducting properties of passive films [5, 7, 12-26]. Several authors reported that
the semiconductor type of the passive oxide was n-type [12, 13, 15, 16]. On the other
hand, since the semiconductor type was assumed to be n for Fe2O3 [27] and p for Cr2O3

3
[27, 28] and the main composition of the passive film on stainless steels was considered
to be ferric and chromic oxide or hydroxide, Fereira et al. [17-19, 21, 26] and
Carmezim et al. [23] assumed that the passive film on stainless steels may posses both
characteristics. For the Mott-Schottky plot, these authors measured capacitance over a
wide range of potential from the passive region to hydrogen evolution region; however,
it should be noticed that impedance is very sensitive to the change in film composition
and interfacial Faradaic processes such as hydrogen evolution. When the potential of
passivated stainless steel is shifted to lower potential, the reductive dissolution of ferric
oxide or oxyhydroxide takes place to introduce the loss of ferric elements from the
passive film, and hydrogen evolution occurs upon further lowering the potential. The
reductive change in the passive film on stainless steel was reported by Piao and Park
[30] who measured reflectance from oxide-covered stainless steel in pH 6.8 NaCl
solution and found a change in reflectance with increase of cathodic current during a
potential sweep from −0.2 V vs Ag/AgCl to more negative potentials. The reductive
dissolution of ferric oxide from the artificial ferric–chromic composite oxide was also
found by Tanaka et al. from the ellipsometric measurement [31]. When the Faradaic
redox current is added to the charge-discharge current of the oxide layer at the
electrode-solution interface, the interfacial impedance or capacitance was greatly
influenced by the redox current, which may conceal the impedance response of the
oxide film. The potential for the Mott-Schottky plot should, therefore, be restricted to
the range where there are no change in film composition and no Faradaic processes.
When the potential for the capacitance measurement is restricted to this range, the

4
passive film on stainless steel is reported to behave as an n-type semiconductor [12, 13,
15, 16].
AC potential modulation reflectance (PMR) or electroreflectance is a
surface-sensitive technique for measuring electrode properties. In PMR, reflectance
modulated by an AC potential on an electrode is measured as a function of optical
wavelength, DC potential, and AC frequency. Upon applying PMR to electrodes
covered by a semiconducting oxide layer, reflectance modulation is induced by the
change in electronic density within the oxide and/or at the oxide-solution interface
[32-35]. When the surface oxide on the electrode is located under the carrier-depression
condition, a space charge is formed in the oxide layer and is modulated by the applied
AC potential, accompanied by a change in the thickness of the space-charge layer and
in the electric field in the space-charge layer [16, 17]. PMR may originate in the change
in the space-charge layer. Since thickness and electric field are functions of biased DC
potential, as described in the Mott-Schottky plot, PMR also becomes a function of DC
potential.
In this paper, we present a precise ellipsometry measurement of the thickness of a
passive film on type 304 stainless steel and measure the passive oxide by PMR as well
as the electrochemical impedance or capacitance. Furthermore, the basic theory for
understanding the results of AC PMR is discussed and the PMR is applied to the
passive oxide film. Finally, we compare the results of PMR with capacitance data to
examine the semiconducting properties of the passive films on the stainless steel.

5
2. Experimental
Type 304 stainless steel was used for electrode specimen, which was composed of
18.29 wt% Cr and 8.75 wt% Ni with minor elements of 0.066 wt% C, 0.58 wt% Si,
0.029 wt% P, 0.002 wt% S, 0.82 wt% Mn and 0.14 wt% Mo. The 2-mm-thick
specimen was cut into 15 × 15 mm2 with a small handle for electrical connection. It
was mechanically polished by alumina abrasive to a mirror-like surface and then
washed ultrasonically in acetone. Before use, the handle part was sealed by an epoxy
resin.
The electrolyte solutions were 0.1 mol/dm3 (M) sulfuric acid and a pH 8.4 borate
buffer consisting of a 1:1 mixture of 0.075 M sodium borate and 0.3 M boric acid. The
solutions were prepared from analytical grade reagents and milli-Q pure water. The
solutions were deaerated by bubbling before use for 2 h with pure nitrogen.
For in situ estimation of the passive oxide film thickness, an automated
rotating-analyzer-type ellipsometer was used which was designed in our laboratory and
equipped with a He–Ne laser operating at 632.8 nm wavelength [38, 39]. The angle of
incidence was 60.0°.
PMR was measured with the apparatus illustrated in Fig. 1. Light from a 450 W
xenon lamp was used for the measurement. The light, monochromated by a
monochromator, JASCO CN-25N, was polarized by a polarizer on a plane parallel to
the incidence plane. In the electrochemical cell with two optical windows, the
parallel-polarized (p-polarized) light was reflected by the stainless steel electrode at an
6
angle of incidence of 60° and the intensity of the reflected light was detected by a
photomultiplier. The azimuth of the analyzer located after the electrode was fixed at
an angle same to that of the polarizer. A root-mean square (rms) 0.1 V AC potential
was superimposed on DC potential and applied to the electrode. AC reflectance dR
harmonically modulated by the AC potential was detected by an EG & G 7260 lock-in
amplifier. The AC reflectance was divided by AC potential dE and normalized by DC
reflectance R0: (dR/dE)(1/R0).
AC-potential modulation current (i.e., admittance or inverse of impedance) was
measured with an NF Circuit Design 5250 frequency response analyzer. For the
measurement, a 0.01 V rms AC potential in the frequency range of 10 mHz–20 kHz
was superimposed on DC potential. The potential was measured with an Ag/ AgCl /
saturated KCl reference electrode and a platinum sheet was used for the counter
electrode.
3. Results
3.1 Voltammogram
Figure 2 shows a voltammogram of type 304 stainless steel measured in a 0.1 M
sulfuric acid solution with a potential sweep from −0.4 to 0.9 V (vs. Ag/ AgCl/
saturated KCl) at a sweep rate of 10−3
V s-1
. The current density (CD) reveals a
maximum at −0.01 V and then decreases to 0.7 A cm-2
at 0.05 V. Passivation starts at
the potential of 0.05 V, continuing to 0.7 V, and in the passive-potential region, the CD

7
remains lower than 1 Acm-2
. The CD increases with increasing potential for potentials
higher than 0.7 V, where transpassive dissolution may occur with chromate formation.
3.2 Film thickness from ellipsometry measurements
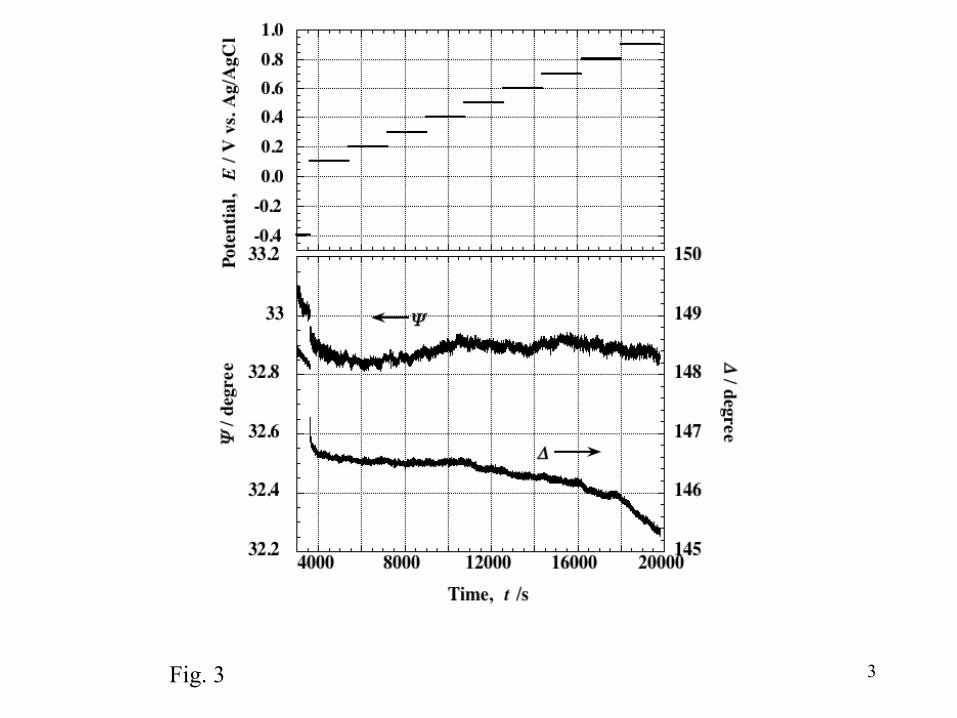
The ellipsometry measurements were performed in the potential region 0.2–0.9 V,
in which the stable passive oxide film was expected to form. The results are shown in
Fig. 3, where the ellipsometry parameters (tan is the relative amplitude ratio of
parallel (p)- polarized light to perpendicular (s)- polarized light) and (relative phase
retardation between p- and s-polarized light) were plotted with potential change. The
potential was initially changed from −0.4 to 0.1 V and then increased to 0.9 V in 0.1 V
steps. The individual potentials were held for 1800 s. The value initially changed by
= −0.2° when the potential changed from −0.4 V in the
hydrogen-evolution-potential region to 0.1 V in the passive-potential region and then
the value remained almost constant from 0.1 to 0.9 V. The value changed by =
−2.5° with the formation of the passive film at 0.1 V and then gradually decreased with
increasing potential. The increase in change of reflects the film growth with potential.
The film thickness was estimated from changes in and by using the ordinary
Fresnel and Drude reflection equations and assuming a homogeneous-layer model in
which a homogeneous oxide layer grows with potential and time. The estimate was
conducted with a computer program coded in FORTRAN. For the calculation, the
refractive index (i.e., the real part of the complex refractive index, N = n - jk) of the
oxide film was assumed to be n = 2.0 and the extinction index k (i.e., the imaginary
8
part of the complex refractive index) and thickness d of the oxide film was estimated as
a function of and . Before the calculation, the complex refractive index of the
substrate steel was determined from and for the reduced surface at −0.4 V: on
average, = 32.953° and = 148.47°. For these values of and , the complex
refractive index of the substrate was calculated to be N = 3.79 − 4.21j at 632.8 nm
wavelength.
The film thickness calculated from the changes of and and , from the
initial reduced surface at −0.4 V is given in Fig. 4. For this calculation, the k value of
the film was estimated to range from k = 0.2 to 0.5. We also plot in Fig. 4 the CD
acquired after 1800 s of potentiostatic oxidation at the individual potentials. The
resulting thickness was about d = 1.0 nm at the initial passivation at 0.1 V and then
increased to 1.8 nm with increasing potential at the beginning of the transpassive
potential region.
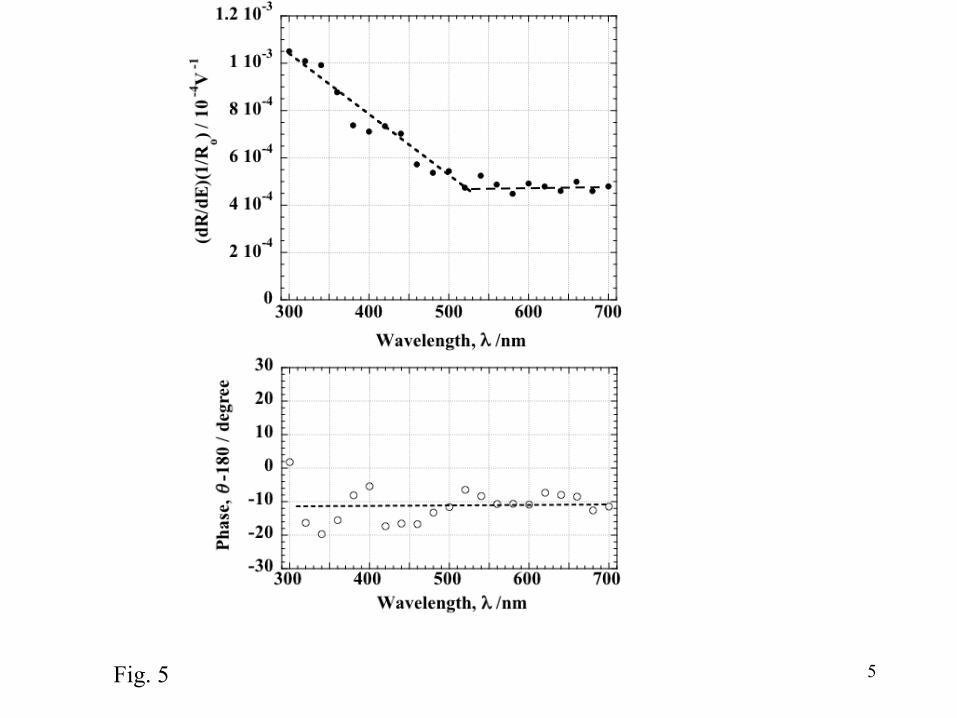
3.3 Spectrum of potential modulation reflectance of passive oxide
The PMR spectrum was measured for a passive film formed in 0.1 M sulfuric acid
solution and the result is shown in Fig. 5. For this figure, PMR was measured at 0.41 V
in a pH 8.4 borate solution at a frequency of 13 Hz after passive oxide formation for
1800 s at 0.85 V in 0.1 M sulfuric acid solution. PMR is a complex number and
accordingly the absolute value and phase retardation of PMR were plotted in Fig. 5. For
the PMR measurement, we replaced sulfuric acid with a neutral borate solution for the
following reason: in acidic solutions, the passive oxide may be sensitive to change in
9
potential because the dissolution rate of the film is relatively high. Since in this study,
we adopted a 0.1 Vrms AC potential to provide a detectable PMR signal, the film may
possibly have been affected by the relatively large potential modulation. In the neutral
borate solution, the film is much more stable because dissolution rate of the film is
much lower and the film growth is assumed to be a slow response to changes in
potential. We believe that the passive film is frozen in the neutral solution without
significant changes in thickness or composition. However, to avoid further growth of
the passive film in the pH 8.4 borate solution, the potential in the borate solution for
the PMR measurement was shifted by −0.059pH (V), where pH is the pH difference
between 0.1 M sulfuric acid solution (pH 0.9) and borate buffer solution (pH 8.4).
The phase retardation shown in Fig. 5 is about = 170°, and therefore, reflectance
was inversely modulated by potential; that is, reflectance decreased with increasing
potential. The PMR amplitude was almost constant for wavelengths longer than 520
nm but increased as wavelength decreased below 520 nm.
3.4 Dependence of PMR on potential decrease
To investigate the dielectric or semiconducting properties of the passive oxide film
formed at a specific formation potential Ef, the capacitance of the electrode covered by
the film was measured as a function of potential by various authors [4-26]. Usually, the
potential is shifted from the formation potential to a lower potential and capacitance or
impedance is measured as a function of the decrease in potential. In the acidic solution,
however, the potential decrease in the sulfuric acid solution during the measurement of

10
the capacitance–potential (C–E) relation possibly induces a change in the oxide film
thickness and composition because of the relatively high dissolution rate.
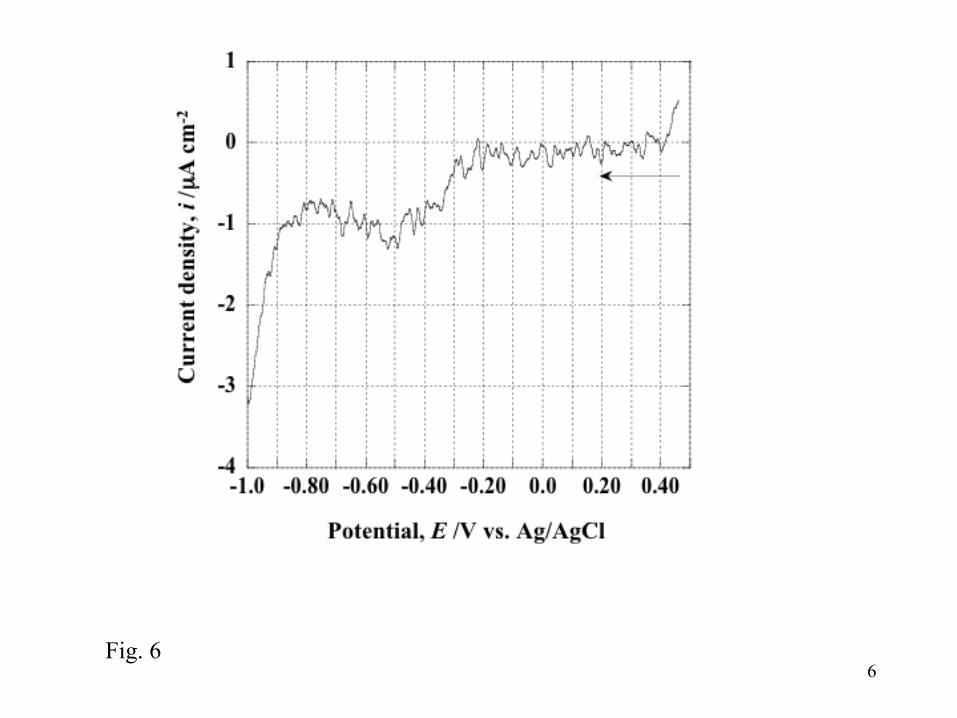
To measure the C–E relation, we replaced the sulfuric acid solution with a pH 8.4
borate buffer solution, as done in the preceding section. Figure 6 shows the
CD–potential relation acquired in the pH 8.4 borate buffer solution at a sweep rate of 2
× 10−3
V s-1
after passivation at Ef = 0.85 V for 1800 s in 0.1 M sulfuric acid solution.
To avoid further growth of the passive film in the pH 8.4 borate solution, the starting
potential in the borate solution was shifted to Ef − 0.0591pH (V). In the potential
range from 0.42 to −0.30 V, the CD was less than −0.2 A/cm2; hence, we believe that
the oxide film did not change significantly.
A relatively large cathodic CD of 1 A/cm2 was observed with potentials below
−0.3 V. In this potential range, reduction dissolution of Fe(III) oxide or hydroxide to
Fe(II) ion was expected to occur [15]; therefore, the composition change might have
started at −0.3 V. To investigate the C–E relation, the data in the potential region below
−0.3 V should be avoided. We discuss the C–E relation in the potential range from Ef–
0.059 pH (V) to −0.3 V in the borate buffer solution for the film formed at Ef in the
sulfuric acid solution.
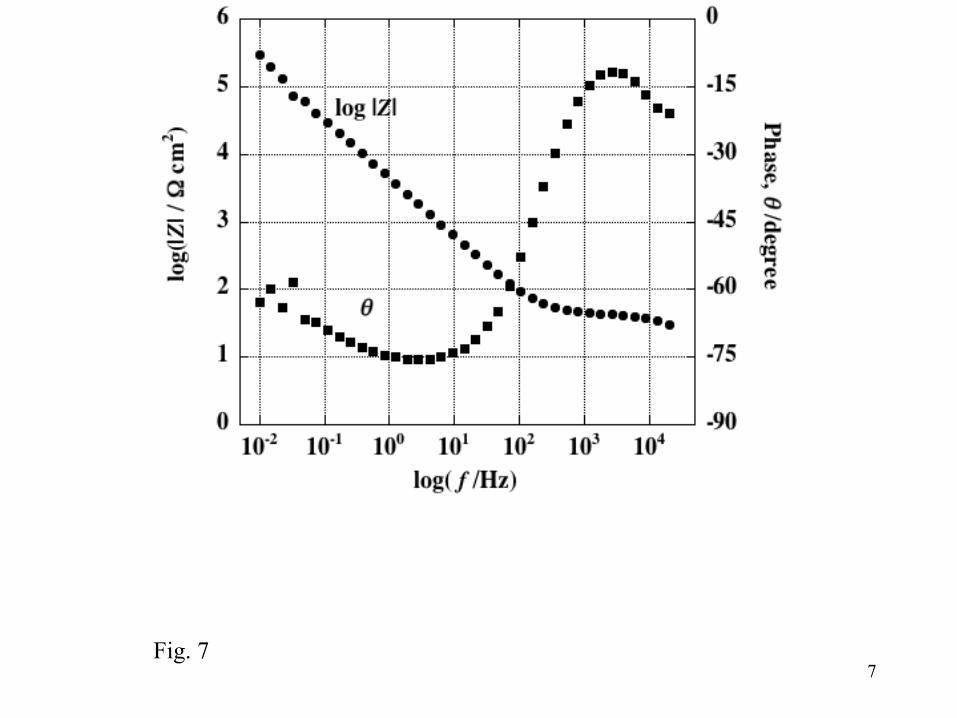
Figure 7 shows the impedance response plotted against frequency (i.e., Bode plot)
for steel covered by a passive oxide film formed at 0.85 V in 0.1 M sulfuric acid
solution. Impedance was measured in a borate solution at a potential of 0.41 V to which
the potential was shifted from EF = 0.85 V in 0.1 M sulfuric acid by Ef – 0.059pH.
The plot indicates that the electrode with the passive film could be represented by an

11
equivalent circuit (Fig. 8(A)) consisting of a series connection between a solution
resistance Rs and a parallel circuit of film resistance Rf and film capacitance Cf. From
the low-frequency limit, the film resistance is calculated to be greater than 106 cm
2.
For the C–E relation in the Mott-Schottky plot, a specific frequency should be
selected and impedance should be measured as a function of decreasing potential at the
selected frequency. We adopted 13 Hz as the fixed frequency, at which the circuit could
be approximated as a series connection between the solution resistance and the film
capacitance (Fig. 8(B) because the film resistance Rf was much larger than the
impedance of 1/(j2fCf) at f = 13 Hz and the selected angular frequency, (=2f), are
much larger than inverse of the time constant of Rf-Cf parallel circuit, which is seen in
Fig. 7. With the approximated circuit as shown in Fig. 8(B), the film capacitance was
calculated from the imaginary part of complex impedance, Im(Z), at f = 13 Hz and Cf =
1/ [2f Im(Z)]. Since the selected frequency is seen to be much smaller than the inverse
of the other time constant of Rs-Cf series connection in Fig. 6, the most of AC potential
imposed to the electrode is borne in the oxide layer.
PMR can be related to the film capacitance, as described in the discussion section
below. The dependence of PMR on potential was also measured at f = 13 Hz in the pH
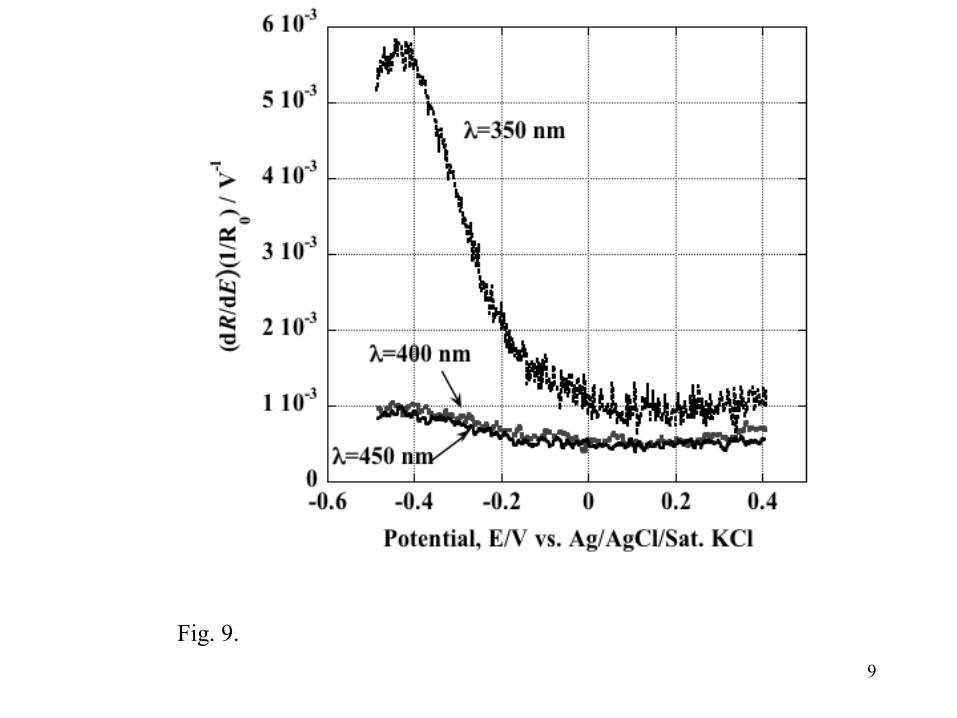
8.4 borate solution for the oxide films formed in 0.1 M sulfuric acid solution. Figure 9
shows a PMR–potential relation measured at three wavelengths of = 350, 400, and
450 nm during potential sweeps from 0.41 to −0.50 V at a sweep rate of 10−4
V s-1
.
Although PMR is a complex number, only the absolute value (amplitude) of PMR is
plotted in Fig. 9. Phase retardation with respect to AC potential was about = 175° to
12
155° for potentials between 0.4 and −0.1 V. PMR at = 400 and 450 nm was less than
10−3
V−1
and depended weakly on potential. PMR at = 350 nm, however, exhibited a
clear dependence on potential, increasing with decreasing potential.
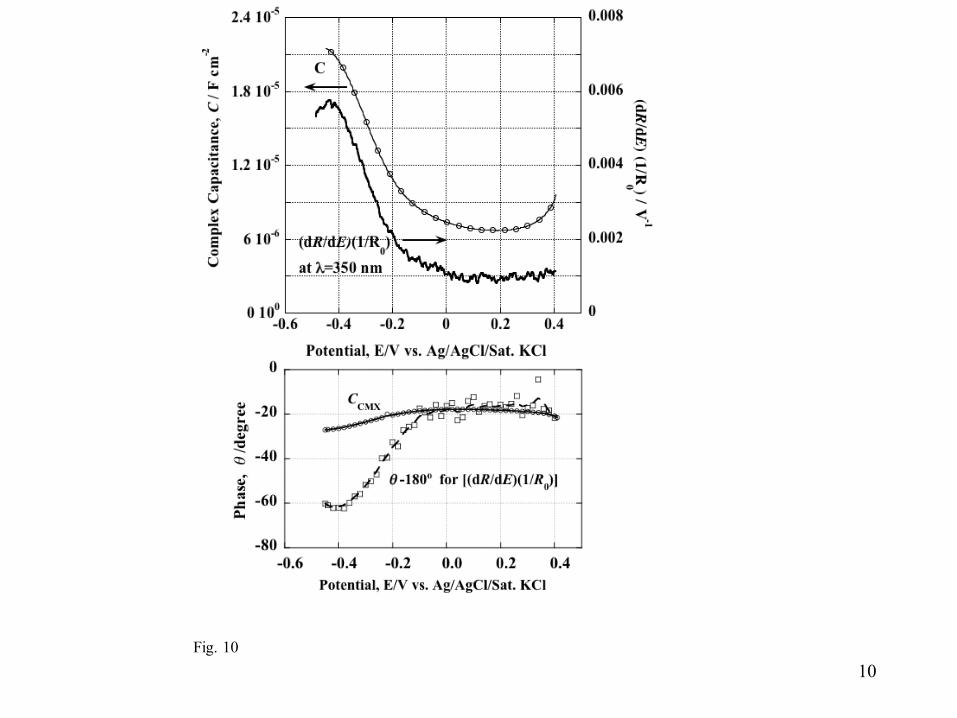
In Fig. 10, the PMR response at 350 nm wavelength to the potential is compared
with the capacitance response. The complex capacitance was calculated from the
complex impedance Z using CCMX = 1/(2fZ) at f = 13 Hz. The both amplitudes of
CCMX and PMR increased with decreasing potential and, however, the phase shift of
CCMX changed from -20° to -25°, while that of PMR from 170° to 120°. From the
comparison between the phase shifts of CCMX and PMR, it is found that PMR is
inversely modulated with respect to complex capacitance; that is, positive charge
accumulation in the film induces a decrease in reflectance.
4. Discussion
4.1 Potential modulation of electrode covered by semiconducting passive oxide
We now discuss the AC modulation of the electrode covered by an oxide film with
dielectric and/or semiconducting properties in view of elucidating the relation between
capacitance and PMR.
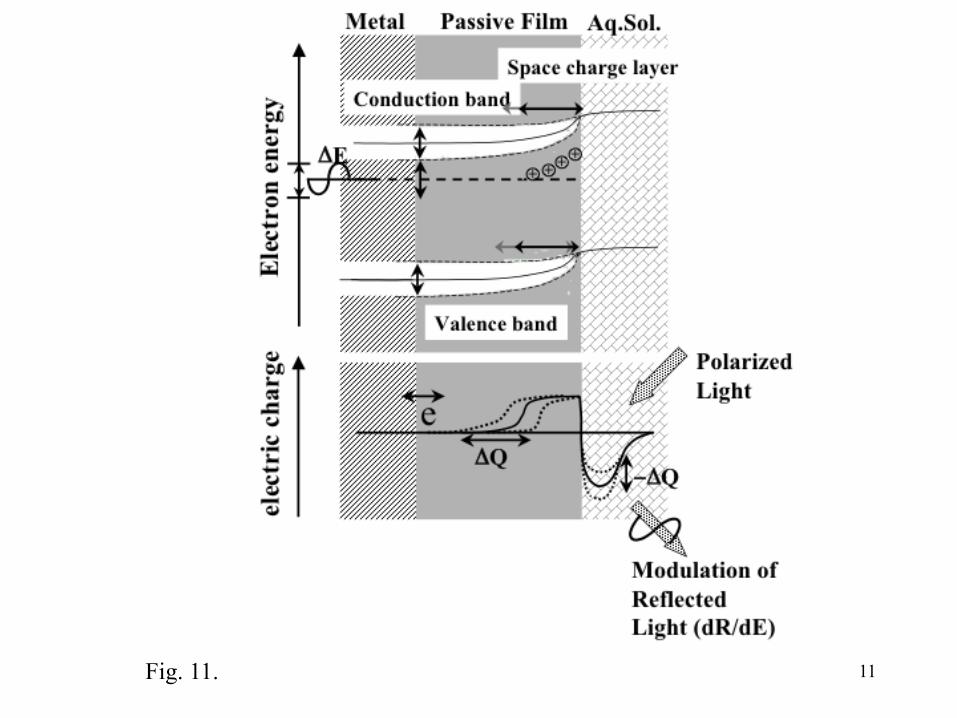
In Fig. 11, a model is illustrated in which the electrode is covered by an n-type
semiconducting oxide film and biased by a positive potential (i.e., reverse biased for
the n-type semiconducting electrode). When an AC bias is applied to the
passive-film-covered electrode, AC impedance is defined as the ratio of AC potential to

13
AC current:
Z = dE/di. (1)
For a thin, reverse-biased n-type semiconducting oxide film, AC current can be related
to the change in the space charge in the depression layer. We now define the complex
capacitance CCMX as
CCMX = dQ/dE = (1/j)(di/dE) = (1/j)(1/Z), (2)
where = 2f is angular frequency. Complex capacitance corresponds to charge
accumulation and depression in the circuit. When one approximates the circuit by an
equivalent circuit consisting of a series connection between a solution resistance Rs and
a film capacitance Cf, as described earlier, the complex capacitance takes the following
form:
1/CCMX = (1/Cf) + jRs. (3)
The change in reflectance with AC potential may be assumed to originate in a change
in electron density in the film. In positive-biased n-type semiconducting oxide, the
thickness of the space-charge layer is harmonically modulated with AC potential, so
the electron density in the region between the space-charge layer and the inner layer is
also modulated. Because the change in the electron density possibly induces a
reflectance change, PMR is harmonically proportional to the complex capacitance:
dR/dE = K(dQ/dE) = KCCMX, (4)
where K is a constant relating modulation reflectance to charge. PMR and CCMX are
assumed to be modulated with the same phase retardation with respect to AC potential,
although the PMR and CCMX phases are reversed with respect to each other.

14
The phase retardations of both modulation reflectance and complex capacitance
can be analyzed by considering a simplified equivalent circuit consisting of a series
connection of Rs and Cf (Fig. 8(B)). Because reflectance was approximately inversely
proportional to charge in the space charge as shown in Fig. 10, the reflectance is
assumed to be directly modulated by AC potential (dEsc) applied in the space-charge
layer of the oxide film. Thus, the experimentally measured PMR can be described as
follows:
dR/dE = (dR/dEsc)(dEsc/dE) (5)
where (dR/dEsc) becomes a real number. The equivalent circuit shows that the relation
between dEsc in the space-charge layer, and dE exactly imposed on the electrode from
the outer circuit takes the form
dEsc/dE = (jCf)-1
/[Rs + (jCf)]−1
= {1/[1 + (/0)2]}[1 − j(/0)] (6)
where 0 is the specific angular frequency of series Rs−Cf circuit:
0 =1/(RsCf) = 1/ (7)
with being the time constant of the circuit.
The quantity dR/dE is a complex number that can be described as follows:
dR/dE = (dR/dEsc) {1/[1 + (/0)2]} [1 − j(/0)] (8)
If the ratio /0 is much smaller than 1 (i.e., the frequency at which PMR is measured
is much smaller than the specific frequency 0 of the circuit), then the following
approximation holds:
dR/dE ≃ dR/dEsc. (9)

15
In this case, the measured dR/dE is not a complex number but a real number. If the ratio
/0 is not much smaller than 1, then dR/dE becomes a complex number, as having
been shown in Fig. 10, and phase retardation is given by
= −arctan(/0) or [180° − arctan(/0)] (10)
For the complex capacitance CCMX, a similar approximation may be performed:
CCMX = Cf{1/[1+(/0)2]} [1 − j(/0)]. (11)
The phase retardation of the PMR in Fig. 10 is about 160° over the potential range of
−0.2 to 0.4 V, and thus (/0) is estimated to be /0 = 0.36 from Equation (8). From
the measurement frequency at f = 13 Hz, the specific frequency can be calculated to be
0 = 230 s−1
. On the other hand, the specific frequency estimated from the Bode plot of
impedance (Fig. 7) is about 0 = 750 s−1
. The difference in the specific frequency may
be derived by neglecting the presence of the constant-phase element in the equivalent
circuit. The impedance Bode plot in Fig. 7 shows that d(log |Z|)/d(log f) is not 1 but is
slightly smaller, so the constant-phase element would be used for a precise simulation
by the equivalent circuit.
The phase retardation of PMR is different from that of CCMX for potentials more
negative than −0.1 V, as shown in Fig. 10, where the phase retardation of PMR changes
from −20°(+160°) at −0.1 V to −60°(+180°) at −0.4 V, although the phase retardation
of CCMX varies from −20° to −27°. This discrepancy is not understood at present. A
possible explanation is that modulation reflectance may be influenced by the surface
states on the oxide film and/or the change in ionic density in the electric double layer at
the solution side.
16
In Fig. 12, the relation between PMR and CCMX is described using the ratio
Real (PMR)/real(CCMX), where the Real(PMR) and Real( CCMX) are real parts of the
complex numbers. The real (CCMX) is related with the film capacitance, i.e., the space
charge capacitance from equation (11),
Real(CCMX) = Cf{1/[1+(/0)2]} (12)
The Real (PMC) is also related with a modulation reflectance in the space charge layer
from equation (8),
Real(PMR) = (dR/dEsc) (1/R0){1/[1 + (/0)2]} (13)
The ratio of the real parts can be described as the following way,
Real (PMR)/ real(CCMX) = (dR/dEsc) (1/R0) / Cf
From Fig. 12, the ratio of the real parts was almost constant at -140 (±30) C-1
cm2 in
the potentials from 0.4 V to -0.4 V. The ratio indicates that a charge accumulated in the
space charge induces a constant change of amplitude of reflectance modulation. When
one considers the exact charging that occurs experimentally, a positive charge density of
1 C cm−2
in the space-charge layer corresponds to a change in reflectance dR/R0 =
−1.4 × 10⁻⁴
.
4.2 Spectroscopic response of modulation reflectance
When the film does not absorb light, modulation reflectance should not be
strong. If one assumes that, because of the smaller electronic density in the
space-charge layer or depression layer, the absorption coefficient in the space-charge
layer is different from that of the original oxide, then the modulation of depth of the

17
space-charge layer by an AC potential will give modulation reflectance. Because one
can consider that the reflectance change that results from the space-charge modulation
in the oxide may be proportional to the intensity of optical absorption in the original
oxide film, the modulation reflectance spectrum may possibly reflect the absorption
properties of the film. From Fig. 5, we find that, starting at 520 nm wavelength,
modulation reflectance increases with decreasing wavelength, whereas it is almost
constant at 4.3 × 10⁻⁴
V−1
above 520 nm wavelength. Under the assumption that
modulation reflectance is proportional to the intensity of optical absorption, the
absorption edge would exist at the threshold wavelength of 520 nm (photon energy of
2.4 eV). Because the photo-induced current from the photo-electrochemical
measurement starts to appear from almost the same photon energy [1], we conclude
that the threshold wavelength (or photon energy) found in this study may correspond to
the optical absorption edge.
4.3 Mott-Schottky-type plot
The inverse of capacitance is proportional to the depression layer thickness; that is,
the capacitance of the space-charge layer in an n-type semiconductor oxide under
reverse bias obeys the Mott-Schottky relation:
Csp−2
= [2/(0NDe)](E − EFB − kT/e) (14)
where Csp represents the space-charge capacitance, ND is the donor density, is the
dielectric constant, 0 is the vacuum permittivity, and EFB is the flat-band potential.
Because the space-charge capacitance corresponds to the film capacitance Cf, which

18
can be estimated from CCMX in equation (3). If the Real(PMR) is assumed to be
proportional to the film capacitance, PMR as a function of E must also follow the
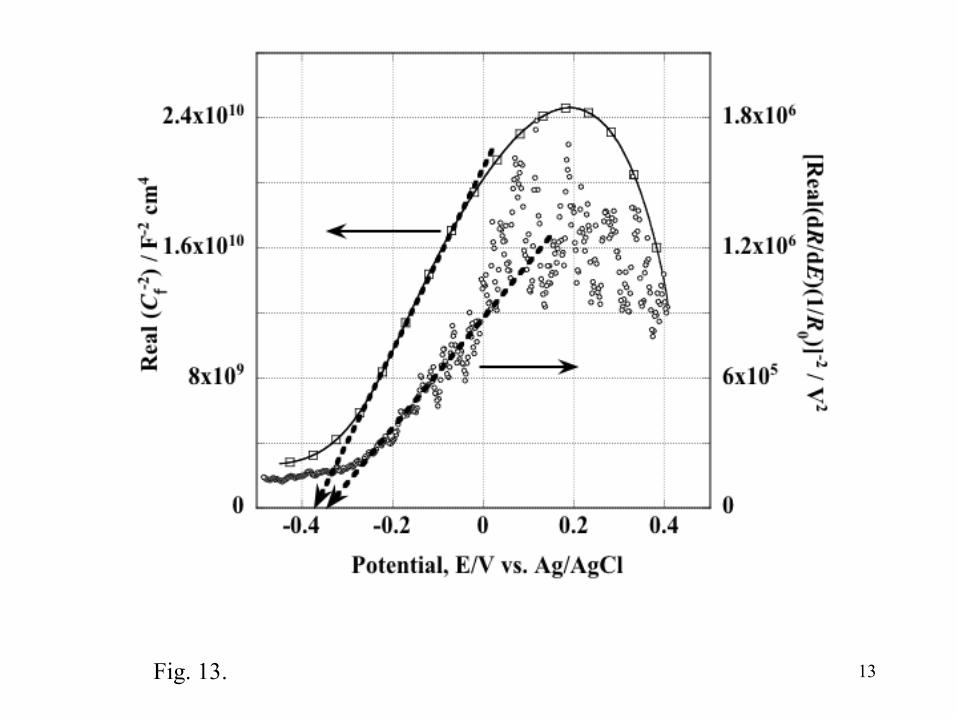
relation similar as the Mott-Schottky equation. Figure 13 shows Cf−2
vs. E and
{Real[(dR/dE)(1/R0)]}−2
vs. E for = 350 nm, measured at f = 13 Hz, and it is seen
that both follow a linear relation in potentials from 0.0 V to -0.3 V and the relation
indicates that the passive oxide layer on the type 304 stainless steel posses n-type
semiconducting property. This result allows us, by extrapolating the linear range of
both curves to the potential axis, to estimate the flat-band potential. From the potential
of -0.36 V extrapolated on the Cf−2
vs. E plot, the flat-band potential is estimated to be
about −0.34 V vs. Ag/ AgCl/ saturated KCl and is in agreement with the potential
extrapolated on the {Real[(dR/dE)(1/R0)]}−2
vs. E plot. From the slope of Cf-2
vs. E, the
donor density of the oxide film is estimated to be 8 × 10²⁰
cm−3
under the assumption
= 15.6 [14,15] .
The results shown in Fig. 12 indicate that the space-charge layer is optically
observable with the PMR technique.
Conclusion
The ellipsometry results indicate that the passive oxide film on type 304
stainless steel is 1.0 nm thick at the beginning of passivation at 0.1 V vs Ag/AgCl
saturated KCl and increases to 1.8 nm with potential at 0.9 V, the point at which
transpassive dissolution starts.
PMR of passivated stainless steel in 0.1 M sulfuric acid solution can be
19
explained by modeling it as an n-type semiconducting oxide film under positive bias.
In the model the AC potential modulates the space charge in the depression layer and
PMR originates in the modulation of the space charge. This model was experimentally
confirmed from a proportional relation between PMR and space-charge capacitance.
From the spectroscopic PMR measurement, the optical absorption edge of the
passive oxide was found to be 520 nm wavelength (photon energy of 2.4 eV).
The same relation to the Mott-Schottky plot of Csp−2
vs. E was established for
the PMR, i.e., [(dR/dE)(1/R0)]−2
vs. E. From the plots, the flat band potential of n-type
semiconducting oxide film on the stainless steel was found to be about −0.34 V.
References
(1) S. Fujimoto, T. Yamada, T. Shibata, J. Electrochem. Soc., 145 (1998) L79.
(2) I. Olefjord, Materials Sci. and Eng., 42 (1980) 161.
(3) V. Maurice, W. P. Yang, P. Marcus, J. Electrochem. Soc., 145 (1998) 909.
(4) G. Lorang and M. Da Cunha Belo, A. M. P. Simões, M. G. S. Ferreira, J.
Electrochem. Soc., 141 (1994) 3347.
(5) N. E. Hakiki, M. Da Cunha Belo, A. M. P. Simões, M. G. S. Ferreira, J.
Electrochem. Soc., 145 (1998) 3821.
(6) M.J. Carmezim, A.M. Simoes, M.F. Montemor, M. da Cunha Belo, Corros.
Science, 47 (2005) 581.
(7) L. Freirea, M. J. Carmezima, M. G. S. Ferreira, M.F. Montemor, Electrochim. Acta,

20
55 (2010) 6174.
(8) S. Matsuda, K. Sugimoto, Y. Sawada, Transact. JIM, 18 (1977) 66.
(9) K. Sugimoto, S. Matsuda, Mater. Sci. Eng., 42(1990) 181.
(10) A. Bose, M. K. Totiani, (1999) Ind. J. Eng. Mater. Sci., 6 !999) 213.
(11) S. V. Phadnis, M. K. Toniani, D. Bhattachaya, Transact. Inst. Metal. Finish. 76
(1998) 235.
(12) A. Di Paola, Electrochim. Acta, 34 (1989) 203.
(13) A. M. P. Simoes, M. G. S. Ferreira, B. Rondot, M. da Cunha Belo, J. Electrochem.
Soc., 137 (1990) 82.
(14) A. M. P. Simoes, M. G. S. Ferreira, B. Rondot, M. da Cunha Belo, Electrochim.
Acta, 36 (1991) 315..
(15) R. Babic and M. Metikos-Hukovic, J. Electroanal. Chem., 358 (1993) 143.
(16) J.-P. Petit, A. Antoni, B. Baroux, European Federation of Corrosion Publication,
No. 12, Modifications of passive films, Ed. By P. Marcus, B. Baroux and M.
Keddam, The Institute of Metals (1994) 9.
(17) M. da Cunha Belo, R. Rodot, C. Compere, M. F. Montemor, A. M. P. Simoes, M.
G. S. Ferreira, Corros. Sci., 40 (1998) 481.
(18) M. G. S. Ferreira, A. M. P. Simoes, C. Compere, B. Rondot, M. da Cunha Belo,
Materials Sci. Forum,289-292 (1998) 887.
(19) N. E. Hakiki, M. da Cunha Belo, A. M. P. Simoes, M. G. S. Ferreira, J.
Electrochem. Soc., 145 (1998) 381.
(20) H. Tsuchiya, S. Fujimoto, T. Shibata, J. Electrochem. Soc., 151 (2004) B39.
21
(21) M. G. S. Ferreira, N. E. Hakiki, G. Goodlet, S. Faty, A. M. P. Simões, M. Da
Cunha Belo, Electrochim. Acta, 46 (2001) 3767,
(22) F. Gaben, B. Vuillemin, and R. Oltra, J. Electrochem. Soc., 151 (2004) B595.
(23) M. J. Carmezim, A.M. Simões, M.F. Montemor and M. Da Cunha Belo, Corros.
Sci., 47 (2005) 581.
(24) Z. Feng, X. Cheng, C. Dong, L. Xu. X. Li, Corros. Sci., 52 (2010) 3646.
(25) A. Fattah-alhosseini, M.A. Golozar, A. Saatchi, K. Raeissi, Corros. Sci., 52 (2010)
205.
(26) L. Freire, M. J. Carmezim, M. G. S. Ferreira, M.F. Montemor, Electrochim. Acta,
55, (2010) 6174.
(27) K. Azumi, T. Ohtsuka and N. Sato, J. Electrochem. Soc., 134 (1987) 1352.
(28) S. Virtanen, P. Schmuki, H. Bohni, P. Vuoristo, T. Mantyla, J. Electrochem. Soc.
142 (1995) 3067.
(29) D-S. Kong, S-H. Chen, C. Wang, W. Yang, Corros. Sci., 45 (2003) 747.
(30) T. Piao and S-M. Park, J. Electrochem. Soc., 144 (1997)3371.
(31) S. Tanaka, N. Hara, K. Sugimoto, Mater. Sci. and Eng. A198, (1995) 63.
(32) N. Hara, K. Sugimoto, J. Electrochem. Soc., 142 (1991) 3067.
(33) N. Hara, K. Sugimoto, Transact. JIM, 24 (1983) 236.
(34) K. Sugimoto, M. Sato, S. Tanaka, N. Hara, J. Electrochem. Soc. 140 (1993) 1586.
(35) A. Kawai, G.Gutierrez, J. Electroanal. Chem., 395 (1995) 243
(36) D. J. Wheeler, B. D. Cahan, C. T. Chen, E. Yeager, (1978) Passivity of Metals, Ed
by R. P. Frankenthal and J. Kruger, the Electrochem Soc Inc, (1978) 546.

22
(37) D. J. Blackwood, C. M. Peter, Electrochim. Acta 35, (1990), 1073.
(38) T. Ohtsuka, Y. Sato, K. Uosaki, Langmuir, 10 (1994) 3658
(39) T. Ohtsuka, Denki Kagaku, 60 (1992) 1123.
23
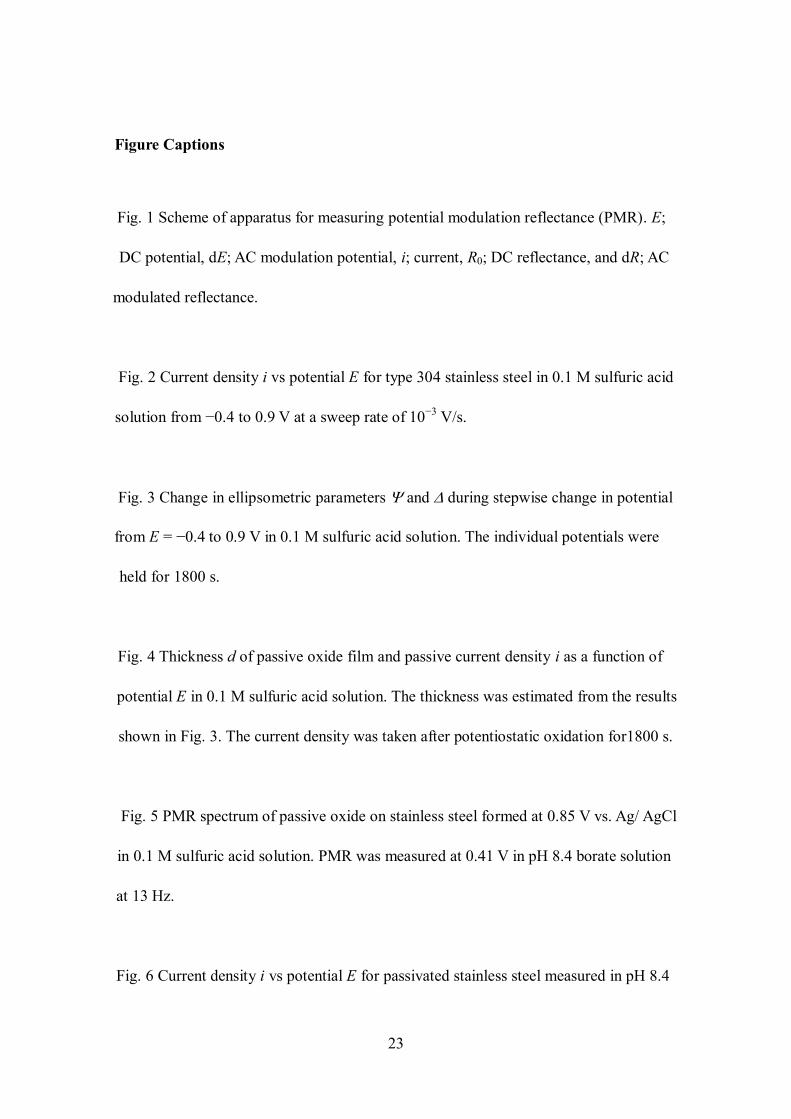
Figure Captions
Fig. 1 Scheme of apparatus for measuring potential modulation reflectance (PMR). E;
DC potential, dE; AC modulation potential, i; current, R0; DC reflectance, and dR; AC
modulated reflectance.
Fig. 2 Current density i vs potential E for type 304 stainless steel in 0.1 M sulfuric acid
solution from −0.4 to 0.9 V at a sweep rate of 10−3
V/s.
Fig. 3 Change in ellipsometric parameters and during stepwise change in potential
from E = −0.4 to 0.9 V in 0.1 M sulfuric acid solution. The individual potentials were
held for 1800 s.
Fig. 4 Thickness d of passive oxide film and passive current density i as a function of
potential E in 0.1 M sulfuric acid solution. The thickness was estimated from the results
shown in Fig. 3. The current density was taken after potentiostatic oxidation for1800 s.
Fig. 5 PMR spectrum of passive oxide on stainless steel formed at 0.85 V vs. Ag/ AgCl
in 0.1 M sulfuric acid solution. PMR was measured at 0.41 V in pH 8.4 borate solution
at 13 Hz.
Fig. 6 Current density i vs potential E for passivated stainless steel measured in pH 8.4
24
borate solution from E = 0.45 to −1.0 V at a sweep rate of v = 2 × 10⁻³
V s − 1.
Passivation was performed at E = 0.85 V for 1.800 s in 0.1 M sulfuric acid solution
before the potential sweep measurement.
Fig. 7 Impedance (|Z|, ) of passivated stainless steel measured at 0.41 V in pH 8.4
borate solution. Passivation was performed at E = 0.85 V for 1800 s in 0.1 M sulfuric
acid solution before the impedance measurement.
Fig. 8 (A) Equivalent circuit corresponding to the impedance response in Fig. 7 and (B)
approximated circuit of the impedance response at a frequency of f = 13 Hz. The
frequency, (= 2f) is; (1/RfCf) << < (1/RsCf).
Fig. 9 PMR (dR/dE)(1/R0) vs. potential E for passivated stainless steel measured at
wavelengths of = 350, 400, and 450 nm in pH 8.4 borate solution during potential
sweep from 0.41 to −0.5 V at a sweep rate of 10−4
V s−1
. Passivation was performed at
E = 0.85 V for 1800 s in 0.1 M sulfuric acid solution before the PRM measurement.
Fig. 10 Comparison between complex capacitance (CCMX) and PMR (dR/dE)(1/R0) at
= 350 nm as a function of potential in pH 8.4 borate solution during a potential sweep
from 0.41 to −0.5 V. Passivation was performed at E = 0.85 V for 1800 s in 0.1 M
sulfuric acid solution.
25
Fig. 11 Schematic model of n-type semiconducting oxide film under reverse bias
(anodic potential against flat-band potential). The space charge and its thickness
changes with applied AC potential.
Fig. 12 Ratio of real part of PMR to that of complex capacitance, Real[(dR/dE)(1/R0)]/
Real[CCMX], measured in pH 8.4 borate solution during potential sweep from 0.41 to
−0.5 V. Passivation was performed at E = 0.85 V for 1800 s in 0.1 M sulfuric acid
solution.
Fig. 13 Mott-Schottky-type plot of Csp−2
vs. E and {Real[(dR/dE)(1/R0)]}−2
vs. E at =
350 nm measured in pH 8.4 borate solution during potential sweep from 0.41 to −0.5 V.
Passivation was performed at E = 0.85 V for 1800 s in 0.1 M sulfuric acid solution.

1
dE
Polarizer
Photomultiplier
Monochromator
Cell
A/D Converter
GP-IB
RS-232C
Potentiostat
Function Generator Lock-in Amplifier
Low-Pass filter
i,E
Ro
dR
Analyzer
Xe-lamp
Band-Pass filter
Fig. 1.
E +dE

2 Fig. 2
3 Fig. 3

4 Fig. 4
5 Fig. 5
6 Fig. 6
7 Fig. 7
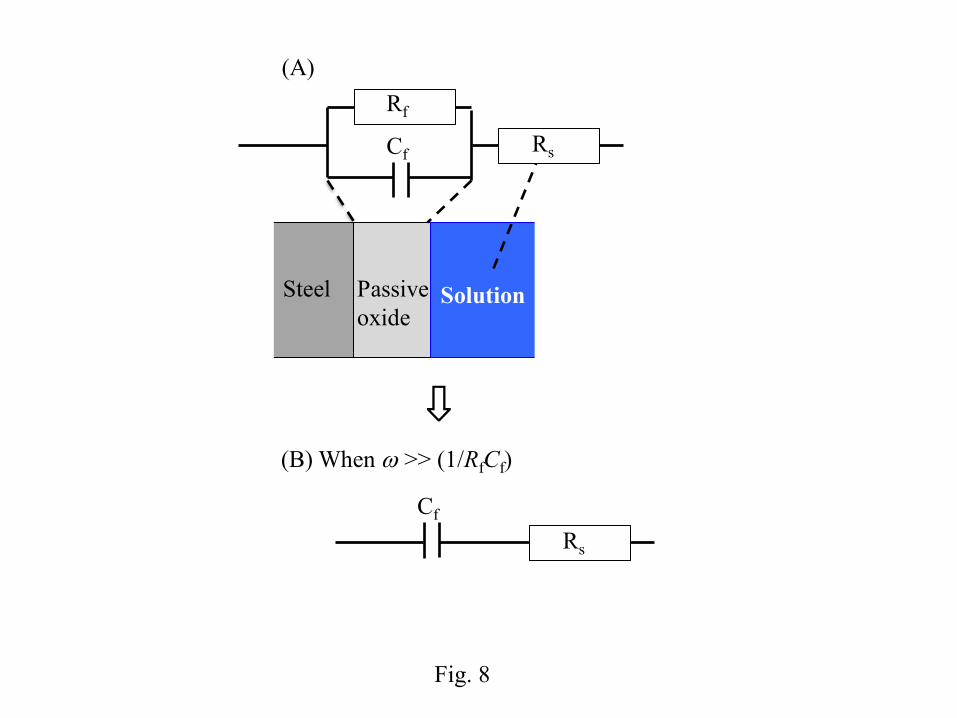
Fig. 8
Rf
Cf
Steel Passive
oxide Solution
(B) When w >> (1/RfCf)
(A)
⇩
Rs
Cf
Rs
9
Fig. 9.
10
Fig. 10
11 Fig. 11.

12
Fig. 12
13 Fig. 13.