potential for using biochar - memorial university · significant positive effects on a number of...
TRANSCRIPT
2014-15 APPLIED RESEARCH FUND
POTENTIAL FOR USING BIOCHAR
AND INCREASE CROP
JOINAL ABEDINAPRIL 2015
TO IMPROVE SOIL FERTILITY PRODUCTIVITY IN THE SANDY SOILS OF HAPPY VALLEY-GOOSE BAY, NL

Table of Contents
Section Contents Page no. 1 Acknowledgements 1 2 Executive Summary 2 3 Introduction 3
3.1 Background and Rationale for Investigation 3 3.2 Objectives 5 3.3 Funding and Partnership 6 3.4 Site and Site Selection 6
4 Research Methodology and Approach 6
4.1 Experiment One 6 4.2 Experiment Two 9
5 Results and Discussion 12
5.1 Experiment One 12 5.2 Experiment Two 20
6 Communications and Outreach 25
7 Recommendation and Conclusion 26
8 References 26

1. Acknowledgement
The author thankfully acknowledges the support from Harris centre through its Applied Research Fund. This research project was also partially funded by Growing forward 2, Atlantic Canada Opportunities Agency (ACOA), Department of Business, Tourism, Culture and Rural Development and Memorial University of Newfoundland.
1
2. Executive Summary
There is no sustainable alternative to increase local food security more effective than producing more affordable quality foods locally. The Soil and Land Management Division of the Department of Forest Resources and Agrifoods, Government of Newfoundland and Labrador have identified late spring or early fall frost, low soil organic matter, sandy soil textures and soil acidity as the primary problems impacting crop production in Happy Valley-Goose Bay area. Among these factors, we have no ability to control weather and soil texture, but can effectively manage soil organic matter contents, and correct soil acidity to increase soil fertility and enhance crop productivity. Topsoil organic matter content for this region generally varies between 0.75-1.5 percent. Due to cold climatic conditions, the mineralization rate of organic matter is low and, hence, the supply of mineral nutrients to crops from soil organic matter is limited. The combination of sandy soil texture and low organic matter also restrict the nutrient holding capacity of soil. Therefore, crop and soil management practices must be implemented to ensure a sufficient supply of essential nutrients when considering growing requirements.
Biochar, a carbonaceous material produced from waste wood or other organic waste through pyrolysis, has the potential to decrease soil acidity and increase moisture and nutrient retention capacity, cation exchange capacity (CEC) and organic matter content of the soils when applied as soil amendment. Therefore, a multi-year research project was initiated in 2013 to improve the soil fertility and crop productivity of the sandy soils of Happy Valley Goose Bay through biochar application. We received a one year research funding in 2013-2014 from Agriculture Research Initiative (ARI) for the project titled “Effect of Biochar Application on Soil Fertility and Crop Productivity on Sandy Soils of Happy Valley-Goose Bay, NL” (Project # ARI-1314-004)”. In 2014-2015 financial supports from Growing Forward2 and Harris Centre were obtained to continue the research for the second year. The objective of this multiyear study is to evaluate the effectiveness of biochar as a soil conditioner and fertility enhancer, and to ascertain its nutrient supply capability when applied singly or in combination with fish meal and chemical fertilizers.
In this present study no significant effect of biochar was observed on soil temperature. However,soil moisture holding capacity was found to be increased at 80 t C/ha treatment in experiment 2. Soil pH and Mehlich 3 extractable concentrations of Ca, K, Mn and S in experiment one were significantly increased in experiment one due to biochar application. While in experiment two, soil pH, CEC and organic matter content were found to be increased at higher biochar application rates. Mehlich 3 extractable concentrations of K, Ca, Mg, P, Mn and Zn, increased with increasing rates of biochar, where the newly applied biochar treatments exhibited higher concentrations than the old biochar treatments for the same rate of application. Available concentrations of Fe and Al generally decreased with increasing biochar rates. The decrease in Al concentrations was more prominent in the newly applied
2
biochar treatments than the old ones for same rate of applications Although biochar application had significant positive effects on a number of soil properties, singly applied biochar was unable to help in crop establishment, plant growth or crop yields in experiment one. The results revealed that biochar application can significantly increase plant growth and biomass yield only when biochar is applied along with fishmeal and fertilizers. In experiment 2, the lowest yield of both beet and leaves were observed in the control treatment whereas the highest yields were recorded at 40 t C/ha, which is not significantly different from other biochar treatments.
3. Introduction
3.1 Background and Rationale for Investigation
The Soil and Land Management Division of the Department of Forest Resources and Agrifoods, Government of Newfoundland and Labrador identified late spring or early fall frost, low soil organic matter, sandy soil texture and low soil pH as the primary problems related to crop production in Happy Valley-Goose Bay area (Department of Forest Resources and Agrifoods, 2002). The factors on which maximum production potential of a particular crop dependcan broadly classified as climatic factors (precipitation, air temperature, relative humidity, light, altitude, latitude, wind velocity and its distribution etc.), soil factors (nutrients, pH, depth, organic matter, water holding capacity, texture, structure, CEC and base saturation, soil temperature, tillage, drainage, slope etc. ) and crop factors (crop species/ variety, planting date, seed quality, seeding rate/ row spacing, evapotranspiration, insects, disease, weeds) (Havlin et al. 2005). Of these, factors, we generally do not have control over climatic factors, but soil and crop factors can be effectively managed and improved to maximize crop productivity.
Organic matter is a crucial constituent of soils impacting physical, chemical and biological properties. A carbon content of 2% (3.4% soil organic matter) has been identified by the European Commission as a critical figure for sustainable crop production (Hanegraaf et. al. 2009). However, the organic matter content of the sandy soils of the Happy Valley-Goose Bay region remains low, varying generally between 0.75-1.5% (Department of Forest Resources and Agrifoods, 2002). Sandy soils are known to have very limited water holding capacity compared to fine textured clay-based soils as the surface area of clay particles can be as much as 10,000 times higher than same weight of medium sand (IPNI, 2006). Low water holding capacity of soils means that drought is often a problem for successful crop production and can compromise the economic viability of agricultural operations.
Soil organic matter (SOM) has other inherent advantages, being fundamental to building needed soil structure as it provides proper cementing material required for the grouping of primary particles to secondary aggregates (or peds). Soils having a carbon content of less than 2% (a measure of SOM) are
3
reported to cause significant decline in structural stability in many soils found throughout the United States and Canada (Loveland and Webb, 2003). This is of particular significance to commercial operations as the quality and nature of the soil is drawn into question and measures aimed at enhancing soil structure through the incorporation of SOM becomes particularly important.
Finally there are issues of nutrient availability, nutrient retention and cation exchange as they relate to soil type. In sandy soil, SOM content is the main source of nutrients and therefore, the soil’s ability to supply essential nutrients is low. Moreover, this soil has lower nutrient retention capacity as this property is related to clay and SOM content. In particular, nutrient cations are retained by the negatively charged sites of these two important soil components where the total negative charges in soil are comprised of ‘permanent charge’ (resulting from isomorphous substitution of a lower charged ion for a higher charged ion), variable charge or pH dependent charges (resulting from increasing soil pH). At acidic soil pH, Al(OH)2+ ions occupy the negatively charged sites and make them unavailable for other cations, and also may affect root development (Brady, 1990). For these reasons, the relative contribution of clay and SOM to cation-exchange capacity is of interest to soil scientists as it relates to soil fertility enhancement. It is estimated that each percent of representative clay and SOM on average contributes to 0.5 meq and 2.0 meq, respectively, for clay and SOM (St. Arnaud and Sephton, 1972). Due to cold climatic condition the mineralization rate of organic matter is expected to be low (Allison and Treseder, 2011) and hence, the supply of mineral nutrients to the crop from this source will further be limited. Futhermore, soil organic matter not only supplies nutrients to growing crops, but also acts as nutrient and energy sources for the microbial biomass that is responsible for many beneficial effects in higher plants. Positive effects include organic matter decomposition, transformation of organically bound forms of nitrogen, phosphorus and sulphur as plant available inorganic forms, and biological nitrogen fixation (Brady, 1990).
On the whole, proper soil management/ amendment practices must be chosen to improve physical, chemical, and biological conditions of the soil, particularly as in cold climate regions where growing conditions have limitations. Biochar (products obtained from combustion of biomass such as wood, fish meal, leaves, etc. through a process called pyrolysis) has been drawing renewed attention within agricultural communities (Yuan et al. 2011), and with respect to the nature and scope of this study, it potentially holds great promise.
The use and utility of biochar as a soil ammendment is not a new concept. Amazonian dark earths, often referred to as ‘terra preta’, can be found throughout certain areas of South America and occur as a result of habitational activities or deliberate soil application by Amerindian populations that occurred before the arrival of Europeans (Lehmann et al. 2006; Barrow, 2012). These “islands” of dark earth can be quite large and would have received large amounts of charred materials (i.e. charcoal) as a result of carbon applications (residues of incomplete combustion of organic material). Within these dark soils, up
4
to 60 cm deep, carbon concentrations can be 70 times higher (mean: four times higher) in ‘terra preta’ soils than in adjacent soils derived from the similar parent material (Glaser et al. 2001). The carbon content of these soils is so chemically and microbially stable that it persists for centuries (Glaser et al. 2001). Importantly, ‘terra preta’ soils remain very fertile and are characterized by higher (approximately three times higher) levels of soil organic matter (SOM), higher nutrient holding capacity for nutrients such as nitrogen, phosphorus, calcium and potassium, higher pH values and higher moisture-holding capacity than in the surrounding soils (Barrow, 2012). The implications for soil enhancement and crop productivity are huge, with researchers now exploring the potential for copying and reproducing the dark earth soil by introducing carbon-rich materials ( i.e. biochar) to less fertile soils, essentially the premise of this study. A synopsis of the reported benefits of biochar and supporting research is provided in the following paragraph.
Biochar application increases soil organic carbon levels (McHenry, 2011; Kwapinski et al. 2010) and improves soil structure (Glaser et al. 2002). Application improves the soils ability to retain moisture (Laird et al. 2010; Steiner et al. 2007), prevents nutrient leaching from soils (Taghizadeh-Toosi et al. 2012; Spokas et al. 2012; Ding et al., 2010) and increases cation exchange capacity of soils (Clough and Condron, 2010; Inyang et al. 2010, Yuan and Xu, 2011). Application of biochar reduces aluminum toxicity (Van Zwieten et al. 2010) and bioavailability of heavy metals (Mendez et al. 2012), increases soil pH (Yuan and Xu, 2011; Deal et al. 2012), supplies essential plant nutrients and decreases the need of chemical fertilizers (Bird et al. 2011; Glaser et al. 2002). Biochar improves the biological condition of soils (Kwapinski et al. 2010; Lehmann et al. 2011), increases soil microbial biomass and support beneficial organisms like earthworm (Lehmann et al. 2011). Conversion of biomass to biochar reduces greenhouse gas emission (Lehmann, 2010; Wang et al. 2011) and helps in sequestering atmospheric carbon in to the soil (Lehmann, 2007; Bolan et al. 2012).
Thus biochar has broad application in carbon sequestration, reduction of greenhouse gas emissions, remediation of heavy metal toxicity, supply of plant nutrients, retention of nutrient elements and as a soil conditioner (i.e. provide favourable physical, chemical and biological condition for optimum crop growth).
3.2 Project Objectives:
The broad objective of this project is to thoroughly study the benefits of biochar application on soil health and crop productivity on the sandy soils of Happy Valley-Goose Bay, NL. One aspect of this project would be to examine the positive effect of biochar on soil pH, water/ nutrient retention, soil structure and the growth and yield of growing crop. The second aspect would be to evaluate the nutritional value of biochar by comparing with fish meal, which is commonly used by the local farmers. The other aspect is to define the amounts of supplemental applications of fishmeal and/or fertilizer
5
needed for the biochar application to maximise crop productivity and soil quality. We also evaluated different doses of biochar to find out optimal rate of application.
3.3 Funding and Partnerships:
This multi-year research project titled “Effect of Biochar Application on Soil Fertility and Crop Productivity on Sandy Soils of Happy Valley-Goose Bay, NL” was initiated in 2013-2014 with a one year research funding from Agriculture Research Initiative (Project # ARI-1314-004)”. In 2014-2015, this project has been funded by Harris Centre and Growing Forward 2. However, we have received some in-kind support from Desmond Sellars who provided the land for experimentation and equipment for preparing the land, and also helped in sourcing fish meal, setting up experiments and collecting soil and plant samples.
3.4 Study Site and Site Selection:
The area selected for the experimentation is located within a designated agricultural area of the Happy Valley metropolitan area. The research will be conducted in the Southern area of Lot 5 (Agricultural Lease 133 309). This site was carefully selected to be representative of the main categories of agricultural soil found in Happy Valley-Goose Bay area. The topography of the area is flat, homogenous, surrounded by native shrubs and is located in an area distinct from other cropping activity. This minimizes the potential for weed development or other considerations that may potentially plague the research.
In the fall of 2012 the site was prepared by clearing and removing large trees and incorporating the shrub canopy and ground level humus materials directly into the top 30 cm of sandy soil profile. Limestone was added at a rate of 3400 Kg/ha (1.5 tons/acre) to raise soil pH in preparation for activity in 2013. Other than the aforementioned, there has been no further soil amendments added. Furthermore, the area has not been exposed to previous agricultural cropping activity of any kind (including the use of cover crops).
4. Research Methodology and Approach
4.1 Experiment One: Soil fertility enhancement through biochar, fishmeal and chemical fertilizer application
The objective of this experiment was to evaluate the effectiveness of biochar as a soil conditioner and fertility enhancer and to ascertain its nutrient-supplying capability when applied singly or in combination with fish meal or chemical fertilizers we initiated an experiment titled.
6
4.1.1 Crop:
In 2014-2015, we grew beet as a test crop. Beet seeds (variety: Red Ace) were sown on June 12, 2014, using a 2-rows hand seeding device (JP-3/Jang Automation Co., Ltd) with an inter-row spacing of 30cm. The seeds were placed at a depth of approximately 2 cm, with a rate of 16-20 seeds per meter. Thinning was planned to adjust the population to the final desired 8-10 plants per meter of row at the 4 real leaf stage. Standard organic methods of pest management practices will be followed. Weeds will be physically removed and row cover will be used to control pest infestations where necessary. The crop under this study was grown completely under rain fed conditions and, therefore, no supplemental irrigation was provided.
4.1.2 Experimental Design and Treatments:
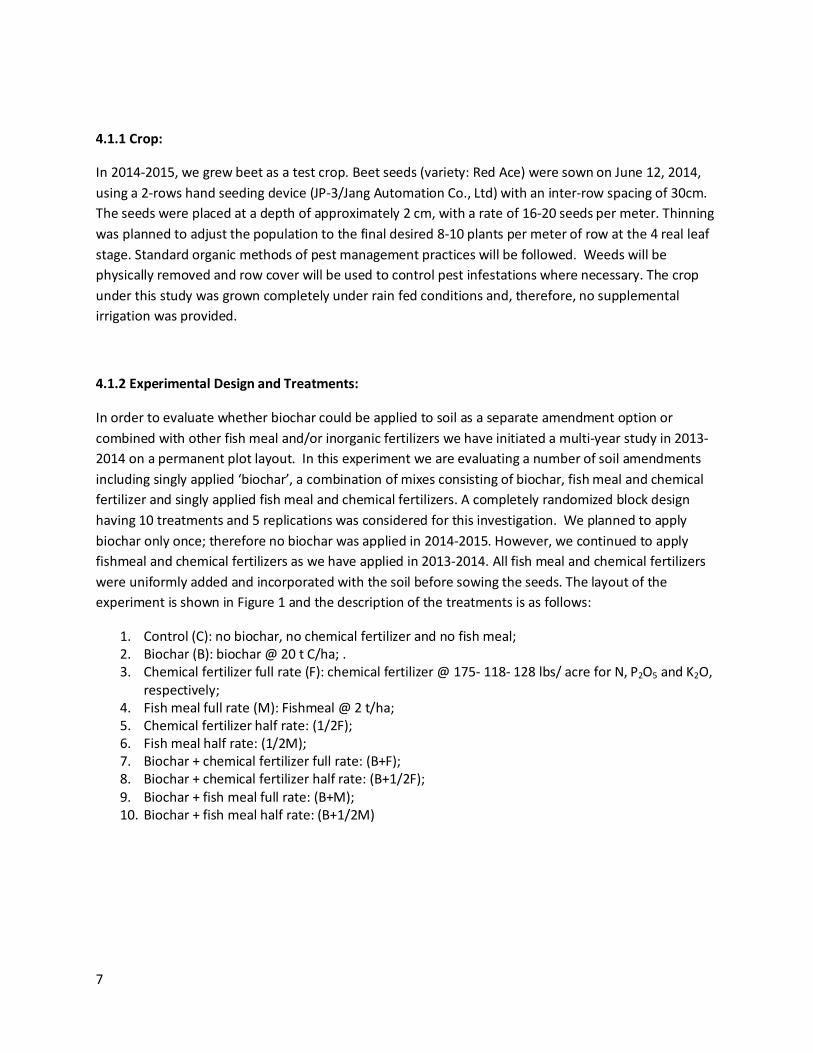
In order to evaluate whether biochar could be applied to soil as a separate amendment option or combined with other fish meal and/or inorganic fertilizers we have initiated a multi-year study in 2013-2014 on a permanent plot layout. In this experiment we are evaluating a number of soil amendments including singly applied ‘biochar’, a combination of mixes consisting of biochar, fish meal and chemical fertilizer and singly applied fish meal and chemical fertilizers. A completely randomized block design having 10 treatments and 5 replications was considered for this investigation. We planned to apply biochar only once; therefore no biochar was applied in 2014-2015. However, we continued to apply fishmeal and chemical fertilizers as we have applied in 2013-2014. All fish meal and chemical fertilizers were uniformly added and incorporated with the soil before sowing the seeds. The layout of the experiment is shown in Figure 1 and the description of the treatments is as follows:
1. Control (C): no biochar, no chemical fertilizer and no fish meal; 2. Biochar (B): biochar @ 20 t C/ha; . 3. Chemical fertilizer full rate (F): chemical fertilizer @ 175- 118- 128 lbs/ acre for N, P2O5 and K2O,
respectively; 4. Fish meal full rate (M): Fishmeal @ 2 t/ha; 5. Chemical fertilizer half rate: (1/2F); 6. Fish meal half rate: (1/2M); 7. Biochar + chemical fertilizer full rate: (B+F); 8. Biochar + chemical fertilizer half rate: (B+1/2F); 9. Biochar + fish meal full rate: (B+M); 10. Biochar + fish meal half rate: (B+1/2M)
7
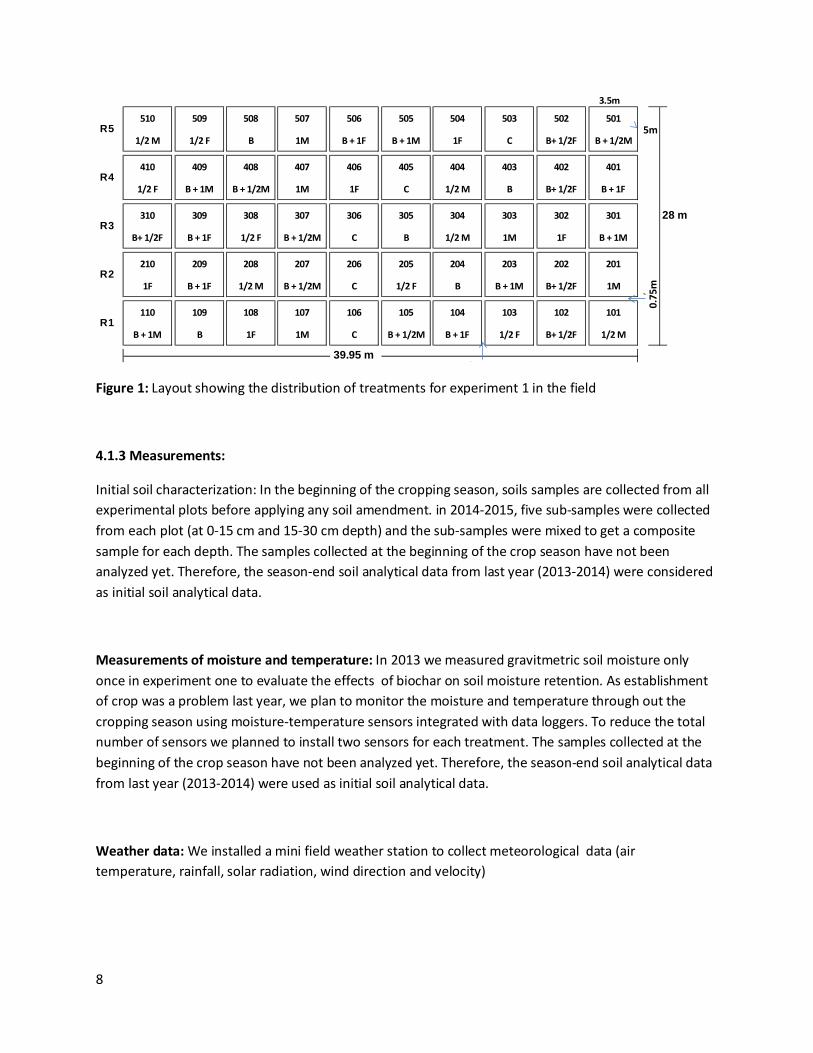
Figure 1: Layout showing the distribution of treatments for experiment 1 in the field
4.1.3 Measurements:
Initial soil characterization: In the beginning of the cropping season, soils samples are collected from all experimental plots before applying any soil amendment. in 2014-2015, five sub-samples were collected from each plot (at 0-15 cm and 15-30 cm depth) and the sub-samples were mixed to get a composite sample for each depth. The samples collected at the beginning of the crop season have not been analyzed yet. Therefore, the season-end soil analytical data from last year (2013-2014) were considered as initial soil analytical data.
Measurements of moisture and temperature: In 2013 we measured gravitmetric soil moisture only once in experiment one to evaluate the effects of biochar on soil moisture retention. As establishment of crop was a problem last year, we plan to monitor the moisture and temperature through out the cropping season using moisture-temperature sensors integrated with data loggers. To reduce the total number of sensors we planned to install two sensors for each treatment. The samples collected at the beginning of the crop season have not been analyzed yet. Therefore, the season-end soil analytical data from last year (2013-2014) were used as initial soil analytical data.
Weather data: We installed a mini field weather station to collect meteorological data (air temperature, rainfall, solar radiation, wind direction and velocity)
3.5m
510 509 508 507 506 505 504 503 502 501
1/2 M 1/2 F B 1M B + 1F B + 1M 1F C B+ 1/2F B + 1/2M
410 409 408 407 406 405 404 403 402 401
1/2 F B + 1M B + 1/2M 1M 1F C 1/2 M B B+ 1/2F B + 1F
310 309 308 307 306 305 304 303 302 301 28 m
B+ 1/2F B + 1F 1/2 F B + 1/2M C B 1/2 M 1M 1F B + 1M
210 209 208 207 206 205 204 203 202 201
1F B + 1F 1/2 M B + 1/2M C 1/2 F B B + 1M B+ 1/2F 1M
110 109 108 107 106 105 104 103 102 101
B + 1M B 1F 1M C B + 1/2M B + 1F 1/2 F B+ 1/2F 1/2 M
R5
R4
R3
R2
R1
0.75
m
39.95 m
5m
0 55
8
Harvesting: Harvesting was done during 09-16 September, 2014. It was not possible to complete all harvesting in one day as the size of the experiment was big and there was rain which interrupted our work. All plants in the experimental plots were harvested to calculate the yield. Plants were separated into leaf and root portions and weighed separately, soon after harvest. After recording the fresh weight, leaves and root samples were weighed and kept for chemical analysis.
Season end soil characterization: Soil samples from 0-15 cm and 15-30 cm were collected after harvesting was completed. Five sub-samples were collected from each plot at each depth and mixed to get a composite sample for each depth. The composite samples were analyzed to determine their content of organic matter, pH, CEC, EC, P, K, Ca, Mg, Fe, Mn, Zn, Cu and B.
Sample preparation: All soil samples were air-dried and sieved using 2mm sieve prior to ship to the lab for analysis. The root and leaf samples were cleaned thoroughly with tap water, the roots were cut into thin pieces with knife/ kitchen slicer and both leaf and root samples were oven-dried before grinding with a Wiley mini mill.
4.2 Experiment Two: Effect of biochar rates on soil fertility and crop productivity in sandy soils of Happy Valley-goose Bay, Labrador.
The objective of this experiment was to study the response of crop yield and, soil properties and nutrients movement in the soil to increasing rates of biochar application.
4.2.1 Crop:
In 2014-2015, beet (variety: Red Ace) was grown as a test crop. Beet seeds were sown on June 20-22, 2014 (because of rain sowing of two blocks were completed on June 20th and the other two blocks on June 22nd) , using a 2-rows hand seeding device (JP-3/Jang Automation Co., Ltd) with an inter-row spacing of 30cm. The seeds were placed at a depth of approximately 2 cm, with a rate of 16-20 seeds per meter. Thinning was planned to adjust the population to the final desired 8-10 plants per meter of row at the 4 real leaf stage. Standard organic methods of pest management practices will be followed. Weeds will be physically removed and row cover will be used to control pest infestations where necessary. The crop under this study was grown completely under rain fed conditions and, therefore, no supplemental irrigation was provided.
9
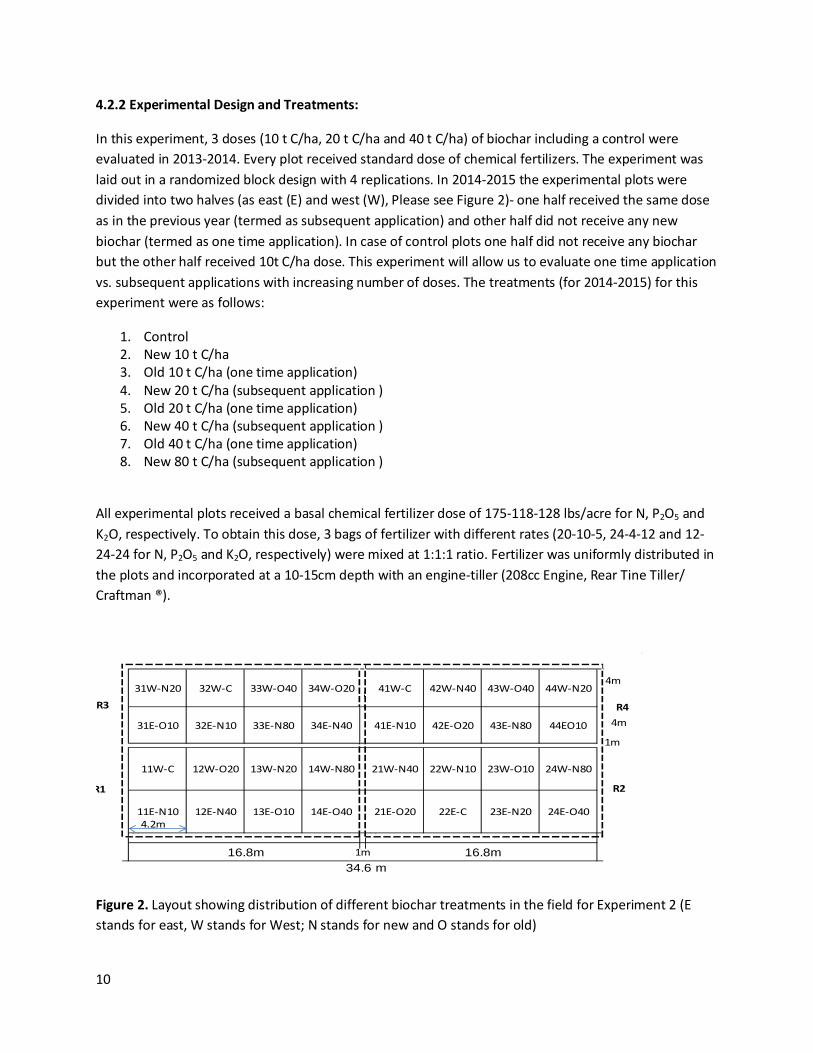
4.2.2 Experimental Design and Treatments:
In this experiment, 3 doses (10 t C/ha, 20 t C/ha and 40 t C/ha) of biochar including a control were evaluated in 2013-2014. Every plot received standard dose of chemical fertilizers. The experiment was laid out in a randomized block design with 4 replications. In 2014-2015 the experimental plots were divided into two halves (as east (E) and west (W), Please see Figure 2)- one half received the same dose as in the previous year (termed as subsequent application) and other half did not receive any new biochar (termed as one time application). In case of control plots one half did not receive any biochar but the other half received 10t C/ha dose. This experiment will allow us to evaluate one time application vs. subsequent applications with increasing number of doses. The treatments (for 2014-2015) for this experiment were as follows:
1. Control 2. New 10 t C/ha 3. Old 10 t C/ha (one time application) 4. New 20 t C/ha (subsequent application ) 5. Old 20 t C/ha (one time application) 6. New 40 t C/ha (subsequent application ) 7. Old 40 t C/ha (one time application) 8. New 80 t C/ha (subsequent application )
All experimental plots received a basal chemical fertilizer dose of 175-118-128 lbs/acre for N, P2O5 and K2O, respectively. To obtain this dose, 3 bags of fertilizer with different rates (20-10-5, 24-4-12 and 12-24-24 for N, P2O5 and K2O, respectively) were mixed at 1:1:1 ratio. Fertilizer was uniformly distributed in the plots and incorporated at a 10-15cm depth with an engine-tiller (208cc Engine, Rear Tine Tiller/ Craftman ®).
Figure 2. Layout showing distribution of different biochar treatments in the field for Experiment 2 (E stands for east, W stands for West; N stands for new and O stands for old)
31W-N20 32W-C 33W-O40 34W-O20 41W-C 42W-N40 43W-O40 44W-N20
31E-O10 32E-N10 33E-N80 34E-N40 41E-N10 42E-O20 43E-N80 44EO10
11W-C 12W-O20 13W-N20 14W-N80 21W-N40 22W-N10 23W-O10 24W-N80
11E-N10 12E-N40 13E-O10 14E-O40 21E-O20 22E-C 23E-N20 24E-O40
W W
16.8m
8m
16.8m
4m
1m34.6 m
1m
R4
R2
R3
R1
4m
4.2m
10
4.2.3 Measurements:
Initial soil characterization: In the beginning of the crop season, soils samples are collected from all experimental plots before applying any soil amendment. In 2014-2015, five sub-samples were collected from each plot (at 0-15 cm and 15-30 cm depth) and the sub-samples were mixed to get a composite sample for each depth. The composite samples will be analyzed to determine, organic matter, pH, CEC, EC, P, K, Ca, Mg, Fe, Mn, Zn, Cu and B. The samples collected at the beginning of the crop season have not been analyzed yet. Therefore, the season-end soil analytical data from last year (2013-2014) were used as initial soil analytical data.
Measurements of moisture and temperature: In 2014-2015 we measured volumetric soil moisture and temperature through out the cropping season using moisture-temperature sensors integrated with data loggers. To reduce the total number of sensors we planned to install two sensors for each treatment. The loggers were set to collect moisture and temperature data in every five minutes which gave us more than 25000 measurements during the cropping season (June 23-September 23, 2014).
Weather data: We installed a mini field weather station to collect meteorological data (air temperature, rainfall, solar radiation, wind direction and velocity)
Harvesting: Harvesting was done on September 16, 2014. A wooden frame (inside area: 2m x 1m) was placed at the centre of each experimental plot and the plants inside the frame (total area 2m2) were harvested to calculate the yield. Plants were separated into leaf and root portions and weighed separately, soon after harvest. After recording the fresh weight, leaves and root samples were weighed and kept for chemical analysis.
Season end soil characterization: Soil samples from 0-15 cm and 15-30 cm were collected after harvesting was completed. Five sub-samples were collected from each plot at each depth and mixed to get a composite sample for each depth. The composite samples were analyzed to determine their content of organic matter, pH, CEC, EC, P, K, Ca, Mg, Fe, Mn, Zn, Cu and B.
Sample preparation: All soil samples were air-dried and sieved using 2mm sieve prior to ship to the lab for analysis. The root and leaf samples were cleaned thoroughly with tap water, the roots were cut into thin pieces with knife/ kitchen slicer and both leaf and root samples were oven-dried before grinding with a Wiley mini mill.
11
5. Results and Discussion
5.1 Experiment One
5.1.1 Effect of biochar on plant growth and yield:
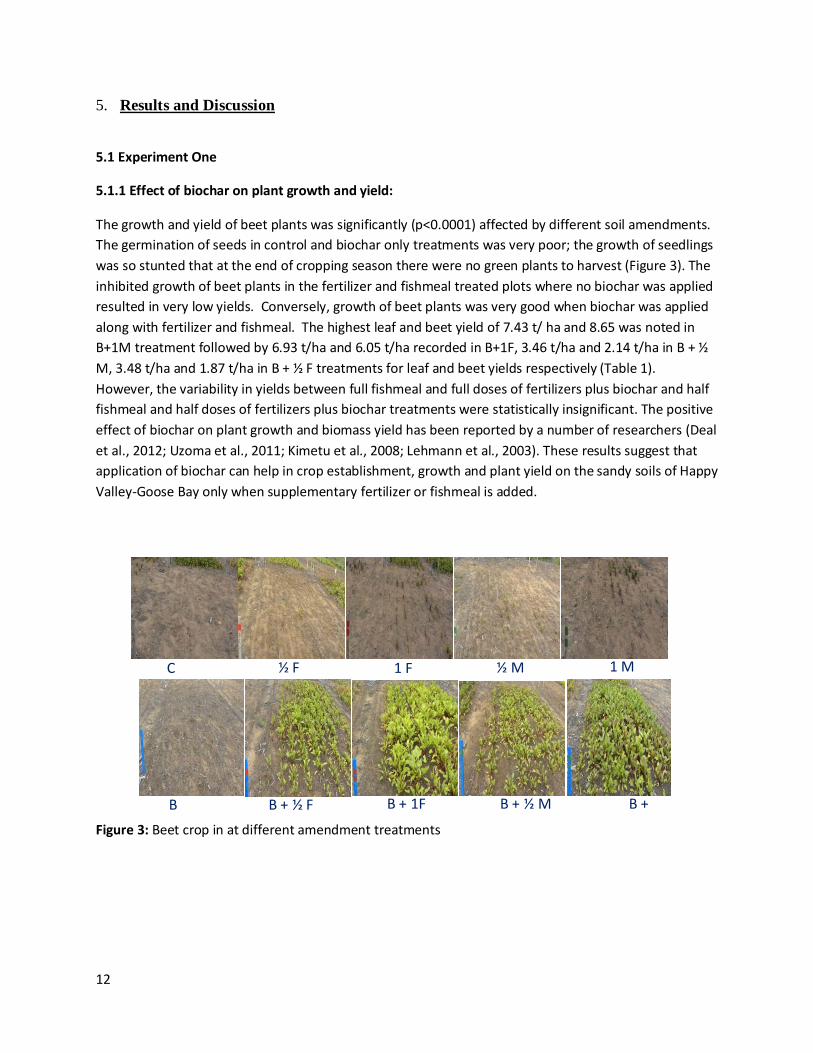
The growth and yield of beet plants was significantly (p<0.0001) affected by different soil amendments. The germination of seeds in control and biochar only treatments was very poor; the growth of seedlings was so stunted that at the end of cropping season there were no green plants to harvest (Figure 3). The inhibited growth of beet plants in the fertilizer and fishmeal treated plots where no biochar was applied resulted in very low yields. Conversely, growth of beet plants was very good when biochar was applied along with fertilizer and fishmeal. The highest leaf and beet yield of 7.43 t/ ha and 8.65 was noted in B+1M treatment followed by 6.93 t/ha and 6.05 t/ha recorded in B+1F, 3.46 t/ha and 2.14 t/ha in B + ½ M, 3.48 t/ha and 1.87 t/ha in B + ½ F treatments for leaf and beet yields respectively (Table 1). However, the variability in yields between full fishmeal and full doses of fertilizers plus biochar and half fishmeal and half doses of fertilizers plus biochar treatments were statistically insignificant. The positive effect of biochar on plant growth and biomass yield has been reported by a number of researchers (Deal et al., 2012; Uzoma et al., 2011; Kimetu et al., 2008; Lehmann et al., 2003). These results suggest that application of biochar can help in crop establishment, growth and plant yield on the sandy soils of Happy Valley-Goose Bay only when supplementary fertilizer or fishmeal is added.
Figure 3: Beet crop in at different amendment treatments
½ F C 1 F ½ M 1 M
B + ½ F B B + 1F B + ½ M B +
12
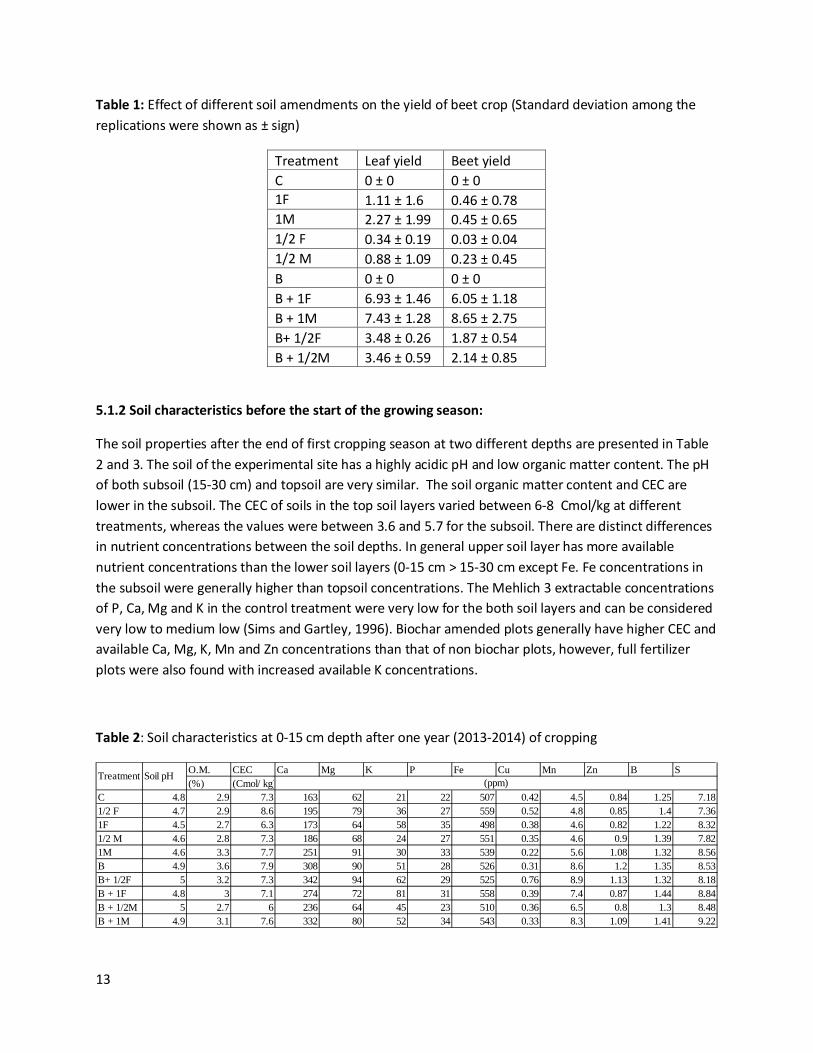
Table 1: Effect of different soil amendments on the yield of beet crop (Standard deviation among the replications were shown as ± sign)
Treatment Leaf yield Beet yield C 0 ± 0 0 ± 0 1F 1.11 ± 1.6 0.46 ± 0.78 1M 2.27 ± 1.99 0.45 ± 0.65 1/2 F 0.34 ± 0.19 0.03 ± 0.04 1/2 M 0.88 ± 1.09 0.23 ± 0.45 B 0 ± 0 0 ± 0 B + 1F 6.93 ± 1.46 6.05 ± 1.18 B + 1M 7.43 ± 1.28 8.65 ± 2.75 B+ 1/2F 3.48 ± 0.26 1.87 ± 0.54 B + 1/2M 3.46 ± 0.59 2.14 ± 0.85
5.1.2 Soil characteristics before the start of the growing season:
The soil properties after the end of first cropping season at two different depths are presented in Table 2 and 3. The soil of the experimental site has a highly acidic pH and low organic matter content. The pH of both subsoil (15-30 cm) and topsoil are very similar. The soil organic matter content and CEC are lower in the subsoil. The CEC of soils in the top soil layers varied between 6-8 Cmol/kg at different treatments, whereas the values were between 3.6 and 5.7 for the subsoil. There are distinct differences in nutrient concentrations between the soil depths. In general upper soil layer has more available nutrient concentrations than the lower soil layers (0-15 cm > 15-30 cm except Fe. Fe concentrations in the subsoil were generally higher than topsoil concentrations. The Mehlich 3 extractable concentrations of P, Ca, Mg and K in the control treatment were very low for the both soil layers and can be considered very low to medium low (Sims and Gartley, 1996). Biochar amended plots generally have higher CEC and available Ca, Mg, K, Mn and Zn concentrations than that of non biochar plots, however, full fertilizer plots were also found with increased available K concentrations.
Table 2: Soil characteristics at 0-15 cm depth after one year (2013-2014) of cropping
O.M. CEC Ca Mg K P Fe Cu Mn Zn B S(%) (Cmol/ kg)
C 4.8 2.9 7.3 163 62 21 22 507 0.42 4.5 0.84 1.25 7.181/2 F 4.7 2.9 8.6 195 79 36 27 559 0.52 4.8 0.85 1.4 7.361F 4.5 2.7 6.3 173 64 58 35 498 0.38 4.6 0.82 1.22 8.321/2 M 4.6 2.8 7.3 186 68 24 27 551 0.35 4.6 0.9 1.39 7.821M 4.6 3.3 7.7 251 91 30 33 539 0.22 5.6 1.08 1.32 8.56B 4.9 3.6 7.9 308 90 51 28 526 0.31 8.6 1.2 1.35 8.53B+ 1/2F 5 3.2 7.3 342 94 62 29 525 0.76 8.9 1.13 1.32 8.18B + 1F 4.8 3 7.1 274 72 81 31 558 0.39 7.4 0.87 1.44 8.84B + 1/2M 5 2.7 6 236 64 45 23 510 0.36 6.5 0.8 1.3 8.48B + 1M 4.9 3.1 7.6 332 80 52 34 543 0.33 8.3 1.09 1.41 9.22
Treatment Soil pH(ppm)
13
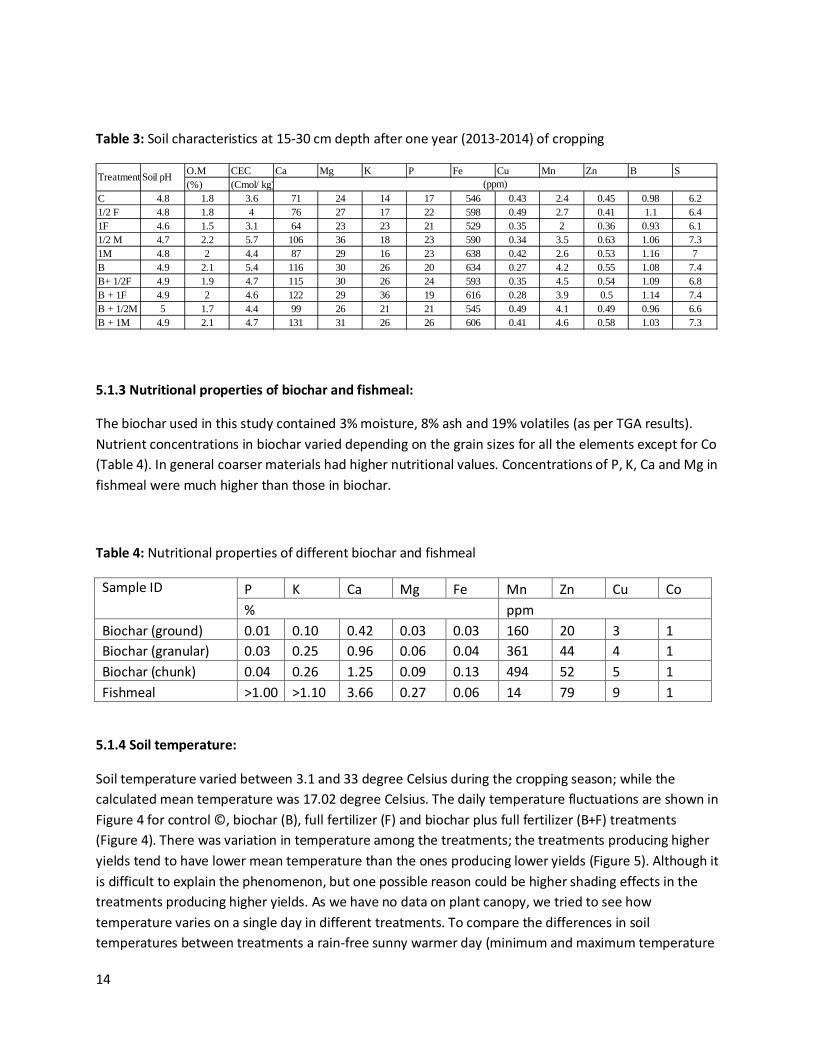
Table 3: Soil characteristics at 15-30 cm depth after one year (2013-2014) of cropping
5.1.3 Nutritional properties of biochar and fishmeal:
The biochar used in this study contained 3% moisture, 8% ash and 19% volatiles (as per TGA results). Nutrient concentrations in biochar varied depending on the grain sizes for all the elements except for Co (Table 4). In general coarser materials had higher nutritional values. Concentrations of P, K, Ca and Mg in fishmeal were much higher than those in biochar.
Table 4: Nutritional properties of different biochar and fishmeal
Sample ID P K Ca Mg Fe Mn Zn Cu Co % ppm
Biochar (ground) 0.01 0.10 0.42 0.03 0.03 160 20 3 1 Biochar (granular) 0.03 0.25 0.96 0.06 0.04 361 44 4 1 Biochar (chunk) 0.04 0.26 1.25 0.09 0.13 494 52 5 1 Fishmeal >1.00 >1.10 3.66 0.27 0.06 14 79 9 1
5.1.4 Soil temperature:
Soil temperature varied between 3.1 and 33 degree Celsius during the cropping season; while the calculated mean temperature was 17.02 degree Celsius. The daily temperature fluctuations are shown in Figure 4 for control ©, biochar (B), full fertilizer (F) and biochar plus full fertilizer (B+F) treatments (Figure 4). There was variation in temperature among the treatments; the treatments producing higher yields tend to have lower mean temperature than the ones producing lower yields (Figure 5). Although it is difficult to explain the phenomenon, but one possible reason could be higher shading effects in the treatments producing higher yields. As we have no data on plant canopy, we tried to see how temperature varies on a single day in different treatments. To compare the differences in soil temperatures between treatments a rain-free sunny warmer day (minimum and maximum temperature
O.M CEC Ca Mg K P Fe Cu Mn Zn B S(%) (Cmol/ kg)
C 4.8 1.8 3.6 71 24 14 17 546 0.43 2.4 0.45 0.98 6.21/2 F 4.8 1.8 4 76 27 17 22 598 0.49 2.7 0.41 1.1 6.41F 4.6 1.5 3.1 64 23 23 21 529 0.35 2 0.36 0.93 6.11/2 M 4.7 2.2 5.7 106 36 18 23 590 0.34 3.5 0.63 1.06 7.31M 4.8 2 4.4 87 29 16 23 638 0.42 2.6 0.53 1.16 7B 4.9 2.1 5.4 116 30 26 20 634 0.27 4.2 0.55 1.08 7.4B+ 1/2F 4.9 1.9 4.7 115 30 26 24 593 0.35 4.5 0.54 1.09 6.8B + 1F 4.9 2 4.6 122 29 36 19 616 0.28 3.9 0.5 1.14 7.4B + 1/2M 5 1.7 4.4 99 26 21 21 545 0.49 4.1 0.49 0.96 6.6B + 1M 4.9 2.1 4.7 131 31 26 26 606 0.41 4.6 0.58 1.03 7.3
Treatment Soil pH (ppm)
14
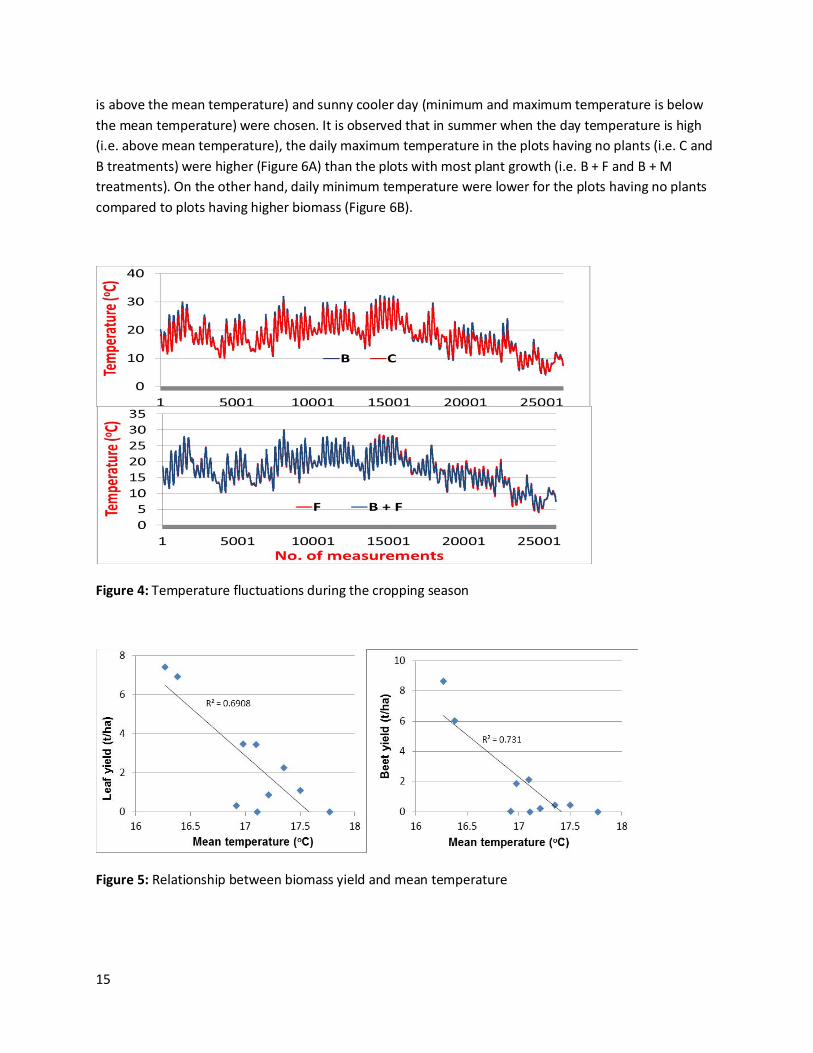
is above the mean temperature) and sunny cooler day (minimum and maximum temperature is below the mean temperature) were chosen. It is observed that in summer when the day temperature is high (i.e. above mean temperature), the daily maximum temperature in the plots having no plants (i.e. C and B treatments) were higher (Figure 6A) than the plots with most plant growth (i.e. B + F and B + M treatments). On the other hand, daily minimum temperature were lower for the plots having no plants compared to plots having higher biomass (Figure 6B).
Figure 4: Temperature fluctuations during the cropping season
Figure 5: Relationship between biomass yield and mean temperature
15
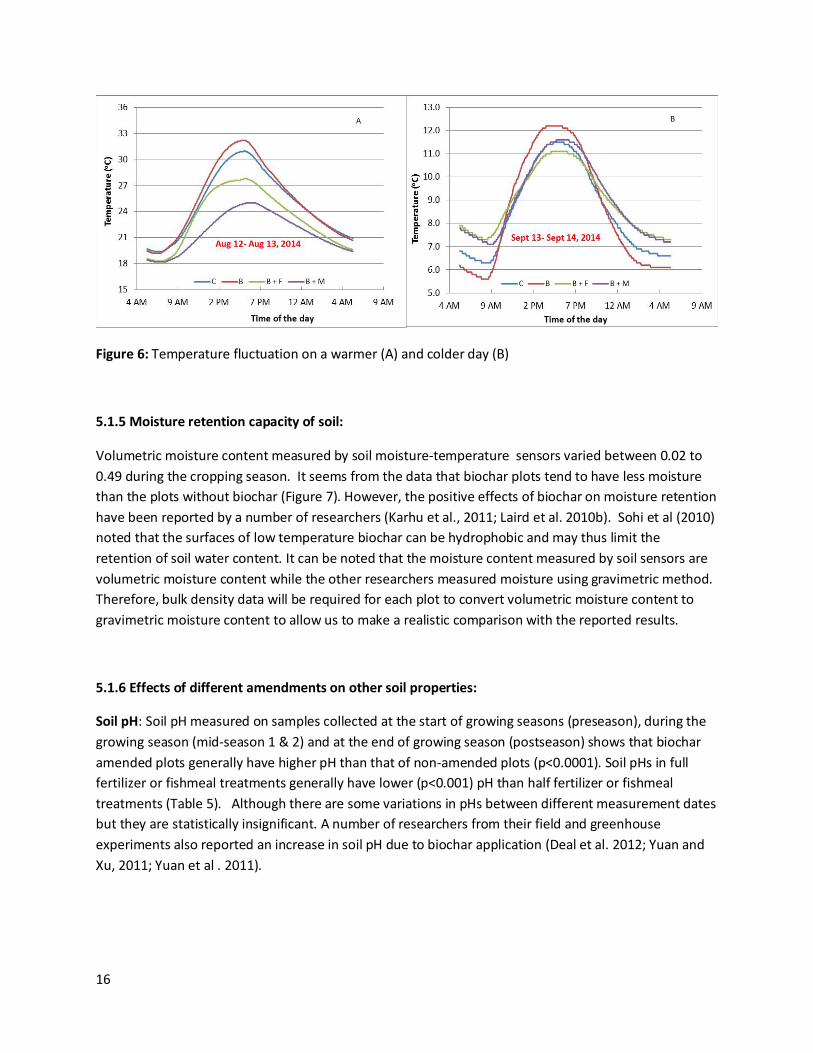
Figure 6: Temperature fluctuation on a warmer (A) and colder day (B)
5.1.5 Moisture retention capacity of soil:
Volumetric moisture content measured by soil moisture-temperature sensors varied between 0.02 to 0.49 during the cropping season. It seems from the data that biochar plots tend to have less moisture than the plots without biochar (Figure 7). However, the positive effects of biochar on moisture retention have been reported by a number of researchers (Karhu et al., 2011; Laird et al. 2010b). Sohi et al (2010) noted that the surfaces of low temperature biochar can be hydrophobic and may thus limit the retention of soil water content. It can be noted that the moisture content measured by soil sensors are volumetric moisture content while the other researchers measured moisture using gravimetric method. Therefore, bulk density data will be required for each plot to convert volumetric moisture content to gravimetric moisture content to allow us to make a realistic comparison with the reported results.
5.1.6 Effects of different amendments on other soil properties:
Soil pH: Soil pH measured on samples collected at the start of growing seasons (preseason), during the growing season (mid-season 1 & 2) and at the end of growing season (postseason) shows that biochar amended plots generally have higher pH than that of non-amended plots (p<0.0001). Soil pHs in full fertilizer or fishmeal treatments generally have lower (p<0.001) pH than half fertilizer or fishmeal treatments (Table 5). Although there are some variations in pHs between different measurement dates but they are statistically insignificant. A number of researchers from their field and greenhouse experiments also reported an increase in soil pH due to biochar application (Deal et al. 2012; Yuan and Xu, 2011; Yuan et al . 2011).
16
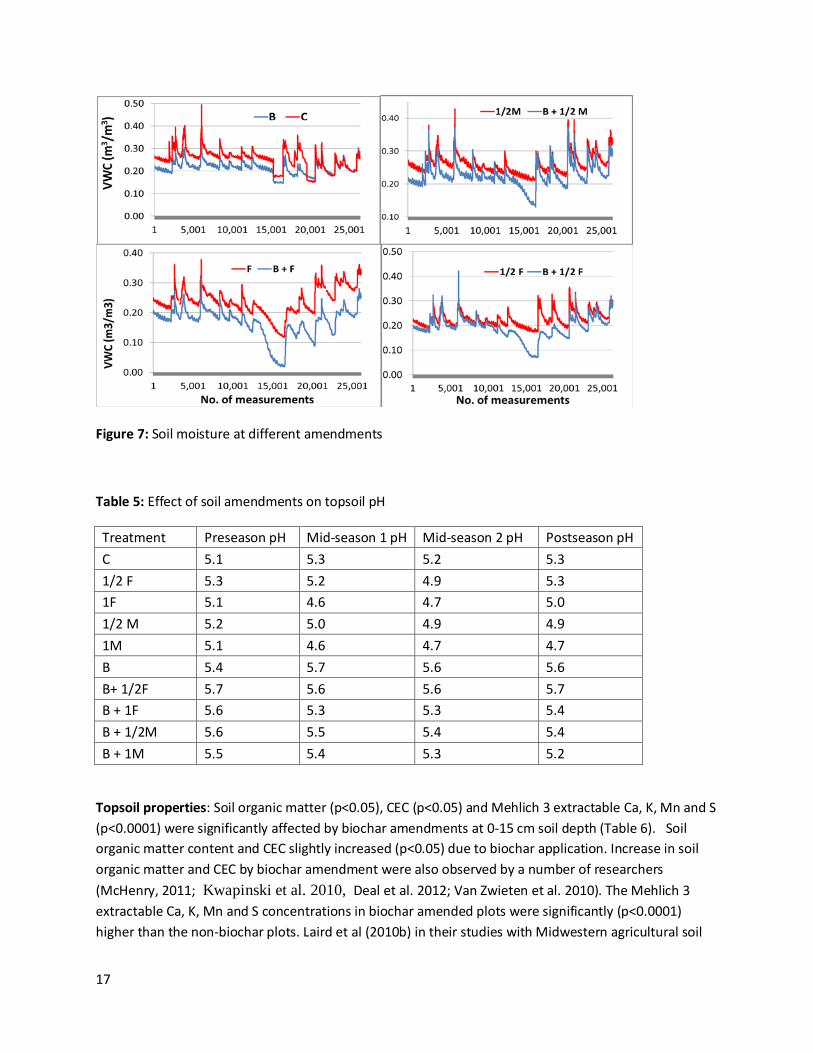
Figure 7: Soil moisture at different amendments
Table 5: Effect of soil amendments on topsoil pH
Treatment Preseason pH Mid-season 1 pH Mid-season 2 pH Postseason pH C 5.1 5.3 5.2 5.3 1/2 F 5.3 5.2 4.9 5.3 1F 5.1 4.6 4.7 5.0 1/2 M 5.2 5.0 4.9 4.9 1M 5.1 4.6 4.7 4.7 B 5.4 5.7 5.6 5.6 B+ 1/2F 5.7 5.6 5.6 5.7 B + 1F 5.6 5.3 5.3 5.4 B + 1/2M 5.6 5.5 5.4 5.4 B + 1M 5.5 5.4 5.3 5.2
Topsoil properties: Soil organic matter (p<0.05), CEC (p<0.05) and Mehlich 3 extractable Ca, K, Mn and S (p<0.0001) were significantly affected by biochar amendments at 0-15 cm soil depth (Table 6). Soil organic matter content and CEC slightly increased (p<0.05) due to biochar application. Increase in soil organic matter and CEC by biochar amendment were also observed by a number of researchers (McHenry, 2011; Kwapinski et al. 2010, Deal et al. 2012; Van Zwieten et al. 2010). The Mehlich 3 extractable Ca, K, Mn and S concentrations in biochar amended plots were significantly (p<0.0001) higher than the non-biochar plots. Laird et al (2010b) in their studies with Midwestern agricultural soil
17
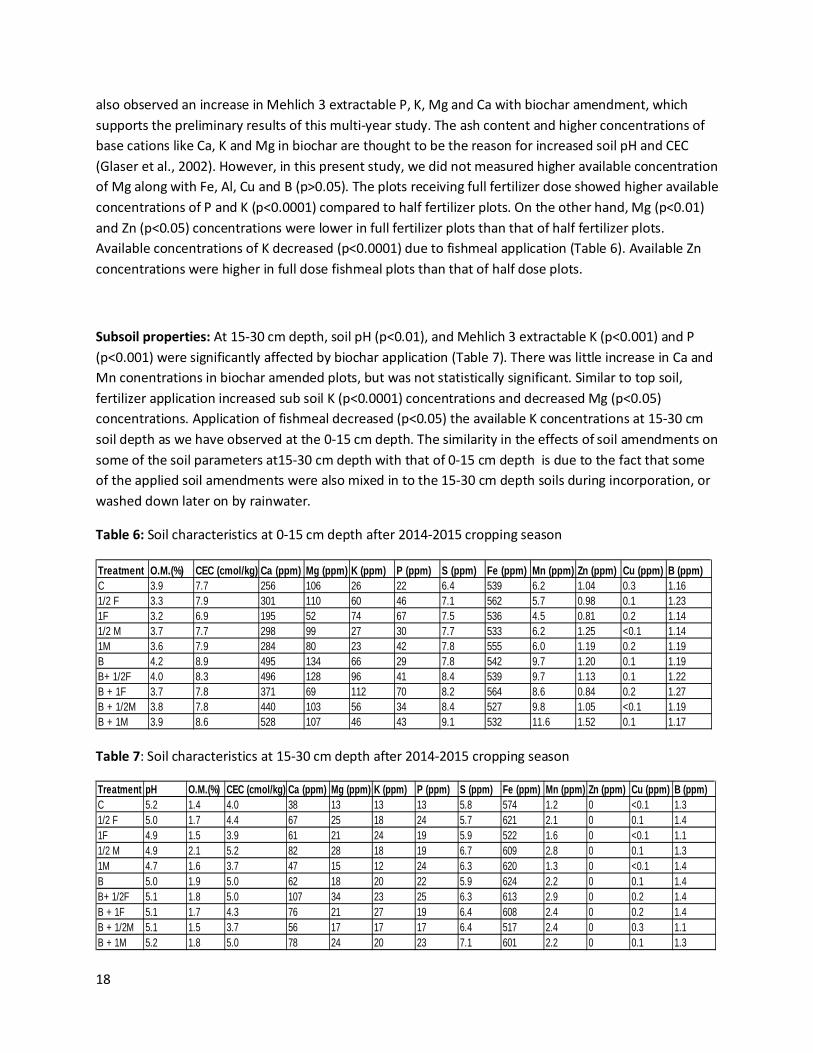
also observed an increase in Mehlich 3 extractable P, K, Mg and Ca with biochar amendment, which supports the preliminary results of this multi-year study. The ash content and higher concentrations of base cations like Ca, K and Mg in biochar are thought to be the reason for increased soil pH and CEC (Glaser et al., 2002). However, in this present study, we did not measured higher available concentration of Mg along with Fe, Al, Cu and B (p>0.05). The plots receiving full fertilizer dose showed higher available concentrations of P and K (p<0.0001) compared to half fertilizer plots. On the other hand, Mg (p<0.01) and Zn (p<0.05) concentrations were lower in full fertilizer plots than that of half fertilizer plots. Available concentrations of K decreased (p<0.0001) due to fishmeal application (Table 6). Available Zn concentrations were higher in full dose fishmeal plots than that of half dose plots.
Subsoil properties: At 15-30 cm depth, soil pH (p<0.01), and Mehlich 3 extractable K (p<0.001) and P (p<0.001) were significantly affected by biochar application (Table 7). There was little increase in Ca and Mn conentrations in biochar amended plots, but was not statistically significant. Similar to top soil, fertilizer application increased sub soil K (p<0.0001) concentrations and decreased Mg (p<0.05) concentrations. Application of fishmeal decreased (p<0.05) the available K concentrations at 15-30 cm soil depth as we have observed at the 0-15 cm depth. The similarity in the effects of soil amendments on some of the soil parameters at15-30 cm depth with that of 0-15 cm depth is due to the fact that some of the applied soil amendments were also mixed in to the 15-30 cm depth soils during incorporation, or washed down later on by rainwater.
Table 6: Soil characteristics at 0-15 cm depth after 2014-2015 cropping season
Table 7: Soil characteristics at 15-30 cm depth after 2014-2015 cropping season
Treatment O.M.(%) CEC (cmol/kg) Ca (ppm) Mg (ppm) K (ppm) P (ppm) S (ppm) Fe (ppm) Mn (ppm) Zn (ppm) Cu (ppm) B (ppm)C 3.9 7.7 256 106 26 22 6.4 539 6.2 1.04 0.3 1.161/2 F 3.3 7.9 301 110 60 46 7.1 562 5.7 0.98 0.1 1.231F 3.2 6.9 195 52 74 67 7.5 536 4.5 0.81 0.2 1.141/2 M 3.7 7.7 298 99 27 30 7.7 533 6.2 1.25 <0.1 1.141M 3.6 7.9 284 80 23 42 7.8 555 6.0 1.19 0.2 1.19B 4.2 8.9 495 134 66 29 7.8 542 9.7 1.20 0.1 1.19B+ 1/2F 4.0 8.3 496 128 96 41 8.4 539 9.7 1.13 0.1 1.22B + 1F 3.7 7.8 371 69 112 70 8.2 564 8.6 0.84 0.2 1.27B + 1/2M 3.8 7.8 440 103 56 34 8.4 527 9.8 1.05 <0.1 1.19B + 1M 3.9 8.6 528 107 46 43 9.1 532 11.6 1.52 0.1 1.17
Treatment pH O.M.(%) CEC (cmol/kg) Ca (ppm) Mg (ppm) K (ppm) P (ppm) S (ppm) Fe (ppm) Mn (ppm) Zn (ppm) Cu (ppm) B (ppm)C 5.2 1.4 4.0 38 13 13 13 5.8 574 1.2 0 <0.1 1.31/2 F 5.0 1.7 4.4 67 25 18 24 5.7 621 2.1 0 0.1 1.41F 4.9 1.5 3.9 61 21 24 19 5.9 522 1.6 0 <0.1 1.11/2 M 4.9 2.1 5.2 82 28 18 19 6.7 609 2.8 0 0.1 1.31M 4.7 1.6 3.7 47 15 12 24 6.3 620 1.3 0 <0.1 1.4B 5.0 1.9 5.0 62 18 20 22 5.9 624 2.2 0 0.1 1.4B+ 1/2F 5.1 1.8 5.0 107 34 23 25 6.3 613 2.9 0 0.2 1.4B + 1F 5.1 1.7 4.3 76 21 27 19 6.4 608 2.4 0 0.2 1.4B + 1/2M 5.1 1.5 3.7 56 17 17 17 6.4 517 2.4 0 0.3 1.1B + 1M 5.2 1.8 5.0 78 24 20 23 7.1 601 2.2 0 0.1 1.3
18
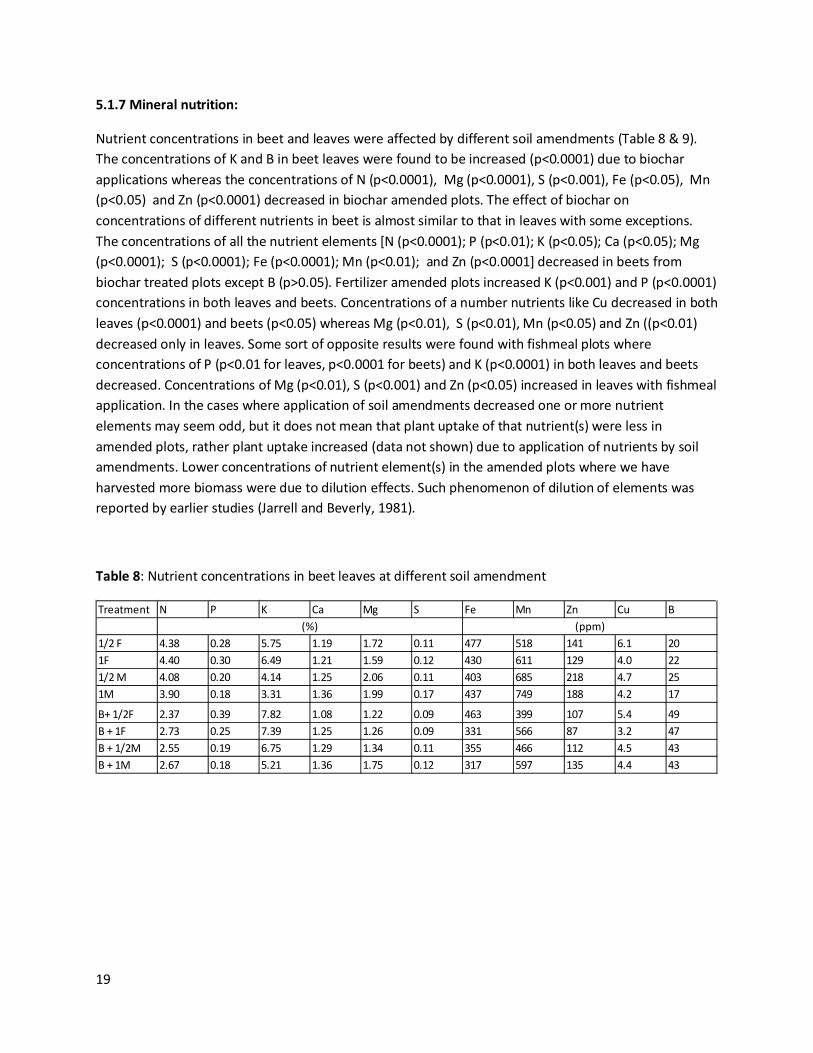
5.1.7 Mineral nutrition:
Nutrient concentrations in beet and leaves were affected by different soil amendments (Table 8 & 9). The concentrations of K and B in beet leaves were found to be increased (p<0.0001) due to biochar applications whereas the concentrations of N (p<0.0001), Mg (p<0.0001), S (p<0.001), Fe (p<0.05), Mn (p<0.05) and Zn (p<0.0001) decreased in biochar amended plots. The effect of biochar on concentrations of different nutrients in beet is almost similar to that in leaves with some exceptions. The concentrations of all the nutrient elements [N (p<0.0001); P (p<0.01); K (p<0.05); Ca (p<0.05); Mg (p<0.0001); S (p<0.0001); Fe (p<0.0001); Mn (p<0.01); and Zn (p<0.0001] decreased in beets from biochar treated plots except B (p>0.05). Fertilizer amended plots increased K (p<0.001) and P (p<0.0001) concentrations in both leaves and beets. Concentrations of a number nutrients like Cu decreased in both leaves (p<0.0001) and beets (p<0.05) whereas Mg (p<0.01), S (p<0.01), Mn (p<0.05) and Zn ((p<0.01) decreased only in leaves. Some sort of opposite results were found with fishmeal plots where concentrations of P (p<0.01 for leaves, p<0.0001 for beets) and K (p<0.0001) in both leaves and beets decreased. Concentrations of Mg (p<0.01), S (p<0.001) and Zn (p<0.05) increased in leaves with fishmeal application. In the cases where application of soil amendments decreased one or more nutrient elements may seem odd, but it does not mean that plant uptake of that nutrient(s) were less in amended plots, rather plant uptake increased (data not shown) due to application of nutrients by soil amendments. Lower concentrations of nutrient element(s) in the amended plots where we have harvested more biomass were due to dilution effects. Such phenomenon of dilution of elements was reported by earlier studies (Jarrell and Beverly, 1981).
Table 8: Nutrient concentrations in beet leaves at different soil amendment
Treatment N P K Ca Mg S Fe Mn Zn Cu B
1/2 F 4.38 0.28 5.75 1.19 1.72 0.11 477 518 141 6.1 201F 4.40 0.30 6.49 1.21 1.59 0.12 430 611 129 4.0 221/2 M 4.08 0.20 4.14 1.25 2.06 0.11 403 685 218 4.7 251M 3.90 0.18 3.31 1.36 1.99 0.17 437 749 188 4.2 17
B+ 1/2F 2.37 0.39 7.82 1.08 1.22 0.09 463 399 107 5.4 49B + 1F 2.73 0.25 7.39 1.25 1.26 0.09 331 566 87 3.2 47B + 1/2M 2.55 0.19 6.75 1.29 1.34 0.11 355 466 112 4.5 43B + 1M 2.67 0.18 5.21 1.36 1.75 0.12 317 597 135 4.4 43
(%) (ppm)
19
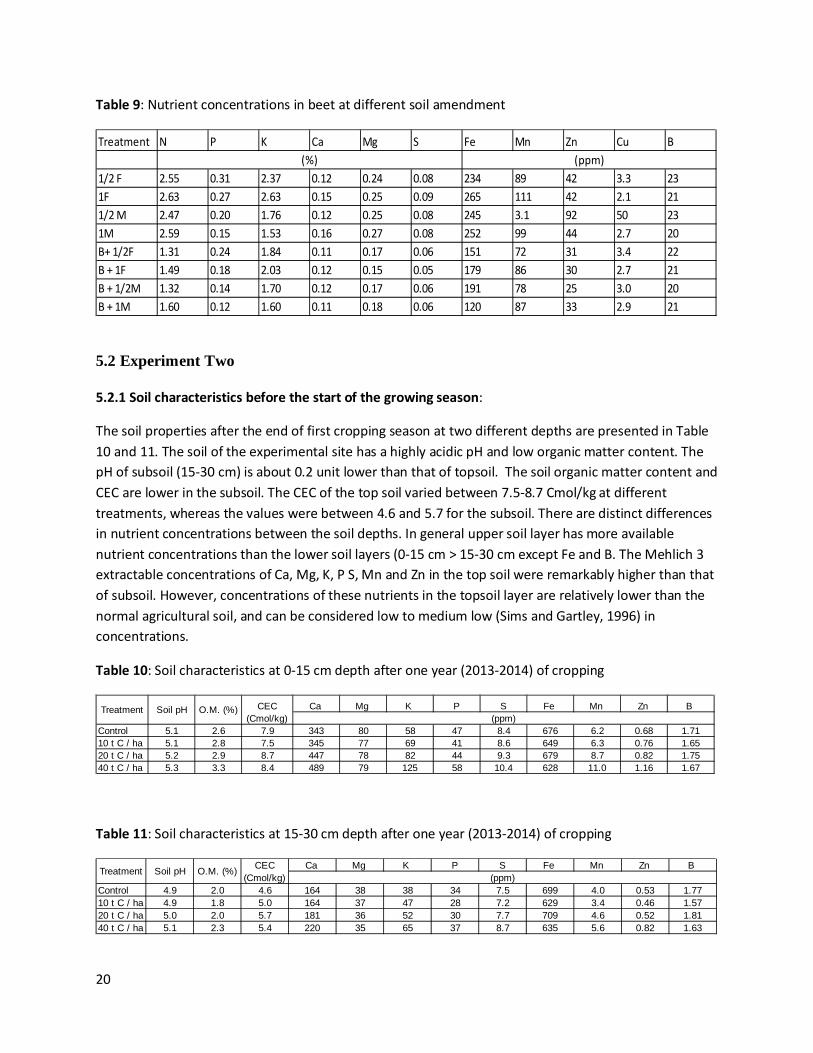
Table 9: Nutrient concentrations in beet at different soil amendment
5.2 Experiment Two
5.2.1 Soil characteristics before the start of the growing season:
The soil properties after the end of first cropping season at two different depths are presented in Table 10 and 11. The soil of the experimental site has a highly acidic pH and low organic matter content. The pH of subsoil (15-30 cm) is about 0.2 unit lower than that of topsoil. The soil organic matter content and CEC are lower in the subsoil. The CEC of the top soil varied between 7.5-8.7 Cmol/kg at different treatments, whereas the values were between 4.6 and 5.7 for the subsoil. There are distinct differences in nutrient concentrations between the soil depths. In general upper soil layer has more available nutrient concentrations than the lower soil layers (0-15 cm > 15-30 cm except Fe and B. The Mehlich 3 extractable concentrations of Ca, Mg, K, P S, Mn and Zn in the top soil were remarkably higher than that of subsoil. However, concentrations of these nutrients in the topsoil layer are relatively lower than the normal agricultural soil, and can be considered low to medium low (Sims and Gartley, 1996) in concentrations.
Table 10: Soil characteristics at 0-15 cm depth after one year (2013-2014) of cropping
Table 11: Soil characteristics at 15-30 cm depth after one year (2013-2014) of cropping
Treatment N P K Ca Mg S Fe Mn Zn Cu B
1/2 F 2.55 0.31 2.37 0.12 0.24 0.08 234 89 42 3.3 231F 2.63 0.27 2.63 0.15 0.25 0.09 265 111 42 2.1 211/2 M 2.47 0.20 1.76 0.12 0.25 0.08 245 3.1 92 50 231M 2.59 0.15 1.53 0.16 0.27 0.08 252 99 44 2.7 20B+ 1/2F 1.31 0.24 1.84 0.11 0.17 0.06 151 72 31 3.4 22B + 1F 1.49 0.18 2.03 0.12 0.15 0.05 179 86 30 2.7 21B + 1/2M 1.32 0.14 1.70 0.12 0.17 0.06 191 78 25 3.0 20B + 1M 1.60 0.12 1.60 0.11 0.18 0.06 120 87 33 2.9 21
(%) (ppm)
Ca Mg K P S Fe Mn Zn B
Control 5.1 2.6 7.9 343 80 58 47 8.4 676 6.2 0.68 1.7110 t C / ha 5.1 2.8 7.5 345 77 69 41 8.6 649 6.3 0.76 1.6520 t C / ha 5.2 2.9 8.7 447 78 82 44 9.3 679 8.7 0.82 1.7540 t C / ha 5.3 3.3 8.4 489 79 125 58 10.4 628 11.0 1.16 1.67
Soil pHTreatment O.M. (%) CEC (Cmol/kg) (ppm)
Ca Mg K P S Fe Mn Zn B
Control 4.9 2.0 4.6 164 38 38 34 7.5 699 4.0 0.53 1.7710 t C / ha 4.9 1.8 5.0 164 37 47 28 7.2 629 3.4 0.46 1.5720 t C / ha 5.0 2.0 5.7 181 36 52 30 7.7 709 4.6 0.52 1.8140 t C / ha 5.1 2.3 5.4 220 35 65 37 8.7 635 5.6 0.82 1.63
Treatment Soil pH O.M. (%) CEC (Cmol/kg) (ppm)
20
5.2.2 Moisture retention capacity:
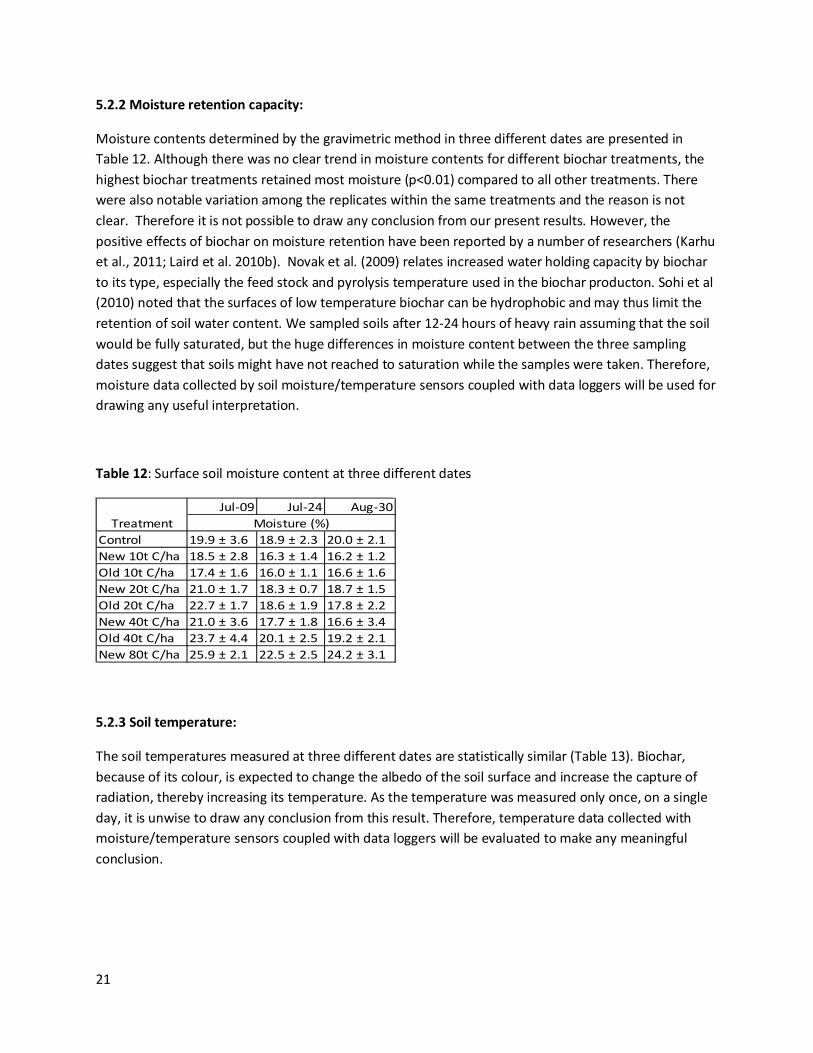
Moisture contents determined by the gravimetric method in three different dates are presented in Table 12. Although there was no clear trend in moisture contents for different biochar treatments, the highest biochar treatments retained most moisture (p<0.01) compared to all other treatments. There were also notable variation among the replicates within the same treatments and the reason is not clear. Therefore it is not possible to draw any conclusion from our present results. However, the positive effects of biochar on moisture retention have been reported by a number of researchers (Karhu et al., 2011; Laird et al. 2010b). Novak et al. (2009) relates increased water holding capacity by biochar to its type, especially the feed stock and pyrolysis temperature used in the biochar producton. Sohi et al (2010) noted that the surfaces of low temperature biochar can be hydrophobic and may thus limit the retention of soil water content. We sampled soils after 12-24 hours of heavy rain assuming that the soil would be fully saturated, but the huge differences in moisture content between the three sampling dates suggest that soils might have not reached to saturation while the samples were taken. Therefore, moisture data collected by soil moisture/temperature sensors coupled with data loggers will be used for drawing any useful interpretation.
Table 12: Surface soil moisture content at three different dates
5.2.3 Soil temperature:
The soil temperatures measured at three different dates are statistically similar (Table 13). Biochar, because of its colour, is expected to change the albedo of the soil surface and increase the capture of radiation, thereby increasing its temperature. As the temperature was measured only once, on a single day, it is unwise to draw any conclusion from this result. Therefore, temperature data collected with moisture/temperature sensors coupled with data loggers will be evaluated to make any meaningful conclusion.
Jul-09 Jul-24 Aug-30
Control 19.9 ± 3.6 18.9 ± 2.3 20.0 ± 2.1New 10t C/ha 18.5 ± 2.8 16.3 ± 1.4 16.2 ± 1.2 Old 10t C/ha 17.4 ± 1.6 16.0 ± 1.1 16.6 ± 1.6New 20t C/ha 21.0 ± 1.7 18.3 ± 0.7 18.7 ± 1.5Old 20t C/ha 22.7 ± 1.7 18.6 ± 1.9 17.8 ± 2.2New 40t C/ha 21.0 ± 3.6 17.7 ± 1.8 16.6 ± 3.4Old 40t C/ha 23.7 ± 4.4 20.1 ± 2.5 19.2 ± 2.1New 80t C/ha 25.9 ± 2.1 22.5 ± 2.5 24.2 ± 3.1
Moisture (%)Treatment
21
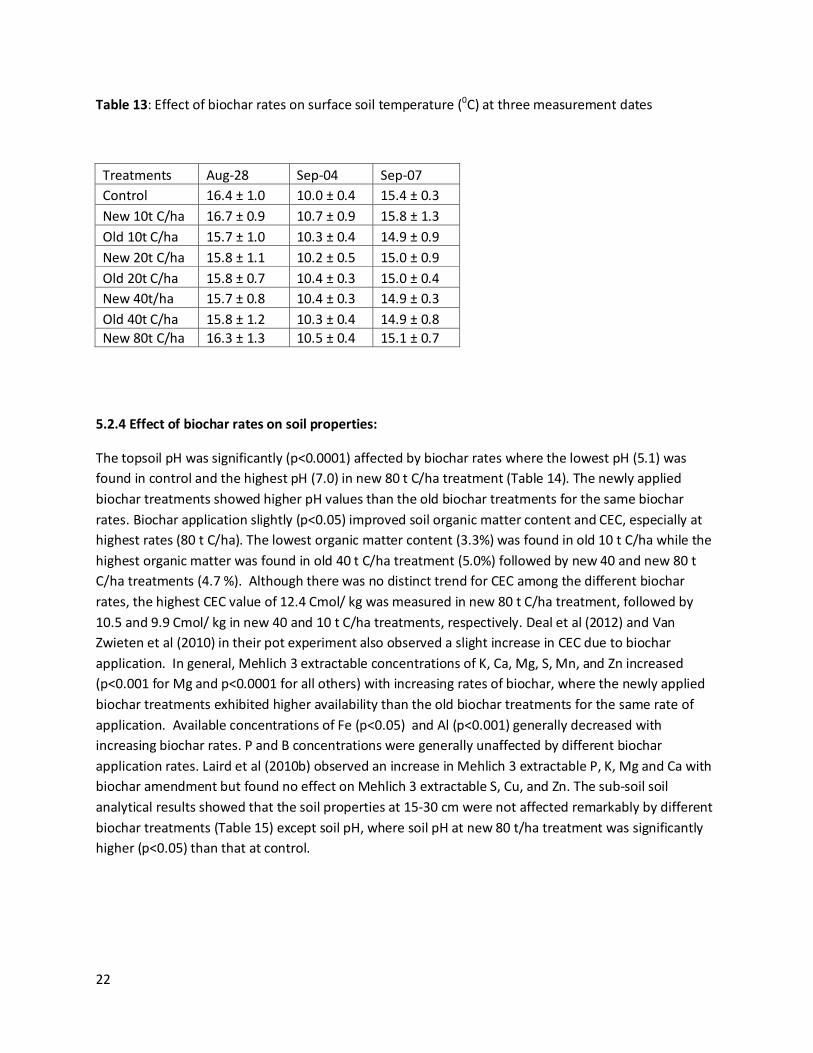
Table 13: Effect of biochar rates on surface soil temperature (0C) at three measurement dates
Treatments Aug-28 Sep-04 Sep-07 Control 16.4 ± 1.0 10.0 ± 0.4 15.4 ± 0.3 New 10t C/ha 16.7 ± 0.9 10.7 ± 0.9 15.8 ± 1.3 Old 10t C/ha 15.7 ± 1.0 10.3 ± 0.4 14.9 ± 0.9 New 20t C/ha 15.8 ± 1.1 10.2 ± 0.5 15.0 ± 0.9 Old 20t C/ha 15.8 ± 0.7 10.4 ± 0.3 15.0 ± 0.4 New 40t/ha 15.7 ± 0.8 10.4 ± 0.3 14.9 ± 0.3 Old 40t C/ha 15.8 ± 1.2 10.3 ± 0.4 14.9 ± 0.8 New 80t C/ha 16.3 ± 1.3 10.5 ± 0.4 15.1 ± 0.7
5.2.4 Effect of biochar rates on soil properties:
The topsoil pH was significantly (p<0.0001) affected by biochar rates where the lowest pH (5.1) was found in control and the highest pH (7.0) in new 80 t C/ha treatment (Table 14). The newly applied biochar treatments showed higher pH values than the old biochar treatments for the same biochar rates. Biochar application slightly (p<0.05) improved soil organic matter content and CEC, especially at highest rates (80 t C/ha). The lowest organic matter content (3.3%) was found in old 10 t C/ha while the highest organic matter was found in old 40 t C/ha treatment (5.0%) followed by new 40 and new 80 t C/ha treatments (4.7 %). Although there was no distinct trend for CEC among the different biochar rates, the highest CEC value of 12.4 Cmol/ kg was measured in new 80 t C/ha treatment, followed by 10.5 and 9.9 Cmol/ kg in new 40 and 10 t C/ha treatments, respectively. Deal et al (2012) and Van Zwieten et al (2010) in their pot experiment also observed a slight increase in CEC due to biochar application. In general, Mehlich 3 extractable concentrations of K, Ca, Mg, S, Mn, and Zn increased (p<0.001 for Mg and p<0.0001 for all others) with increasing rates of biochar, where the newly applied biochar treatments exhibited higher availability than the old biochar treatments for the same rate of application. Available concentrations of Fe (p<0.05) and Al (p<0.001) generally decreased with increasing biochar rates. P and B concentrations were generally unaffected by different biochar application rates. Laird et al (2010b) observed an increase in Mehlich 3 extractable P, K, Mg and Ca with biochar amendment but found no effect on Mehlich 3 extractable S, Cu, and Zn. The sub-soil soil analytical results showed that the soil properties at 15-30 cm were not affected remarkably by different biochar treatments (Table 15) except soil pH, where soil pH at new 80 t/ha treatment was significantly higher (p<0.05) than that at control.
22
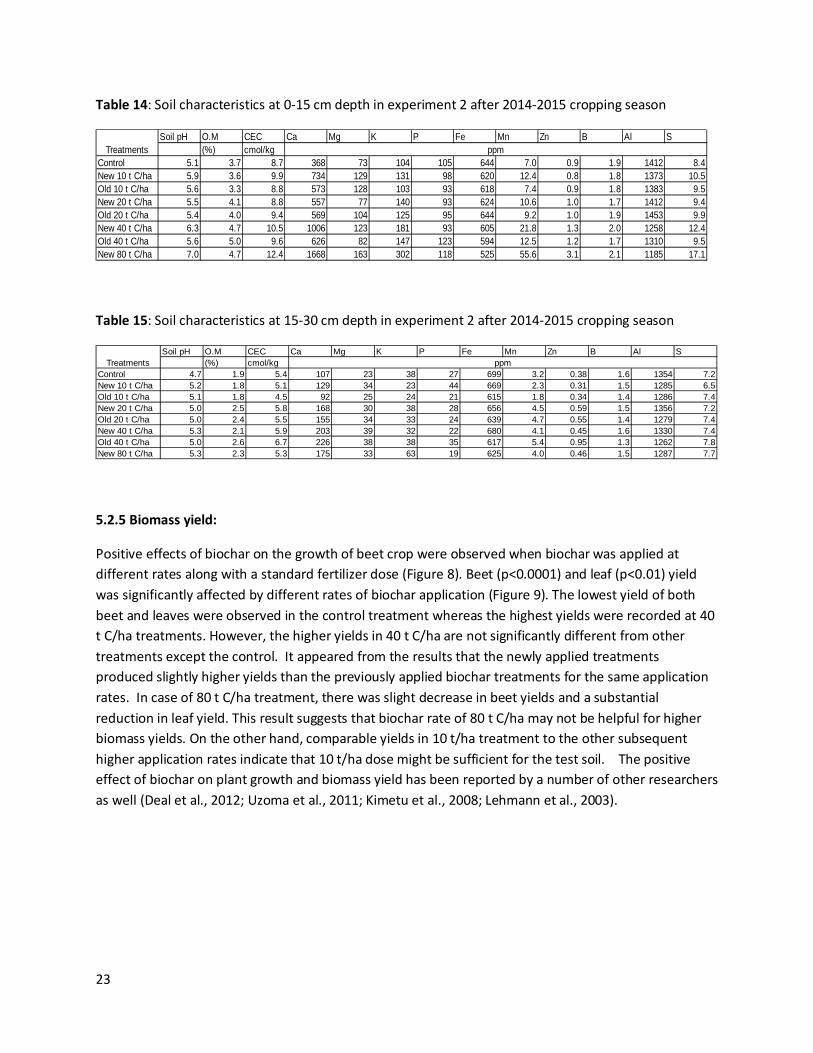
Table 14: Soil characteristics at 0-15 cm depth in experiment 2 after 2014-2015 cropping season
Table 15: Soil characteristics at 15-30 cm depth in experiment 2 after 2014-2015 cropping season
5.2.5 Biomass yield:
Positive effects of biochar on the growth of beet crop were observed when biochar was applied at different rates along with a standard fertilizer dose (Figure 8). Beet (p<0.0001) and leaf (p<0.01) yield was significantly affected by different rates of biochar application (Figure 9). The lowest yield of both beet and leaves were observed in the control treatment whereas the highest yields were recorded at 40 t C/ha treatments. However, the higher yields in 40 t C/ha are not significantly different from other treatments except the control. It appeared from the results that the newly applied treatments produced slightly higher yields than the previously applied biochar treatments for the same application rates. In case of 80 t C/ha treatment, there was slight decrease in beet yields and a substantial reduction in leaf yield. This result suggests that biochar rate of 80 t C/ha may not be helpful for higher biomass yields. On the other hand, comparable yields in 10 t/ha treatment to the other subsequent higher application rates indicate that 10 t/ha dose might be sufficient for the test soil. The positive effect of biochar on plant growth and biomass yield has been reported by a number of other researchers as well (Deal et al., 2012; Uzoma et al., 2011; Kimetu et al., 2008; Lehmann et al., 2003).
Soil pH O.M CEC Ca Mg K P Fe Mn Zn B Al S(%) cmol/kg
Control 5.1 3.7 8.7 368 73 104 105 644 7.0 0.9 1.9 1412 8.4New 10 t C/ha 5.9 3.6 9.9 734 129 131 98 620 12.4 0.8 1.8 1373 10.5Old 10 t C/ha 5.6 3.3 8.8 573 128 103 93 618 7.4 0.9 1.8 1383 9.5New 20 t C/ha 5.5 4.1 8.8 557 77 140 93 624 10.6 1.0 1.7 1412 9.4Old 20 t C/ha 5.4 4.0 9.4 569 104 125 95 644 9.2 1.0 1.9 1453 9.9New 40 t C/ha 6.3 4.7 10.5 1006 123 181 93 605 21.8 1.3 2.0 1258 12.4Old 40 t C/ha 5.6 5.0 9.6 626 82 147 123 594 12.5 1.2 1.7 1310 9.5New 80 t C/ha 7.0 4.7 12.4 1668 163 302 118 525 55.6 3.1 2.1 1185 17.1
ppmTreatments
Soil pH O.M CEC Ca Mg K P Fe Mn Zn B Al S(%) cmol/kg
Control 4.7 1.9 5.4 107 23 38 27 699 3.2 0.38 1.6 1354 7.2New 10 t C/ha 5.2 1.8 5.1 129 34 23 44 669 2.3 0.31 1.5 1285 6.5Old 10 t C/ha 5.1 1.8 4.5 92 25 24 21 615 1.8 0.34 1.4 1286 7.4New 20 t C/ha 5.0 2.5 5.8 168 30 38 28 656 4.5 0.59 1.5 1356 7.2Old 20 t C/ha 5.0 2.4 5.5 155 34 33 24 639 4.7 0.55 1.4 1279 7.4New 40 t C/ha 5.3 2.1 5.9 203 39 32 22 680 4.1 0.45 1.6 1330 7.4Old 40 t C/ha 5.0 2.6 6.7 226 38 38 35 617 5.4 0.95 1.3 1262 7.8New 80 t C/ha 5.3 2.3 5.3 175 33 63 19 625 4.0 0.46 1.5 1287 7.7
ppmTreatments
23
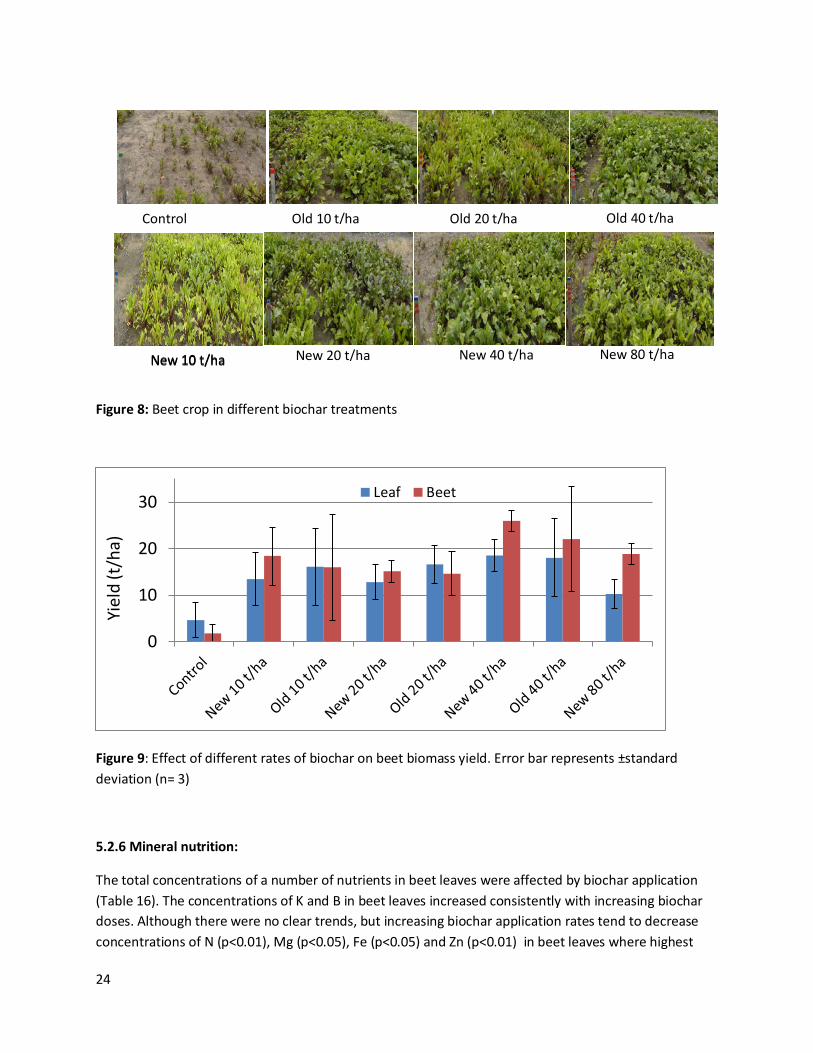
Figure 8: Beet crop in different biochar treatments
Figure 9: Effect of different rates of biochar on beet biomass yield. Error bar represents ±standard deviation (n= 3)
5.2.6 Mineral nutrition:
The total concentrations of a number of nutrients in beet leaves were affected by biochar application (Table 16). The concentrations of K and B in beet leaves increased consistently with increasing biochar doses. Although there were no clear trends, but increasing biochar application rates tend to decrease concentrations of N (p<0.01), Mg (p<0.05), Fe (p<0.05) and Zn (p<0.01) in beet leaves where highest
0
10
20
30
Yiel
d (t
/ha)
Leaf Beet
Control Old 10 t/ha Old 40 t/ha Old 20 t/ha
New 10 t/ha New 10 t/ha New 20 t/ha New 80 t/ha New 40 t/ha
24
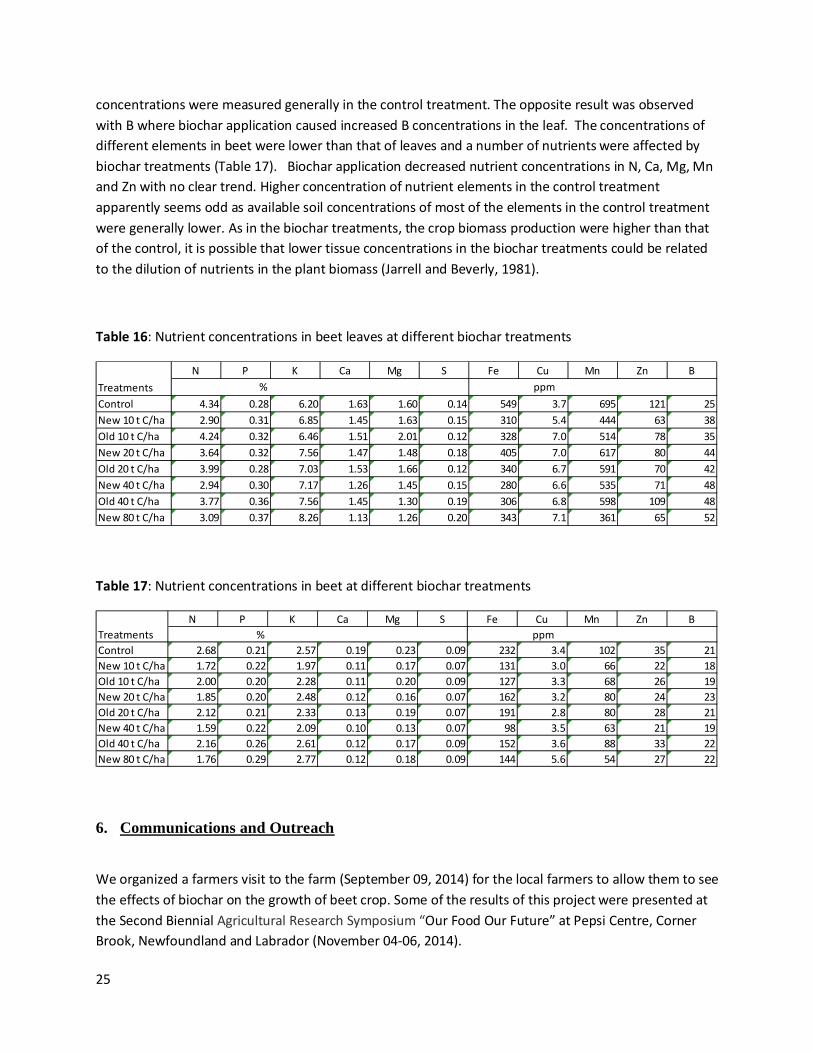
concentrations were measured generally in the control treatment. The opposite result was observed with B where biochar application caused increased B concentrations in the leaf. The concentrations of different elements in beet were lower than that of leaves and a number of nutrients were affected by biochar treatments (Table 17). Biochar application decreased nutrient concentrations in N, Ca, Mg, Mn and Zn with no clear trend. Higher concentration of nutrient elements in the control treatment apparently seems odd as available soil concentrations of most of the elements in the control treatment were generally lower. As in the biochar treatments, the crop biomass production were higher than that of the control, it is possible that lower tissue concentrations in the biochar treatments could be related to the dilution of nutrients in the plant biomass (Jarrell and Beverly, 1981).
Table 16: Nutrient concentrations in beet leaves at different biochar treatments
Table 17: Nutrient concentrations in beet at different biochar treatments
6. Communications and Outreach
We organized a farmers visit to the farm (September 09, 2014) for the local farmers to allow them to see the effects of biochar on the growth of beet crop. Some of the results of this project were presented at the Second Biennial Agricultural Research Symposium “Our Food Our Future” at Pepsi Centre, Corner Brook, Newfoundland and Labrador (November 04-06, 2014).
N P K Ca Mg S Fe Cu Mn Zn B
Control 4.34 0.28 6.20 1.63 1.60 0.14 549 3.7 695 121 25New 10 t C/ha 2.90 0.31 6.85 1.45 1.63 0.15 310 5.4 444 63 38Old 10 t C/ha 4.24 0.32 6.46 1.51 2.01 0.12 328 7.0 514 78 35New 20 t C/ha 3.64 0.32 7.56 1.47 1.48 0.18 405 7.0 617 80 44Old 20 t C/ha 3.99 0.28 7.03 1.53 1.66 0.12 340 6.7 591 70 42New 40 t C/ha 2.94 0.30 7.17 1.26 1.45 0.15 280 6.6 535 71 48Old 40 t C/ha 3.77 0.36 7.56 1.45 1.30 0.19 306 6.8 598 109 48New 80 t C/ha 3.09 0.37 8.26 1.13 1.26 0.20 343 7.1 361 65 52
% ppmTreatments
N P K Ca Mg S Fe Cu Mn Zn B
Control 2.68 0.21 2.57 0.19 0.23 0.09 232 3.4 102 35 21New 10 t C/ha 1.72 0.22 1.97 0.11 0.17 0.07 131 3.0 66 22 18Old 10 t C/ha 2.00 0.20 2.28 0.11 0.20 0.09 127 3.3 68 26 19New 20 t C/ha 1.85 0.20 2.48 0.12 0.16 0.07 162 3.2 80 24 23Old 20 t C/ha 2.12 0.21 2.33 0.13 0.19 0.07 191 2.8 80 28 21New 40 t C/ha 1.59 0.22 2.09 0.10 0.13 0.07 98 3.5 63 21 19Old 40 t C/ha 2.16 0.26 2.61 0.12 0.17 0.09 152 3.6 88 33 22New 80 t C/ha 1.76 0.29 2.77 0.12 0.18 0.09 144 5.6 54 27 22
% ppmTreatments
25
7. Conclusion and Recommendations
In this present study, we did not observe any positive effect of biochar on soil temperature. Volumetric moisture content measured by soil moisture-temperature sensors shows lower moisture content in biochar plots than the non-biochar plots in experiment one. However, gravimetric moisture content measured in experiment two was remarkably higher in 80 t C/ha dose for all three measurement dates. Biochar application caused higher soil pH in experiment one while in experiment two, soil pH, organic matter, and CEC were found to be increased at higher biochar rates. Mehlich 3 extractable concentrations of Ca, K, Mn and S were significantly increased in experiment one due to biochar application while in experiment two Mehlich 3 extractable K, Ca, Mg, P, Mn and Zn increased with increasing rates of biochar, where the newly applied biochar treatments exhibited higher concentrations than the old biochar treatments for the same rate of application. Available concentrations of Fe and Al generally decreased with increasing biochar rates. The decrease in Al concentrations was more prominent in the newly applied biochar treatments than the old ones for same rate of applications.
In both experiments, biochar application had positive effects on plant growth and crop yields. However, the results from experiment one shows that singly applied biochar application is unable to support crop establishment, growth and biomass production despite its positive effect on a number of soil parameters. The results underline that the positive effect of biochar on plant growth and biomass yield is only realized when biochar is applied along with a supplemental nutrient source such as fishmeal or fertilizer. In experiment two, biomass yields increased with increasing biochar rates where the biochar rate of 40 t C/ha produced the most biomass, although, the difference in yields with other biochar rates (≥ 10 t C/ha) were statistically insignificant. The biomass yields in the highest biochar rate (80 t C/ha) was lower thanthe other biochar treatments which indicates an over application of biochar. This result suggests that a biochar rate of 10 t C/ha could be sufficient for the sandy soils of Happy Valley-Goose Bay. However, we need to continue the experiments over several years to confirm this observation.
8. References
Allison, S. D., & Treseder, K. K. (2011). Climate change feedbacks to microbial decomposition in boreal soils. Fungal Ecology, 4(6), 362-374.
Barrow, C. J. (2012). Biochar: Potential for countering land degradation and for improving agriculture. Applied Geography (Sevenoaks), 34, 21-28.
Bird, M. I., Wurster, C. M., de Paula Silva, P. H., Bass, A. M., & de Nys, R. (2011). Algal biochar – production and properties. Bioresource Technology, 102(2), 1886-1891.
26
Bird, M. I., Wurster, C. M., de Paula Silva, P. H., Paul, N.A., & de Nys, R. (2012). Algal biochar: effects and applications. Global change Biology Bioenergy, 4, 61-69.
Bolan, N.S., Kunhikrishnan, A.,Choppala, G.K., Thangarajan, R., & Chung, J.W. (2012). Stabilization of carbon in composts and biochars in relation to carbon sequestration and soil fertility. The Science of the Total Environment, 424, 264-270.
Bradey N.C. 1990. Nature and Properties of Soils. Tenth edition, Macmillan Publishing Company, New York.
Clough, T. J., & Condron, L. M. (2010). Biochar and the nitrogen cycle: Introduction. Journal of Environmental Quality, 39(4), 1218-1223.
Deal, C., Brewer, C.E., Brown, R.C., , Okure, M.A. E., & Amoding, A. (2012). Comparison of kiln-derived and gasifier-derived biochars as soil amendments in the humid tropics. Biomass and Bioenergy, 37, 161-168.
Department of Forest & Agrifoods (2002). Soils of the Happy Valley East Area, Labrador (Soil Survey report). Published by Soil and Land Management Division, P.O. Box 8700, St. John’s, NF A1b 4J6.
Ding, Y., Liu, Y.-X., Wu, W.-X., Shi, D.-Z., Yang, M., & Zhong, Z.-K. (2010). Evaluation of biochar effects on nitrogen retention and leaching in multi-layered soil columns. Water, Air, and Soil Pollution, 213, 47–55.
Galinato, S. P., Yoder, J.K. & Granatstein, D. (2011). The economic value of biochar in crop production and carbon sequestration. Energy Policy, 39, 6344-6350.
Glaser, B., Haumaier, L., Guggenberger, G., & Zech, W. (2001). The ‘Terra Preta’ phenomenon: a model for sustainable agriculture in the humid tropics. Naturwissenschaften, 88,37–41.
Glaser, B., Lehmann, J., & Zech, W. (2002) Ameliorating physical and chemical properties of highly weathered soils in the tropics with charcoal – a review. Biology and Fertility of Soils, 35, 219–230.
Hanegraaf, M. C. (2009). Trends in soil organic matter contents in dutch grasslands and maize fields on sandy soils. European Journal of Soil Science, 60(2), 213-222.
Havlin, J.L., Beaton, J.D., Tisdale, S.L. & Nelson, W.L. (2005). Soil Fertility and Fertilizers: An Introduction to Nutrient Management. Pearson Prentice Hall, Upper Saddle River, New Jersey.
Inyang, M., Gao, B., Pullammanappallil, P., Ding, W., & Zimmerman, A. R. (2010). Biochar from anaerobically digested sugarcane bagasse. Bioresource Technology, 101(22), 8868-8872.
IPNI (International Plant Nutrition Institute), (2006). Soil Fertility Manual. IPNI, 655 Engineering Drive, Suite 110, Norcross, GA 30092-2837
Jarrell, W.M. & Beverly, R.B. (1981). The Dilution Effect in Plant Nutrition Studies. Advances in Agronomy, 34: 197-224
27
Karhu K., Mattila T., Bergstrom & Regina K. (2011). Biochar addition to agricultural soil increased CH4 uptake and water holding capacity – Results from a short-term pilot field study. Agriculture, Ecosystems & Environment, 140:309-313.
Kimetu J.M., Lehmann J., Ngoze S.O., Mugendi D.N., Kinyangi J.M., Riha S., Verchot L., Recha J.W. & Pell A.N. (2008). Reversibility of soil productivity decline with organic matter of differing quality along a degradation gradient. Ecosystems, 11: 726–739.
Kookana,R.S., Sarmah, A.K., Van Zwieten, L., Krull, E. & Singh, B. (2011). Biochar application to Soil: agronomic and environmental benefits and unintended consequences. Advances in Agronomy, 112, 103-143.
Kwapinski, W., Byrne, C.M.P., Kryachko, E., Wolfram, P., Adley, C., Leahy, J.J., Novotny, E.H., & Hayes, M.H.B. (2010). Biochar from Biomass and Waste. Waste and Biomass Valorization, 1, 177–189.
Laird D.A., Fleming P., Davis D.D., Horton R., Wang B., & Karlen D.L. (2010b). Impact of biochar amendments on the quality of a typical Midwestern agricultural soil. Geoderma, 158:443–449
Laird, D., Fleming, P., Wang, B., Horton, R., & Karlen, D. (2010a). Biochar impact on nutrient leaching from a midwestern agricultural soil. Geoderma, 158(3–4), 436-442.
Lehmann, J. (2007) Bio-energy in the black. Frontiers in Ecology and the Environment. 5(7), 381–387.
Lehmann, J. (2010). Biochar for Environmental Management : Science and Technology, Earthscan publications, London.
Lehmann, J., Gaunt, J. & Rondon, M. (2006). Biochar-sequestration in terrestrial ecosystems- a review. Mitigation and Adaptation Strategies for Global Change. 11, 403-427.
Lehmann, J., Rillig, M.C., Thies, J., Masiello, C.A., Hockaday, W.C., & Crowle, D. (2011). Biochar effects on soil biota- A review. Soil Biology and Biochemistry, 43, 1812-1836.
Loveland, P., & Webb, J. (2003). Is there a critical level of organic matter in the agricultural soils of temperate regions: A review. Soil and Tillage Research, 70(1), 1-18.
McHenry, M. P. (2011). Soil organic carbon, biochar, and applicable research results for increasing farm productivity under Australian agricultural conditions. Communications in Soil Science and Plant Analysis, 42(10), 1187-1199.
Méndez , A., Gomez, A., Paz-Ferreiro, J. & Gasco, G. (2012). Effects of sewage sludge biochar on plant metal availability after application to a Mediterranean soil. Chemosphere, 89, 1354-1359.
28
Novak J.M., Lima I., Xing B., Gaskin J.W., Steiner C., Das K.C., Ahmedna M., Rehrah D., Watts D.W., Busscher W.J. & Schomberg H. (2009). Characterization of designer biochar produced at different temperatures and their effects on a loamy sand. Annals of Environmental Science 3: 195-206
Sims T. & Gartley, K.L. (1996). Nutrient management-An Overview (Chapter 1). In Nutrient Management Handbook For Delaware. Cooperative bulletin no. 59, University of Delaware, Newark, De 19716.
Sohi, S., Lopez-Capel, E., Krull, E. & Bol, R. (2009). Biochar, climate change and soil: A review to guide future research. CSIRO Land and Water Science Report 05/09, 64pp.
Spokas, K. A., Novak, J. M., & Venterea, R.T. (2012). Biochar’s role as an alternative N-fertilizer: ammonia cap Plant and Soil, 350, 35-42.
St. Arnaud, R. J., & Sephton, G.A. (1972). Contribution of clay and organic matter to cation-exchange capacity of chernozemic soils. Canadian Journal of Soil Science, 52(1), 124-126.
Steiner, C., Teixeira, W.G., Lehmann, J., Nehls, T., de Macêdo, J.L.V., Blum, W.E.H., & Zech, W. (2007). Long term effects of manure, charcoal and mineral fertilization on crop production and fertility on a highly weathered Central Amazonian upland soil. Plant and Soil, 291, 275–290.
Taghizadeh-Toosi, A., Clough, T. J., Sherlock, R.R., & Condron, L.M. (2012). Biochar adsorbed ammonia is bioavailable. Plant and Soil, 350, 57–69.
Van Zwieten, L., Kimber, S., Morris, S., Chan, K.Y., Downie, A., Rust, J., Joseph, S., & Cowie, A. (2010). Effects of biochar from slow pyrolysis of papermill waste on agronomic performance and soil fertility. Plant and Soil, 327, 235–246.
Wang, J., Zhang, M., Xiong, Z., Liu, P., & Pan, G. (2011) Effects of biochar addition on N2O and CO2 emissions from two paddy soils. Biology and Fertility of Soils, 47, 887-896.
Warnock, D.D., Lehmann, J., Kuyper, T.W., & Rillig, M.C. (2007). Mycorrhizal responses to biochar in soil – concepts and mechanisms, Plant and Soil, 300, 9–20.
Yu, X., Ying, G., & Kookana, R. S. (2009). Reduced plant uptake of pesticides with biochar additions to soil. Chemosphere, 76(5), 665-671.
Yuan, J.-H., & Xu, R.-K. (2011). The amelioration effects of low temperature biochar generated from nine crop residues on an acidic Ultisol. Soil Use and Management, 2011, 27, 110–115.
Yuan, J.-H., Xu, R.-K., Qian, W., & Wang, R.-H. (2011). Comparison of the ameliorating effects on an acidic ultisol between four crop straws and their biochars. Journal of Soils Sediments, 11,741–750.
Zheng, W., Guo, M., Chow, T., Bennett, D. N., & Rajagopalan, N. (2010). Sorption properties of greenwaste biochar for two triazine pesticides. Journal of Hazardous Materials, 181(1–3), 121-126.
29

Appendices
The appendices are attached as a separate PDF file
30