potential entrepreneurship in urban informal sector ... · potential entrepreneurship in urban...
TRANSCRIPT

International Journal of Small Business and Entrepreneurship Research
Vol.5, No.6, pp.1-26, November 2017
___Published by European Centre for Research Training and Development UK (www.eajournals.org)
1 ISSN 2053-5821(Print), ISSN 2053-583X(Online)
POTENTIAL ENTREPRENEURSHIP IN URBAN INFORMAL SECTOR
MICROENTERPRISES IN SRI LANKA
B. W. R. Damayanthi
University of Sri Jayawardenepura
ABSTRACT: Microenterprises and also the attached entrepreneurs in the developing
countries are very diverse. Therefore, issues and barriers related to microenterprises are at a
wide range. It is crucial in identifying underlying segmentation stories beforehand any policy
intervention that direct to improve micro entrepreneurship. This study aims to identify de facto
typologies and potential entrepreneurship in urban informal sector in Sri Lanka. Data were
drawn from a sample of 300 micro entrepreneurs chosen under multi stage cluster sampling
method. Ward’s hierarchical clustering method identified five main segments considering
demographic, socioeconomic, business related and also psychological factors related to
entrepreneurs. According to the characteristics recorded, identified five clusters were labeled
as survival, potential, survival-forever, transitory and self-sufficient for cluster 1 to 5
respectively. Survival or survival-forever groups were not operatable for a growing firm due
to their setup and other related characteristics while self-sufficient group had least capacity to
expand within micro basis. Cluster two and four had growth oriented characteristics and
hence potential groups that were finalized as the viable micro entrepreneurial blocks which
have greater potential to grow with complementary assistances.
KEYWORDS: Micro Enterprises, Urban Informal Sector, Ward’s Hierarchical Clustering, Q
Analysis
INTRODUCTION
The typical feature of the informal sector, heterogeneity, is often created by simultaneous
inclusion of urban poor people who depend on informal subsistence activities for their
livelihood, as well as relatively higher-income people most of which are entrepreneurs running
more profitable microenterprises that use capital and hire labor. These variations of firm size,
firm life, profitability, growth potentials, as well as differential returns to physical and human
capital can be largely explained by individual abilities, skills, capacities, motivations, resource
acquisition and preferences (Mead & Liedholm, 1998; Cunningham & Maloney, 2001).
Especially, these variations might be attributed to the involuntary entrance: either lack of any
other viable option to generate a livelihood has been pushed to microenterprise sector (Tokman,
2007; Damayanthi, 2016); excluded by the formal sector (Williams & Yousef, 2015),
motivated by the need of satisfying lower order psychological needs as described by Maslows’
hierarchy of needs (Roy & Wheeler, 2006) or queuing for jobs in the formal sector (Levenson
& Maloney, 1998; Gunathilake, 2008; Damayanthi & Premaratne, 2015). Since the final
outcome depends on which basis they have been in, the understanding of the complexity arisen
from the heterogeneity- by means of nature, structure, motivation, constraints and determinants
of the current behavior- and identifying the potential niche of micro entrepreneurship are
crucial for any strategy, policy interventions aiming at alleviating poverty and improve the
economic welfare of the sector. Effective policy intervention to foster sustainable ventures is
crucial as micro entrepreneurship in the informal sector is not some minor peripheral feature
of the developing countries (Woodward et al., 2014). It is assumed that more than 45 percent

International Journal of Small Business and Entrepreneurship Research
Vol.5, No.6, pp.1-26, November 2017
___Published by European Centre for Research Training and Development UK (www.eajournals.org)
2 ISSN 2053-5821(Print), ISSN 2053-583X(Online)
of the urban poor in the country dependent on microenterprise activities. Therefore, any urban
poverty reduction program has great deal with urban informal-sector microenterprises. Thus it
is encouraged to provide them necessary assistances, in most cases, microcredit or
microfinance to start or improve small business (ESCAP, 2007). However, it is well
acknowledged that returns of such assistances vary tremendously in achieving prospected goals
due to afore mentioned heterogeneity among the entrepreneurs. But, there is a severe dearth
studies that analyzes this diversity which help to identify viable or sustainable entrepreneurs to
direct scarce resources into the right path. Filling this void, the main objective of this study is
to identify de facto typologies and potential entrepreneurship in urban informal sector in Sri
Lanka.
LITERATURE REVIEW
Empirical literature
Microenterprises and also the attached entrepreneurs in the developing countries are very
diverse in terms of activities conducted, ability or skill acquired, inherent abilities, attitudes,
experiences, level of education, social and institution access and so on (Cunningham &
Melony, 2001; De Mel et al., 2008; Mead & Liedholm, 1998; Roy & wheeler, 2006).
Therefore, issues and barriers related to microenterprises are at a wide range in nature as
described above and therefore the heterogeneity of the sector is unavoidable in practice.
Accordingly, the decisions and objectives on entry/exit or survive as well as future vision vary
considerably among them (Roy & wheeler, 2006; Williams & Yousef, 2015). Further, it is
reported that this heterogeneity exists across the countries and regions as well (Freytag &
Thurik, 2007; Grilo & Thurik, 2008). It can be a form of differing returns to factors, small size,
lack of growth, or even differential returns to human and physical capital may be due to
variance in individual abilities and preferences and the noisy process of discovering them,
distorted labor and credit markets or an inefficient regulatory framework. In consequence of
all these factors, there can be seen simultaneous occurrence of high return short lived firms,
high return long lived firms, low return long-lived as well as about to fail young firms.
Therefore, it is crucial in identifying underlying segmentation stories beforehand any policy
intervention that direct to improve micro entrepreneurship or micro enterprises (Cunningham
& Malony, 2001; Daniels, 1999; Grilo & Thurik, 2008; Grim et al 2010; Mead & Liedholm,
1998; Roy & Wheeler, 2006; Show, 2004).
For most scholars micro entrepreneurs are formal sector excluded people (Levenson &
Maloney, 1996; Williams & Yousef, 2015; 2014). This exclusion can be aroused as
consequence of low skill low education levels (Mead, 1998; Roy & Wheeler, 2006) high
unemployment or other macroeconomic issues that constrain formal sector absorption of these
people (Williams & Yousef, 2015;Daniels, 1999; Levenson & Maloney,1996). For micro
entrepreneurs who are in the sector as a result of exclusion, an enterprise is only a temporary
livelihood for survival and hence they may not have in the vision of a growing firm. Regardless
of the rate of return they get from the activity they will exit with formal sector employments.
Hence, there may be young firms with high returns but no expansion and also wish to close
(Mead & Liedholm, 1998).
If micro entrepreneurship have been derived as a result of parents’ experience, credit or fund
availability, rate of return and existence depend on the skill level and related entrepreneurial

International Journal of Small Business and Entrepreneurship Research
Vol.5, No.6, pp.1-26, November 2017
___Published by European Centre for Research Training and Development UK (www.eajournals.org)
3 ISSN 2053-5821(Print), ISSN 2053-583X(Online)
qualities (Evans & Jovanovic, 1989). The capacity to develop is least for the low-skilled low-
educated owner-firms (Morrissions et al., 1994). And on the other hand these micro
entrepreneurs might be constrained from administrative barriers like licenses, various
approvals and fees as in Levenson and Maloney (1996). In the absence of underlying
difficulties and barriers, firms operating in this category may different from the others with
high capability of expanding.
Scholars have identified a considerable portion of micro entrepreneurs have satisfying
behavior. So they are said to be non-optimizing firms (Cunningham & Maloney, 2001;
Williams & Yousef, 2015). Basically, people who retired and seek supportive income start
microenterprises not having a wish of a growing firm but to survive. They may not constrained
by credit or other types of resources but by their objective.
As described above, growth and expansion of microenterprises are said to be constrained by
many other factors and thereby forming different segmentations among micro entrepreneurs.
For instance, Grim et al. (2010) studied how entry costs and starting capital affect marginal
returns to capital in microenterprises in the Sub-Saharan Africa context. Using
microenterprises data from six West-African countries they show that different levels of
starting capital can explain the heterogeneity observed in micro entrepreneurs. Show (2004)
described survival and entrepreneurial microenterprises considering factors that are more
similar to Mead & Liedholm (1998). He identified location: rural, suburbs, infrastructure
facilities: roads, transport, and product type: simple, technology based, earning capacity in
identifying typologies in rural microenterprises in Hambamthota district in Sri Lanka.
Conducting more comprehensive study Mead & Liedholm, (1998) explored different
typologies that may exist among microenterprises. Accordingly, micro entrepreneurs are
diverse with their needs, targets, constrains, issues they faced, operating sector and product,
gender, etc. Further her study confirmed the significance of heterogeneity of the corelational
patterns among enterprises as well as entrepreneur characteristics in forming various clusters.
She described more clearly that the growth of a microenterprise is a complex process because
they are very heterogeneous and made up of diverse sets of currents and countercurrents.
Therefore, policies and projects must take account of this diversity, types of enterprises and on
particular in which stage it is operated in the enterprise’s life cycle etc. Then “the more the
design of policies and projects can be based on a firm grasp of this diversity, the more likely it
will be that scarce developmental resources can contribute effectively to the dual goals of
growth and poverty alleviation” (Mead & Liedholm, 1998).
Theoretical literature and conceptual framework
Different levels of inward back ward relationships of the above discussed determinants, in other
words, correlation, covariance patterns of independent variables lead to put these micro
entrepreneurs in to different segments. This heterogeneity is one of the inherent features of the
informal sector micro entrepreneurs that make policy makers vulnerable in designing effective
policies. Theories pointed out the possible sources of heterogeneity, broadly, in four different
paths: differences of firm centered cost structures; market imperfections; distributional
differences of resources and accesses; psychological aspects of motivation.
In standard microeconomic theory, firm’s growth follows from the assumption of profit-
maximizing behavior and from the shape of the cost functions. Under perfect competition, a
firm grows until it has reached the size where long-run marginal cost equals price, which is its
International Journal of Small Business and Entrepreneurship Research
Vol.5, No.6, pp.1-26, November 2017
___Published by European Centre for Research Training and Development UK (www.eajournals.org)
4 ISSN 2053-5821(Print), ISSN 2053-583X(Online)
objectively assessed “optimal size” (Mansfield 1979). In neoclassical framework Lucas (1978)
posits that the basic reason behind the coexistence of large medium small and micro firms in
an economy is the cost function. According to Evans & Jovanovic (1989) who expanded Lucas’
idea, if an entrepreneur is well aware of his exact costs relationships he will have the ability to
maximize profit over their expectations in the short run. Consequently this might make
negative repercussions on competitors with the possibility of keeping them out of the business.
As Cunningham and Malony (2001) explained this framework derives two implications. First,
the actual distribution of mature firm size will contain coexistence of larger, more capital-
intensive, high earnings firms with very small ones. Second, among small firms there should
be long-lived firms at their long-run size, start-up firms that find themselves extremely
profitable and desire to expand, and startup firms that are about to fail. Further, “non-
optimizing,” or “satisfying” modes of production could be exists under the assumption that the
entrepreneurs are maximizing utility but not profit. Moreover, it is implied that individual
abilities may lead to make variations of returns to human and physical capital. Therefore, other
than small size, lack of growth, sub divisions of the sector can be explained by the individual
abilities and preferences.
Neo classical theories of occupational choice described diversity of firms and their motivations
through market imperfections. Accordingly, there may be involuntary entries to the micro
enterprise sector. As discussed by Cunningham and Malony (2001) these non-volunteers are
mainly consists of the young who entered into the labor market newly, migrants, and possibly
laid off, retired, middle-age workers. Since there is no alternative, they have become self-
employed. However, there are coexisting with voluntary self-employed. This implied that
willing to growth would definitely differ among them though they are coexisting.
From the resources point of view credit constraints on entrepreneurs are well documented in
the developing country context. If credit-market imperfections constitute an important barrier
to growth for some firms, there would be potential entrepreneurs who are willing to expand but
lacks access to resources. Eclectic theory describes that entrepreneurship will be contrasted by
lack of resources and macroeconomic conditions, even the locality where the enterprise
established. Further, the supply limitations of basic infrastructure will hinder growth of some
enterprises than others due to uneven access (Audretsch, 2002).
Differences in motivational patterns within the entrepreneurial population are considered
mostly by the psychological aspects. Psychological theories of motivation recognize that
people differ in motivational aspects. Maslow’s well-known hierarchy of needs theory
(Maslow, 1954) suggests that if the owner of a firm likely to have his/her lower-order needs
substantially satisfied, then the higher-order needs will be the primary motivators. Therefore,
growth objectives would only be pursued to the extent of satisfying needs. Motivation-hygiene
theory (Herzberg, 1966) posits on the factors leading to job satisfaction. This concept is
different among the entrepreneurs. One factor that might have effected positively on one may
affect negatively to another. Therefore, as an analogy to Herzberg’s findings, it is plausible to
suggest that some factors may motivate growth if growth is expected to bring about a positive
change, whereas negative expectations concerning the same factor may have little or no
influence on growth willingness. Likewise, other factors may not motivate growth even if
positive outcomes of growth are expected, whereas expected negative changes for the same
factors may reduce growth willingness (Davidson, 1989a).
According to McClelland (1961) nArch theory, different people have different levels of nAch
(need for Achievement). Those who are high in nAch strive for achievement satisfaction, which

International Journal of Small Business and Entrepreneurship Research
Vol.5, No.6, pp.1-26, November 2017
___Published by European Centre for Research Training and Development UK (www.eajournals.org)
5 ISSN 2053-5821(Print), ISSN 2053-583X(Online)
is obtained through succeeding in relatively demanding tasks where the outcome is dependent
on the skill and effort of the individual and where the result is easily measurable. High nAch
individuals are therefore attracted to self-employment, and as businessmen, they use profits
and (possibly) growth as success measures vice versa (Davidson, 1989a).
Extracting out from the above discussion, four types of conceptual constructs can be derived
identifying representative measurable variables under each of the conceptual factor. Then
different correlation patterns of selected root covariates have assumed to be derived latent
constructs for segmentations or more formally “typologies” within urban informal micro
entrepreneurs. Accordingly, the following hypothetical conceptual frame work was built on the
above theoretical background and empirical literature in order to identify existing typologies
in the sector.
Figure 1: Hypothetical conceptual framework for typologies
Source: Author’s construction based on literature survey
Conceptual Manifest Latent
A. Earnings
C. Education
B. Firm size
J. Volunteer
I. Poverty
H. LOC
G. ESE
F. Hrs work
E. Age
D. Firm age
-
+
-
A B C F G
D E H I J
AB D E H I J
E F J
C F G
A B C D E F
G I
E H I J
A BC D F G
A B C D G H
-
+
-
-
+
-
-
+
-
-
+
-
Cost
Structure
Market
Imperfections
Resources:
Distribution
& Access
Psychological
aspects/
Demographic
factors
T
Y
P
O
L
O
G
I
E
S
International Journal of Small Business and Entrepreneurship Research
Vol.5, No.6, pp.1-26, November 2017
___Published by European Centre for Research Training and Development UK (www.eajournals.org)
6 ISSN 2053-5821(Print), ISSN 2053-583X(Online)
METHODOLOGY AND DATA
Research design and sample
Research design: This study carried out the research on the characteristics of microenterprises
within urban underserved population. Therefore, the basic form of the research is cross
sectional, researching at a point of time, in nature where utilization of both experimental and
non-experimental designs is possible. However, considering the resources and the available
time period this study occupies non experimental research design (Bhattacherjee, 2012). The
unit of analysis is micro entrepreneur that represents the sector.
Working definitions: Informal sector in the study was defined according to their
characteristics: ease of entry; reliance on indigenous resources; family ownership of resources;
small scale of operation; labor-intensive and adapted technology; skills acquired outside the
formal school system; and unregulated and competitive markets (ILO, 1991). And
microenterprises were defined as non-agricultural household-based enterprises employing less
than five persons including the owner (DCS, 2010).
Sampling: Multi stage cluster sampling method was used for the study. From 48 wards of
Colombo municipal council the most USS concentrated wards were selected at first. By
considering the spread of each settlement categories- slums, shanties, scatter settlements- 6
wards were selected so that all the categories were represented. From the selected wards seven
geographical clusters were selected and then sub clusters or enumeration areas were selected
from each cluster. Finally, random sample of micro entrepreneurs were selected. Registered
list of micro entrepreneurs is not available for the informal sector as usual in many other
countries. Therefore, in the selected localities, randomly chosen business places were
approached and the questionnaire was administered. However, the survey team was advised
not to visit adjacent places, not to take in to account very small scale side businesses (a house
wife who is selling few lunch packets by the side of her house, selling or running small scale
groceries in front or by the side of the house but primarily engaging with house works.
Nevertheless, they were guided to minimize bias within the enumeration area and keep
diversity of selecting observations. Overall, the survey teams visited 300 households or
enterprises sites in 12 enumeration areas.
Specification of the Empirical model
The research problem related to conceptual basis in Figure 1 requires the use of interdependent
statistical techniques because there is no distinction has been made between dependent and
independent variables. Since the operational objective is to search for groups the elemental
format behind this research problem is latent structure analysis for similarities. This is the
strategy that searching for dimensions proceeds in the absence of a prior basic structure.
However, differentiation should be made performing analysis on units instead of variables.
Group of persons could then be formed instead of group of variables. This type of working
method is called Q analysis. Most techniques of cluster analysis are of this Q type, for “clusters”
usually indicate group of units (Tacq, 1997). Then it could investigate for each two micro
entrepreneurs to what extent they resemble each other making use of their scores on root
variables. Entrepreneurs having approximately equal scores on the different variables could
then be placed in the same group. Researcher can use inductive as well as deductive methods
in finding these latent structures (groups). For this analysis it is reasonable to use deductive
method due to unavailability of baseline research for the country and the sector as well.

International Journal of Small Business and Entrepreneurship Research
Vol.5, No.6, pp.1-26, November 2017
___Published by European Centre for Research Training and Development UK (www.eajournals.org)
7 ISSN 2053-5821(Print), ISSN 2053-583X(Online)
Under this technique objects are classified so that each object is very similar to others in the
cluster with regard to some predetermined selection criterion. The resulting clusters or objects
should then exhibit high internal (within-cluster) homogeneity & high external (between-
cluster) heterogeneity. In the sense, clusters are homogenous inwardly, because inter person
correlations within a cluster are strong, and heterogeneous outwardly because inter personal
correlations over clusters are weak.
The use of cluster analysis for the current study mainly attributed to three objectives. Firstly,
the primary value of the method lies in the classification of data, as suggested by ‘natural’
groupings of the data themselves, or in other words an empirically based classification of
objects. This is comparable to factor analysis in its objectives of assessing structure. But cluster
analysis differs from any other in grouping objects, whereas other methods i.e., factor analysis,
are primarily concerned with grouping variables. Secondly, clustering can perform data
reduction procedure objectively by reducing the information from an entire population or
sample to information about specific, smaller subgroups for example if there are some attitudes
of a population which identifies the major groups within the population, then the data can be
reduced for the entire population into profiles of a number of groups in this fashion unless
meaningless. The researcher can have a more concise understandable description of the
observations; with minimal loss of information. And with a defined structure, observations can
be grouped for further analysis. Thirdly, relationship identification, with the cluster defined
and the underlying structure of the data represented in the clusters, the researcher has a means
of revealing relationships among the observations that was not possible with the individual
observations (Hair, et al., 1998).
For this study, magnitudes of variables are more important than the pattern. Therefore,
“crrelational measures are rarely used because emphasis in most applications of cluster analysis
is on the magnitude of the objects not the pattern of values” (Hair et al, 1998). Hence, distance
measures are used for the study. The proximity matrix is calculated applying squared Euclidean
distance which is estimated as,
𝑑(𝑥, 𝑦) = ∑(𝑥𝑖 − 𝑦𝑖)2
𝑛
𝑖=1
(1)
or alternatively as,
𝑑(𝑥, 𝑦) =∑ (𝑥𝑖 − 𝑦𝑖)2 𝑛
𝑖=1
𝑛 (2)
This concept is easily generalized to more than two variables. The Euclidean distance is used
to calculate specific measures such as the simple Euclidean and squared or absolute Euclidean
distance which is the sum of squared differences without taking the square root as in equation
2. The squared Euclidean distance has the advantage of not having to take the square root which
speeds computations markedly, and it is the recommended distance measures for the centroid
and Ward’s method of clustering.
In Ward’s method the distance between two clusters is the sum of squares between the two
clusters. This method is distinct from other methods because it uses an analysis of variance
approach to evaluate the distances between clusters. In general, this method is very efficient.
Cluster membership is assessed by calculating the total sum of squared deviations from the

International Journal of Small Business and Entrepreneurship Research
Vol.5, No.6, pp.1-26, November 2017
___Published by European Centre for Research Training and Development UK (www.eajournals.org)
8 ISSN 2053-5821(Print), ISSN 2053-583X(Online)
mean of a cluster. The criterion for fusion is that it should produce the smallest possible
increase in the error sum of squares.
𝑑𝐾𝐿 = ∑ ‖�⃗�𝑖
𝑖∈𝐾∪𝐿
− �⃗⃗⃗�𝐾 ∪ 𝐿‖2 − ∑‖�⃗�𝑖
𝑖∈𝐾
− �⃗⃗⃗�𝐾‖2 − ∑‖�⃗�𝑖
𝑖∈𝐿
− �⃗⃗⃗�𝐿‖2
=𝜂𝐾𝜂𝐿𝐾
𝜂𝐾+𝜂𝐿 ‖�⃗⃗⃗�𝐾 − �⃗⃗⃗�𝐿‖2
Ward’s method states that the distance between two clusters (K, L) is how much the sum of
squares will increase when the clusters are merged. Where m is the cluster centers while 𝜂 is
the points on it.
𝑑𝐾𝐿 =‖�̅�𝐾 − �̅�𝐿‖2
(1
𝑛𝐾+
1𝑛𝐿
)
Then if Ward values denoted by W
𝑊 = ∑ ∑ ∑‖𝑥𝑖𝑗𝑚
𝑛
𝑖=1
𝑘
𝑗=1
𝑔
𝑚=1
− �̅�𝑗𝑚‖2
Where I = 1…n observations with j = 1…k variables for each i, and the number of clusters
ranges from 1…n where each i has its own cluster at the beginning. Then fusion will be taken
place minimizing error sum of squares where 𝑥𝑖𝑗𝑚 is the value of the 𝑖𝑡ℎ of nm observations in
the 𝑚𝑡ℎ cluster and �̅�𝑗𝑚 is the mean of variable j in the 𝑚𝑡ℎ cluster. Iteration starts with 𝑔 =
𝑛 clusters that each consists of a single observation (𝑛𝑚 = 1) and calculates the distances of
the n observations from the n clusters is 0. And the process as more distance points are forced
to share a common center until 𝑛𝑚 = 𝑛 and 𝑚 = 1 (Ward, 1963).
Ward’s method keeps this growth as small as possible. Given two pairs of clusters whose
centers are equally apart, this method prefers to merge the smallest ones. Therefore, suggested
better another approach is to use both these methods to gain benefits of each. Hence, a
hierarchical technique was employed to establish the number of clusters; while k means profile
the cluster centers from the hierarchical results as the initial seed points. In this way, the
advantages of hierarchical methods are complemented in this study by the ability of the non-
hierarchical methods in order to ‘fine-tune’ the results.
EMPIRICAL RESULTS AND ANALYSES
Sample characteristics and descriptive analysis
In terms of demographic characteristics majority of the sample consist of males (79 percent)
while female representation is only a small fraction (21 %). As it is observed from Table 1
approximately half of entrepreneurs are 18 – 40 age groups while a higher proportion, 26.4
percent, is between of 30 to 40 years. This shows that the majority of them belong to country’s

International Journal of Small Business and Entrepreneurship Research
Vol.5, No.6, pp.1-26, November 2017
___Published by European Centre for Research Training and Development UK (www.eajournals.org)
9 ISSN 2053-5821(Print), ISSN 2053-583X(Online)
working population. It is interesting that a considerable percent of entrepreneurs were in 40 –
50 years age group.
Table 1: Age and education level of micro entrepreneurs
Age
% of
entrepreneurs
Education level
% of
entrepreneurs
Below 18
yrs 0.7
No schooling 3.0
18 - 30 yrs 17.6 Primary 7.1
30 - 40 yrs 26.4 Secondary 28.7
40 - 50 yrs 23.6 Ordinary level 34.5
50 above 31.4 Advanced level 23.0
Graduate 3.0
Source: Author’s calculations based on sample survey
Level of education reported in Table 1 shows only 3 percent of the entrepreneurs were illiterate,
while only 7 percent of them were educated to primary level indicating higher level of
educational attainment in the country. Although more educated entrepreneurs like A/L passed
and graduates were only a very few percent, as it is common to the urban underserved sector,
almost three third of the sample have educated up to O/L. It was shown that most of the
households have at least one A/L educated member although educational level of parents is
very low. It was quite interesting to reveal that some very successful innovative and therefore
wealthy micro entrepreneurs are illiterate though they are dealing with large modernized firms
(evidences from key informants and individual interviews).
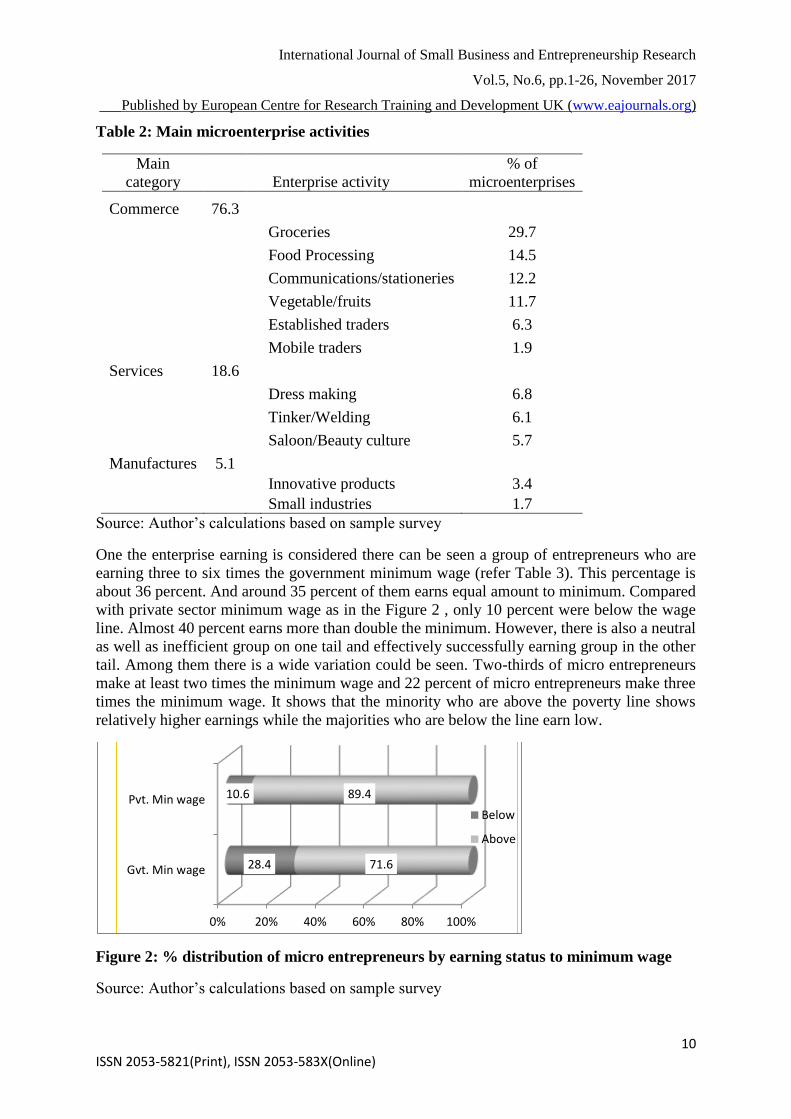
The repartition of microenterprises by activity in USS sector is given in Table 2. There is a
very wide range of microenterprise activities in urban underserved settlements, although not
evenly spread across the different wards. It can be seen from the sample survey that commerce
is the most popular revenue source or microenterprise activity in the sector of which grocery
owners shared almost one third of the micro entrepreneurs. Share of food processing was
recorded as second major economic activity whilst communications, stationary shops and
unprocessed food sellers are significant proportion as well. Other sectors, however much less
significant in numbers or quantity nevertheless constitute an important part of the informal
sector, most notably, contributory to the whole economy. Especially, small industry
productions like candles, shoes and food preparations like string hoppers; and kind of
innovative industrial productions which involve recycling procedures.
International Journal of Small Business and Entrepreneurship Research
Vol.5, No.6, pp.1-26, November 2017
___Published by European Centre for Research Training and Development UK (www.eajournals.org)
10 ISSN 2053-5821(Print), ISSN 2053-583X(Online)
Table 2: Main microenterprise activities
Main
category
Enterprise activity
% of
microenterprises
Commerce 76.3
Groceries 29.7
Food Processing 14.5
Communications/stationeries 12.2
Vegetable/fruits 11.7
Established traders 6.3
Mobile traders 1.9
Services 18.6
Dress making 6.8
Tinker/Welding 6.1
Saloon/Beauty culture 5.7
Manufactures 5.1
Innovative products 3.4
Small industries 1.7
Source: Author’s calculations based on sample survey
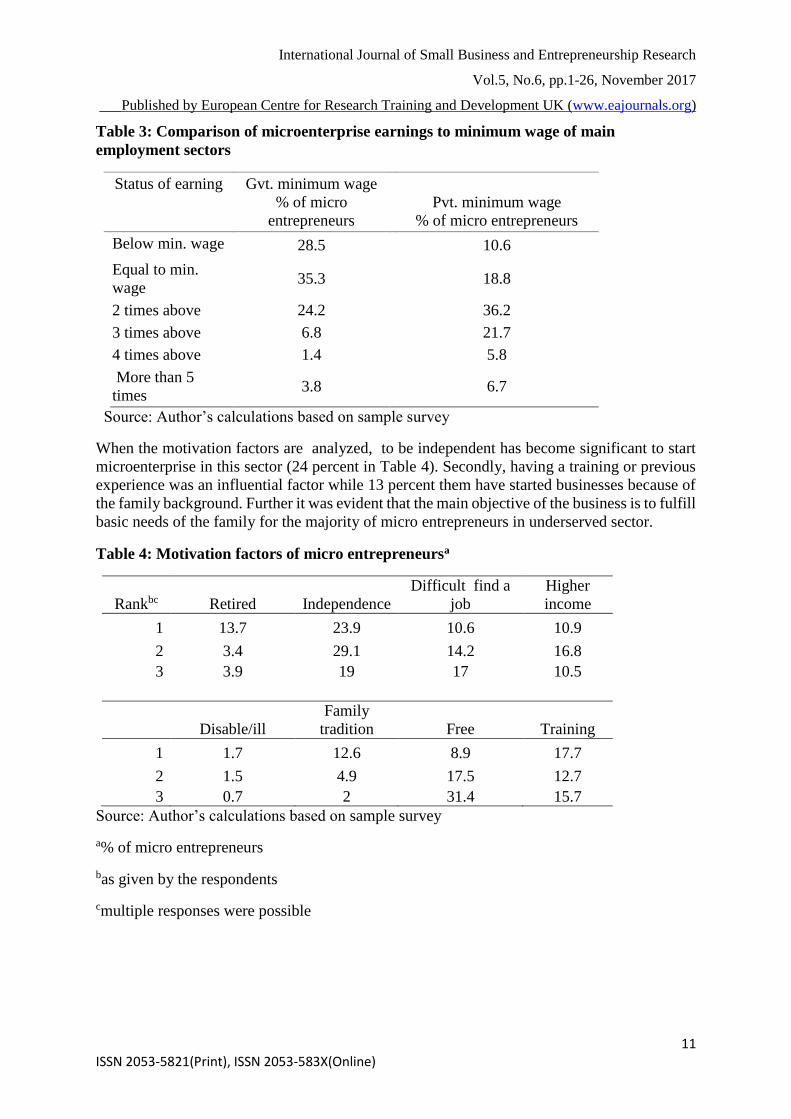
One the enterprise earning is considered there can be seen a group of entrepreneurs who are
earning three to six times the government minimum wage (refer Table 3). This percentage is
about 36 percent. And around 35 percent of them earns equal amount to minimum. Compared
with private sector minimum wage as in the Figure 2 , only 10 percent were below the wage
line. Almost 40 percent earns more than double the minimum. However, there is also a neutral
as well as inefficient group on one tail and effectively successfully earning group in the other
tail. Among them there is a wide variation could be seen. Two-thirds of micro entrepreneurs
make at least two times the minimum wage and 22 percent of micro entrepreneurs make three
times the minimum wage. It shows that the minority who are above the poverty line shows
relatively higher earnings while the majorities who are below the line earn low.
Figure 2: % distribution of micro entrepreneurs by earning status to minimum wage
Source: Author’s calculations based on sample survey
Gvt. Min wage
Pvt. Min wage
0% 20% 40% 60% 80% 100%
28.4
10.6
71.6
89.4
Below
Above
International Journal of Small Business and Entrepreneurship Research
Vol.5, No.6, pp.1-26, November 2017
___Published by European Centre for Research Training and Development UK (www.eajournals.org)
11 ISSN 2053-5821(Print), ISSN 2053-583X(Online)
Table 3: Comparison of microenterprise earnings to minimum wage of main
employment sectors
Status of earning Gvt. minimum wage
% of micro
entrepreneurs
Pvt. minimum wage
% of micro entrepreneurs
Below min. wage 28.5 10.6
Equal to min.
wage 35.3
18.8
2 times above 24.2 36.2
3 times above 6.8 21.7
4 times above 1.4 5.8
More than 5
times 3.8
6.7
Source: Author’s calculations based on sample survey
When the motivation factors are analyzed, to be independent has become significant to start
microenterprise in this sector (24 percent in Table 4). Secondly, having a training or previous
experience was an influential factor while 13 percent them have started businesses because of
the family background. Further it was evident that the main objective of the business is to fulfill
basic needs of the family for the majority of micro entrepreneurs in underserved sector.
Table 4: Motivation factors of micro entrepreneursa
Rankbc Retired Independence
Difficult find a
job
Higher
income
1 13.7 23.9 10.6 10.9
2 3.4 29.1 14.2 16.8
3 3.9 19 17 10.5
Disable/ill
Family
tradition Free Training
1 1.7 12.6 8.9 17.7
2 1.5 4.9 17.5 12.7
3 0.7 2 31.4 15.7
Source: Author’s calculations based on sample survey
a% of micro entrepreneurs
bas given by the respondents
cmultiple responses were possible
International Journal of Small Business and Entrepreneurship Research
Vol.5, No.6, pp.1-26, November 2017
___Published by European Centre for Research Training and Development UK (www.eajournals.org)
12 ISSN 2053-5821(Print), ISSN 2053-583X(Online)
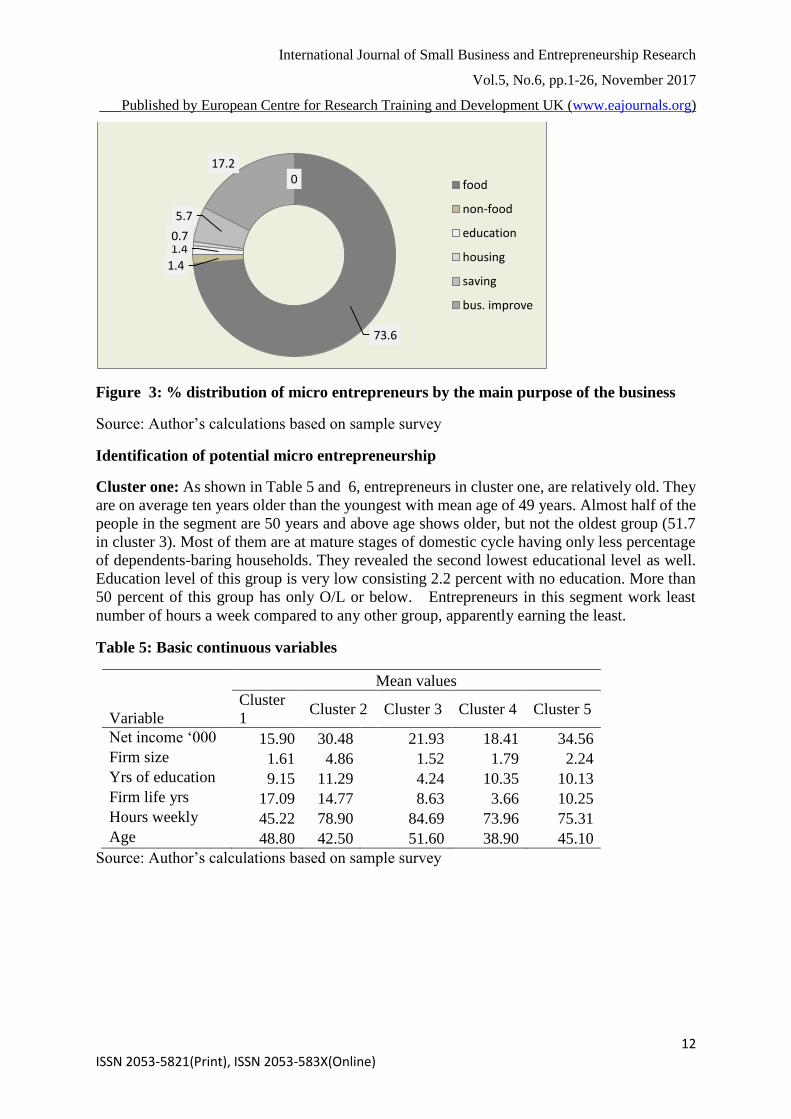
Figure 3: % distribution of micro entrepreneurs by the main purpose of the business
Source: Author’s calculations based on sample survey
Identification of potential micro entrepreneurship
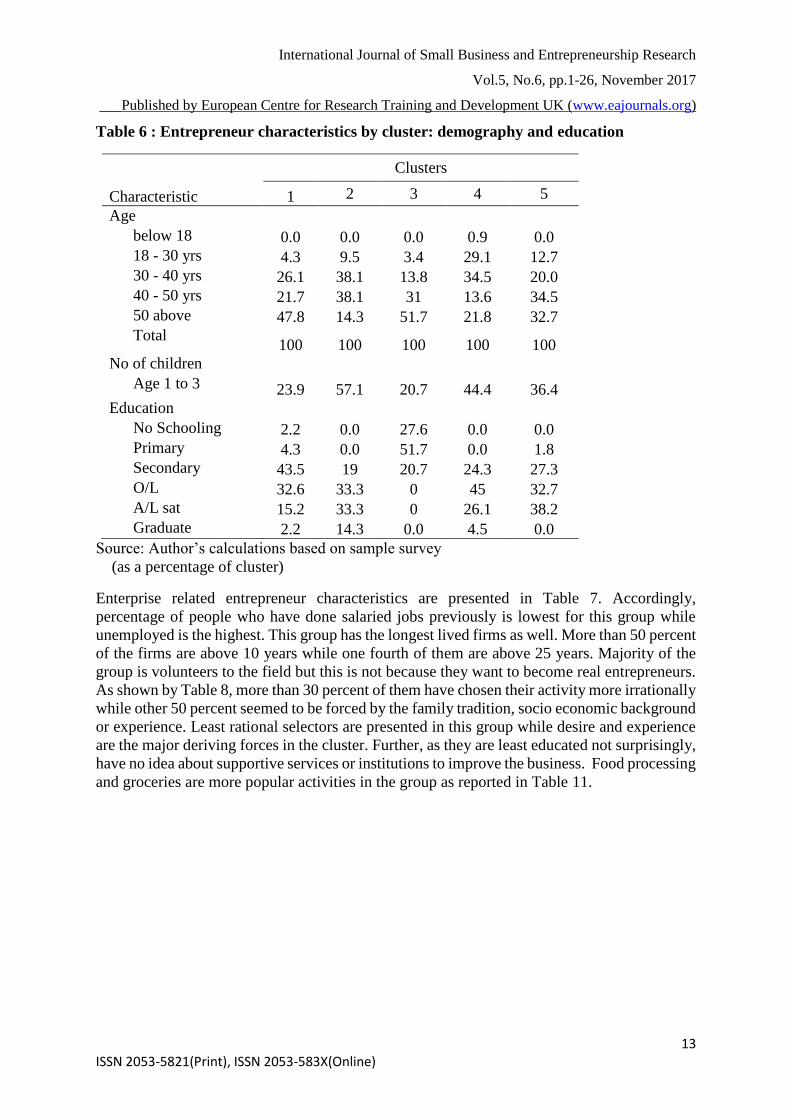
Cluster one: As shown in Table 5 and 6, entrepreneurs in cluster one, are relatively old. They
are on average ten years older than the youngest with mean age of 49 years. Almost half of the
people in the segment are 50 years and above age shows older, but not the oldest group (51.7
in cluster 3). Most of them are at mature stages of domestic cycle having only less percentage
of dependents-baring households. They revealed the second lowest educational level as well.
Education level of this group is very low consisting 2.2 percent with no education. More than
50 percent of this group has only O/L or below. Entrepreneurs in this segment work least
number of hours a week compared to any other group, apparently earning the least.
Table 5: Basic continuous variables
Mean values
Variable
Cluster
1 Cluster 2 Cluster 3 Cluster 4 Cluster 5
Net income ‘000 15.90 30.48 21.93 18.41 34.56
Firm size 1.61 4.86 1.52 1.79 2.24
Yrs of education 9.15 11.29 4.24 10.35 10.13
Firm life yrs 17.09 14.77 8.63 3.66 10.25
Hours weekly 45.22 78.90 84.69 73.96 75.31
Age 48.80 42.50 51.60 38.90 45.10
Source: Author’s calculations based on sample survey
73.6
1.4
1.40.7
5.7
17.20 food
non-food
education
housing
saving
bus. improve
International Journal of Small Business and Entrepreneurship Research
Vol.5, No.6, pp.1-26, November 2017
___Published by European Centre for Research Training and Development UK (www.eajournals.org)
13 ISSN 2053-5821(Print), ISSN 2053-583X(Online)
Table 6 : Entrepreneur characteristics by cluster: demography and education
Clusters
Characteristic 1 2 3 4 5
Age
below 18 0.0 0.0 0.0 0.9 0.0
18 - 30 yrs 4.3 9.5 3.4 29.1 12.7
30 - 40 yrs 26.1 38.1 13.8 34.5 20.0
40 - 50 yrs 21.7 38.1 31 13.6 34.5
50 above 47.8 14.3 51.7 21.8 32.7
Total 100 100 100 100 100
No of children
Age 1 to 3 23.9 57.1 20.7 44.4 36.4
Education
No Schooling 2.2 0.0 27.6 0.0 0.0
Primary 4.3 0.0 51.7 0.0 1.8
Secondary 43.5 19 20.7 24.3 27.3
O/L 32.6 33.3 0 45 32.7
A/L sat 15.2 33.3 0 26.1 38.2
Graduate 2.2 14.3 0.0 4.5 0.0
Source: Author’s calculations based on sample survey
(as a percentage of cluster)
Enterprise related entrepreneur characteristics are presented in Table 7. Accordingly,
percentage of people who have done salaried jobs previously is lowest for this group while
unemployed is the highest. This group has the longest lived firms as well. More than 50 percent
of the firms are above 10 years while one fourth of them are above 25 years. Majority of the
group is volunteers to the field but this is not because they want to become real entrepreneurs.
As shown by Table 8, more than 30 percent of them have chosen their activity more irrationally
while other 50 percent seemed to be forced by the family tradition, socio economic background
or experience. Least rational selectors are presented in this group while desire and experience
are the major deriving forces in the cluster. Further, as they are least educated not surprisingly,
have no idea about supportive services or institutions to improve the business. Food processing
and groceries are more popular activities in the group as reported in Table 11.

International Journal of Small Business and Entrepreneurship Research
Vol.5, No.6, pp.1-26, November 2017
___Published by European Centre for Research Training and Development UK (www.eajournals.org)
14 ISSN 2053-5821(Print), ISSN 2053-583X(Online)
Table 7 : Entrepreneur characteristics by cluster: previous job and experience
Clusters
Characteristics 1 2 3 4 5
Previous job
Unemployed 63.0 52.4 44.8 48.6 56.4
Salaried 28.3 38.1 41.4 32.4 34.5
Own business 8.7 9.5 3.4 18.9 9.1
Experience
Below 2
years 4.3 14.3 17.2 45 12.7
2 - 5 years 15.2 0.0 24.1 34.2 20
5 - 8 years 4.3 4.8 17.2 11.7 14.5
8 - 10 years 4.3 23.8 13.8 7.2 14.5
10- 15 years 28.3 14.3 13.8 1.8 16.4
15 - 20 years 13 23.8 10.3 0.0 16.4
20 - 25 years 6.5 4.8 3.4 0.0 1.8
Above 25 23.9 14.3 0.0 0.0 3.6
Source: Author’s calculations based on sample survey
(as a percentage of cluster)
When entrepreneurship skills are concerned, this group shows that they have least
entrepreneurship skills as shown in Table 9. Their sales targets are not competitive and easily
set for shaping basic needs. Therefore, they think that they have ability in management and
score higher (1.24, 1.19). Their efforts on new markets are least (-1.8) whilst the most effective
feature of an entrepreneur, “work under pressure and conflict”, is very low (0.14). Further,
financial recording is also very low in this group. With respect to locus of control reported in
Table 10, entrepreneurs in this cluster are internally as well as externally controlled. They
believe that they must be fortunate enough to get something and even though they work hard
it would not work successfully unless they are lucky (1.4). Nonetheless, they depend on the
others for decision making.
As expected formal financial connections are very low for the group thus they have started
firms by using private savings (refer Table 12). And more preciously they do not intend to get
any external funds. As they are self-satisfactory by the nature, most of them expressed they
don’t need any future financing for the business (71%). It was shown that a considerable
proportion of people have stated that they applied for loans but did not received. This, in one
hand showed that they had tried to get improved at early stages but had no correct assistance.
Therefore, later they seemed to have fallen in to the category of thinking “impossibility”. As
shown in Table 13, firm size is higher than only the lowest (1.52) in the cluster 3 and working
site is temporary but specific to most of them. 95 percent of their clients are the public. This
cluster records very low amount of established businesses but some innovative products.
People those who are not willing to do any change is highest for this group. In addition, the
majority of them are least likely to become formal (67 %).
International Journal of Small Business and Entrepreneurship Research
Vol.5, No.6, pp.1-26, November 2017
___Published by European Centre for Research Training and Development UK (www.eajournals.org)
15 ISSN 2053-5821(Print), ISSN 2053-583X(Online)
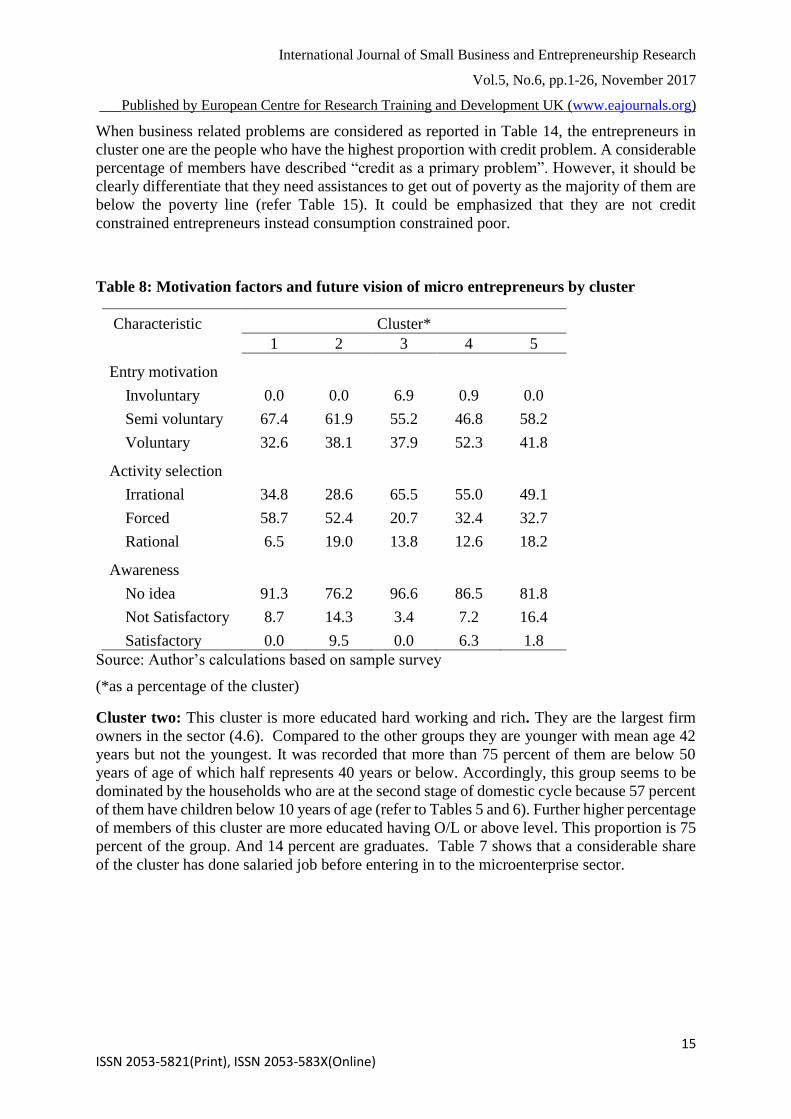
When business related problems are considered as reported in Table 14, the entrepreneurs in
cluster one are the people who have the highest proportion with credit problem. A considerable
percentage of members have described “credit as a primary problem”. However, it should be
clearly differentiate that they need assistances to get out of poverty as the majority of them are
below the poverty line (refer Table 15). It could be emphasized that they are not credit
constrained entrepreneurs instead consumption constrained poor.
Table 8: Motivation factors and future vision of micro entrepreneurs by cluster
Characteristic Cluster*
1 2 3 4 5
Entry motivation
Involuntary 0.0 0.0 6.9 0.9 0.0
Semi voluntary 67.4 61.9 55.2 46.8 58.2
Voluntary 32.6 38.1 37.9 52.3 41.8
Activity selection
Irrational 34.8 28.6 65.5 55.0 49.1
Forced 58.7 52.4 20.7 32.4 32.7
Rational 6.5 19.0 13.8 12.6 18.2
Awareness
No idea 91.3 76.2 96.6 86.5 81.8
Not Satisfactory 8.7 14.3 3.4 7.2 16.4
Satisfactory 0.0 9.5 0.0 6.3 1.8
Source: Author’s calculations based on sample survey
(*as a percentage of the cluster)
Cluster two: This cluster is more educated hard working and rich. They are the largest firm
owners in the sector (4.6). Compared to the other groups they are younger with mean age 42
years but not the youngest. It was recorded that more than 75 percent of them are below 50
years of age of which half represents 40 years or below. Accordingly, this group seems to be
dominated by the households who are at the second stage of domestic cycle because 57 percent
of them have children below 10 years of age (refer to Tables 5 and 6). Further higher percentage
of members of this cluster are more educated having O/L or above level. This proportion is 75
percent of the group. And 14 percent are graduates. Table 7 shows that a considerable share
of the cluster has done salaried job before entering in to the microenterprise sector.

International Journal of Small Business and Entrepreneurship Research
Vol.5, No.6, pp.1-26, November 2017
___Published by European Centre for Research Training and Development UK (www.eajournals.org)
16 ISSN 2053-5821(Print), ISSN 2053-583X(Online)
Table 9: Entrepreneurial self-efficacy level by cluster
Clusters
Item 1 2 3 4 5
Cornbach's
α
Marketing 0.11 0.16 -0.11 0.74 0.05 0.724
Innovation 0.51 0.52 0.56 1.01 0.44 0.567
Management 0.95 0.84 0.27 0.63 0.74 0.539
Risk-taking 0.52 0.63 1.07 0.1 0.74 0.548
Financial control 0.70 1.09 0.61 0.84 0.29 0.448
Total ESE 2.80 3.24 2.39 3.31 2.25 0.778
Source: Author’s calculations based on sample survey
Table 10: Locus of control by cluster
Components
Item
Cluster
1
Cluster
2
Cluster
3
Cluster
4
Cluster
5
1. I am usually able to protect my
personal interests. 0.50 0.87 0.57 0.30 -0.05
2. My life is determined by my own
actions. 1.01 0.99 0.80 0.54 1.07
3. When I make plans, I am almost
certain to make them work. 0.07 1.13 0.46 0.36 0.15
4. When I get what I want, it’s usually
because I worked hard for it. 0.81 -0.01 0.89 0.99 0.85
5. To a great extent my life is controlled
by accidental happenings. 0.73 0.66 0.82 0.85 0.88
6. Often there is no change of
protecting my personal interests from
bad happenings. 0.94 0.85 0.77 0.62 0.95
7. When I get what I want, it’s usually
because I’m lucky. 1.14 0.59 1.05 0.80 1.09
8. it’s not always wise for me to plan
too far ahead because many things
turn out to be a matter of good or bad
fortune. 0.26 0.26 -0.54 0.50 0.11
9. Whether or not I get to be leader
depends on whether I’m lucky
enough to be in the right place at the
right time. 0.80 -0.18 -0.12 0.75 0.39
Average LOC 0.70 0.57 0.52 0.63 0.60
Source: Author’s calculations based on sample survey
More than half of the cluster shows involuntary and semi voluntary entrance, confirming their
motivation from the background effects as shown in Table 8. This includes again labor market
imperfections and economy wide nature of unemployment. O/L or A/L qualification itself does

International Journal of Small Business and Entrepreneurship Research
Vol.5, No.6, pp.1-26, November 2017
___Published by European Centre for Research Training and Development UK (www.eajournals.org)
17 ISSN 2053-5821(Print), ISSN 2053-583X(Online)
not provide good opportunities in the labor market in the country. Therefore, they seem to be
excluded from the formal labor market. However it is not a sign of any kind of social exclusion.
It was confirmed by their reasons behind moving into sector as in Table 8. 87 percent of them
have claimed that they had a great difficulty in finding job. However, a considerable proportion
of them (57%) think that microenterprise activity pays higher than a salaried job. And they
likely to be independent having experience backed by the family background. Considerable
percentage of them has chosen the current activity by doing a market search. Specially, none
of them have chosen their activity on easiness. This shows that their trend towards effective
entrepreneurship. As shown in Table 9, entrepreneurial self-efficacy is very high for them.
Marketing ability is higher for them with very strong ability of establishing goals. Fairly high
risk taking capacity and therefore innovation is high as well. However, Table 10 reports that
locus of control is considerable factor in relation to attitudes.
As shown in Table 11, this group records the highest percentage in innovative products (9.5%).
Furthermore this cluster is rich in containing more established business. As regards firm
characteristics reported in Table 13, unlike cluster one and three entrepreneurs in this cluster
have better working sites (38%). Most of them have their own (or other) but permanent sites.
Clientele consists of firms showing more stable market situation for the enterprises. One fourth
of members have sub contracts with firms. Therefore, not surprisingly the majority of them is
in a vision of expanding the firm and likes to become formal. 67 percent which is the highest
percentage among the groups likes to establish formal registered firm.
Table 11: Main enterprise activities and clients by cluster
Clusters
Activity 1 2 3 4 5
Food processing 17.4 28.6 32.1 8.1 9.1
Innovative productions 6.5 9.5 3.6 1.8 0
Groceries 26.1 9.5 28.6 29.7 43.6
Mobile traders 4.3 0.0 0.0 0.9 1.8
Dress making 15.2 14.3 3.6 7.2 1.8
Small industry
productions 4.3 0.0 7.1 0.9 0.0
Unprocessed food 6.5 0.0 17.9 11.7 9.1
Communications 2.2 9.5 3.6 22.5 10.9
Tinkering/welding 8.7 19 0.0 3.6 7.3
Established business 4.3 4.8 0.0 6.3 14.5
Saloon/Beauty culture 4.3 0.0 3.6 7.2 1.8
Source: Author’s calculations based on sample survey
However, only a least proportion of entrepreneurs have formal banking connections (14%)
though it is the highest among the groups as shown in Table 12. They have use personal or
private loans to start the business; supplier credit is also considerably high for them. But
surprisingly a considerable percentage of people do not intend to get or in an idea of getting
future funds. It seems very irrational from the formal behavior and their firm background but
with their social background. Being marginalized and exclusion from the formal banking sector
are the major facts behind this irrational behavior.

International Journal of Small Business and Entrepreneurship Research
Vol.5, No.6, pp.1-26, November 2017
___Published by European Centre for Research Training and Development UK (www.eajournals.org)
18 ISSN 2053-5821(Print), ISSN 2053-583X(Online)
When considered the problems reported in Table 14, it was irrational that their inconsideration
of credit problem. This can be rationalized with their low level awareness on one hand and
unfavorable experience from the financial institutions on the other. Least knowledge about
using credit for business improvement might have prevented them from identifying real issues
or primary problems like credit. Further, they have been affected by the general economic
phenomenon like inflation. These factors unwillingly reduced their investment into the
business but have gone out for the consumption in order to maintain the usual level.
Apparently, this group is vulnerable from the view of business development but not
consumption shocks. This can be further indicated by the poverty levels. Although the majority
of them completely depend on the enterprise income more than 85 percent of them are above
the monetary poverty measure. And more interestingly, food is not the main prioritized
objective for a considerable proportion of members in the cluster (refer to Table 15).
Table 12: Initial capital source and future funds of microenterprises by cluster
Clusters
Source 1 2 3 4 5
Initial capital
Bank loan 6.3 14.3 3.4 10.9 1.8
Pvt loan 21.6 28.8 27.7 29.6 26.5
Pvt savings 58.7 38.1 41.4 52.2 45.5
Supply credit 6.5 19 3.4 5.4 7.3
Not needed 6.5 0.0 24.1 1.8 18.7
Future funds
No need 71.7 57.1 69 47.7 41.8
Costly 4.3 0.0 0.0 9 14.5
Not received 13 9.5 3.4 9.1 14.5
Don't know how to
apply 2.2 0.0 0.0 0.0 7.4
Bank loan 4.3 23.8 6.9 18.1 7.3
Pvt loan 4.3 9.6 17.2 13.5 14.5
Supplier credit 0.0 0.0 0.0 2.7 0.0
Source: Author’s calculations based on sample survey
Cluster three: As reported in Table 5 and 6, cluster three is least educated, oldest, retired and
hard working group with low earnings. More than 50 percent of them are above 50 years and
are at mature stages of domestic cycle. Also “no schooling” is highest (27.6%) among them
whilst more than 75 percent them have only primary or below. As shown in Table 7, regardless
of the age they are considerably less experienced in the field. 17 percent of them have
experience below two years. Majority of this group had had salaried jobs compared to the other
clusters. Data reported in Table 10 further shows that this group is fairly volunteer to the field.
As they are at their older ages, pensioned and just waiting for the rest of life they have no vision
to expand and have no need of getting aware. Therefore, awareness level is very low for them
while 97 percent of them have no any idea even about supportive services. Compared to the
other segments, entrepreneurs in cluster three seemed to be more irrational in selecting

International Journal of Small Business and Entrepreneurship Research
Vol.5, No.6, pp.1-26, November 2017
___Published by European Centre for Research Training and Development UK (www.eajournals.org)
19 ISSN 2053-5821(Print), ISSN 2053-583X(Online)
economic activities. As demonstrated in Table 9, management capacity or entrepreneurial skills
are at very low level. Specifically, there cannot be seen any motivation towards marketing
while innovation is less as well. However, contradictorily the nature of risk taking is higher for
them. This is also confirmed by the low scores of locus of control. Food processing and
commerce are the most popular activity among this group where the skills are least required
(refer to Table 11). As depicted in Table 12 they have started the activities with their savings
or loans from relatives /friends. Since the activities are least capitalized or no capital is needed
for most of them. One fourth of them have stated that they had no starting capital needed.
Further, considerably higher (69%) percentage of members of this cluster have expressed that
future funds are not needed.
Table 13: Business premise, clients and vision of microenterprises by cluster
Cluster
Characteristic 1 2 3 4 5
Premise
Permanent own 28.3 38.1 27.6 36.9 49.1
Permanent other 26.1 57.1 37.9 46.8 34.5
Temporary specific 39.1 4.8 24.1 10.8 12.7
Temporary 6.5 0.0 6.9 5.4 3.6
Clients
Firms 2.2 4.8 3.4 0.9 0.0
Public 95.7 66.7 89.7 89.2 92.7
Firms & Public 2.2 23.8 6.9 9.0 7.3
Preference to be formal
Yes 39.1 66.7 48.3 58.6 63.6
Future plans
No Change 21.4 14,3 41.3 18.9 20
Improve 76.1 85.7 58.6 77.5 78.2
Shut Down 2.2 0.0 0.0 3.6 1.8
Source: Author’s calculations based on sample survey
Since they are retired and seemed to have connections with their previous working places like
port, railway, hospitals etc. they have some sort of sub contracts supplying prepared food etc.
therefore a part of clientele for them is firms. Further, firm size is the lowest with highest
percentage of self-employees and more resembles cluster one in many aspects. Table 5.29
further shows that this cluster contains the highest percentage of memberships who do not
intend to do any change in their business (41%). As expected and withstanding their mindset,
this group is least likely to become formal or established. They are also survival firms like
cluster one but with a little deviation, almost 60 percent of them are self-employed.
Notwithstanding that they are younger firms they have no vision to expand or improve.

International Journal of Small Business and Entrepreneurship Research
Vol.5, No.6, pp.1-26, November 2017
___Published by European Centre for Research Training and Development UK (www.eajournals.org)
20 ISSN 2053-5821(Print), ISSN 2053-583X(Online)
According to Table 14, credit is not a primary problem for this group compared to the others.
No resources or labor issues related but economic downturns. And highest percentage of people
is free from business problems. Table 15 reports that enterprise income is not the main source
for a considerable portion of this group. Thus this group is least dependent on microenterprise
income since majority of them were previously employed. They are in the sector to survive for
the rest of the life having a supportive income.
Cluster four: This is the largest of the subgroups with the youngest entrepreneurs (mean age
38.9 years) and with youngest firms as in Table 5. They have better earnings though not the
highest. Above 65 percent of the members are below 40 years of age of which 30 percent fall
in to 18 – 30 age group. This is the youngest entrepreneurs group in the sector therefore
majority of them are at early stages of the domestic cycle with more inward responsibilities.
This cluster is fairly more educated with a considerable percentage of members having O/L or
above qualification. Especially, no schooling or primary only educated people are not presented
in the cluster. This shows higher level of human capacity within the group. This group
constitutes the new entrants to the labor market. Thus, not surprisingly the majority of them
are unemployed previously as shown in Table 7. Apparently, 45 percent of the members are
less experienced whilst more than 60 percent has less than five years experience in the field.
Majority of them are volunteer to the sector and may have been pushed by the background as
well as socio economic reasons. Going with the common trend the awareness level is very low
among the members so as activity selection is more irrational (refer to Table 8).
As reported in Table 9, majority of the members are skilled entrepreneurs but least likely to
take risks (0.1). Therefore, innovation is low. They reported a sort of internally controlled in
nature and more dependent on outside advices and supports in the decision making process.
They showed no quick responses to day today business issues. The majority of this cluster
stated that their difficulty in finding an alternative or job as the main reason for attending
business activities. Least experience leads them to choose the “desired” activity (47%).
However, a considerable percentage assumes that enterprise income is higher than salaried with
more freedom. As regards firm characteristics reported in Table 13, more than 75 percent of
the entrepreneurs in this group have permanent premises. Persons in this group is backed by
the parents and thus having other arrangements fairly satisfactory. However, a higher
percentage of people have formal sector loans and hope to get formal credit as well. This must
be the second generation and therefore their background is fairly good regarding formal sector
connections. A considerable proportion of members have pointed that their main problem is
credit while general macroeconomic situation related problems takes the priority (22.5%).

International Journal of Small Business and Entrepreneurship Research
Vol.5, No.6, pp.1-26, November 2017
___Published by European Centre for Research Training and Development UK (www.eajournals.org)
21 ISSN 2053-5821(Print), ISSN 2053-583X(Online)
Table 14: Main business problems of micro entrepreneurs by cluster
Clusters
Problem 1 2 3 4 5 Totala
Credit (primary) 26.1 9.5 10.3 11.7 14.5 17.29
6.5b 4.8 3.4 6.3 7.3
Demand 13.0 9.5 3.4 6.3 7.3 19.08
13.0 23.3 0.0 9.0 12.7
Other Resources 8.7 4.8 6.9 1.8 1.8 12.21
15.1 23.3 0.0 10.8 5.4
Earnings 2.2 4.8 10.3 1.8 0.0 19.87
6.5 14.4 0.0 9.0 18.0
Competitiveness 10.9 28.6 6.9 18.0 16.4 36.64
24.2 14.3 17.2 20.5 21.2
Labor 2.2 9.5 0.0 3.6 5.5 12.21
Raw materials 2.2 0.0 0.0 0.0 1.8 3.44
Infrastructure 2.2 0.0 3.4 8.1 1.8 14.12
10.8 14.3 6.8 7.2 10.9
Macro-economic 6.5 14.3 17.2 22.5 29.1 52.67
45.6 47.6 34.4 26.1 41.8
No considerable problem 19.6 19 31.0 19.8 18.2 20.61
Cluster membership 46 (17%) 21(8%) 29(11%) 111(42%) 55(21%) 262
Source: Author’s calculations based on sample survey aPercentage in total sample bCited as a problem
Overall poverty status of the group is comparatively low keeping three third of people above
the monetary poverty line. Nevertheless, food is not at the first priority for a significant portion.
Further, this group represents highest motivation in income allocation for business
improvements. Other than those enterprise income is not the main family income source for
the majority implying the possibility of prioritizing the growth of the firm in this group (refer
to Table 15).
Cluster five: Cluster five has the highest income earners having Rs.34500 average income.
Compared to cluster three and four firms in this cluster are fairly long lived and large.
Entrepreneurs are more educated, hardworking and 45 years old in average. More than 60
percent of them have secondary or higher education level. Compared to cluster one this group
is more educated though older (10.1 years of education in average). As reported in Table 7
they have established firms with fairly high experience level. More than 30 percent of them
have above 10 years experience in the sector. And they are fairly hard working entrepreneurs.
As with cluster one this group is also overwhelmingly voluntary to the sector with their age,
stability and unavailability of alternatives (refer to Table 8). As with the cluster three, those
who engaged with salaried jobs previously (23.6%) are also high for the cluster but never
employed share is considerable as well. This gives evidence again on the labor market
fragmentation in the country. Majority of this cluster has motivated to the sector mainly
because of unemployment. Therefore, the number of entrepreneurs who cite an inability to find
another job as the reason to start the business in relatively high (89%) and the share to be
independent is also considerable. Activity selection has done on the basis of experience
(25.5%) and the desires (43.6%). As expected with the existing background and with their
pessimistic view, awareness level for this group is also considerably low but not worse than
cluster one and three.

International Journal of Small Business and Entrepreneurship Research
Vol.5, No.6, pp.1-26, November 2017
___Published by European Centre for Research Training and Development UK (www.eajournals.org)
22 ISSN 2053-5821(Print), ISSN 2053-583X(Online)
Data reported in Table 9 shows that entrepreneurial self-efficacy is least for this cluster (0.77).
Especially, keeping financial records, working under pressure and conflict, achieving multiple
goals, innovations as well as searching new markets or meet sales goals are lowest for them.
Thus, overall ESE score is very low. However, in contrast, locus of control (0.6) level is fairly
high for them showing their independence in the business.
Initial capital for the businesses of this segment is somewhat high. They have used private
savings and informal loans to start the business (71%). Future funding arrangements are not
necessary for the majority of entrepreneurs. However, they have voted for the credit problem
(14.5%) but as usual for the sector formal banking connections are very low (1.8%).
Table 15: Poverty level and contribution of enterprise income by cluster
Clusters
Item 1 2 3 4 5
Main source
Yes 67.6 80.4 62.1 64.0 83.6
Net income priority
Food 82.6 66.7 89.7 65.8 81.8
Business improvement 10.9 23.8 3.4 23.4 7.3
Poverty
On or above poverty line 54.3 85.7 75.9 73.9 55.0
Source: Authors calculations based on sample survey
In contrast to the cluster one and three, majority of this group per see has their own permanent
working sites as shown in Table 13. However, no contributory or innovative productions can
be seen in the section but more established business like groceries, hardware stores etc.
Apparently have no other complaints but general economic condition related problems are at
the top. Hence, economy wide issues or macroeconomic environment competitiveness and
credit are the three main business problems. Competitiveness has immerged with product
homogeneity. Therefore, least diversification has fuelled an excessive competition which is the
major business problem for this group.
Table 15 shows that more than 83 percent of them fully survived from the enterprise income
and food prioritized .Though they the highest earners it is reported that the level of poverty is
high for the majority of the group (45%) showing high level of income variation within the
group. It should be noted that the net income share for the business improvement is the least
for this subgroup compared to all other groups who earns less. Most probably, majority of
entrepreneurs in this segment seem to be vulnerable to consumption shocks due to their pattern
of life, informal loans or erroneous money management.
SUMMARY AND CONCLUSIONS
In search of underlying segmentations of the microenterprise sector in urban informal sector,
Ward’s hierarchical cluster analysis was run. Under this technique, objects are classified so
that each object is very similar to others in the cluster with regard to some predetermined
selection criterion. The resulting clusters or objects exhibit high internal (within-cluster)
homogeneity & high external (between-cluster) heterogeneity.

International Journal of Small Business and Entrepreneurship Research
Vol.5, No.6, pp.1-26, November 2017
___Published by European Centre for Research Training and Development UK (www.eajournals.org)
23 ISSN 2053-5821(Print), ISSN 2053-583X(Online)
The majority of entrepreneurs in cluster one is previously unemployed it can be seen
involuntary entrance due to lack of opportunities in the formal sector. This is often called as
labor market segmentation which describes the insufficiency of job opportunities for the lower
belt of the market. This implies that there are no sufficient job opportunities for the people
who have low education and experience. Thus they have entered in to this field at very young
ages. Then they have adopted to do very simple less technical lower end economic activities in
order to provide food for the family though it is not sufficient but having satisfying behavior.
This is indicated by several factors. The basic findings show that the entrepreneurs in cluster
one are hardworking, earn less, poor but they have been in the sector for a long time period.
Majority of them are self-employed from the beginning to more than 15 years showing no
graduation. Further, regardless of the firm age, working site is temporary for the majority. This
clearly confirmed their unwillingness to grow. Low educational level and high rate of
unemployed presumed that they have no accumulated human capital while high poverty rate
confirmed low level of physical capital as well. Even though they earn less they have stated
that they do not need funds to improve business while they have least complaints on business
problems. Further, they do not have strong vision to improve the enterprise as well. These
evidences clearly show that enterprises in this segment are “survival”.
Cluster three is least educated, oldest, retired and hard working group with low earnings and
less experienced in the field. This group is fairly volunteer to the field as well. Firm size is the
lowest with highest percentage of self-employees and more resembles cluster one in many other
aspects. This cluster clearly represents “survive forever” firms. The headed theme of running
a firm is not to be a dependent. They are surviving putting no burdens to the government. They
are neither consumption constrained nor no credit constrained. Further, people in this group
are not vulnerable. That is they have no competition between firm and the day today life needs.
The rate of motivation to become successful entrepreneur is least among the entrepreneurs in
these two clusters. Since they had involved in hardworking labor employments they might not
be physically wellbeing in efficient / active working. Especially, they cannot be taken into the
productive field changing their vision because they are not ready for those altitude changes
with the age level. Nevertheless, their entrepreneur skills are very low. Therefore they have to
be trained intensively for a growing firm. The possibility of getting effective and dedicative
training is least for this group with their socio economic, family background and specifically
with low educational level. Thus, motivation would be impossible for them. All in all, these
groups are not viable entrepreneurs that could be motivated to forefront in order to achieve
objectives of microenterprise sector to the economy.
It was indicated that the entrepreneurs in cluster two is more educated hard working and rich.
Education level is very high. Entrepreneurial self-efficacy is very high and marketing ability is
higher for them with very strong ability of establishing goals. Fairly high risk taking capacity
and therefore innovation is high as well. These basic findings clearly imply that cluster two is
the most viable entrepreneurs in urban microenterprise sector. They are credit constrained
though they are perfectly not “entrepreneurship is in the belly”. Considerable proportion has
effective need to become entrepreneurs. However, it is an essential requirement in forming
policies to develop skills and change attitudes complementary to enhancing credit facilities.
Competitiveness is the major problem which could be a resulting impact of low motivation
towards new markets, low levels of risk taking. Nevertheless, marketing strategies are very
weak in the group. They must be trained sufficiently to use credit facilities successfully to
graduate the firms to attain economy wide goals, but not a challenging issue.
International Journal of Small Business and Entrepreneurship Research
Vol.5, No.6, pp.1-26, November 2017
___Published by European Centre for Research Training and Development UK (www.eajournals.org)
24 ISSN 2053-5821(Print), ISSN 2053-583X(Online)
Cluster four is the largest of the subgroups with the youngest entrepreneurs and with youngest
firms. They reported a sort of internally controlled in nature and more dependent on outside
advices and supports in the decision making process. They have high willingness to grow but
competitiveness and general economic constraints. They clearly show that they are credit
binding with shortage of knowledge. Therefore, entrepreneurship skill development with
increasing awareness is key to make these firms graduated. Demand is not a key issue for them
but competitiveness. This might be attributed to the fact that they are not neither risk takers and
apparently nor innovators. Innovativeness, in the sense introducing something new or
marketing with a considerable diversification etc., are crucial to reduce completion within the
sector. The nature of the business naturally traces out or makes failure the undiversified
productions. It is evident that this group is at a transitory period. Thus they will be in the sector
as long as they are unemployed. This group represents the majority of the sample containing
42 percent shows a great possibility to become successful entrepreneurs provided the required
complementarities. It was quite interesting that cluster four is approachable with
entrepreneurial dynamics which can be acquired by the education. However, the essential skills
are needed to developed in order to make them remained in the sector as effective
entrepreneurs.
Proving a higher level of heterogeneity within the micro entrepreneurs in urban informal sector,
this analysis identified five main segments considering demographic, socioeconomic, business
related and also psychological factors related to micro entrepreneurs. According to
characteristics of the cluster membership, cluster one is “survival” while cluster three is
“survival forever” and cluster five seemed to be “self-sufficient”. Survival or survival-forever
groups cannot be assisted for the growth due to their setup and other related characteristics
while self-sufficient group has least capacity to expand within the micro context. All three
groups are therefore falls in to the category of “non-optimizing” in nature showing the least
possibility of growing. However, cluster two and four are cases to be concerned. Cluster two
and four are growth oriented and hence potential groups that could be finalized as the viable
micro entrepreneurial blocks which have greater potential to grow with the complementary
assistances. The current study utilized a scientific method in identifying potential
entrepreneurship. Thus, the study will be a guide to screen the micro entrepreneurship
specifically in the developing world in more sophisticated manner before commencing ad-hoc
policies on miss-specified targets.
REFERENCES
Audretsch, D. B., Carree, M. A., van, S. A., & Thurik, A. R. (2002). Impeded industrial
Bhattacherjee, A. (2012). Social science research: Principles, methods, and practices, 2nd
edition. Retrieved Dec 2012, from
Cunningham, W., & Maloney, W. F. (2001). Heterogeneity among Mexicos
microenterprises: An application of factor and cluster analysis. Economic Development
and Cultural Change, 5, 131-156.
Damayanthi, B.W.R, (2016). “Analyzing the Determinants of Entrepreneurial Activity Level
in Urban Micro Enterprises in Sri Lanka”, Proceedings of International Conference on
Business & Management, University of Sri Jayewardenepura, Sri Lanka,
Damayanthi, B.W.R, and Premaratne, G., (2015) “Entrepreneurial Engagement Choice and
Credit Constraints: Empirical Analysis of Urban Informal Microentrepreneurship in
Sri Lanka”, Asian Social Science Vol. 11, No. 26, doi:10.5539/ass.v11n26p

International Journal of Small Business and Entrepreneurship Research
Vol.5, No.6, pp.1-26, November 2017
___Published by European Centre for Research Training and Development UK (www.eajournals.org)
25 ISSN 2053-5821(Print), ISSN 2053-583X(Online)
Daniels, L. (1999). The role of small enterprises in the household and national economy in
Kenya: A significant contribution or a last resort? World Development, 27(1), 55-65.
Davidsson, P. (1989). Continued entrepreneurship and small firm growth. Stockholm: The
Economic Research Institute.
DCS. (2010). Sri Lanka Labour Force Survey : Annual report - 2009. Colombo: Department
of Census and Statistics.
De Mel, S., McKenzie, D., & Woodruff, C. (2008). Returns to capital in microenterprises:
Evidence from a field experiment. The Quarterly Journal of Economics, 123(4), 1329-
1372.
De Mel, S., McKenzie, D., & Woodruff, C. (2010). Wage subsidies for microenterprises.
American Economic Review: Papers & Proceedings 100, 614–618.
Evans, D., & Jovanovic, B. (1989). An etimated model of entrepreneurial choice under
liquidity constraints. Journal of Political Economy, 97, 808-827.
Freytag, A., & Thurik, R. (2007). Entrepreneurship and its determinants in a cross-country
setting. Journal of Evolutionary Economics, 17, 117–131.
Grilo, I., & Thurik, R. (2008). Determinants of entrepreneurial engagement levels in Europe
and the US. Industrial and Corporate Change, 17, 1113–1145.
Gunatilaka, R. (2008). Informal employment in Sri Lanka: Nature, probability of
employment, and determinants of wages. New Delhi: International Labour
Organization, subregional office for South Asia.
Hair, J. F., Anderson, R. E., Tatham, R. L., & Black, W. C. (1998). Multivariate Data
Analysis (5 ed.). New Jersey: Prentice Hall.
Herzberg, F. (1966). Work and the nature of man. New York: The World Publishing Co.
ILO. (1991). Measurement of the informal economy. Geneva: International Labor Office.
Levenson, A. R., & Maloney, W. F. (1998). The informal sector, firm dynamics and
institutional participation. World Bank Working Paper no. 1988.
Lucas, J. R. (1978). On the size distribution of business. Bell Journal of Economics, 9 , 508-
523.
Mansfield, E. (1979). Microeconomics: Theory and applications. New York: Norton.
McClelland, D. (1961). The Achieving Society. Van Nostrand: Princeton, NJ.
Mead, D. C., & Liedholm, C. (1998). The dynamics of micro and small enterprises in
developing countries. World Development 26(1), 61–74.
Morrisson, C., Lecomte, H.-B. S., & Oudin, X. (1994). Micro-enterprises and the
Institutional Framework . Paris: Development Centre of the Organisation for Economic
Co-operation and Development.
Roy, M.-A., & Wheeler, D. (2006). A survey of micro-enterprise in urban West Africa:
drivers shaping the sector. Development in Practice 16 (5), 452-464.
Shaw, J. (2004). Microenterprise occupation and poverty reduction inmicrofinance programs:
Evidence from Sri Lanka. World Development 32(7), 1247–1264.
Tacq, J. (1997). Multivariate analysis techniques in social science research : from problem to
Tokman, V. (2007). Modernizing the informal sector. UN/DESA Working Paper No. 42.
Williams, C. C. and Yousef, A. Y. (2014) Is Informal Sector Entrepreneurship Necessity- or
Opportunity-driven?
Some Lessons from Urban Brazil, Business and Management Research Vol. 3, No.
1http://dx.doi.org/10.5430/bmr.v3n1p41
Williams, C. C. and Yousef, A. Y. (2015) Theorizing entrepreneurship in the informal
sector in urban Brazil: A product of exit or exclusion? Journal of Entrepreneurship,
24(2). 148-16
International Journal of Small Business and Entrepreneurship Research
Vol.5, No.6, pp.1-26, November 2017
___Published by European Centre for Research Training and Development UK (www.eajournals.org)
26 ISSN 2053-5821(Print), ISSN 2053-583X(Online)
Woodward, Douglas. Rolfe, Robert & Ligthelm, André, (2014), Microenterprise,
Multinational Business Support, and Poverty Alleviation in South Africa's Informal
Economy, Journal of African Business Vol. 15 (1)