potential economic impacts of zebra mussels on the hydropower
TRANSCRIPT

Potential Economic Impacts of Zebra Mussels on the Hydropower Facilities in the Columbia River Basin
Prepared for the Bonneville Power Administration
By
Stephen Phillips Program Manager
Aquatic Nuisance Species Project Pacific States Marine Fisheries Commission
and
Tim Darland, US Army Corps of Engineers, Bonneville Lock and Dam, Cascade Locks, Oregon Dr. Mark Sytsma, Center for Lakes and Reservoirs, Portland State University, Portland, Oregon
February 2005
2
Summary
The purpose of this study was to estimate costs to the Federal Columbia River Power System hydroelectric projects in the event of a zebra mussel infestation. We estimated hydropower maintenance costs associated with zebra mussels by examining the Bonneville Dam First Powerhouse, costs associated with Asian clam (Corbicula fluminea) control at Bonneville, and a survey of zebra mussel mitigation costs at other hydropower generation facilities in North America. We found that the one-time cost for installing zebra mussel control systems at hydroelectric projects could range from the hundreds of thousands of dollars to over a million dollars per facility. The estimated cost for a hypothetical zebra mussel mitigation strategy, based upon two response scenarios (a sodium hypochlorite (NaOCl) injection system and anti-fouling paint), at 13 select hydroelectric projects, was $23,621,000. The cost per generator was $62,599 for the NaOCl system, and $81,000 for antifouling paint (not including labor). Removal, painting, sandblasting and installation could potentially double antifouling paint treatment costs.
We estimated that if a NaOCl system was installed at an “average” size Columbia River Basin facility, assuming intermittent use, annual operating costs would likely not exceed $100,000. Operating costs will vary depending on the facility, degree of infestation, environmental permits, etc.
This investigation found that once utilities initiate long-term mussel control programs, they usually become part of routine maintenance at annual, biennial, or longer intervals, depending on how rapidly the mussels recolonize the systems. A detailed management plan is needed to determine the best zebra mussel mitigation and control strategy for the FCRPS. The management plan should detail key agency contacts and coordination; control technologies; permit requirements; costs for the hydroelectric and nuclear facilities, transportation, upstream and downstream fish passage system; and the environmental impacts of likely mitigation technologies. Engineers, biologists and other relevant experts with hands-on experience in developing zebra mussel mitigation strategies should be sought out and utilized.
3
I. Introduction The zebra mussel (Dreissena polymorpha) is a small bivalve mollusk with two matching half shells. Its name is derived from the striped pattern on its shell. The zebra mussel originated in the Balkans, Poland, and the former Soviet Union and was introduced in the mid-1980’s into the Laurentian Great Lakes as a result of ballast water discharge. Since its introduction, the zebra mussel has spread to 22 states and two Canadian provinces. It rapidly dispersed throughout the Great Lakes and major river systems from the Mississippi River east due to its tremendous reproductive capability and the ability to attach itself to boats navigating from infested waters. It is widely accepted that trailered boat activity is the most effective means by which adult and larval zebra mussels are transported overland to uninfected waters.
Colonization of the Columbia River Basin (CRB) by zebra mussel could affect all submerged components and conduits of the Federal Columbia River Power System (FCRPS) including trash racks, raw water distribution systems (headers), turbine bearing cooling systems, diffuser plates, service and fire-water systems, and fish passage facilities. Zebra mussel veligers (larvae) can attach to substrates in water velocities up to about 2 meters per second (O'Neill, 1993). Clarke and McMahon (1995) reported, however, that zebra mussels have difficulty producing byssal threads – the protein strands that they use to attach to hard surfaces – at velocities greater than 0.27 meters per second. Despite the uncertainty about zebra mussel tolerance to water velocity, irregularities such as cracks and crevices and scaling in older pipes and flanges can provide lower velocity refugia where zebra mussel settlement can occur. The attached mussels, in turn, then produce additional low flow refuges, allowing colonization in otherwise inhospitable flow environments. Settlement can also occur when water flow is reduced during generation down-time as conditions become more conducive to attachment. Zebra mussel densities within the CRB could vary widely depending on water chemistry, food availability, and breeding population. After their initial introduction, zebra mussel populations can rapidly increase by orders of magnitude, and then similarly decrease. In a brief literature search, we found Eurasian zebra mussel population densities ranging up to 40,000 mussels per square meter (Neumann et al, 1993). Under ideal conditions in the Laurentian Great Lakes zebra mussel densities reach 700,000 – 800,000 per square meter (Kovalak et al, 1993). In the lower Mississippi River, where the zebra mussel has been introduced, densities of 400,000 per square meter have been reported (Kraft, 1995). The Mississippi has an ideal environment for zebra mussels, in part because food resources are abundant (Kraft, 1995). While Columbia River water quality parameters are favorable to zebra mussel colonization (Athearn 1999), the Columbia River’s lower plankton densities in comparison to the Mississippi or Great Lakes, may limit zebra mussel population densities. Drake and Bossenbroek (2004) identify the Columbia River as being at high risk for an invasion.
Densities of zebra mussels in the Pacific Northwest will determine the severity of impacts on hydropower, navigation, and fish passage facilities. Zebra mussel densities in
4
powerhouses will depend on the configuration of the water systems and water conduit materials. The potential economic impacts of zebra mussels on hydropower generation facilities in the Columbia River will be determined by a number of factors including density, growth rate, and maintenance costs. While density and growth are affected by environmental factors as noted above, maintenance costs will also be driven by the difficulty in accessing fouled areas, the methods available for removal and control, and the amount of time available for maintenance activities. The hydropower maintenance costs associated with zebra mussels estimated here are based, in part, on the examination of the Bonneville Dam First Powerhouse, the costs associated with Corbicula1 control, and a survey of zebra mussel mitigation costs at other hydropower generation facilities in North America. While there are differences between the facilities and operations at Bonneville Dam and the 30 other federal hydropower projects in the CRB, they are expected to be similarly impacted by zebra mussels (e.g. bio-fouling of turbine cooling components). For a listing and map of Federal hydropower projects in the Bonneville Power Administration marketing system, as well as other major projects in the CRB, please refer to Appendices 1a, 1b, and 2.
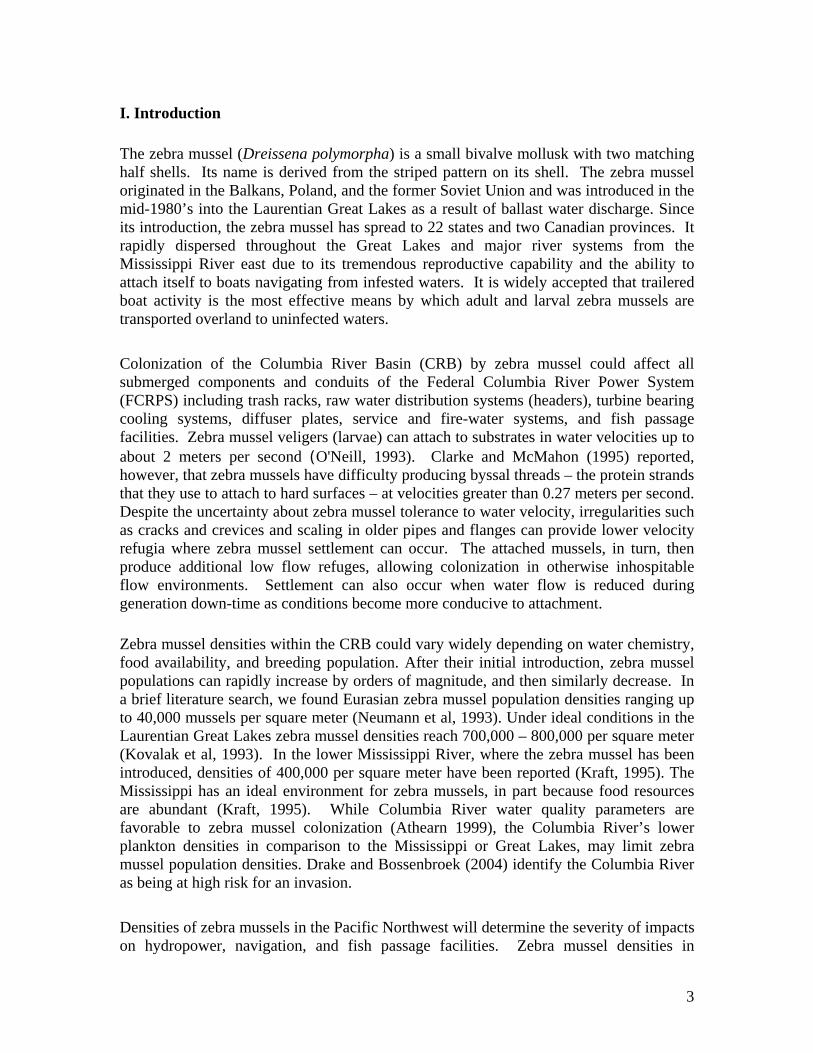
Figure 1: Condenser tube sheet with zebra mussel fouling
(Photo Credit: SGNIS). The BPA also markets the power from the Columbia Generating Station, a 1,107 megawatt (mw) nuclear facility located near Richland, Washington. The facility is owned by Energy Northwest. Therefore, we have included examples of zebra mussel control costs at other U.S. nuclear power generation facilities. 1 The Asian clam (Corbicula fluminea) was first discovered in the Columbia River drainage in 1934. It is
now found in the lower and middle Columbia and lower Snake Rivers. Though Corbicula do not create the severe biofouling problems associated with zebra mussels, some believe that currently more money is spent in the US on Corbicula control than on zebra mussel control. While these claims have not been substantiated, Corbicula provide, to some extent, a surrogate for zebra mussel control costs.
5
II. Findings: Bonneville First Powerhouse The Bonneville First Powerhouse was used as a surrogate to help determine costs for other CRB projects. Estimates of impacts/costs to the raw water system on the first powerhouse were developed by Stephen Phillips (PSMFC), Tim Darland (USACE), and Steve Culbertson, Mechanical Crew Foreman, Bonneville Dam (USACE).
1. Header Pipe: Cleaning a clogged header pipe is a labor intensive undertaking. One estimate for installing replacement piping in the powerhouse is $4 million (Culbertson, 2004). If a redundant portion of the raw water system had to be built as part of a zebra mussel mitigation strategy, this estimate could be used as a proxy for a portion of the cost.
2. Main Generator Coolers: These coolers are flushed semi-annually for
Corbicula removal. In addition to this semi-annual maintenance, coolers are serviced as part of the five-year overhaul process. While the unit is out of service, the coolers are removed, dismantled, and cleaned. Cooler servicing requires 150 man hours at a cost of $65 an hour or a total of $9,750, with the unit being down for about four weeks. A zebra mussel infestation could require that maintenance be performed more frequently2. Please refer to Figure 1 for a condenser tube sheet with zebra mussel fouling. Because of the down time incurred for maintenance, lost power generation revenue could become an issue (see below).
3. Raw Water 1/8” Diameter Screen (with Automatic Cleaners): Two or
three turbine screen-units are cleaned manually each year. The cleaning requires two people for two days at a cost of $65 an hour multiplied by three units, or $6,240 annually. The presence of zebra mussels would likely necessitate more frequent cleaning3 and, because of down time, lost power generation revenue could become an issue (see below).
4. Sump: Two of the four chambers in the sump were cleaned 15 years ago.
This was a labor-intensive activity that required seven people, eight hours a day for a total of seven days. Total estimated cost of cleaning during the present labor rate would be about $25,000. It is likely that Corbicula were present in the sump but the quantities are unknown (Culbertson, 2004). A zebra mussel infestation could increase cleaning frequency.
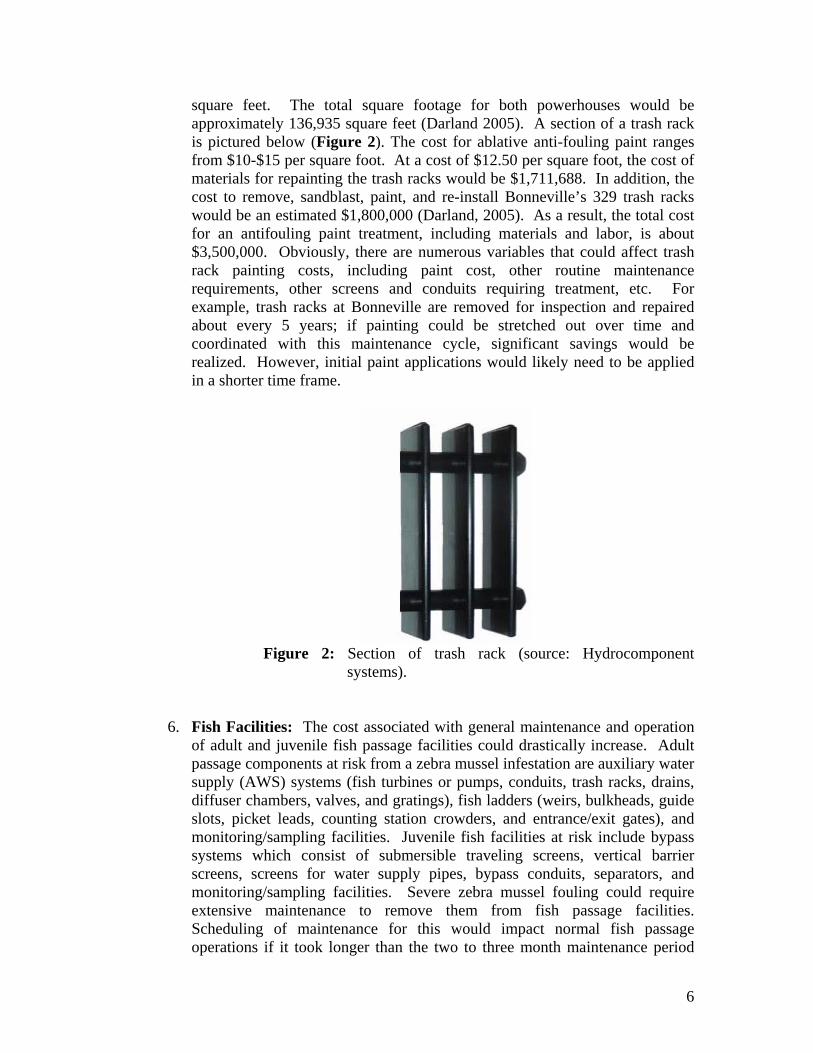
5. Trash Rack: One potential solution to minimize zebra mussel colonization on
trashracks would be to repaint them with anti-fouling paint. Bonneville’s First Powerhouse has 185 trash racks with a surface area of about 77,000 square feet; the Second Powerhouse has 144 trash racks and an area of about 59,935
2 Main generator coolers: If all the generator coolers at both Bonneville Powerhouses were
serviced annually, the cost would be: $9,750 x 21 units or a total of $204,750. 3 The frequency of raw water screen cleanings could also increase, if all of the screens were
cleaned annually, the cost would be: $6,240 (3 unit cost) x 7 = $43,680 (21 unit cost).
6
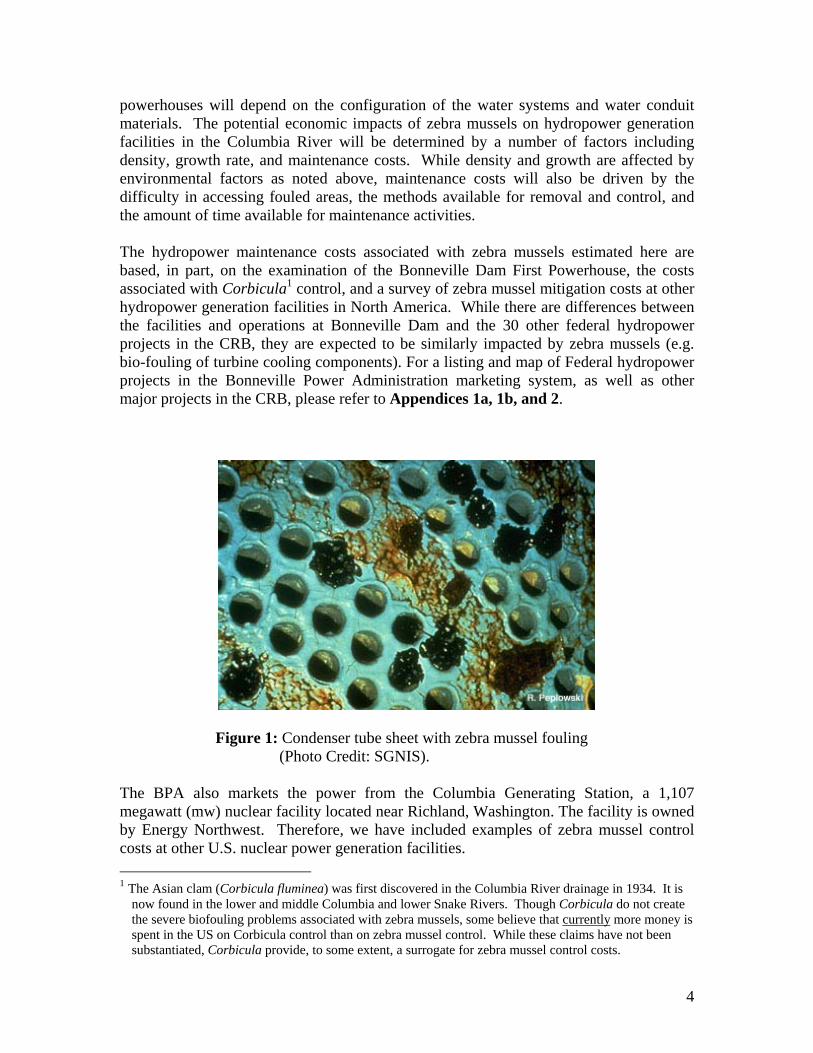
square feet. The total square footage for both powerhouses would be approximately 136,935 square feet (Darland 2005). A section of a trash rack is pictured below (Figure 2). The cost for ablative anti-fouling paint ranges from $10-$15 per square foot. At a cost of $12.50 per square foot, the cost of materials for repainting the trash racks would be $1,711,688. In addition, the cost to remove, sandblast, paint, and re-install Bonneville’s 329 trash racks would be an estimated $1,800,000 (Darland, 2005). As a result, the total cost for an antifouling paint treatment, including materials and labor, is about $3,500,000. Obviously, there are numerous variables that could affect trash rack painting costs, including paint cost, other routine maintenance requirements, other screens and conduits requiring treatment, etc. For example, trash racks at Bonneville are removed for inspection and repaired about every 5 years; if painting could be stretched out over time and coordinated with this maintenance cycle, significant savings would be realized. However, initial paint applications would likely need to be applied in a shorter time frame.
Figure 2: Section of trash rack (source: Hydrocomponent
systems).
6. Fish Facilities: The cost associated with general maintenance and operation
of adult and juvenile fish passage facilities could drastically increase. Adult passage components at risk from a zebra mussel infestation are auxiliary water supply (AWS) systems (fish turbines or pumps, conduits, trash racks, drains, diffuser chambers, valves, and gratings), fish ladders (weirs, bulkheads, guide slots, picket leads, counting station crowders, and entrance/exit gates), and monitoring/sampling facilities. Juvenile fish facilities at risk include bypass systems which consist of submersible traveling screens, vertical barrier screens, screens for water supply pipes, bypass conduits, separators, and monitoring/sampling facilities. Severe zebra mussel fouling could require extensive maintenance to remove them from fish passage facilities. Scheduling of maintenance for this would impact normal fish passage operations if it took longer than the two to three month maintenance period
7
that is now allowed in the winter. With the added workload and short timeframe, we would likely need to contract for a number of maintenance activities, increasing the cost of project operations.
7. Cost of Generation Down-Time: It has often been reported that zebra
mussel mitigation will result in potential hydropower generation down-time. This down-time could be expensive, as a megawatt hour is worth approximately $40. The value of daily (24 hours) generation capacity for a single turbine unit at the First Powerhouse is about $46,000. In the CRB, however, down-time caused by maintenance does not necessarily reduce system generation capacity. For example, during spring and summer, water is spilled for juvenile fish passage resulting in down-time. When not spilling for fish, the power system is managed to balance loads among projects to compensate for down-time at another project.
III. Findings: Control Costs at Other Projects in North America Please refer to Table 1 for a summary of zebra mussel mitigation costs at select projects in the U.S. and Canada A. Tennessee River Basin, Tennessee Valley Authority: The Tennessee Valley Authority (TVA) has 29 hydropower plants, 11 fossil-fueled plants, and three nuclear power plants.
The TVA currently spends about $225,000 annually on zebra mussel control (Brodie, 2005).
At its nuclear power plants, the TVA use biocides (e.g. Clamtrol) to treat for bio-fouling of their raw water piping. These chemicals have a National Pollution Discharge Elimination System permit for each plant. Fossil-fueled plants that choose to treat for bio-fouling use Clamtrol and thermal control (TVA rents the transportable thermal control unit). [Note: In 2000, the TVA estimated the rental costs for thermal treatment to be $50,000 to $70,000 per month, compared to $200,000 to $300,000 for purchasing the unit (Kerley et al.).]
According to the TVA, hydropower project mitigation (e.g., cleaning condensers, raw water piping and trash racks) for zebra mussels is rare and has now become part of routine maintenance. Zebra mussel veligers (larvae) do not settle in the cooling systems in sufficient numbers to require mitigation. The TVA discontinued its monitoring program in the fall of 2002 because zebra mussels were found throughout the Tennessee Valley. Any removal of zebra mussels from conduits and coolers is undertaken by pipe cleaning brushes and Teflon balls. However, there are concerns that under “cool” summer conditions, zebra mussel densities could increase and pose a threat to hydropower operations
8
(Brodie, 2005). To date, the TVA has not experienced outages or major problems associated with the zebra mussel.
B. Cumberland River Basin, Nashville District, USACE: In 1993, an automated chlorine injection system was installed at two of the nine district hydropower plants4 in the Cumberland River Basin to protect its raw water systems from zebra mussel infestations. The costs of the units were $57,983 for Cheatham and $70,868 for Barkley (manufacturer: Prominent Fluid Controls Ltd.). The installation was performed by the Nashville District Corps (NDC). According to the NDC (Swor, 2005), while the units were probably tested after their installation, they were never put into use because zebra mussel populations did not reach high enough nuisance levels5. Prior to making the decision to install chlorine injection systems, NDC and the Tennessee Valley Authority prepared an Environmental Assessment under the National Environmental Policy Act (NEPA).
C. Niagara River, Ontario Power Generation, Canada Ontario Power Generation (OPG), formerly Ontario Hydro, has 17 hydroelectric, nuclear and fossil fuel power plants. They incurred expenses of between $15 million and $18 million to retrofit their power plants due to a zebra mussel infestation (Magee et al., 1997). In the late 1980’s, when zebra mussels arrived in the Niagara River system, OPG installed an on-line sodium hypochlorite (NaOCl) control system. After its installation, the piping material, which was made of ABS (acrylonitrile butadiene styrene), failed and had to be replaced with a more durable pipe material called Kynar. The OPG’s current zebra mussel mitigation strategy for many of its fossil and nuclear plants is the NaOCl system, applied seven days a week, 24 hours a day (May – November). OPG’s Niagara Plant Group (Welland River) hydropower operations can tolerate low levels of zebra mussel infestation, unlike its fossil and nuclear facilities. With the use of NaOCl (0.5-0.7 ppm) at a temperature above 20°C for three weeks, OPG is able to achieve a 100 percent kill of zebra mussels at its hydropower facilities. This treatment usually occurs in the period from August 1 to September 30 because of water temperature requirements. The OPG must meet
4 Barkley Dam (3 generators, 166 mw) and Cheatham Dam (4 generators, mw 713). 5 In 1993 the estimated annual operating cost for the automated systems assuming installation at
nine Cumberland River Basin hydro projects was between $100,000 and $500,000 (Bivens 1993); or $11,111 - $55,556 per facility, or with 3% inflation $15,842 - $79,210 per facility.
9
water quality standards through a Certificate of Approval process (similar to the U.S.’s NPDES permit). Outlet water must be below 10 ppb of NaOCl. OPG’s capital costs (in 1990 U.S. dollars) for installation of a NaOCl system were $403,000 for Sir Adam Beck (SAB) #1 (470 mw, 10 generators), and $805,088 for Sir Adam Beck (SAB) #2 (1290 mw, 16 generators). OPG’s annual costs for maintaining this system include three technicians at $65 an hour for four weeks (160 hours) which equals $31,200 (U.S. dollars). D. Entergy (Nuclear) James A. Fitzpatrick Nuclear Power Plant, Buchanan New York (JAF): The JAF plant uses mechanical mussel removal, which is performed every two to three years in the intake tunnel and screen house, at a cost of $150,000 to $200,000. In 1990, a NaOCl system was installed at a cost of $300,000. This system provides continuous low-level chlorination protection to all service water systems. Estimated annual operating costs for the system range from $60,000 to $80,000 (Kahabka, 2004). Indian Point 3 Nuclear Power Plant, Oswego, New York (IP3): IP3’s annual operating cost for the NaOCl system for zebra mussel mitigation was in the same range as JAF’s costs. Both JAF and IP3 have service water flow of about 36,000 gallons per minute (Kahabka, 2004).
IV. Discussion Ontario Power Generation’s (OPG) online NaOCl system provided the most useful information regarding the potential costs of mitigation strategies at infested hydropower projects. Based on OPG’s costs (with annual inflation rate of 3 percent), the current cost for a NaOCl system installation would be approximately $627,861 at SAB #1 and $1,254,200 for SAB #2. The Nashville District Corps (NDC) costs (with inflation) for a NaOCl system were $82,670 for Cheatham Dam and $101,041 for Barkley Dam. The difference in the installation price between OPG and NDC is the NDC cost is equipment only, as they installed their own systems. Annual operating costs for a NaOCl system range from OPG’s $31,200 to NCD’s $15,842 - $79,210 estimate. These costs are difficult to compare because the OPG cost is for four weeks per year, and the NCD’s estimate is without in situ confirmation. For planning purposes, if a NaOCl system were installed at an “average” size CRB facility and assuming intermittent use, annual operating costs would likely not exceed $100,000. The cost will vary depending on the facility, degree of infestation, environmental permits, etc.
The TVA provided the only estimate for thermal treatment, with an equipment cost of $200,000 to $300,000, unadjusted for inflation. The TVA has never used thermal treatment at its hydropower facilities.
10
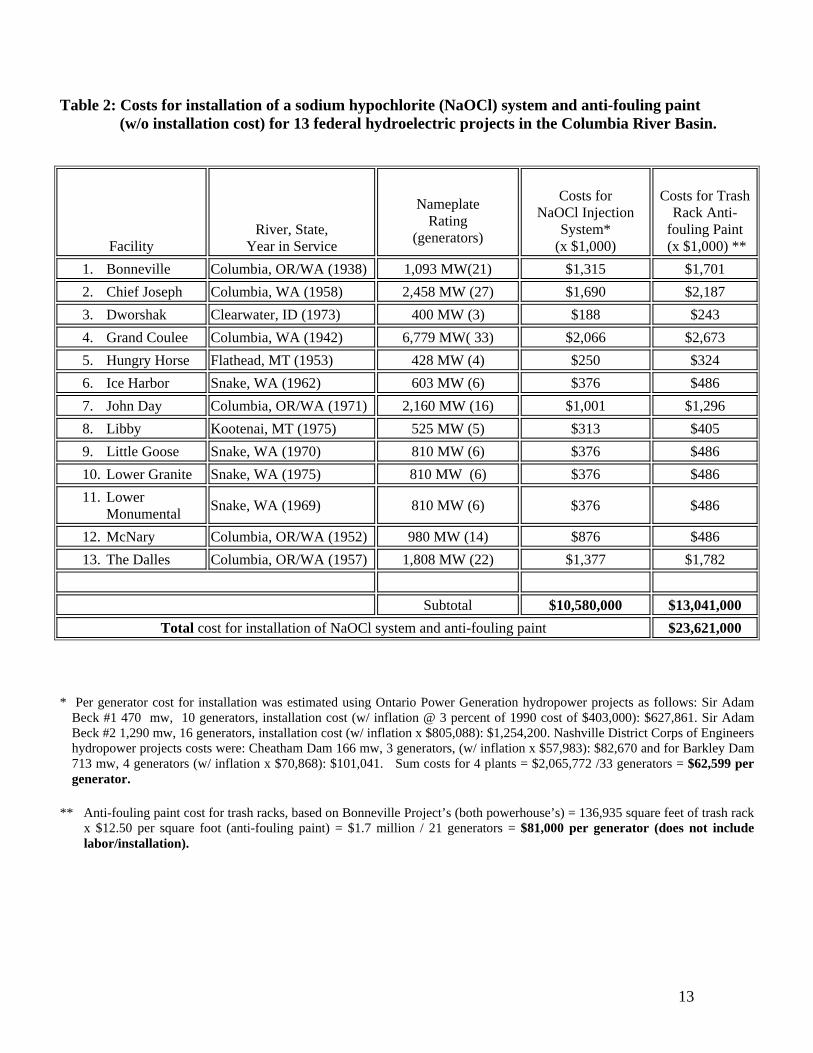
In Table 2, OPG’s installation costs and the NDC equipment cost of its NaOCl system were used to estimate the costs for 13 of 31 federal hydroelectric projects in the Columbia, Snake, Clearwater, Kootenai, and Flathead rivers. Using the NaOCl system as a mitigation strategy – assuming 13 infested projects – the capital cost of the system would be about $10,580,000 (or $62,599 per generator). Other possible costs could include anti-fouling paints or other zebra mussel-toxic construction materials. For example, in Table 2 we estimated the cost of anti-fouling paints for powerhouse trash racks to prevent zebra mussel settlement. The material cost came to $13,041,0006 or $81,000 per generator. Based on the costs listed in Table 1, we estimate costs for zebra mussel control, using two cost variables at 13 hydropower facilities, would total $23,621,000 plus annual operating costs.
There could be other capital costs, including replacement of current raw service water piping with galvanized or copper piping, or construction of redundant service water systems. As previously mentioned, the estimate to replace service water piping in Bonneville’s First Powerhouse is $4,000,000. More frequent servicing of raw water screens and generator coolers caused by zebra mussels fouling could also result in significant additional maintenance costs (including lost generation income); especially if cleaning takes more than one generator off line at a time.
Zebra mussel mitigation costs will depend on population densities, location of initial infestation in the CRB, and how rapidly and widely zebra mussels spread throughout the region. It is unlikely that, if and when zebra mussels arrive into the Pacific Northwest, they will infest the entire CRB. For example, an infestation at Banks Lake or Lake Koocanusa could require mitigation measures or consideration of such measures at all the projects downstream of the infestation; while an infestation in the middle Columbia (i.e. McNary or John Day), would initially require a more localized response (at least in the short term) since fewer projects would be involved. Electric utilities in the Great Lakes and elsewhere east of the Mississippi have adapted to zebra mussel infestation. The OPG implemented a successful mitigation plan at its Niagara facilities. In other infested projects we surveyed, infestations didn’t significantly impact hydropower facilities -- most likely because of less favorable environmental conditions for mussel growth (e.g. Cumberland and Tennessee River Basins).
An estimated cost for zebra mussel mitigation at a nuclear facility, based on the Entergy-owned facility in Oswego NY, is $467,390, plus annual operating costs of $109,058 (adjusted for inflation)7.
According to an ongoing University of Notre Dame study, much of the western United States may not be as susceptible as previously thought to a zebra mussel invasion; but once introduced, the potential for significant economic impact could be high in the CRB 6 As referenced on page 4, removal, painting, sandblasting and installation could potentially double anti-
fouling paint treatment costs. 7 In our search for information, we came across an instance of zebra mussels causing reduced power
production at a nuclear power plant. In 1999, Fermi II nuclear power plant (south of Detroit) reported a reduced power due to maintenance on a heat exchanger because of zebra mussel fouling (USNRC, 1999).
11
(Bossenbroek, 2005). Because of this, resources to control the spread should be concentrated at points of entry to western river basins (Drake and Bossenbroek, 2004).
At this time, installation of zebra mussel mitigation equipment in the CRB is not necessary. However, based on recommendations from hydropower managers from the East Coast and the fear of an eventual infestation in the CRB, it would be prudent for BPA to undertake additional zebra mussel mitigation planning. Planning should address zebra mussel control in the powerhouse and fish passage facilities, permitting for environmental impacts, and the establishment of needed intergovernmental processes. Currently, the Western Regional Panel of the Aquatic Nuisance Species Task Force is developing a rapid response plan for zebra mussels in the CRB. This plan should be useful for developing an overall mitigation strategy for zebra mussels. An Environmental Assessment (EA) is generally an initial screening analysis and is usually less costly than the more detailed analysis typical of an Environmental Impact Statement (EIS). The permitting process for a zebra mussel mitigation strategy using a biocide could require a significant time commitment. The numerous environmental issues in the CRB would almost certainly require an EIS before any zebra mussel mitigation activity could be implemented.
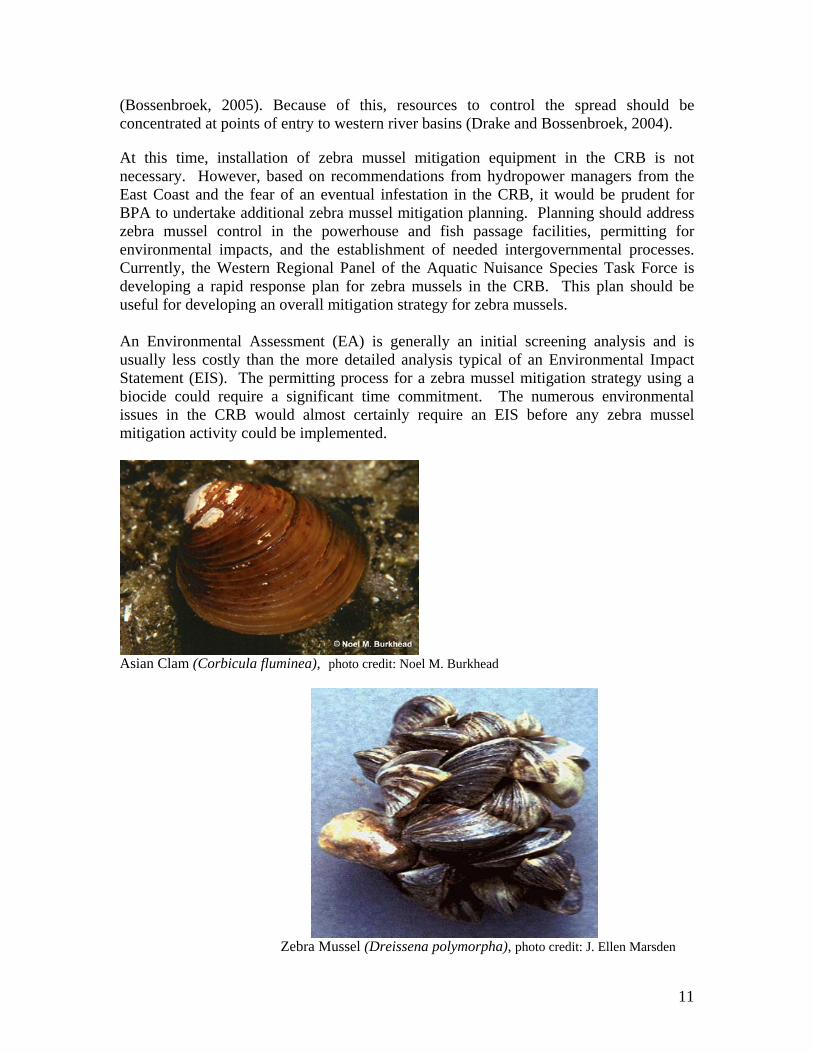
Asian Clam (Corbicula fluminea), photo credit: Noel M. Burkhead
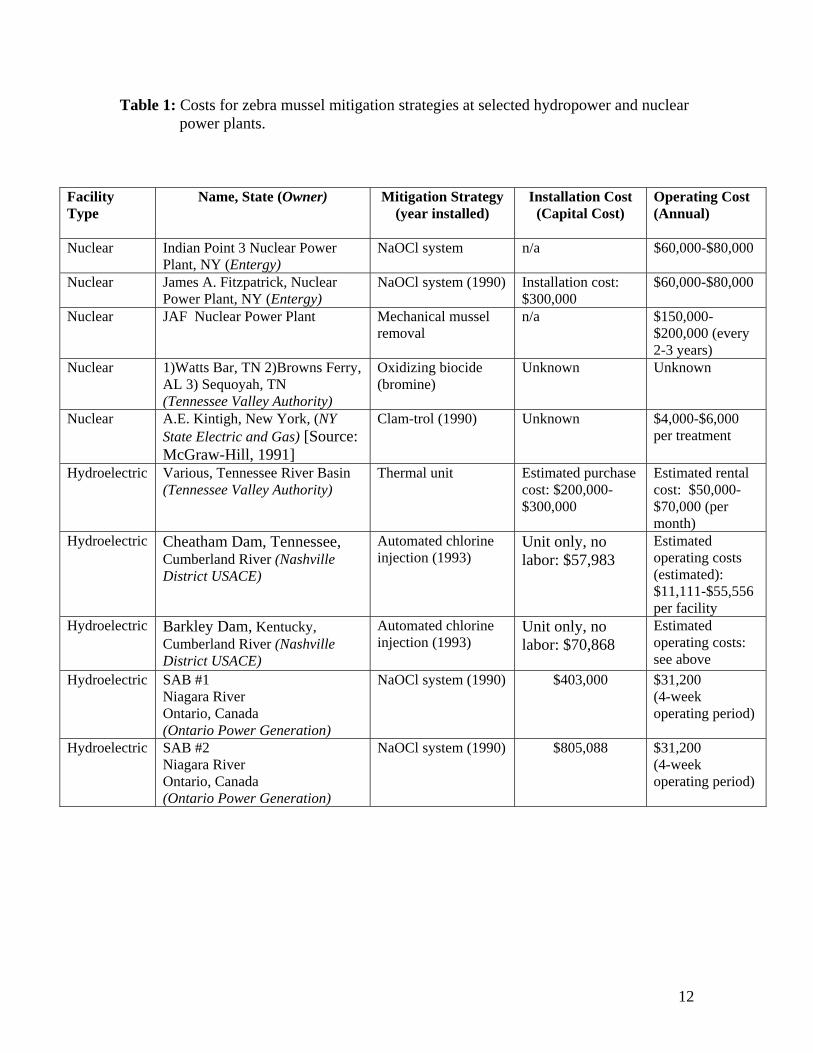
Zebra Mussel (Dreissena polymorpha), photo credit: J. Ellen Marsden
12
Table 1: Costs for zebra mussel mitigation strategies at selected hydropower and nuclear power plants.
Facility Type
Name, State (Owner) Mitigation Strategy (year installed)
Installation Cost (Capital Cost)
Operating Cost (Annual)
Nuclear Indian Point 3 Nuclear Power Plant, NY (Entergy)
NaOCl system n/a $60,000-$80,000
Nuclear James A. Fitzpatrick, Nuclear Power Plant, NY (Entergy)
NaOCl system (1990) Installation cost: $300,000
$60,000-$80,000
Nuclear JAF Nuclear Power Plant Mechanical mussel removal
n/a $150,000- $200,000 (every 2-3 years)
Nuclear 1)Watts Bar, TN 2)Browns Ferry, AL 3) Sequoyah, TN (Tennessee Valley Authority)
Oxidizing biocide (bromine)
Unknown Unknown
Nuclear A.E. Kintigh, New York, (NY State Electric and Gas) [Source: McGraw-Hill, 1991]
Clam-trol (1990) Unknown $4,000-$6,000 per treatment
Hydroelectric Various, Tennessee River Basin (Tennessee Valley Authority)
Thermal unit Estimated purchase cost: $200,000- $300,000
Estimated rental cost: $50,000-$70,000 (per month)
Hydroelectric Cheatham Dam, Tennessee, Cumberland River (Nashville District USACE)
Automated chlorine injection (1993)
Unit only, no labor: $57,983
Estimated operating costs (estimated): $11,111-$55,556 per facility
Hydroelectric Barkley Dam, Kentucky, Cumberland River (Nashville District USACE)
Automated chlorine injection (1993)
Unit only, no labor: $70,868
Estimated operating costs: see above
Hydroelectric SAB #1 Niagara River Ontario, Canada (Ontario Power Generation)
NaOCl system (1990) $403,000
$31,200 (4-week operating period)
Hydroelectric SAB #2 Niagara River Ontario, Canada (Ontario Power Generation)
NaOCl system (1990) $805,088
$31,200 (4-week operating period)
13
Table 2: Costs for installation of a sodium hypochlorite (NaOCl) system and anti-fouling paint (w/o installation cost) for 13 federal hydroelectric projects in the Columbia River Basin.
Facility River, State,
Year in Service
Nameplate
Rating (generators)
Costs for
NaOCl Injection System*
(x $1,000)
Costs for Trash
Rack Anti-fouling Paint (x $1,000) **
1. Bonneville Columbia, OR/WA (1938) 1,093 MW(21) $1,315 $1,701 2. Chief Joseph Columbia, WA (1958) 2,458 MW (27) $1,690 $2,187 3. Dworshak Clearwater, ID (1973) 400 MW (3) $188 $243 4. Grand Coulee Columbia, WA (1942) 6,779 MW( 33) $2,066 $2,673 5. Hungry Horse Flathead, MT (1953) 428 MW (4) $250 $324 6. Ice Harbor Snake, WA (1962) 603 MW (6) $376 $486 7. John Day Columbia, OR/WA (1971) 2,160 MW (16) $1,001 $1,296 8. Libby Kootenai, MT (1975) 525 MW (5) $313 $405 9. Little Goose Snake, WA (1970) 810 MW (6) $376 $486 10. Lower Granite Snake, WA (1975) 810 MW (6) $376 $486 11. Lower
Monumental Snake, WA (1969) 810 MW (6)
$376
$486
12. McNary Columbia, OR/WA (1952) 980 MW (14) $876 $486 13. The Dalles Columbia, OR/WA (1957) 1,808 MW (22) $1,377 $1,782
Subtotal $10,580,000 $13,041,000
Total cost for installation of NaOCl system and anti-fouling paint $23,621,000
* Per generator cost for installation was estimated using Ontario Power Generation hydropower projects as follows: Sir Adam Beck #1 470 mw, 10 generators, installation cost (w/ inflation @ 3 percent of 1990 cost of $403,000): $627,861. Sir Adam Beck #2 1,290 mw, 16 generators, installation cost (w/ inflation x $805,088): $1,254,200. Nashville District Corps of Engineers hydropower projects costs were: Cheatham Dam 166 mw, 3 generators, (w/ inflation x $57,983): $82,670 and for Barkley Dam 713 mw, 4 generators (w/ inflation x $70,868): $101,041. Sum costs for 4 plants = $2,065,772 /33 generators = $62,599 per generator.
** Anti-fouling paint cost for trash racks, based on Bonneville Project’s (both powerhouse’s) = 136,935 square feet of trash rack x $12.50 per square foot (anti-fouling paint) = $1.7 million / 21 generators = $81,000 per generator (does not include labor/installation).
14
V. Conclusions
1. We found that the one-time cost for installing zebra mussel control systems at hydroelectric projects could range from the hundreds of thousands of dollars to over a million dollars per facility.
2. The cost for a hypothetical zebra mussel mitigation strategy, using an automated NaOCl injection system and anti-fouling paint, at 13 select hydroelectric projects, is estimated to be $23,621,000. The cost per generator would be $62,599 for the NaOCl system, and $81,000 for antifouling paint (not including labor). Removal, painting, sandblasting and installation could potentially double antifouling paint treatment costs.
3. We estimate that if a NaOCl system was installed at an “average” size Columbia River Basin facility, and assuming intermittent use, annual operating costs for mitigation would likely not exceed $100,000. Operating costs will vary depending on the facility, degree of infestation, environmental permits, etc.
4. Other mitigation capital costs could include replacement of current raw service water piping or construction of redundant service water systems. We estimated it would cost $4,000,000 to replace service water piping in Bonneville’s First Powerhouse. Increased servicing of raw water screens and generator coolers caused by zebra mussels fouling could also result in significant additional maintenance costs (including lost generation income), especially if cleaning takes more than one generator off line at a time. For example, if all of Bonneville’s First and Second Powerhouse raw water screens were cleaned annually, the maintenance cost would increase from $6,240 to $43,680.
5. Most utilities surveyed have waited until a zebra mussel infestation had been discovered before installing control systems.
6. It is difficult to reliably forecast how the FCRPS will operate if zebra mussels colonize raw water systems and external structures of the projects. It is anticipated that there will be some operational disruptions, forced outages, and increased maintenance requirements once an infestation occurs.
7. Nuclear power plants on the East Coast are more vigilant about protecting their
cooling systems. For critical components, where there is a zero tolerance for mussels, online systems such as oxidation, heat treatment, or molluscicide treatment are used up to 24 hours a day, seven days a week
8. This investigation found that once utilities initiate long-term mussel control
programs, they usually become part of routine maintenance at annual, biennial, or longer intervals, depending on how rapidly the mussels recolonize the systems. Recolonization depends on the effectiveness of the mitigation strategy and environmental conditions.
15
VI. Recommendations
1. With current monitoring programs already underway in the Columbia River Basin, it is likely that a zebra mussel infestation will be discovered before colonization is advanced. However, earlier detection would permit a more timely response. Therefore, expanded veliger sampling is recommended. Once zebra mussels have been discovered, detailed monitoring, planning, and coordination will be necessary.
2. Mitigation strategies (i.e., chemical control) in the Columbia River Basin may
require special permitting due to the presence of threatened and endangered species, state and federal environmental laws, and recent court decisions regarding aquatic pesticide use (Talent Decision, see appendix 3). An Environmental Impact Statement or Assessment, and other appropriate authorizations such as NPDES permits will be needed before hydropower facility managers can implement zebra mussel control systems. The numerous environmental issues in the CRB will almost certainly require an EIS (rather than the less expensive EA) before any zebra mussel mitigation activity can be implemented. The permitting process will require a significant time and resource commitment. Resource agencies need to plan for funding the necessary permitting activities.
3. A detailed management plan is needed to determine the best zebra mussel mitigation and control strategy for the FCRPS. The management plan should detail key agency contacts and coordination; control technologies; permit requirements; costs for the hydroelectric and nuclear facilities, transportation, upstream and downstream fish passage system; and the environmental impacts of likely mitigation technologies. Engineers, biologists and other relevant experts with hands-on experience in developing zebra mussel mitigation strategies should be sought out and utilized.
VII. Literature Cited
1. Athearn, Jim. 1999. Risk Assessment for Adult and Juvenile Fish Facilities on the
Mainstem Lower Snake and Lower Columbia Rivers Relative to a Potential Zebra Mussel Infestation. US Army Corps of Engineers, Northwest Division. Portland, Oregon.
2. Baxter, Dennis. 2005. Personal Communication. Tennessee Valley Authority.
Knoxville, Tennessee.
3. Bivens, Tony H. 1993. Strategies Employed by the Power Industry to Reduce or Eliminate Problems Caused by Zebra Mussels Zebra Mussel Research Technical Notes (zmr-4-05). US Army Corps of Engineers Waterways Experiment Station. Vicksburg, Mississippi.

16
4. Bossenbroek, Jonathan. 2005. Personal Communication. Department of
Biological Sciences, Notre Dame University. South Bend, Indiana.
5. Brodie, Greg. 2005. Personal Communication. Tennessee Valley Authority. Chattanooga, Tennessee.
6. Claudi, Renata 1995. Zebra Mussel Mitigation; Overview. In, Proceedings of the
Fifth International Zebra Mussel and Other Aquatic Nuisance Organisms Conference, Toronto, Canada, February 1995. pgs 47-55.
7. Darland, Tim. 2005. Personal Communication. US Army Corps of Engineers,
Bonneville Dam, Oregon.
8. Drake, John and Jonathan Bossenbroek. 2004. The Potential Distribution of Zebra Mussels in the United States. BioScience Vol. 54: 931-941.
9. Kahabka, John. 2004. Personal Communication. New York Power Authority.
White Plains, New York
10. Kerley, B., Brodie G., and B. Helton. 2000. Hydro Plant Interim Zebra Mussel Control Strategy. Public Power Institute Study Closure Report 97026, Tennessee Valley Authority. Knoxville, Tennessee.
11. Kovalak, W, Longton G. and R. Smithee. 1993. Dispersal Mechanisms of the
Zebra Mussel (Dreissena polymorpha), in Zebra Mussels: Biology, Impacts, and Control. Nalepa, T.F., and Schloesser, D.W., eds., Lewis Publishers, Boca Raton, FL, pgs 359-380.
12. Kraft, C. 1995. Zebra Mussel Update #24. University of Wisconsin-Madison,
Wisconsin Sea Grant Institute.
13. Magee, J. A., Wright, D. A., and E. M. Setzler-Hamilton. 1997. The Use of Penaten to Control Zebra Mussel Attachment. Zebra Mussels and Aquatic Nuisance Species. F. M. D’Itri, ed., Ann Arbor Press, Chelsea, MI, pgs 541-548.
14. McGraw-Hill Companies' (UER) Utility Environment Report. 1991. Utilities
Scramble For Solutions as Zebra Mussel Infestations Grow. November 15, 1991. http://www.seagrant.sunysb.edu/MediaArticles/UtilityEnv-ONeillNov91.htm
15. Neumann, Dietrich, Borcherding, Jost and Brigette Jantz. 1993. Growth and Seasonal Reproduction of Dreissena polymorpha in the Rhine River and Adjacent waters. in Zebra Mussels: Biology, Impacts, and Control. Nalepa, T.F., and Schloesser, D.W., eds., Lewis Publishers, Boca Raton, FL, pgs 95 - 109.
17
16. O'Neill, Charles R. Jr. 1993: Coastal Resources Fact Sheet, July 1993. New York Sea Grant, SUNY College at Brockport, New York.
17. Swor, Tom C. 2005. Personal Communication. U.S. Army Corps of Engineers, Nashville District. Nashville, Tennessee.
18. U.S. Nuclear Regulatory Commission. 1999. Power Reactor Status Report for June 12, 1999. Washington, D.C. 20555.
VIII. CONTACT INFORMATION Stephen H. Phillips Program Manager Aquatic Nuisance Species Project Pacific States Marine Fisheries Commission 205 SE Spokane Street, Suite 100 Portland, Oregon 97202 503-595-3100 [email protected] http://www.psmfc.org
Tim Darland US Army Corps of Engineers Bonneville Lock and Dam, PO Box 150 Cascade Locks, OR 97014 (541) 374-4551 [email protected] Dr. Mark Sytsma Center for Lakes and Reservoirs Portland State University Portland, Oregon (503)725-3833 [email protected] http://clr.pdx.edu/-05 IX. Acknowledgements The Bonneville Power Administration provided the funding for this project. Bess Wong, Jim Athearn, and Susan Anderson assisted in the editing of this document. Steve Culbertson of the USACE, Bonneville Dam was invaluable for the technical information he provided on hydropower operations. Our thanks to the staff at Ontario Power Generation, Tennessee Valley Authority, New York Power Authority, and the Nashville District, US Army Corps of Engineers. Thanks to Renata Claudi and Chuck O’Neill who also provided helpful advice.
18
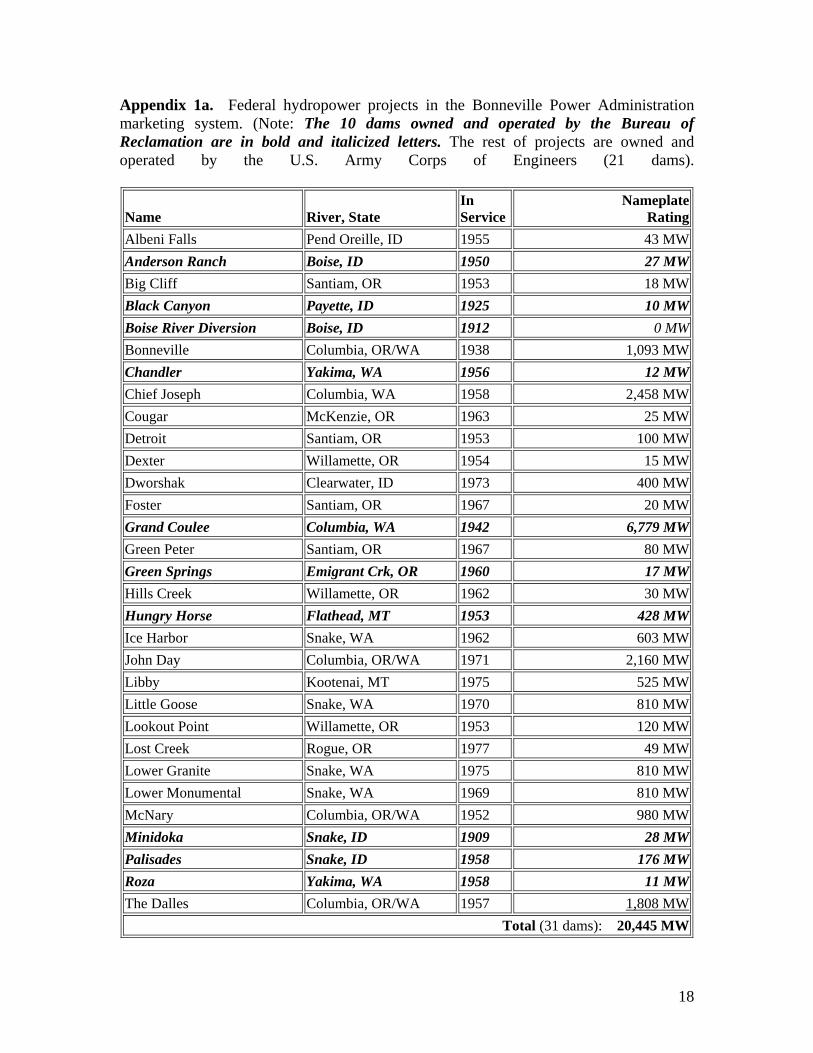
Appendix 1a. Federal hydropower projects in the Bonneville Power Administration marketing system. (Note: The 10 dams owned and operated by the Bureau of Reclamation are in bold and italicized letters. The rest of projects are owned and operated by the U.S. Army Corps of Engineers (21 dams).
Name River, State In Service
NameplateRating
Albeni Falls Pend Oreille, ID 1955 43 MWAnderson Ranch Boise, ID 1950 27 MWBig Cliff Santiam, OR 1953 18 MWBlack Canyon Payette, ID 1925 10 MWBoise River Diversion Boise, ID 1912 0 MWBonneville Columbia, OR/WA 1938 1,093 MWChandler Yakima, WA 1956 12 MWChief Joseph Columbia, WA 1958 2,458 MWCougar McKenzie, OR 1963 25 MWDetroit Santiam, OR 1953 100 MWDexter Willamette, OR 1954 15 MWDworshak Clearwater, ID 1973 400 MWFoster Santiam, OR 1967 20 MWGrand Coulee Columbia, WA 1942 6,779 MWGreen Peter Santiam, OR 1967 80 MWGreen Springs Emigrant Crk, OR 1960 17 MWHills Creek Willamette, OR 1962 30 MWHungry Horse Flathead, MT 1953 428 MWIce Harbor Snake, WA 1962 603 MWJohn Day Columbia, OR/WA 1971 2,160 MWLibby Kootenai, MT 1975 525 MWLittle Goose Snake, WA 1970 810 MWLookout Point Willamette, OR 1953 120 MWLost Creek Rogue, OR 1977 49 MWLower Granite Snake, WA 1975 810 MWLower Monumental Snake, WA 1969 810 MWMcNary Columbia, OR/WA 1952 980 MWMinidoka Snake, ID 1909 28 MWPalisades Snake, ID 1958 176 MWRoza Yakima, WA 1958 11 MWThe Dalles Columbia, OR/WA 1957 1,808 MW
Total (31 dams): 20,445 MW
19
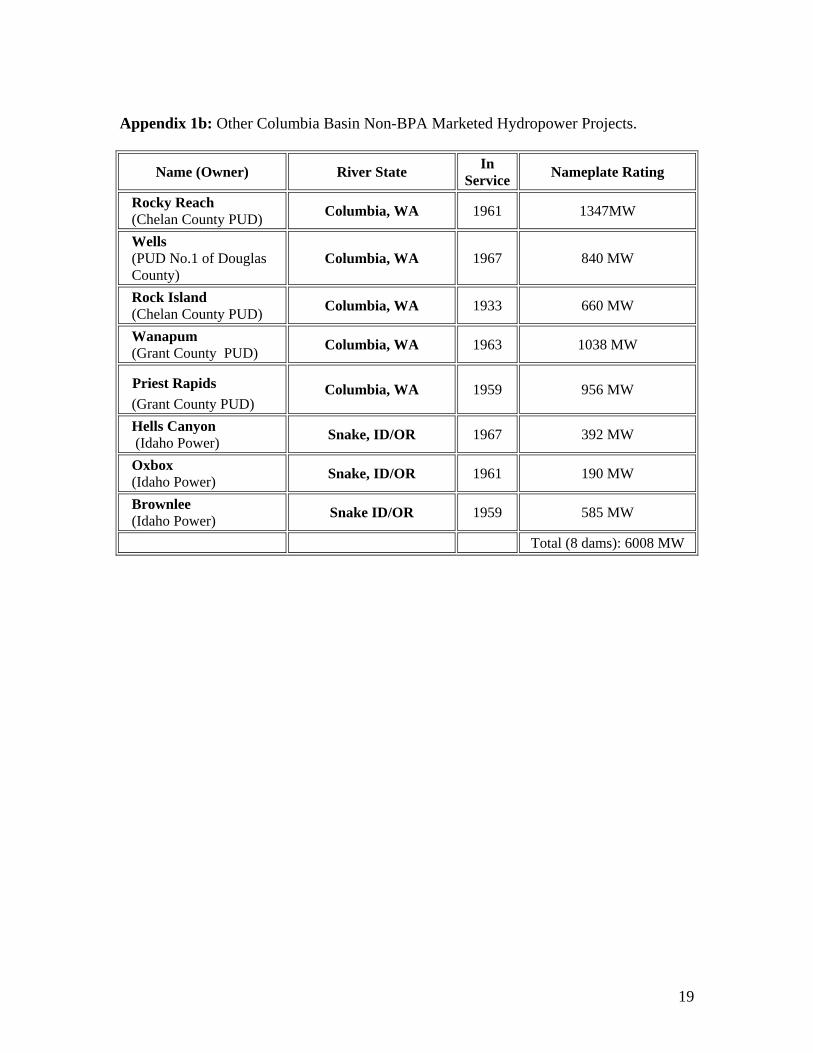
Appendix 1b: Other Columbia Basin Non-BPA Marketed Hydropower Projects.
Name (Owner) River State In Service Nameplate Rating
Rocky Reach (Chelan County PUD) Columbia, WA 1961 1347MW
Wells (PUD No.1 of Douglas County)
Columbia, WA 1967 840 MW
Rock Island (Chelan County PUD) Columbia, WA 1933 660 MW
Wanapum (Grant County PUD) Columbia, WA 1963 1038 MW
Priest Rapids (Grant County PUD)
Columbia, WA 1959 956 MW
Hells Canyon (Idaho Power) Snake, ID/OR 1967 392 MW
Oxbox (Idaho Power) Snake, ID/OR 1961 190 MW
Brownlee (Idaho Power) Snake ID/OR 1959 585 MW
Total (8 dams): 6008 MW
20
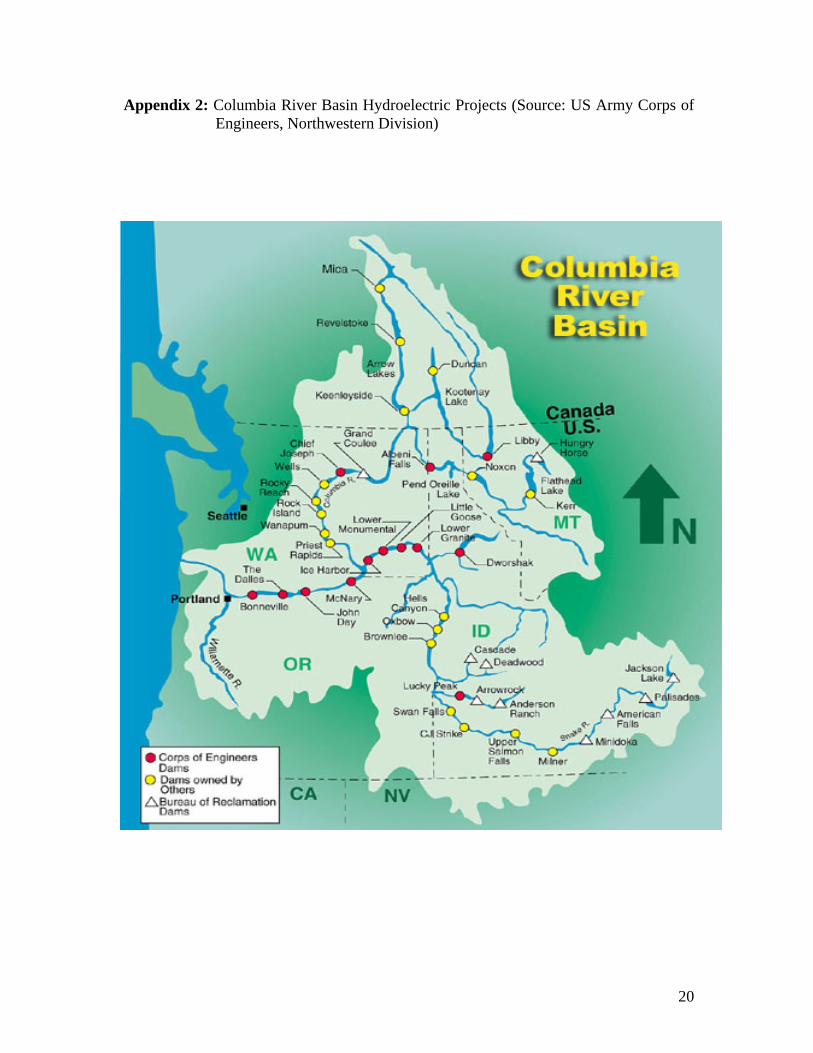
Appendix 2: Columbia River Basin Hydroelectric Projects (Source: US Army Corps of Engineers, Northwestern Division)
21
Appendix 3: Talent Decision Summary (Mark Sytsma, Portland State University)
Aquatic herbicides can be a cost effective method of aquatic plant control in lakes. Prior to 2001, aquatic herbicide applicators were required to follow EPA-approved product labels which are regulated and enforced under authority from the Federal Insecticide, Fungicide, and Rodenticide Act (FIFRA) – no application permit was required in Oregon. In 2001, however, the U.S. 9th circuit Court of Appeals decided in the Talent Case (No. 99-35373) that a National Pollutant Discharge Elimination System (NPDES) permit is required for aquatic herbicide applications.
How the Talent decision will be implemented in Oregon is not yet clear. On February 1, 2005, EPA published an interpretation of the Clean Water Act (CWA) requirements for permitting of aquatic pesticide applications in the Federal Register. The interpretation is open for public comment until April 4, 2005, following which EPA proposes to revise the NPDES permit program to incorporate the substance of the interpretation. According to EPA’s interpretation, a permit is not required for application of registered pesticides to waters of the United States. This guidance conflicts with several federal appellate court rulings, which could bring forth further litigation against the EPA if it continues to maintain that pesticide applicators are exempt from Clean Water Act requirements.
EPA’s guidance has not protected vector control districts from citizen lawsuits under the CWA. The vector control district in Gem County, Idaho, was sued under the CWA for application of pesticides to waters of the United States, even after EPA decided in August 2003, that Gem County did not need a NPDES permit to conduct its mosquito abatement activities. Further litigation is pending, which may clarify the situation in the 9th circuit.
NPDES permits typically include limits on the quantity and concentration of pollutants allowed in a discharge as well as sampling and monitoring, recordkeeping, and reporting requirements. There are two types of NPDES permits: an “individual” permit issued for a site-specific activity, and a “general” permit issued for a category of activities with similar discharges. In Oregon, the application fee for an individual permit is approximately $10,000 with an annual fee of about $2,500 to maintain the permit. NPDES permits are issued for a period of five years.
The alternative to an individual permit is a general permit, which could be structured in a variety of ways provided that the standard conditions developed in the permit are adequate to protect the environment. A general permit could be developed to allow for a broader use of a particular herbicide on more than one noxious aquatic weed species, or the permit could focus on a specific weed and allow a variety of herbicides to be used. A general permit could be issued to anyone that can meet the terms and conditions of the permit. In Oregon, general permits must be issued through a formal rulemaking process, which may take six to nine months. Permit development costs for DEQ are in the range of $50,000 to $100,000, but the permit application fee is set in rule at approximately $700 with an annual fee of $350. As a result, a general permit is considered only when there is the potential for multiple permittees and thus a reduction in overall administrative costs.
22
The State of Oregon has not yet developed any general permits for aquatic herbicides. There are individual permits that have been issued for aquatic herbicide treatment of irrigation canals; however, these have recently been revoked. DEQ revoked the permits to comply with an order from the U.S. District Court for Oregon (Northwest Environmental Advocates v. US EPA, D.Or.No. CV-01-510HA). The court determined that EPA failed to approve DEQ’s “alternate mixing zone standard” and ordered DEQ to revoke all permits that were based on this standard. The irrigation permits used this standard to allow for larger areas of toxicity. While it is not likely that DEQ will issue any NPDES permits for aquatic pesticides in the immediate future, it is reasonable to assume that NPDES permitting issues within the state will eventually be resolved.
Oregon DEQ’s current policy is that it will not take enforcement action against aquatic pesticides applications made without an NPDES permit, provided the applications are consistent with EPA guidance (in compliance with FIFRA). Since the Talent decision, Oregon DEQ has issued MAOs (Mutual Agreement and Orders) in lieu of NPDES permits as a regulatory mechanism. Although an MAO does NOT provide any measure of protection against citizen lawsuits, it does demonstrate due diligence on the part of the pesticide applicator which would likely help the applicator if a lawsuit were filed.
The application process and costs for an MAO are the same as those for an individual NPDES permit and can take the same amount of time (~ 6 months). The current priority of DEQ regarding permits is to reduce the backlog of expired permits, so an MAO could conceivably take longer than 6 months to obtain. Oswego Lake Corporation retained legal counsel at significant cost to assist in the application process for their MAO. They have obtained an MAO and currently use aquatic herbicides for control of aquatic macrophytes in Oswego Lake. The Corporation has also applied for an NPDES permit, but permit development is on hold until EPA approves the alternate mixing zone standard.
There are very few chemical herbicides registered for aquatic weed control. Of those chemicals that are registered for aquatic use, label restrictions prohibit their application in many situations. Nearly all weed management activities have potential impacts on native fishes; however, herbicide applications are the focus of most concern. Applied correctly, herbicides should not have acute impacts on fish; however, sublethal, chronic effects are less well understood. Given the likelihood of a lawsuit to resolve permitting requirements and concern about sublethal effects on salmonids, herbicide applications are not recommended at this time.