postural changes in humans: effects of gravity on … gisolf final.pdf · the siphon principle were...
TRANSCRIPT

POSTURAL CHANGES IN HUMANS:
EFFECTS OF GRAVITY ON THE CIRCULATION

POSTURAL CHANGES IN HUMANS: EFFECTS OF GRAVITY ON THE CIRCULATION
ACADEMISCH PROEFSCHRIFT
ter verkrijging van de graad van doctor
aan de Universiteit van Amsterdam
op gezag van de Rector Magnificus
prof.mr. P.F. van der Heijden
ten overstaan van een door het college voor promoties ingestelde
commissie, in het openbaar te verdedigen in de Aula der Universiteit
op vrijdag 25 februari 2005, te 12.00 uur
door
Janneke Gisolf
geboren te Haarlem
Promotiecommissie: Promotor: Prof. dr. J.H. Ravesloot Co-promotor: Dr. J.M. Karemaker
Dr. J.J. van Lieshout Overige leden: Dr. V.A. Convertino
Prof. dr. M.M. Levi Prof. dr. ir. J.A.E. Spaan Prof. dr. J. Stam Prof. dr. N. Westerhof
Faculteit Geneeskunde
This thesis has been prepared in the Cardiovascular Research Institute Amsterdam, Research Group on Physiology and Pathophysiology of the Circulation, at the department of Physiology. The project was financed by Space Research Organization Netherlands (SRON), project nr. MG-052. ISBN nummer 90-9019057-0 ©2004 Janneke Gisolf; [email protected] Cover design by Géza Berecki Printed in 2005 by FEBODRUK, Enschede, the Netherlands.

Contents
1. Effects of gravity on the circulation 7 a. Introduction b. The siphon controversy
Submitted c. Outline of this thesis 2. Cerebral venous outflow pathway is posture dependent 13
J Physiol 2004 Oct 1;560(Pt 1):317-27 3. Model of end-tidal CO2 during posture change 29
J Physiol 2004 Jan 15;554(Pt 2):579-90 4. Effects of nitroglycerine in routine tilt testing 47
J Am Coll Cardiol 2004 Aug 4;44(3):588-93
5. Orthostatic blood pressure control before and after space flight 57 J Appl Physiol (Revised version accepted for publication)
6. References 69
Appendix I A fast tilt table for sinusoidal tilts Aviat Space Environ Med 2004Dec;75:1086-1091 83 Appendix II Time-domain cross-correlation baroreflex sensitivity 95
J Hypertens 2004 Jul;22(7):1371-80
Summary and concluding remarks 109 Nederlandse samenvatting 115 Dankwoord 119


—Chapter 1— 7
Chapter 1. Effects of gravity on the circulation Introduction In man on Earth, circulating blood is subjected to gravity. On standing up, blood is redistributed to regions below the heart, and venous return to the heart is reduced; unchecked this can lead to loss of conciousness and ultimately, death. When we talk about the pressure within blood vessels, venous or arterial, we are dealing with three different concepts (and the interaction of these concepts must be taken into account): the mean systemic filling pressure, which is related to the volume in the vessel and the wall properties; the dynamic pressure, related to the velocity of the blood flow and the resistance; and the hydrostatic pressure, which is related to gravity. The importance of the latter was remarked on by Hill and Barnard as early as 1897 when they stated: “The expression ‘mean pressure’ cannot be justly used in any discussions on haemodynamics, for a uniform hydrostatic mean pressure in the vascular system cannot be obtained” 63. Gravity affects the fluid distribution in man. On standing up, blood volume is shifted towards the splanchnic, pelvic and leg vasculature. It is due to gravity that postural changes result in fluid shifts: theoretically, in Space (an environment with minimal gravity, also termed microgravity) postural changes do not result in any fluid shift other than that resulting from muscle contraction. In microgravity blood volume is shifted towards the thorax and head, giving an appearance of ‘puffy faces and chicken legs’. Earth-bound man, however, needs autonomic nervous control of the cardiovascular system to remain conscious in the standing posture. Sympathetic-induced vasoconstriction is needed to maintain arterial pressure while venoconstriction limits venous pooling of blood and thereby prevents further reductions in venous return of blood to the heart. Leg muscle activity also plays a role in venous return; it can be referred to as ‘the muscle pump’.
Maintaining arterial pressure in standing man is of vital importance for the perfusion of the brain: the brain needs a considerable part of total cardiac output (±750 ml/min out of a total cardiac output of ±5 l/min, with a wide range dependent on body size and constitution). Considering the circulatory demands of the human brain, fast and efficient response to gravity-induced fluid shifts is crucial. Cerebral blood flow is reduced by low blood CO2 content (hypocapnia). Hypocapnia occurs spontaneously on standing up; this phenomenon contributes to the challenge of standing.
When the muscle pump is inadequate and the autonomic nervous system does not regulate arterial pressure and venous return sufficiently to fulfil the demands of the brain, this can lead to in vasovagal syncope. Although a vasovagal response can be triggered by stimuli other than orthostatis (blood-phobia, for example, can lead to syncope), a tilt table protocol will induce vasovagal syncope most rapidly in those prone to it. Clinical use of a tilt table is to confirm the diagnosis in those with a typical history of vasovagal reactions, and to teach patients counter-manoeuvres such as leg-crossing and muscle tensing. Prolonged ‘passive’ standing can lead to a vasovagal response; sublingual nitroglycerine, which enhances venous pooling of blood, can be administered to shorten the tilt duration.
—Chapter 1— 8
By way of introduction to the effects of gravity on standing man, the next paragraph discusses the possibility for a siphon in the blood flow to and from the brain. A siphon mechanism implies counterbalancing of the hydrostatic gradient in the ascending and descending limbs of vertically oriented loops; the additional energy required to overcome gravity is therefore eliminated. Whether the blood flow to and from the brain is a siphon or not, is of importance when studying the consequences of standing for cerebral blood flow. Being difficult to prove either way and challenging to hypothesize about, siphon question has led to considerable controvery. b. The siphon controversy: an integration of concepts
(Submitted) Whether gravity challenges blood supply to the brain in standing man is a much-disputed topic in physiology. Burton (1972) stated that ‘it is no harder, in the circulation, for the blood to flow uphill than downhill’ and ‘differences in level of different parts of the vascular bed do not in any way affect the driving forces for flow and so do not directly affect the circulation’ 27. The prerequisite for the existence of a vascular siphon is a continuous column of blood in both the arterial and venous limbs of the loop; for the brain a siphon could exist from the thoracic aorta, via the filled cerebral veins where they leave the skull, to the right atrium. The siphon concept implies that no work is done on blood to increase its gravitational potential energy because the pressure gradients are equal and opposite in direction in the ascending and the descending limbs of the loop (Figure 1.1, left). Studies addressing the possibility of a siphon include hydrostatic models using rigid and flexible tubing in a laboratory set-up; animal studies, especially measurements in giraffes, as a model of considerable heart-to-head difference in height, and snakes; and human studies. We will discuss 1. the siphon concept and the supporting evidence; 2. the ‘vascular waterfall’ and evidence that there is no siphon functioning in blood flow to and from the brain; and 3. based on recent advances, an integration of these seemingly controversial concepts and address the role of the brain itself as interruption of the siphon. The latter part of the discussion is limited to studies in humans. Support for the siphon concept Using a model of both rigid and collapsible tubes, Hicks and Badeer (1989) reported that the siphon mechanism is still operating within vertically oriented models, even when the descending limb is flexible and partly collapsed 60. This implies that partially collapsed descending veins do not interrupt the siphon as long as there is a continuous column of fluid. They emphasize the importance of the interaction of the viscous and the hydrostatic components in the interpretation of pressure measurements in a vessel. They attribute the pressure gradient of 13 to 4 mmHg down the jugular veins of a standing giraffe 55, where approximately -93 to –27 mmHg would be expected based solely on the prevailing hydrostatic gradient, as related to the sum of gravitational and viscous pressures. In a more recent study the authors further support the concept that the heart does not have to overcome the weight of the blood pumped to the head, only the viscous resistance of the blood vessels 61. They state that the mechanical advantage of a closed system in relation to gravitational effects is similar to the operation of the loop of a siphon, but to avoid confusion of the physics of open vs. closed systems the term ‘siphon’ should be avoided: ‘in “open” systems gravity hinders uphill flow and causes downhill flow, in which the

—Chapter 1— 9
liquid acts as a falling body. In contrast, in “closed” systems, like the circulation, gravity does not hinder uphill flow nor does it cause downhill flow, because gravity acts equally on the ascending and descending limbs of the circuit’ 61. Bearing in mind the difference between open vs. closed systems, for historical reasons we will continue to use the term ‘siphon’ here. Vascular waterfall: absence of a siphon Early opposition to the siphon principle came in 1897 from Hill and Bernard who, referring to the siphon concept for blood flow uphill to the brain as well as downhill to the abdomen, warned that ‘this doctrine is entirely fallacious, since the principle of the siphon is not applicable to the vascular system in which the arteries on the one hand and the veins on the other are of so very different distensibility and elasticity’ 63. More recent arguments against the siphon principle were summarized by Seymour and Johansen (1987): ‘because of collapsible veins, gravitational pressure gradients are not matched in arterial and venous sides of circulatory loops above the heart as would be necessary for a siphon to operate’ 109. They illustrate this as a model of fluid flow in a gravitational field, where given sufficient pressure in the ascending arm, the flow characteristics in a flexible descending arm are similar to that of a waterfall (no descending tubing at all, just a cascade of fluid). There is no hydrostatic gradient and since the ‘fall’ of fluid does not assist the ascending arm, there is no siphon. The giraffe’s high arterial pressure, which is sufficient to raise the blood ~2 meters from heart to head with sufficient remaining pressure to perfuse the brain, supports this concept 55. Cardiovascular adaptations in snakes to diverse habitats can also be better understood if there is no siphon functioning in these reptiles. A tree-climbing snake’s heart is close to its head, ensuring blood flow to the brain even during vertical climbing. In the terrestrial snake, the heart is located closer to the midpoint, while in the sea snake the heart is at mid-point with the external water pressure preventing distension of the vessels in the lower body 86. Furthermore, snake resting blood pressure also appears related to its behaviour and habitat: aquatic species have a much lower pressure compared to non-climbing terrestrial species; arboreal species have the highest blood pressure. In short, the heart works against gravity and flow of blood to the brain is not facilitated by a siphon 108. The brain as siphon interruption. Integration of concepts In healthy standing man, the pressure in the superior vena cava is decreased compared to supine to –11cm H20 (~ -8.2 mmHg) on average 5. In the same standing subjects, internal jugular pressure was found to be higher; an average of 3.6 cm H20 (~ 2.7 mmHg) just above the thoracic inlet. The venous gradient across the thoracic inlet is interpreted as due to collapse of the internal jugular veins resulting from the transmural pressure of the vein in the neck (the superior vena cava is prevented from collapse by the negative intra-pleural pressure). Collapse of internal jugular veins in upright man has more recently been verified with ultrasonic imaging 32; 52; 62; 122. The atmospheric or slightly positive pressure measured in internal jugular veins in standing humans 5; 36; 62 seems not to be due to free falling of fluid down the descending limb, but rather the result of vessel collapse. Badeer and Hicks (1992) proposed that the waterfall analogy is not justified because contrary to an ‘open system’, downhill flow in the circulatory system is not caused by gravitational potential energy but requires a pump to drive 6. Furthermore flow in a closed system is subject to gravitational pressure and viscous flow resistance.
In the siphon controversy the role of the brain itself has been curiously overlooked. Modeling of flow through the brain is complicated by contributions of
—Chapter 1— 10
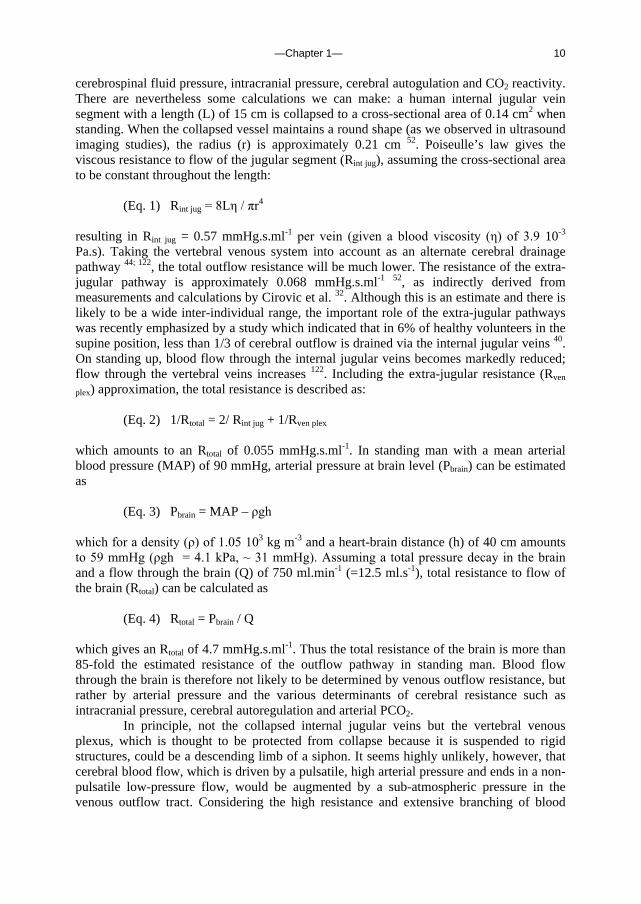
cerebrospinal fluid pressure, intracranial pressure, cerebral autogulation and CO2 reactivity. There are nevertheless some calculations we can make: a human internal jugular vein segment with a length (L) of 15 cm is collapsed to a cross-sectional area of 0.14 cm2 when standing. When the collapsed vessel maintains a round shape (as we observed in ultrasound imaging studies), the radius (r) is approximately 0.21 cm 52. Poiseulle’s law gives the viscous resistance to flow of the jugular segment (Rint jug), assuming the cross-sectional area to be constant throughout the length:
(Eq. 1) Rint jug = 8Lη / πr4
resulting in Rint jug = 0.57 mmHg.s.ml-1 per vein (given a blood viscosity (η) of 3.9 10-3
Pa.s). Taking the vertebral venous system into account as an alternate cerebral drainage pathway 44; 122, the total outflow resistance will be much lower. The resistance of the extra-jugular pathway is approximately 0.068 mmHg.s.ml-1 52, as indirectly derived from measurements and calculations by Cirovic et al. 32. Although this is an estimate and there is likely to be a wide inter-individual range, the important role of the extra-jugular pathways was recently emphasized by a study which indicated that in 6% of healthy volunteers in the supine position, less than 1/3 of cerebral outflow is drained via the internal jugular veins 40. On standing up, blood flow through the internal jugular veins becomes markedly reduced; flow through the vertebral veins increases 122. Including the extra-jugular resistance (Rven
plex) approximation, the total resistance is described as:
(Eq. 2) 1/Rtotal = 2/ Rint jug + 1/Rven plex
which amounts to an Rtotal of 0.055 mmHg.s.ml-1. In standing man with a mean arterial blood pressure (MAP) of 90 mmHg, arterial pressure at brain level (Pbrain) can be estimated as
(Eq. 3) Pbrain = MAP – ρgh
which for a density (ρ) of 1.05 103 kg m-3 and a heart-brain distance (h) of 40 cm amounts to 59 mmHg (ρgh = 4.1 kPa, ~ 31 mmHg). Assuming a total pressure decay in the brain and a flow through the brain (Q) of 750 ml.min-1 (=12.5 ml.s-1), total resistance to flow of the brain (Rtotal) can be calculated as
(Eq. 4) Rtotal = Pbrain / Q
which gives an Rtotal of 4.7 mmHg.s.ml-1. Thus the total resistance of the brain is more than 85-fold the estimated resistance of the outflow pathway in standing man. Blood flow through the brain is therefore not likely to be determined by venous outflow resistance, but rather by arterial pressure and the various determinants of cerebral resistance such as intracranial pressure, cerebral autoregulation and arterial PCO2.
In principle, not the collapsed internal jugular veins but the vertebral venous plexus, which is thought to be protected from collapse because it is suspended to rigid structures, could be a descending limb of a siphon. It seems highly unlikely, however, that cerebral blood flow, which is driven by a pulsatile, high arterial pressure and ends in a non-pulsatile low-pressure flow, would be augmented by a sub-atmospheric pressure in the venous outflow tract. Considering the high resistance and extensive branching of blood
—Chapter 1— 11
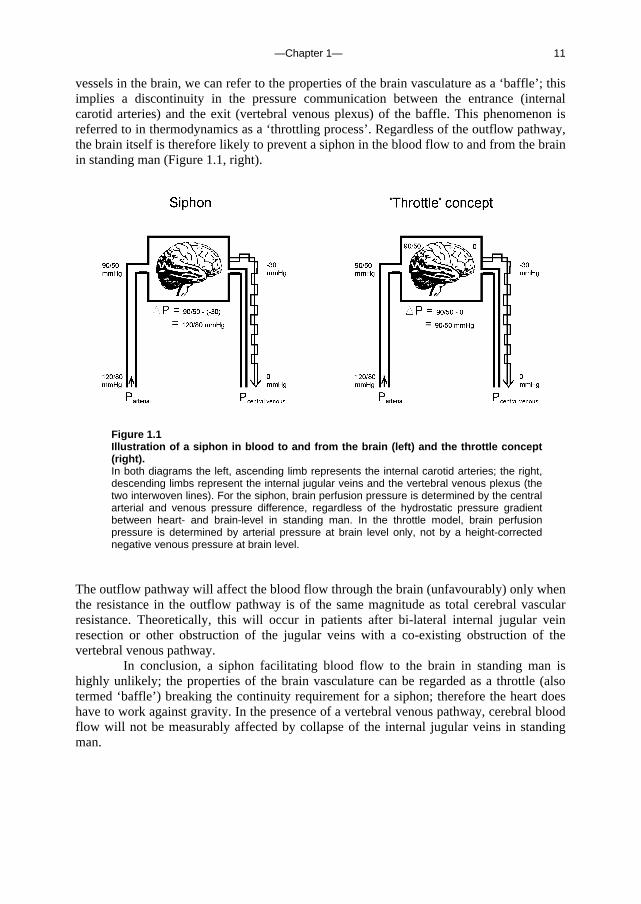
vessels in the brain, we can refer to the properties of the brain vasculature as a ‘baffle’; this implies a discontinuity in the pressure communication between the entrance (internal carotid arteries) and the exit (vertebral venous plexus) of the baffle. This phenomenon is referred to in thermodynamics as a ‘throttling process’. Regardless of the outflow pathway, the brain itself is therefore likely to prevent a siphon in the blood flow to and from the brain in standing man (Figure 1.1, right).
Figure 1.1 Illustration of a siphon in blood to and from the brain (left) and the throttle concept (right). In both diagrams the left, ascending limb represents the internal carotid arteries; the right, descending limbs represent the internal jugular veins and the vertebral venous plexus (the two interwoven lines). For the siphon, brain perfusion pressure is determined by the central arterial and venous pressure difference, regardless of the hydrostatic pressure gradient between heart- and brain-level in standing man. In the throttle model, brain perfusion pressure is determined by arterial pressure at brain level only, not by a height-corrected negative venous pressure at brain level.
The outflow pathway will affect the blood flow through the brain (unfavourably) only when the resistance in the outflow pathway is of the same magnitude as total cerebral vascular resistance. Theoretically, this will occur in patients after bi-lateral internal jugular vein resection or other obstruction of the jugular veins with a co-existing obstruction of the vertebral venous pathway.
In conclusion, a siphon facilitating blood flow to the brain in standing man is highly unlikely; the properties of the brain vasculature can be regarded as a throttle (also termed ‘baffle’) breaking the continuity requirement for a siphon; therefore the heart does have to work against gravity. In the presence of a vertebral venous pathway, cerebral blood flow will not be measurably affected by collapse of the internal jugular veins in standing man.

—Chapter 1— 12
c. Outline of this thesis The following chapters analyse and discuss the effects of gravity on specific aspects of the circulation. The consequences of standing up for the drainage pathway of blood leaving the brain are analysed in Chapter 2, which includes a mathematical model of the cerebral venous outflow tracts. Chapter 3 deals with the physiological changes leading to a reduction in end-tidal CO2 on standing up. CO2 levels are determined not only by breathing pattern (respiration) but also by a gravity-induced shift in ventilation-perfusion ratio, and cardiac output (circulation). A mathematical model of breath-to-breath CO2 is presented. Patients who are prone to syncope and who undergo a tilt table examination are analysed in Chapter 4, which discusses the effects of nitroglycerine as administered to facilitate a vasovagal response in these patients. Chapter 5 deals with blood pressure control in post-flight cosmonauts. Cosmonauts returning from spaceflight are known to suffer from varying degrees of orthostatic intolerance. A detailed description of a computer controlled, motorized tilt table method, developed by Akkerman 2 and others, is given in Appendix I; Appendix II deals with Wesseling’s method for computing baroreflex sensitivity using a cross-correlation method.
—Chapter 2— 13
Chapter 2. Human cerebral venous outflow pathway depends on posture and central venous pressure
J. Gisolf, J.J. van Lieshout, K. van Heusden, F. Pott, W.J. Stok and J.M. Karemaker, J Physiol 2004 Oct 1;560(Pt 1):317-27
“I could see the seat and the white figure, for I was now close enough to distinguish it even through the spells of shadow. There was undoubtedly something, long and black, bending over the half-reclining white figure. I called in fright, ‘Lucy! Lucy!’ and something raised a head, and from where I was I could see a white face and red, gleaming eyes. Lucy did not answer, and I ran on to the entrance of the churchyard. As I entered, the church was between me and the seat, and for a minute or so I lost sight of her. When I came in view again the cloud had passed, and the moonlight struck so brilliantly that I could see Lucy half reclining with her head lying over the back of the seat. She was quite alone, and there was not a sign of any living thing about…
…Lucy was sleeping gently, but her breathing was stronger; I could
see the counterpane move as her breast heaved. By the bedside sat Van Helsing, looking at her intently. The velvet band again covered the red mark. I asked the Professor in a whisper: -
‘What do you make of that mark on her throat?’ ‘What do you make of it?’ ‘I have not seen it yet,’ I answered, and then and there
proceeded to loose the band. Just over the external jugular vein there were two punctures, not large, but not wholesome-looking. There was no sign of disease, but the edges where white and worn-looking, as if by some trituration. It at once occurred to me that this wound, or whatever it was, might be the means of that manifest loss of blood; but I abandoned the idea as soon as formed, for such a thing could not be. The whole bed would have been drenched to a scarlet with the blood which the girl must have lost to leave such a pallor as she had before the transfusion.”
From Bram Stoker’s ‘Dracula’
In Bram Stoker’s ‘Dracula’, Lucy suffers a huge blood loss, bringing her to the brink of death. This happened as she was sitting (half reclining) on a park bench, where she was bitten in the neck (external jugular vein puncture) by Count Dracula. We now know that sitting subjects have external jugular venous pressures of –4.7 (SD 3.3) mmHg, as reported by Dawson et al. 36. Given the collapsible nature of the veins in the neck, an excessive amount of blood drawn via puncture to the external jugular veins, when the subject is in the sitting position, is highly improbable.

—Chapter 2— 14
In the following study we developed a mathematic model to investigate cerebral outflow distribution to the internal jugular veins and an alternate pathway, the vertebral venous plexus, in supine and standing humans. Introduction In supine humans the internal jugular veins are the primary venous drain for the brain. In sitting and standing humans, however, the positioning of these veins above heart level causes them to collapse 32; 66. A high outflow resistance would endanger cerebral blood flow in the upright posture if there were no alternative cerebral venous outflow pathway. There is an alternate pathway via the vertebral venous plexus 9; 30; 137 which extends from the intracranial venous sinuses to the superior caval system. Radiographic studies have shown the vertebral venous plexus to be the major exit pathway of cerebral blood in the erect position in Rhesus monkeys 44. It was recently demonstrated that also in tree dwelling snakes, head-up tilt induces partial jugular collapse and shunting of cephalic blood flow into the vertebral plexus 135. In sitting humans blood flow in the collapsed internal jugular veins is reported to be greatly reduced 32, which together with evidence of an important role of the vertebral venous plexus in humans 8, suggests the pathway of the cerebral venous return to be posture dependent. Collapsed internal jugular veins can be completely reopened by positive pressure breathing in dogs 121 and in humans 32.
We developed a mathematical model of the cerebral venous outflow tract to study the distribution of cerebral blood flow to the internal jugular veins and to an alternative pathway (vertebral venous plexus). Input to the model are beat-to-beat measurements of central venous pressure (CVP) and cerebral blood flow velocity (CBFV), with and without an increased CVP by a Valsalva manoeuvre, in the supine and standing position. For the internal jugular veins we implemented a non-linear pressure-volume relationship based on measurements by Braakman et al. 18. Knowing the jugular veins to be collapsed in the upright position and re-opened during positive pressure breathing, we hypothesized the cerebral outflow pathway to be dependent on posture and CVP. We expected the internal jugular veins to be the major drain for the brain in the supine position; in the standing position these veins are likely to be collapsed and to allow little blood flow. Furthermore we expected a 40 mmHg increase in CVP in the standing position to be sufficient to reopen the jugular veins and facilitate jugular blood flow for as long as CVP was raised. Ultrasound imaging of the internal jugular veins verified model outcome.
Methods Model To assess the cerebral venous outflow distribution over the internal jugular veins and the alternate pathway (the cervical vertebral venous plexus) we developed a beat-to-beat model programmed in Simulink of MATLAB (Release 5.2, The MathWorks, Natick, MA, USA). A detailed description of the mathematical model and a parameter sensitivity analysis of the jugular vein model properties are given in the Appendix. Input data to the model are beat-to-beat measurements of CVP and CBFV variations. Lassen 81 reported an average whole brain blood flow of 50 ml/100 g min-1, and considering a brain weight of 1500 g 95, we assumed a supine cerebral blood flow of 750 ml/min for all subjects. CBFV (blood velocity
—Chapter 2— 15
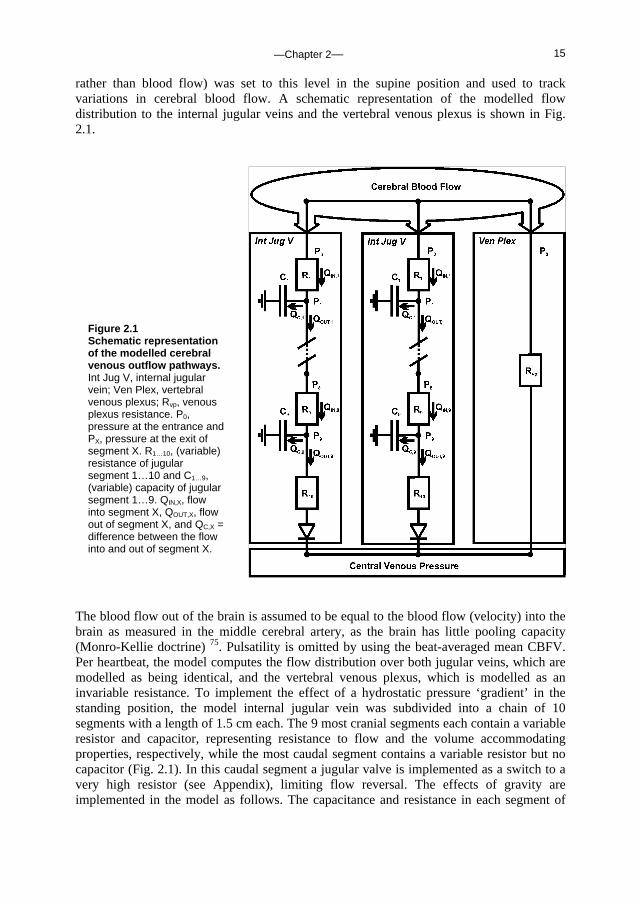
rather than blood flow) was set to this level in the supine position and used to track variations in cerebral blood flow. A schematic representation of the modelled flow distribution to the internal jugular veins and the vertebral venous plexus is shown in Fig. 2.1.
The blood flow out of the brain is assumed to be equal to the blood flow (velocity) into the brain as measured in the middle cerebral artery, as the brain has little pooling capacity (Monro-Kellie doctrine) 75. Pulsatility is omitted by using the beat-averaged mean CBFV. Per heartbeat, the model computes the flow distribution over both jugular veins, which are modelled as being identical, and the vertebral venous plexus, which is modelled as an invariable resistance. To implement the effect of a hydrostatic pressure ‘gradient’ in the standing position, the model internal jugular vein was subdivided into a chain of 10 segments with a length of 1.5 cm each. The 9 most cranial segments each contain a variable resistor and capacitor, representing resistance to flow and the volume accommodating properties, respectively, while the most caudal segment contains a variable resistor but no capacitor (Fig. 2.1). In this caudal segment a jugular valve is implemented as a switch to a very high resistor (see Appendix), limiting flow reversal. The effects of gravity are implemented in the model as follows. The capacitance and resistance in each segment of
Figure 2.1 Schematic representation of the modelled cerebral venous outflow pathways. Int Jug V, internal jugular vein; Ven Plex, vertebral venous plexus; Rvp, venous plexus resistance. P0, pressure at the entrance and PX, pressure at the exit of segment X. R1…10, (variable) resistance of jugular segment 1…10 and C1…9, (variable) capacity of jugular segment 1…9. QIN,X, flow into segment X, QOUT,X, flow out of segment X, and QC,X = difference between the flow into and out of segment X.
—Chapter 2— 16
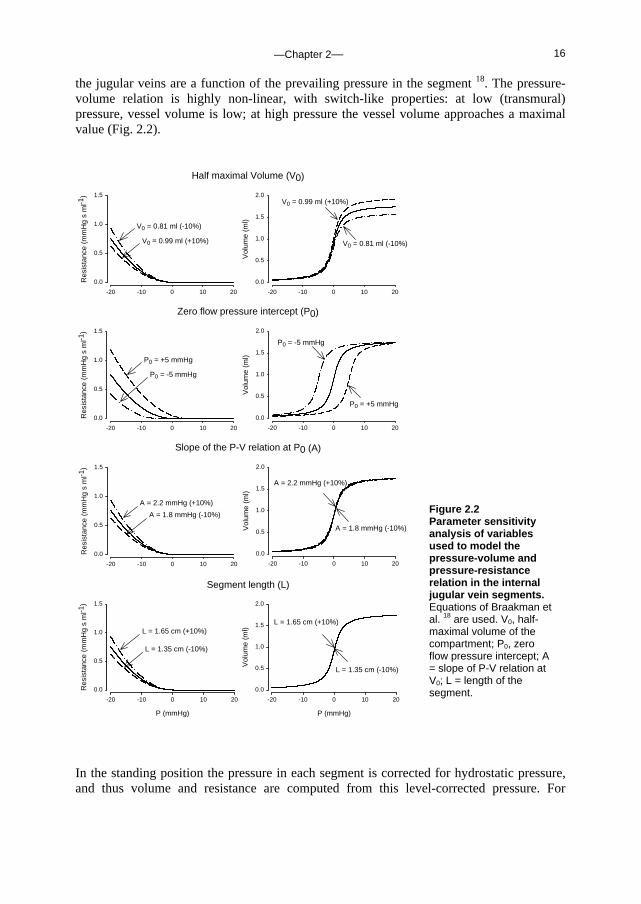
the jugular veins are a function of the prevailing pressure in the segment 18. The pressure-volume relation is highly non-linear, with switch-like properties: at low (transmural) pressure, vessel volume is low; at high pressure the vessel volume approaches a maximal value (Fig. 2.2).
Segment length (L)
P (mmHg)
-20 -10 0 10 20
Res
ista
nce
(mm
Hg
s m
l-1)
0.0
0.5
1.0
1.5
Slope of the P-V relation at P0 (A)
-20 -10 0 10 20
Res
ista
nce
(mm
Hg
s m
l-1)
0.0
0.5
1.0
1.5
Zero flow pressure intercept (P0)
-20 -10 0 10 20
Res
ista
nce
(mm
Hg
s m
l-1)
0.0
0.5
1.0
1.5
-20 -10 0 10 20
Vol
ume
(ml)
0.0
0.5
1.0
1.5
2.0
P (mmHg)
-20 -10 0 10 20
Vol
ume
(ml)
0.0
0.5
1.0
1.5
2.0
P (mmHg)
-20 -10 0 10 20
Vol
ume
(ml)
0.0
0.5
1.0
1.5
2.0
P0 = -5 mmHg
P0 = +5 mmHg
P0 = -5 mmHg
P0 = +5 mmHg
A = 1.8 mmHg (-10%)
A = 2.2 mmHg (+10%)
L = 1.35 cm (-10%)
L = 1.65 cm (+10%)
A = 2.2 mmHg (+10%)
L = 1.65 cm (+10%)
L = 1.35 cm (-10%)
Half maximal Volume (V0)
-20 -10 0 10 20
Res
ista
nce
(mm
Hg
s m
l-1)
0.0
0.5
1.0
1.5
V0 = 0.99 ml (+10%)
V0 = 0.81 ml (-10%)
A = 1.8 mmHg (-10%)
-20 -10 0 10 20
Vol
ume
(ml)
0.0
0.5
1.0
1.5
2.0
V0 = 0.81 ml (-10%)
V0 = 0.99 ml (+10%)
In the standing position the pressure in each segment is corrected for hydrostatic pressure, and thus volume and resistance are computed from this level-corrected pressure. For
Figure 2.2 Parameter sensitivity analysis of variables used to model the pressure-volume and pressure-resistance relation in the internal jugular vein segments. Equations of Braakman et al. 18 are used. V0, half-maximal volume of the compartment; P0, zero flow pressure intercept; A = slope of P-V relation at V0; L = length of the segment.
—Chapter 2— 17
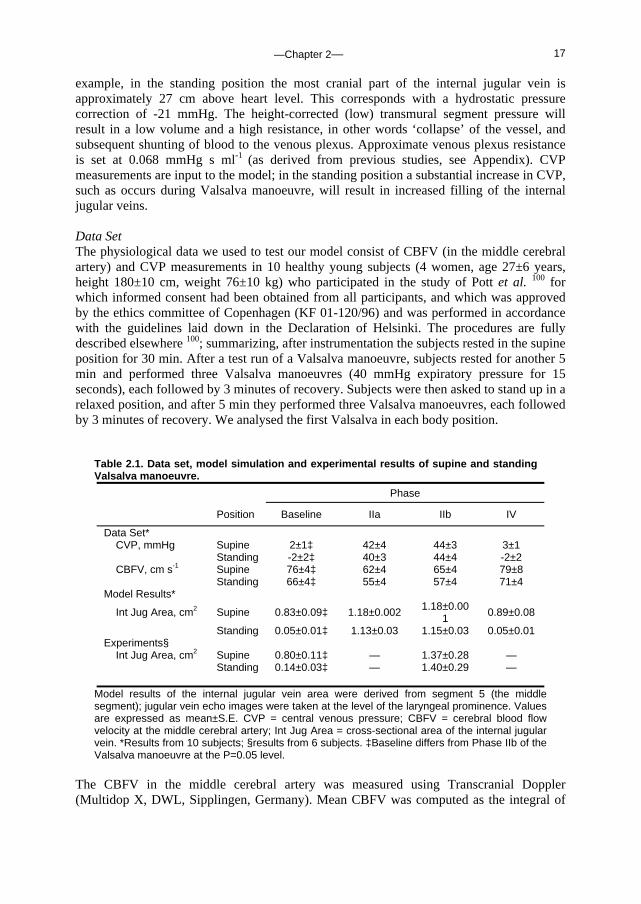
example, in the standing position the most cranial part of the internal jugular vein is approximately 27 cm above heart level. This corresponds with a hydrostatic pressure correction of -21 mmHg. The height-corrected (low) transmural segment pressure will result in a low volume and a high resistance, in other words ‘collapse’ of the vessel, and subsequent shunting of blood to the venous plexus. Approximate venous plexus resistance is set at 0.068 mmHg s ml-1 (as derived from previous studies, see Appendix). CVP measurements are input to the model; in the standing position a substantial increase in CVP, such as occurs during Valsalva manoeuvre, will result in increased filling of the internal jugular veins. Data Set The physiological data we used to test our model consist of CBFV (in the middle cerebral artery) and CVP measurements in 10 healthy young subjects (4 women, age 27±6 years, height 180±10 cm, weight 76±10 kg) who participated in the study of Pott et al. 100 for which informed consent had been obtained from all participants, and which was approved by the ethics committee of Copenhagen (KF 01-120/96) and was performed in accordance with the guidelines laid down in the Declaration of Helsinki. The procedures are fully described elsewhere 100; summarizing, after instrumentation the subjects rested in the supine position for 30 min. After a test run of a Valsalva manoeuvre, subjects rested for another 5 min and performed three Valsalva manoeuvres (40 mmHg expiratory pressure for 15 seconds), each followed by 3 minutes of recovery. Subjects were then asked to stand up in a relaxed position, and after 5 min they performed three Valsalva manoeuvres, each followed by 3 minutes of recovery. We analysed the first Valsalva in each body position.
Table 2.1. Data set, model simulation and experimental results of supine and standing Valsalva manoeuvre.
Phase
Position Baseline IIa IIb IV
Data Set* CVP, mmHg Supine 2±1‡ 42±4 44±3 3±1 Standing -2±2‡ 40±3 44±4 -2±2 CBFV, cm s-1 Supine 76±4‡ 62±4 65±4 79±8
Standing 66±4‡ 55±4 57±4 71±4 Model Results*
Int Jug Area, cm2 Supine 0.83±0.09‡ 1.18±0.002 1.18±0.001 0.89±0.08
Standing 0.05±0.01‡ 1.13±0.03 1.15±0.03 0.05±0.01 Experiments§
Int Jug Area, cm2 Supine 0.80±0.11‡ — 1.37±0.28 — Standing 0.14±0.03‡ — 1.40±0.29 —
Model results of the internal jugular vein area were derived from segment 5 (the middle segment); jugular vein echo images were taken at the level of the laryngeal prominence. Values are expressed as mean±S.E. CVP = central venous pressure; CBFV = cerebral blood flow velocity at the middle cerebral artery; Int Jug Area = cross-sectional area of the internal jugular vein. *Results from 10 subjects; §results from 6 subjects. ‡Baseline differs from Phase IIb of the Valsalva manoeuvre at the P=0.05 level.
The CBFV in the middle cerebral artery was measured using Transcranial Doppler (Multidop X, DWL, Sipplingen, Germany). Mean CBFV was computed as the integral of
—Chapter 2— 18
the maximal frequency shifts over one beat divided by the corresponding beat interval. Finger arterial pressure was measured with a Finapres model 5 (Biomedical Instrumentation, TNO-BMI). For CVP measurement, a catheter (1.7 mm ID, 16 gauge) was placed in the superior caval vein through the basilic vein. CVP was recorded from a transducer (Bentley, Uden, the Netherlands) fastened to the subject in the midaxillary line at the level of the right atrium and connected to a monitor (8041, Simonsen & Weel, Copenhagen, Denmark). Measurements were computed after analog to digital conversion at a sampling rate of 100 Hz. Finger arterial pressure, CVP and CBFV were averaged beat-to-beat, and CBFV was further processed to approximate variations in total cerebral blood flow. Experiments To verify the model outcome of internal jugular vein cross-sectional area before and during the straining phase of the Valsalva manoeuvre in the supine and standing position, the following protocol was carried out in 6 healthy young subjects (3 women, age 31±2 years, height 177±3 cm, weight 70±4 kg). Signed informed consent was obtained from all participants. The study was approved by the ethics committee of the Academic Medical Center (MEC 00/243) and performed in accordance with the guidelines laid down in the Declaration of Helsinki. Valsalva manoeuvres were conducted as described for ‘Data Set’; this was practiced one day prior to the experiments. Subjects rested in the supine position for 5 min before they performed a Valsalva manoeuvre. They were then asked to stand up and remain standing for 5 min, and perform a Valsalva manoeuvre in the upright position. Upper arm blood pressure was measured at 2-3 minutes into the supine and upright periods (Omron M5-I, oscillometric blood pressure monitor). The cross-sectional area of the right internal jugular vein was imaged using ultrasound (Acuson Aspen 7.0). The ultrasound probe was placed on the neck approximately at the level of the laryngeal prominence, so that the probe was perpendicular to the vessel and the location was marked. The imaging depth was 4 cm, and the gain 65 dB. To avoid compressing the vein, care was taken to exert minimal pressure with the probe. The image of the venous lumen was frozen on the screen of the ultrasound unit and saved on optical disk. The cross-sectional lumen area of the internal jugular vein was determined off-line from the ultrasound image. Ultrasound measurements were conducted one minute prior to (baseline) and during the straining phase of the Valsalva manoeuvre (10 seconds from the start) in the supine and in the standing position. Where pulsations in the jugular vein were detected, the image at mid-point of the pulsation was stored. Statistical Analysis Data are presented as means±SE. Differences were tested by using paired t-test; unequal variance (heteroscedastic) t-test or sign test where appropriate. Pearson correlation coefficient was calculated for the correlation between the model estimates of the internal jugular vein cross-sectional areas and the ultrasound-determined areas. Group averages per event (baseline and Valsalva manoeuvre in the supine and standing position) were used. Significance was set at P≤0.05.

—Chapter 2— 19
Standing
CB
FV
(cm
s-1
)
0
50
100
150
CV
P (
mm
Hg)
-20
0
20
40
60
M-
Int J
ug F
low
(m
l s-1
)
0
5
10
15
M-
Ven
Ple
x F
low
(m
l s-1
)
0
5
10
15
Time (s)
5 15 25 35 45 55
M-
Int J
ug V
ol (
ml)
0
5
10
15
20
Supine
CB
FV
(cm
s-1
)
0
50
100
150
CV
P (
mm
Hg)
-20
0
20
40
60
M-
Int J
ug F
low
(m
l s-1
)
0
5
10
15
M-
Ven
Ple
x F
low
(m
l s-1
)
0
5
10
15
Time (s)
5 15 25 35 45 55
M-
Int J
ug V
ol (
ml)
0
5
10
15
20
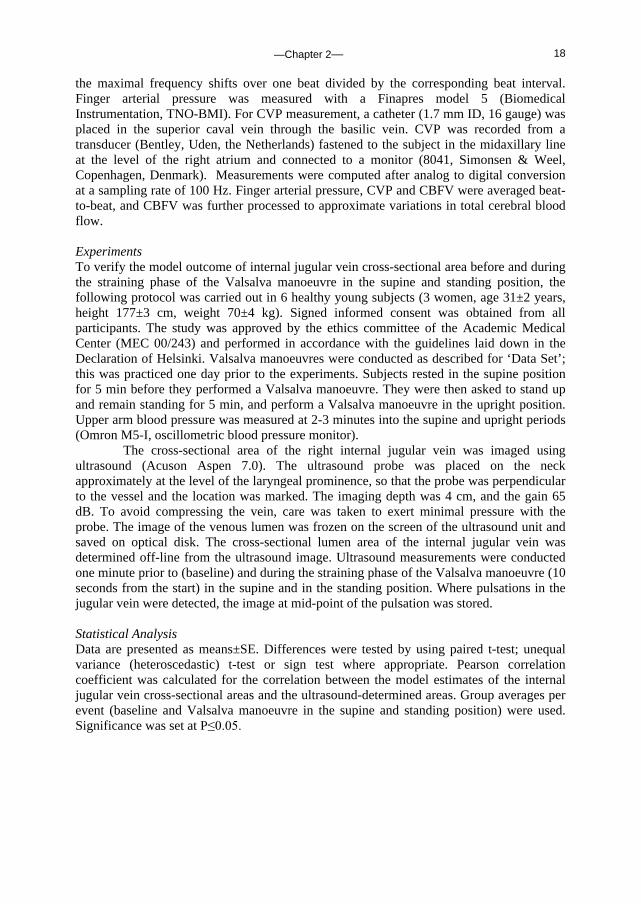
Results Data set used for model simulation The hemodynamic response to each Valsalva phase as defined from changes in blood pressure is described elsewhere 100; Table 2.1 gives the CVP and CBFV during baseline, Phase IIa, IIb and IV. By definition 110, in Phase IIa (straining phase) of the Valsalva manoeuvre mean arterial pressure, pulse pressure and stroke volume decrease. This is followed by partial recovery of mean arterial pressure and heart rate toward the end of the strain, in Phase IIb. Phase IV represents the arterial pressure overshoot after release of the strain. Cerebral venous outflow distribution over the internal jugular veins and the vertebral venous plexus was simulated using beat-to-beat variation in CVP and CBFV as input to the model (see Appendix for model description and settings). Figure 2.3 shows a representative example of CBFV and CVP measurements as well as simulated cerebral outflow
Figure 2.3 Cerebral venous outflow distribution during Valsalva manoeuvre in supine and standing position. Model simulation of cerebral outflow distribution and measurements of cerebral blood flow velocity (CBFV) and central venous pressure (CVP) in a subject who participated in the study of Pott et al. 100. M-Int Jug Flow, flow into the internal jugular veins; M-Ven Plex Flow, vertebral venous plexus flow; M-Int Jug Vol, volume of each internal jugular vein.
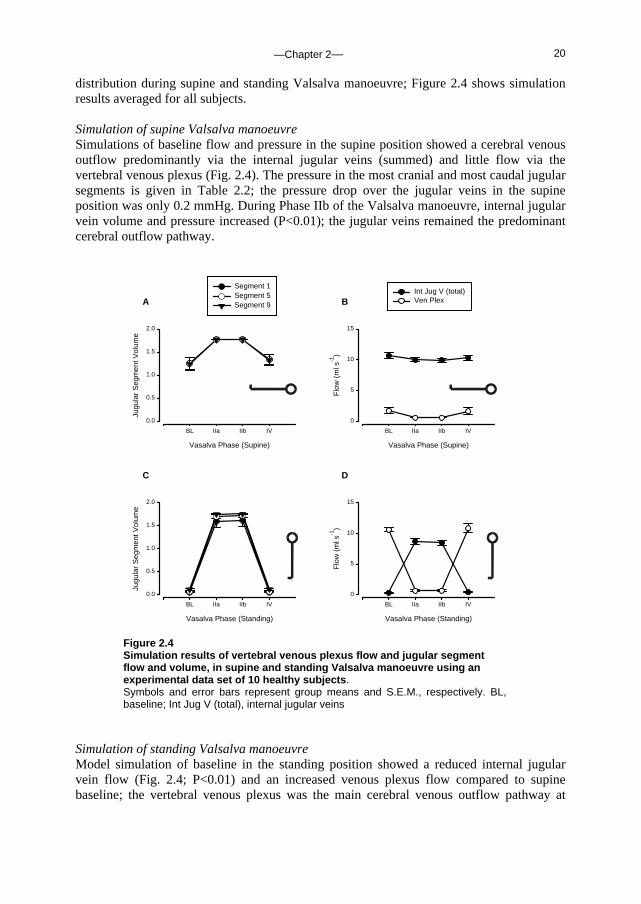
—Chapter 2— 20
distribution during supine and standing Valsalva manoeuvre; Figure 2.4 shows simulation results averaged for all subjects. Simulation of supine Valsalva manoeuvre Simulations of baseline flow and pressure in the supine position showed a cerebral venous outflow predominantly via the internal jugular veins (summed) and little flow via the vertebral venous plexus (Fig. 2.4). The pressure in the most cranial and most caudal jugular segments is given in Table 2.2; the pressure drop over the jugular veins in the supine position was only 0.2 mmHg. During Phase IIb of the Valsalva manoeuvre, internal jugular vein volume and pressure increased (P<0.01); the jugular veins remained the predominant cerebral outflow pathway.
A
Vasalva Phase (Supine)
BL IIa IIb IV
Jugu
lar
Seg
men
t Vol
ume
0.0
0.5
1.0
1.5
2.0
Segment 1Segment 5Segment 9
C
Vasalva Phase (Standing)
BL IIa IIb IV
Jugu
lar
Seg
men
t Vol
ume
0.0
0.5
1.0
1.5
2.0
B
Vasalva Phase (Supine)
BL IIa IIb IV
Flo
w (
ml s
-1)
0
5
10
15
Int Jug V (total)Ven Plex
D
Vasalva Phase (Standing)
BL IIa IIb IV
Flo
w (
ml s
-1)
0
5
10
15
Figure 2.4 Simulation results of vertebral venous plexus flow and jugular segment flow and volume, in supine and standing Valsalva manoeuvre using an experimental data set of 10 healthy subjects. Symbols and error bars represent group means and S.E.M., respectively. BL, baseline; Int Jug V (total), internal jugular veins
Simulation of standing Valsalva manoeuvre Model simulation of baseline in the standing position showed a reduced internal jugular vein flow (Fig. 2.4; P<0.01) and an increased venous plexus flow compared to supine baseline; the vertebral venous plexus was the main cerebral venous outflow pathway at
—Chapter 2— 21
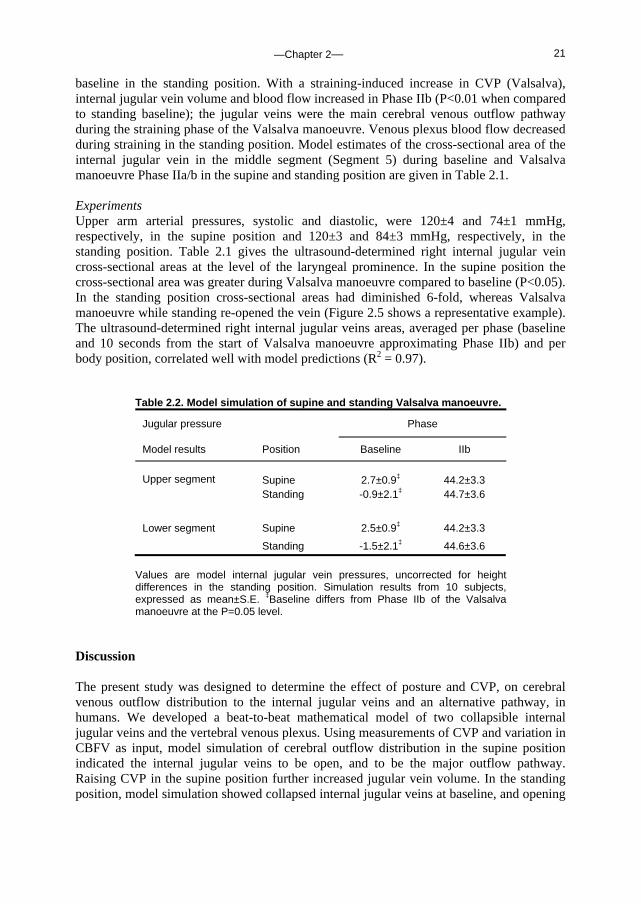
baseline in the standing position. With a straining-induced increase in CVP (Valsalva), internal jugular vein volume and blood flow increased in Phase IIb (P<0.01 when compared to standing baseline); the jugular veins were the main cerebral venous outflow pathway during the straining phase of the Valsalva manoeuvre. Venous plexus blood flow decreased during straining in the standing position. Model estimates of the cross-sectional area of the internal jugular vein in the middle segment (Segment 5) during baseline and Valsalva manoeuvre Phase IIa/b in the supine and standing position are given in Table 2.1. Experiments Upper arm arterial pressures, systolic and diastolic, were 120±4 and 74±1 mmHg, respectively, in the supine position and 120±3 and 84±3 mmHg, respectively, in the standing position. Table 2.1 gives the ultrasound-determined right internal jugular vein cross-sectional areas at the level of the laryngeal prominence. In the supine position the cross-sectional area was greater during Valsalva manoeuvre compared to baseline (P<0.05). In the standing position cross-sectional areas had diminished 6-fold, whereas Valsalva manoeuvre while standing re-opened the vein (Figure 2.5 shows a representative example). The ultrasound-determined right internal jugular veins areas, averaged per phase (baseline and 10 seconds from the start of Valsalva manoeuvre approximating Phase IIb) and per body position, correlated well with model predictions (R2 = 0.97).
Table 2.2. Model simulation of supine and standing Valsalva manoeuvre.
Jugular pressure Phase
Model results Position Baseline IIb
Upper segment Supine 2.7±0.9‡ 44.2±3.3 Standing -0.9±2.1‡ 44.7±3.6
Lower segment Supine 2.5±0.9‡ 44.2±3.3
Standing -1.5±2.1‡ 44.6±3.6
Values are model internal jugular vein pressures, uncorrected for height differences in the standing position. Simulation results from 10 subjects, expressed as mean±S.E. ‡Baseline differs from Phase IIb of the Valsalva manoeuvre at the P=0.05 level.
Discussion The present study was designed to determine the effect of posture and CVP, on cerebral venous outflow distribution to the internal jugular veins and an alternative pathway, in humans. We developed a beat-to-beat mathematical model of two collapsible internal jugular veins and the vertebral venous plexus. Using measurements of CVP and variation in CBFV as input, model simulation of cerebral outflow distribution in the supine position indicated the internal jugular veins to be open, and to be the major outflow pathway. Raising CVP in the supine position further increased jugular vein volume. In the standing position, model simulation showed collapsed internal jugular veins at baseline, and opening
—Chapter 2— 22
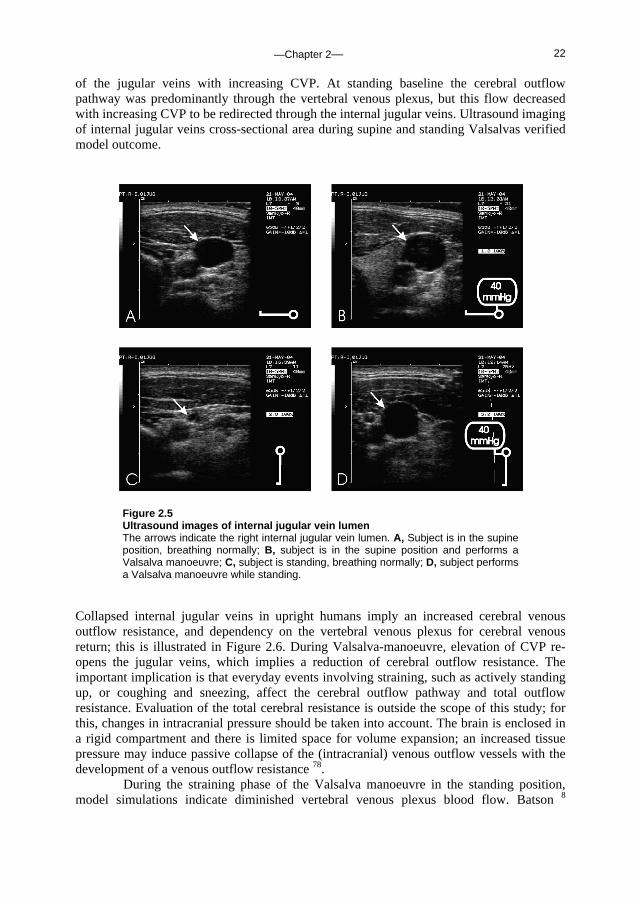
of the jugular veins with increasing CVP. At standing baseline the cerebral outflow pathway was predominantly through the vertebral venous plexus, but this flow decreased with increasing CVP to be redirected through the internal jugular veins. Ultrasound imaging of internal jugular veins cross-sectional area during supine and standing Valsalvas verified model outcome.
Figure 2.5 Ultrasound images of internal jugular vein lumen The arrows indicate the right internal jugular vein lumen. A, Subject is in the supine position, breathing normally; B, subject is in the supine position and performs a Valsalva manoeuvre; C, subject is standing, breathing normally; D, subject performs a Valsalva manoeuvre while standing.
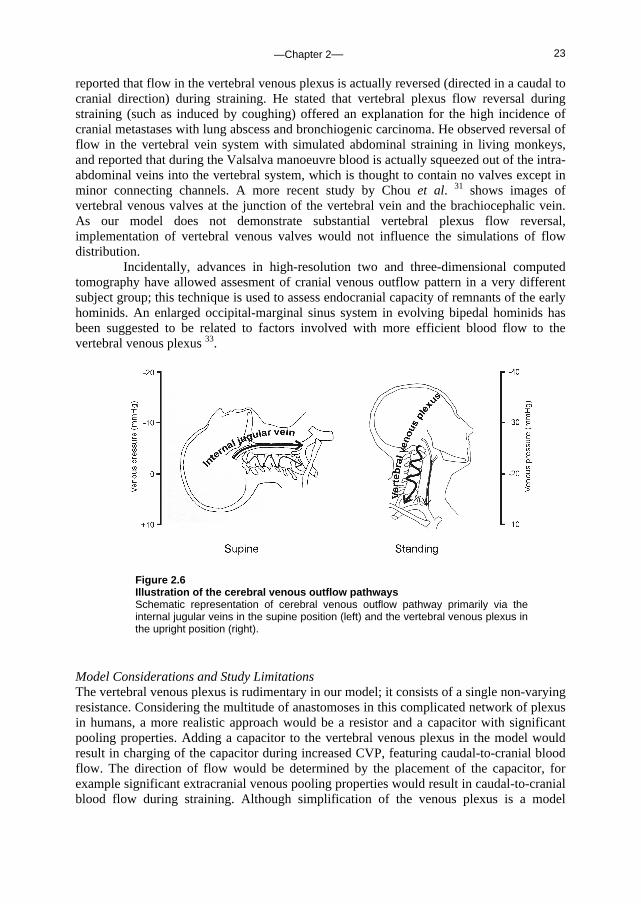
Collapsed internal jugular veins in upright humans imply an increased cerebral venous outflow resistance, and dependency on the vertebral venous plexus for cerebral venous return; this is illustrated in Figure 2.6. During Valsalva-manoeuvre, elevation of CVP re-opens the jugular veins, which implies a reduction of cerebral outflow resistance. The important implication is that everyday events involving straining, such as actively standing up, or coughing and sneezing, affect the cerebral outflow pathway and total outflow resistance. Evaluation of the total cerebral resistance is outside the scope of this study; for this, changes in intracranial pressure should be taken into account. The brain is enclosed in a rigid compartment and there is limited space for volume expansion; an increased tissue pressure may induce passive collapse of the (intracranial) venous outflow vessels with the development of a venous outflow resistance 78. During the straining phase of the Valsalva manoeuvre in the standing position, model simulations indicate diminished vertebral venous plexus blood flow. Batson 8
—Chapter 2— 23
reported that flow in the vertebral venous plexus is actually reversed (directed in a caudal to cranial direction) during straining. He stated that vertebral plexus flow reversal during straining (such as induced by coughing) offered an explanation for the high incidence of cranial metastases with lung abscess and bronchiogenic carcinoma. He observed reversal of flow in the vertebral vein system with simulated abdominal straining in living monkeys, and reported that during the Valsalva manoeuvre blood is actually squeezed out of the intra-abdominal veins into the vertebral system, which is thought to contain no valves except in minor connecting channels. A more recent study by Chou et al. 31 shows images of vertebral venous valves at the junction of the vertebral vein and the brachiocephalic vein. As our model does not demonstrate substantial vertebral plexus flow reversal, implementation of vertebral venous valves would not influence the simulations of flow distribution.
Incidentally, advances in high-resolution two and three-dimensional computed tomography have allowed assesment of cranial venous outflow pattern in a very different subject group; this technique is used to assess endocranial capacity of remnants of the early hominids. An enlarged occipital-marginal sinus system in evolving bipedal hominids has been suggested to be related to factors involved with more efficient blood flow to the vertebral venous plexus 33.
Figure 2.6 Illustration of the cerebral venous outflow pathways Schematic representation of cerebral venous outflow pathway primarily via the internal jugular veins in the supine position (left) and the vertebral venous plexus in the upright position (right).
Model Considerations and Study Limitations The vertebral venous plexus is rudimentary in our model; it consists of a single non-varying resistance. Considering the multitude of anastomoses in this complicated network of plexus in humans, a more realistic approach would be a resistor and a capacitor with significant pooling properties. Adding a capacitor to the vertebral venous plexus in the model would result in charging of the capacitor during increased CVP, featuring caudal-to-cranial blood flow. The direction of flow would be determined by the placement of the capacitor, for example significant extracranial venous pooling properties would result in caudal-to-cranial blood flow during straining. Although simplification of the venous plexus is a model

—Chapter 2— 24
limitation, the present study focuses on the effect of hydrostatics on internal jugular vein collapse and subsequent shunting of blood to the alternative pathway, and a rudimentary model seems sufficient to test our hypothesis. Further investigation into the vertebral venous plexus requires refinement of the model as well as venous plexus blood flow measurements. The internal jugular veins are modelled as being identical. Asymmetry of the jugular veins volume under baseline conditions would result in unequal distribution of flow; a greater venous outflow through the larger jugular vein. The ‘collapse pressure’ of the veins would not be affected however (see Appendix), and the overall distribution of jugular veins vs. alternative venous pathway would not be significantly altered. The non-linear properties of the internal jugular veins are supported by a recent study addressing the absence of a siphon to support cerebral blood flow in standing humans 36; collapse of jugular veins at tilt angles greater than 30-35º are reported. Valdueza et al. 122 reported a large internal jugular flow decrease already at 15º tilt (from the horizontal position). A 10º head-down position increases internal jugular vein cross-sectional area 107. For the individual model simulations, subject height was not taken into account. The rationale to take the distance from the heart to the internal jugular veins as equal for all subjects was the non-linear characteristic of the veins: for a height difference of some 30 cm between subjects, the heart-to-neck distance might differ only a few centimetres. At a CVP of around zero at heart level, in the standing position the hydrostatic pressure correction at neck level will be sufficient to ensure collapse of the veins, irrespective of subject height. Conclusions In conclusion, in humans cerebral outflow pathways include internal jugular veins and an alternative route, the vertebral venous plexus system. Results of mathematical modelling suggest that whereas internal jugular veins are the major drain for the brain in the supine position, in the standing position they are liable to collapse and cerebral venous blood is returned via the alternative pathway. During increased CVP in the standing position the internal jugular veins are re-opened and these veins are again the primary pathway for cerebral venous return. Ultrasound images of the internal jugular vein cross-sectional area verify model outcome. Acknowlegdements The authors thank J. Gort and W. Hanselaar for the ultrasound imaging. We appreciate J.O. Fortrat’s introduction to the hominid evolution through bipedalism.
—Chapter 2— 25
Appendix
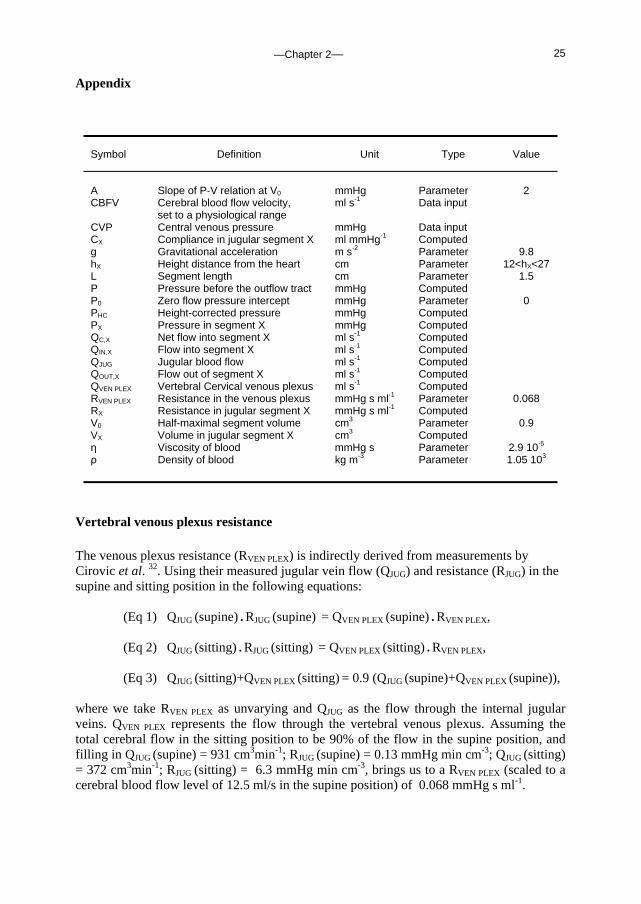
Vertebral venous plexus resistance The venous plexus resistance (RVEN PLEX) is indirectly derived from measurements by Cirovic et al. 32. Using their measured jugular vein flow (QJUG) and resistance (RJUG) in the supine and sitting position in the following equations:
(Eq 1) QJUG (supine) • RJUG (supine) = QVEN PLEX (supine) • RVEN PLEX, (Eq 2) QJUG (sitting) • RJUG (sitting) = QVEN PLEX (sitting) • RVEN PLEX, (Eq 3) QJUG (sitting)+QVEN PLEX (sitting) = 0.9 (QJUG (supine)+QVEN PLEX (supine)),
where we take RVEN PLEX as unvarying and QJUG as the flow through the internal jugular veins. QVEN PLEX represents the flow through the vertebral venous plexus. Assuming the total cerebral flow in the sitting position to be 90% of the flow in the supine position, and filling in QJUG (supine) = 931 cm3min-1; RJUG (supine) = 0.13 mmHg min cm-3; QJUG (sitting) = 372 cm3min-1; RJUG (sitting) = 6.3 mmHg min cm-3, brings us to a RVEN PLEX (scaled to a cerebral blood flow level of 12.5 ml/s in the supine position) of 0.068 mmHg s ml-1.
Symbol Definition Unit Type Value
A Slope of P-V relation at V0 mmHg Parameter 2 CBFV Cerebral blood flow velocity,
set to a physiological range ml s-1 Data input
CVP Central venous pressure mmHg Data input CX Compliance in jugular segment X ml mmHg-1 Computed g Gravitational acceleration m s-2 Parameter 9.8 hX Height distance from the heart cm Parameter 12<hX<27 L Segment length cm Parameter 1.5 P Pressure before the outflow tract mmHg Computed P0 Zero flow pressure intercept mmHg Parameter 0 PHC Height-corrected pressure mmHg Computed PX Pressure in segment X mmHg Computed QC,X Net flow into segment X ml s-1 Computed QIN,X Flow into segment X ml s-1 Computed QJUG Jugular blood flow ml s-1 Computed QOUT,X Flow out of segment X ml s-1 Computed QVEN PLEX Vertebral Cervical venous plexus ml s-1 Computed RVEN PLEX Resistance in the venous plexus mmHg s ml-1 Parameter 0.068 RX Resistance in jugular segment X mmHg s ml-1 Computed V0 Half-maximal segment volume cm3 Parameter 0.9 VX Volume in jugular segment X cm3 Computed η Viscosity of blood mmHg s Parameter 2.9 10-5 ρ Density of blood kg m-3 Parameter 1.05 103
—Chapter 2— 26
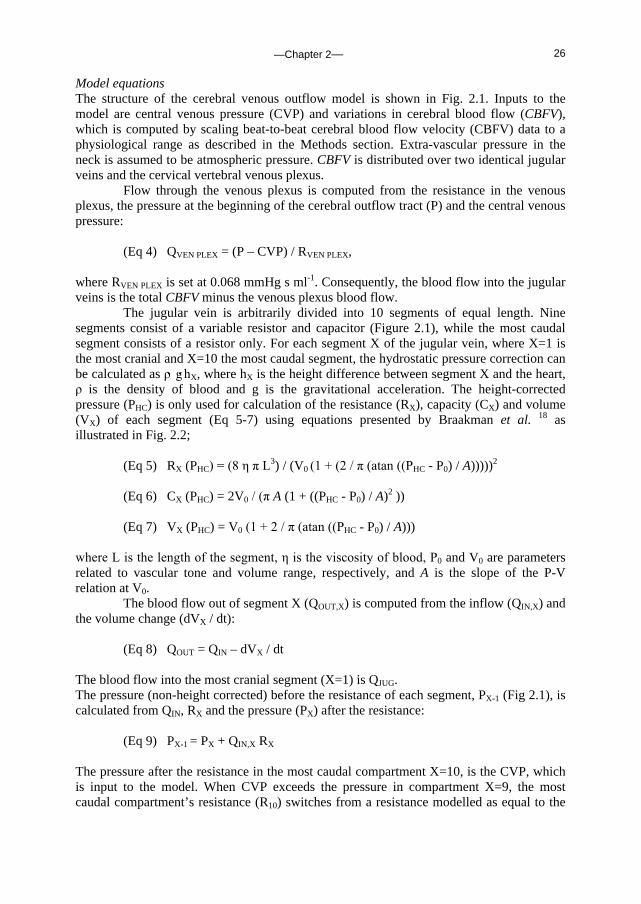
Model equations The structure of the cerebral venous outflow model is shown in Fig. 2.1. Inputs to the model are central venous pressure (CVP) and variations in cerebral blood flow (CBFV), which is computed by scaling beat-to-beat cerebral blood flow velocity (CBFV) data to a physiological range as described in the Methods section. Extra-vascular pressure in the neck is assumed to be atmospheric pressure. CBFV is distributed over two identical jugular veins and the cervical vertebral venous plexus. Flow through the venous plexus is computed from the resistance in the venous plexus, the pressure at the beginning of the cerebral outflow tract (P) and the central venous pressure:
(Eq 4) QVEN PLEX = (P – CVP) / RVEN PLEX, where RVEN PLEX is set at 0.068 mmHg s ml-1. Consequently, the blood flow into the jugular veins is the total CBFV minus the venous plexus blood flow.
The jugular vein is arbitrarily divided into 10 segments of equal length. Nine segments consist of a variable resistor and capacitor (Figure 2.1), while the most caudal segment consists of a resistor only. For each segment X of the jugular vein, where X=1 is the most cranial and X=10 the most caudal segment, the hydrostatic pressure correction can be calculated as ρ· g· hX, where hX is the height difference between segment X and the heart, ρ is the density of blood and g is the gravitational acceleration. The height-corrected pressure (PHC) is only used for calculation of the resistance (RX), capacity (CX) and volume (VX) of each segment (Eq 5-7) using equations presented by Braakman et al. 18 as illustrated in Fig. 2.2;
(Eq 5) RX (PHC) = (8 η π L3) / (V0 (1 + (2 / π (atan ((PHC - P0) / A)))))2
(Eq 6) CX (PHC) = 2V0 / (π A (1 + ((PHC - P0) / A)2 ))
(Eq 7) VX (PHC) = V0 (1 + 2 / π (atan ((PHC - P0) / A))) where L is the length of the segment, η is the viscosity of blood, P0 and V0 are parameters related to vascular tone and volume range, respectively, and A is the slope of the P-V relation at V0.
The blood flow out of segment X (QOUT,X) is computed from the inflow (QIN,X) and the volume change (dVX / dt):
(Eq 8) QOUT = QIN – dVX / dt The blood flow into the most cranial segment (X=1) is QJUG. The pressure (non-height corrected) before the resistance of each segment, PX-1 (Fig 2.1), is calculated from QIN, RX and the pressure (PX) after the resistance:
(Eq 9) PX-1 = PX + QIN,X RX
The pressure after the resistance in the most caudal compartment X=10, is the CVP, which is input to the model. When CVP exceeds the pressure in compartment X=9, the most caudal compartment’s resistance (R10) switches from a resistance modelled as equal to the
—Chapter 2— 27
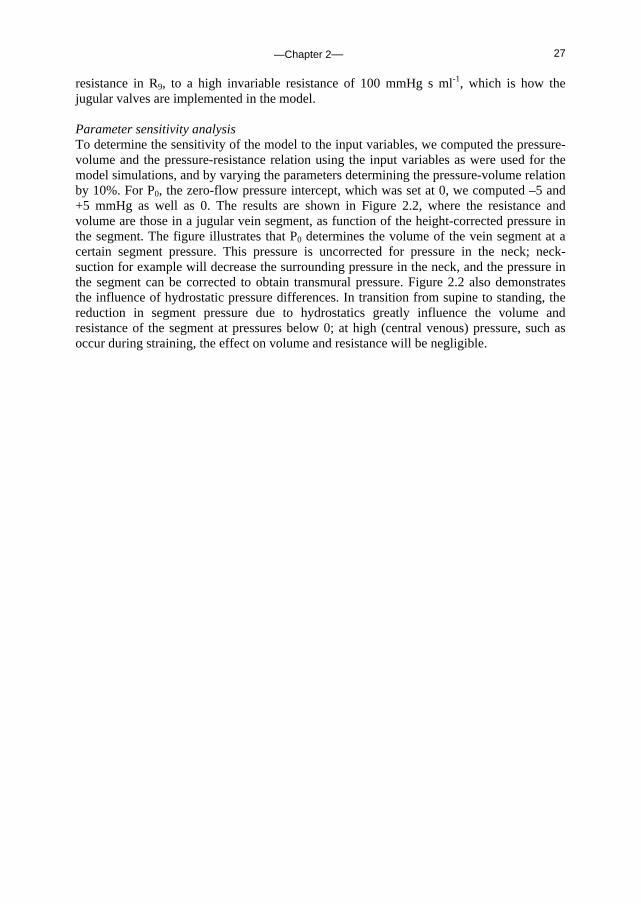
resistance in R9, to a high invariable resistance of 100 mmHg s ml-1, which is how the jugular valves are implemented in the model. Parameter sensitivity analysis To determine the sensitivity of the model to the input variables, we computed the pressure-volume and the pressure-resistance relation using the input variables as were used for the model simulations, and by varying the parameters determining the pressure-volume relation by 10%. For P0, the zero-flow pressure intercept, which was set at 0, we computed –5 and +5 mmHg as well as 0. The results are shown in Figure 2.2, where the resistance and volume are those in a jugular vein segment, as function of the height-corrected pressure in the segment. The figure illustrates that P0 determines the volume of the vein segment at a certain segment pressure. This pressure is uncorrected for pressure in the neck; neck-suction for example will decrease the surrounding pressure in the neck, and the pressure in the segment can be corrected to obtain transmural pressure. Figure 2.2 also demonstrates the influence of hydrostatic pressure differences. In transition from supine to standing, the reduction in segment pressure due to hydrostatics greatly influence the volume and resistance of the segment at pressures below 0; at high (central venous) pressure, such as occur during straining, the effect on volume and resistance will be negligible.

—Chapter 2— 28
—Chapter 3— 29
Chapter 3. Tidal volume, cardiac output and functional residual capacity determine end-tidal CO2 transient during standing up in humans
Janneke Gisolf, Ronald Wilders, Rogier V. Immink, Johannes J. van Lieshout, and John M. Karemaker, J Physiol 2004 Jan 15;554(Pt 2):579-90
“The fact that the alveolar CO2 tension is so dependent upon such factors as posture, indicates that alveolar CO2 is not a physiologic constant, as originally believed by Haldane. Rather, it is a variable: the resultant of all factors affecting the respiratory center. Consequently, we cannot speak of an individual’s alveolar CO2 value unless we specify definitely the conditions under which it was taken.”
R.J. Main, Am J Physiol 1937; 118,435-40
Reduction in end-tidal PCO2 in the standing position is not solely due to hyperventilation. The effects of gravity on the circulation contribute to a relative hypocapnia in standing man, via a reduction in cardiac output (less blood flow through the lungs implies less CO2 delivered to the lungs) and a regional ventilation-perfusion mismatch. Hypocapnia leads to vasoconstriction in the brain. In the following study we use a mathematical model to investigate the relative contribution of a number of respiratory and circulatory transients on end-tidal PCO2 during posture change. Introduction In man the carbon dioxide (CO2) content of the alveolar air is lower in the upright position than in the supine position 85. In 1937 Main et al. confirmed this observation and explained it as being due to over-ventilation with resulting alkaemia 89. However, Hitchcock and Ferguson 64 showed the drop in alveolar CO2 partial pressure (PCO2) upon assuming the erect posture to be independent of alterations in pulmonary ventilation. They attributed the lowered PCO2 to an increase in functional residual capacity (FRC) in the upright position, and an impairment of CO2 transport from the dependent parts of the body.
In man assuming the upright position, cardiac output (Q) decreases 116. Variation in end-tidal partial PCO2 (PETCO2) reflects variation in Q in the same direction, for example during acute hemodynamic perturbations in anaesthetized patients during constant ventilation 111. Airway CO2 levels have been proposed as a monitor of Q during cardiovascular resuscitation 16. We considered that the postural decrease in Q could well contribute to hypocapnia.

—Chapter 3— 30
Previous studies have focused on the effect of gravity and body position on the distribution of ventilation 23; 93; 134, perfusion 3; 127 and ventilation-perfusion (V/Q) ratio 94; 126; 128 in the lung. Gravity induces a perfusion gradient in the upright lung, with a decrease in lung perfusion in apical regions and an increase in perfusion in basal regions. In the standing subject, air expired from alveoli active in gas exchange is diluted by air from apical lung segments which are relatively underperfused, resulting in a decrease in PETCO2. In the upright position, FRC and tidal volume (VT) increase, due to lowering of the diaphragm and alveolar expansion due to the lungs’ own weight. However, the relative contribution of each of these physiological phenomena to the postural decrease in PETCO2 is unknown.
With the rising interest in cerebral autoregulation during posture change 14; 29; 43; 56;
67; 96, which is affected by PCO2, we sought to determine the factors leading to transient PETCO2 variation during standing up from the supine position. We hypothesized that the reduction in Q, and the V/Q mismatch determine the decrease in PETCO2 upon standing up. To test this hypothesis, we developed a nine-compartment computer model of the lung to simulate breath-to-breath PETCO2 variations during active standing up. The model includes an FRC, VT and anatomic dead space (VD). Lung perfusion is modelled using stroke volume (SV) and heart rate (HR). Regional V/Q ratios are modelled for each lung compartment, accounting for effects of gravity. Input data to the model are Fick-calibrated breath-to-breath SV of the heart, pulmonary O2 uptake (VO2), respiratory interval (TRESP) and VT. Methods Model To assess the underlying physiology determining PETCO2 transients during posture change, we developed a breath-to-breath model, programmed in MATLAB® (Release 5.2, The MathWorks, Natick, MA). A detailed description of the mathematical model is given in the Appendix. The features of each breath (e.g. arterial and venous CO2 concentrations) depend on the features of the previous breaths. Input data to the model are (Fick-calibrated) SV determined breath-to-breath, VO2 and VT. The model is ‘paced’ by the respiratory interval.
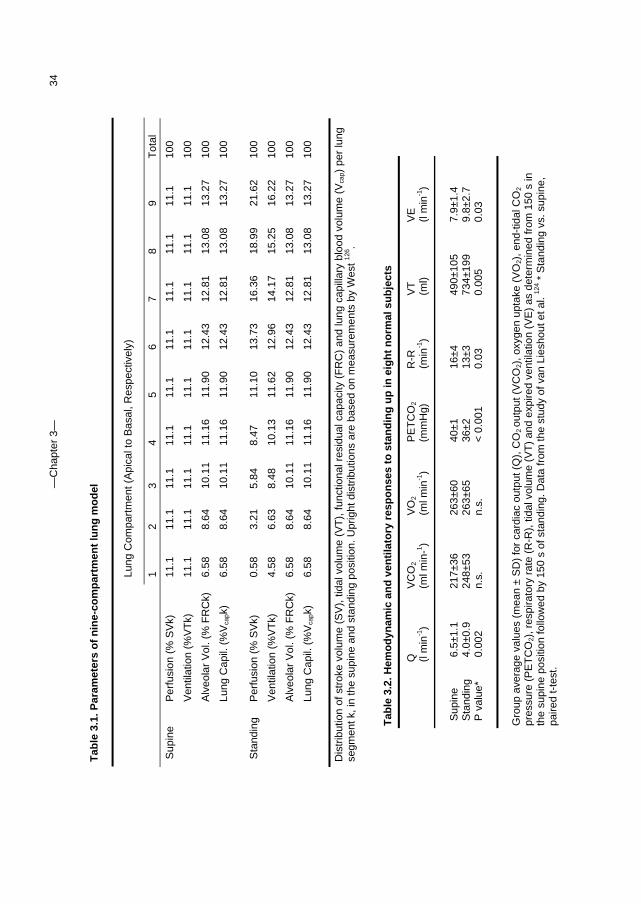
Ventilation The model includes nine lung compartments (Fig. 3.1, right panel). Each compartment’s share of the FRC and VT is determined by its position with the apical compartments smaller than the basal compartments. The distributions of VT and SV, in the supine and the upright position, are approximations based on observations by West 126 (Table 3.1). The model includes VD. Using an established relation between anatomic VD and height 58, we set the model VD for men at a greater volume compared to the VD for women (1.4 times), with the VD at 200 ml for men and 140 ml for women in the supine position. In the upright position, these values were increased by 70 ml (see below). The respiratory quotient (RQ), defined as the ratio of carbon dioxide production (VCO2) to VO2, normally between 0.7 and 1.0, was set at 0.9.
Circulation The model includes a simplified blood circulation with an arterial compartment (Va), a venous compartment (Vv) and lung capillary gas-exchange compartments (Vcap) (see Fig. 3.1, left panel). The lung capillary volume and the small venule volume are lumped, as gas exchange occurs in both. The major arteries of the lung are included in the venous compartment; the major veins of the lung are included in the arterial compartment. The total blood volume of 5.6 l is distributed over Vv (4.0 l), Va (1.3 l) and Vcap (200 ml) 27.
—Chapter 3— 31
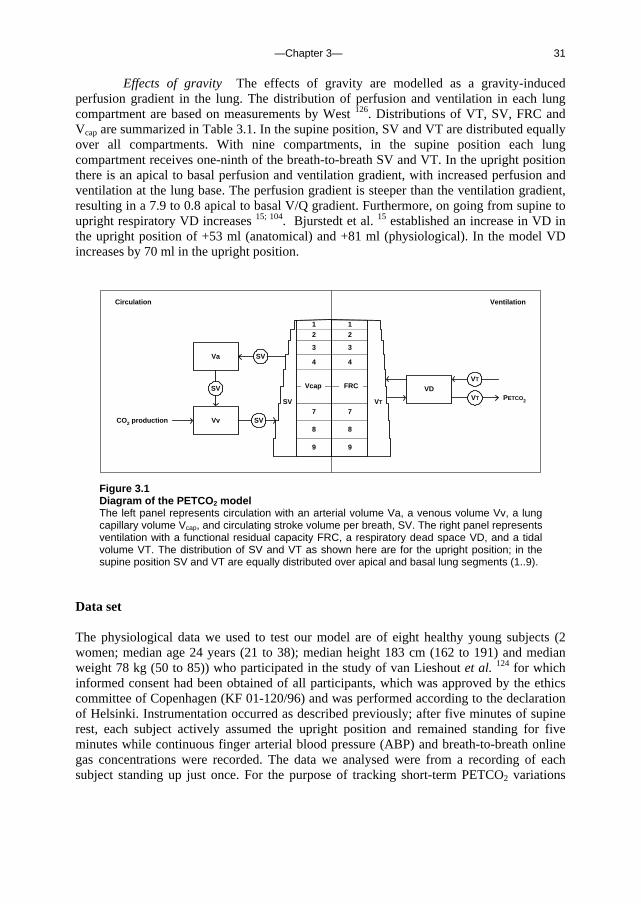
Effects of gravity The effects of gravity are modelled as a gravity-induced perfusion gradient in the lung. The distribution of perfusion and ventilation in each lung compartment are based on measurements by West 126. Distributions of VT, SV, FRC and Vcap are summarized in Table 3.1. In the supine position, SV and VT are distributed equally over all compartments. With nine compartments, in the supine position each lung compartment receives one-ninth of the breath-to-breath SV and VT. In the upright position there is an apical to basal perfusion and ventilation gradient, with increased perfusion and ventilation at the lung base. The perfusion gradient is steeper than the ventilation gradient, resulting in a 7.9 to 0.8 apical to basal V/Q gradient. Furthermore, on going from supine to upright respiratory VD increases 15; 104. Bjurstedt et al. 15 established an increase in VD in the upright position of +53 ml (anatomical) and +81 ml (physiological). In the model VD increases by 70 ml in the upright position.
Vv
Va
VD
SV
SV
VT
SVVT
CO2 production
PETCO2
1
7
2
3
9
8
6
5
4
1
7
2
3
9
8
6
5
4
VTSV
Vcap FRC
Circulation Ventilation
Figure 3.1 Diagram of the PETCO2 model The left panel represents circulation with an arterial volume Va, a venous volume Vv, a lung capillary volume Vcap, and circulating stroke volume per breath, SV. The right panel represents ventilation with a functional residual capacity FRC, a respiratory dead space VD, and a tidal volume VT. The distribution of SV and VT as shown here are for the upright position; in the supine position SV and VT are equally distributed over apical and basal lung segments (1..9).
Data set The physiological data we used to test our model are of eight healthy young subjects (2 women; median age 24 years (21 to 38); median height 183 cm (162 to 191) and median weight 78 kg (50 to 85)) who participated in the study of van Lieshout et al. 124 for which informed consent had been obtained of all participants, which was approved by the ethics committee of Copenhagen (KF 01-120/96) and was performed according to the declaration of Helsinki. Instrumentation occurred as described previously; after five minutes of supine rest, each subject actively assumed the upright position and remained standing for five minutes while continuous finger arterial blood pressure (ABP) and breath-to-breath online gas concentrations were recorded. The data we analysed were from a recording of each subject standing up just once. For the purpose of tracking short-term PETCO2 variations
—Chapter 3— 32
with posture change, we selected data starting 150 second prior to standing up and ending after 150 seconds of standing up.
Mean arterial blood pressure was measured with a Finapres (Model 5; Netherlands Organization for Applied Scientific Research, Biomedical Instrumentation, TNO-BMI). The cuff was applied to the midphalanx of the middle finger of the dominant arm, which was placed at heart level. Beat-to-beat changes in SV were estimated by modelling flow from arterial pressure (Modelflow®, TNO-BMI). This method computes an aortic waveform from a peripheral arterial pressure signal using a non-linear 3-element model of the aortic impedance 57; 71. Cardiac output was the product of SV and HR. To obtain absolute values of Q to calibrate Modelflow® Q, a Fick-determined Q was obtained from arterial and central venous O2 content and the VO2 in the supine and in the standing position. Absolute values of Q were used to calibrate Modelflow® Q, averaged during 150 seconds in the supine position, and during 150 seconds of standing. Breath-to-breath online gas analysis was performed using a Med-Graphics CPX/D metabolic cart. Respiratory gas was sampled continuously from a mouthpiece and partial gas pressures were obtained from a Zirkonia oxygen analyzer (accuracy ± 0.03% O2) and a nondispersive infrared sensor for CO2 (accuracy ± 0.05% CO2) that thus delivered VO2, VCO2 and PETCO2.
Data processing and analysis The ventilatory gas analysis was recorded as one value for every breath. All data were stored on a hard disk for off-line analysis. Mean ABP, HR and the ventilatory data were expressed in absolute values. Mean ABP was the integral of one beat. Heart rate was the inverse of the inter-beat interval. Then, ventilatory data and Fick-calibrated Modelflow® SV data were time aligned. For the duration of each breath, the sum of stroke volumes was taken to obtain breath-to-breath SV data.
Experiments To verify the contribution of the postural reduction in Q to hypocapnia in the standing position, the following protocol was carried out in seven healthy non- smoking subjects aged 29±5 years, height 176±8 cm, and weight 71±11 kg. Informed consent was obtained in all participants. The study was approved by the ethics committee of the Academic Medical Center (MEC 01-147) and performed according to the declaration of Helsinki. First, the effect of increased ventilation was eliminated by using a protocol that involved standing up during controlled breathing. Second, we eliminated the effect of V/Q mismatch, FRC increase and increased ventilation. To achieve this we used a protocol involving standing with inflated leg splints (Pneumasplint, International deposit Nr. 844181), which augment venous return, followed by rapid leg splint deflation, with breathing frequency and VT controlled. The subjects breathed through a mouthpiece connected to a two-way respiratory valve, and were instructed to breathe at a metronome-paced frequency (0.15 Hz). For each subject the airflow was adjusted to a comfortable level (8.2±1 l/min). During expiration the inflow of air filled a bag, and during inspiration the subject was instructed to empty the bag, thus maintaining a constant VT. Keeping the breathing fixed, 5 minutes of supine recording were followed by 5 minutes of recording in the standing position. Next, while in the standing position inflatable hip-to-toe leg splints were inflated to 60 mmHg. After 5 minutes recording during standing with inflated splints, the splints were deflated to atmospheric pressure within 4 seconds, followed by 5 minutes recording in standing position with deflated splints. The respiratory frequency and VT were fixed throughout the procedures. We measured finger ABP (Finometer Model 1, TNO-BMI) and PCO2 (Hewlett Packard Airway Adapter 1436A). SV was derived from
—Chapter 3— 33
the peripheral arterial pressure signal using Modelflow® as described above. Measurements of Q were carried out at the beginning and at the end of each procedure using the inert gas rebreathing technique (Innocor Model: SpO2 & O2 options 48). Rebreathing episodes were marked and Modelflow® Q was level-corrected. The sum of FRC and VD was measured in the supine and standing position also using Innocor rebreathing technique. Calculation is based on the dilution of insoluble gas (SF6). Measurement of FRC and VD combined, in both supine and standing positions, allowed us to analyse the effect of FRC increase as measured, on the PETCO2. Parameter sensitivity analysis To assess the relative contribution of the various physiological phenomena contributing to PETCO2 variations, the parameter sensitivity of the model was analysed. First, the effect of variations in VT, VD, SV, VO2, RQ, FRC, Vv, Va, TRESP and V/Q on model output (M-PETCO2) were evaluated by carrying out a series of simulations in which a steady-state period of 200 s was followed by a 900 s period with one input parameter set at a value ranging from -10% to +10% of baseline value. An exception is the V/Q parameter sensitivity, which was determined starting with 200 s steady-state ‘supine’ settings, followed by 900 s with ‘upright’ settings. Steady-state values were: VT = 484 ml; VD = 200 ml; SV = 550 ml; VO2 = 250 ml min-1; RQ = 0.9; FRC = 2.5 l; Vv = 4.0 l; Va = 1.3 l; TRESP = 4 s and V/Q = ‘supine’. The output value used in the analysis was M- PETCO2 at maximum value or at end-point. Second, the analysis was also performed with the input starting at baseline and varying each input variable as occurs during posture change with an increase in VT, VD and FRC, a reduction in SV, and a shift in V/Q. Statistical analysis Hemodynamic and respiratory variables were tested for normality (Shapiro-Wilk test) and, where distribution was not normal, the median was computed for each body position. Results were expressed as mean and standard deviation (SD) or as median and range, as appropriate. Supine and upright values were compared by paired t-test. Agreement between PETCO2 and M-PETCO2 was judged by plotting the difference between M-PETCO2 and PETCO2 against their mean, and computing Pearson’s correlation coefficient. The mean difference (bias) and SD (precision) between M-PETCO2 and PETCO2 was tested by paired t-test. A P-value < 0.05 was considered to indicate a statistically significant difference.
Results Input to the model The group average hemodynamic and ventilatory responses to standing up from the test database are given in Table 3.2. Upon standing, Q decreased from 6.5±1.1 l min-1 to 4.0±0.9 l min-1 in the standing position. The Q response ranged from –0.6 l min-1 to –4.5 l min-1. VT increased on standing up, while the respiratory rate decreased. VE increased on standing up in all subjects, with a range of 0.3 l min-1 to 5.9 l min-1. The PETCO2 decreased from 40±1 to 36±2 mmHg.
—C
hapt
er 3
—
34
Tab
le 3
.1. P
aram
eter
s o
f n
ine-
com
par
tmen
t lu
ng
mo
del
D
istr
ibut
ion
of s
trok
e vo
lum
e (S
V),
tida
l vol
ume
(VT
), fu
nctio
nal r
esid
ual c
apac
ity (
FR
C)
and
lung
cap
illar
y bl
ood
volu
me
(Vca
p) p
er lu
ng
segm
ent k
, in
the
supi
ne a
nd s
tand
ing
posi
tion.
Upr
ight
dis
trib
utio
ns a
re b
ased
on
mea
sure
men
ts b
y W
est 12
6 .
Tab
le 3
.2. H
emo
dyn
amic
an
d v
enti
lato
ry r
esp
on
ses
to s
tan
din
g u
p in
eig
ht
no
rmal
su
bje
cts
G
roup
ave
rage
val
ues
(mea
n ±
SD
) fo
r ca
rdia
c ou
tput
(Q
), C
O2 ou
tput
(V
CO
2), o
xyge
n up
take
(V
O2)
, end
-tid
al C
O2
pres
sure
(P
ET
CO
2), r
espi
rato
ry r
ate
(R-R
), ti
dal v
olum
e (V
T)
and
expi
red
vent
ilatio
n (V
E)
as d
eter
min
ed fr
om 1
50 s
in
the
supi
ne p
ositi
on fo
llow
ed b
y 15
0 s
of s
tand
ing.
Dat
a fr
om th
e st
udy
of v
an L
iesh
out e
t al.
124 *
Sta
ndin
g vs
. sup
ine,
pa
ired
t-te
st.
Lung
Com
part
men
t (A
pica
l to
Bas
al, R
espe
ctiv
ely)
1 2
3 4
5 6
7 8
9 T
otal
Sup
ine
Per
fusi
on (
% S
Vk)
11
.1
11.1
11
.1
11.1
11
.1
11.1
11
.1
11.1
11
.1
100
V
entil
atio
n (%
VT
k)
11.1
11
.1
11.1
11
.1
11.1
11
.1
11.1
11
.1
11.1
10
0
A
lveo
lar
Vol
. (%
FR
Ck)
6.
58
8.64
10
.11
11.1
6 11
.90
12.4
3 12
.81
13.0
8 13
.27
100
Lu
ng C
apil.
(%
Vca
pk)
6.58
8.
64
10.1
1 11
.16
11.9
0 12
.43
12.8
1 13
.08
13.2
7 10
0
S
tand
ing
Per
fusi
on (
% S
Vk)
0.
58
3.21
5.
84
8.47
11
.10
13.7
3 16
.36
18.9
9 21
.62
100
V
entil
atio
n (%
VT
k)
4.58
6.
63
8.48
10
.13
11.6
2 12
.96
14.1
7 15
.25
16.2
2 10
0
Alv
eola
r V
ol. (
% F
RC
k)
6.58
8.
64
10.1
1 11
.16
11.9
0 12
.43
12.8
1 13
.08
13.2
7 10
0
Lung
Cap
il. (
%V
capk
) 6.
58
8.64
10
.11
11.1
6 11
.90
12.4
3 12
.81
13.0
8 13
.27
100
Q
(l
min
-1)
VC
O2
(ml m
in-1 )
VO
2
(ml m
in-1
) P
ET
CO
2
(mm
Hg)
R
-R
(min
-1)
VT
(ml)
VE
(l m
in-1
)
Sup
ine
6.
5±1.
1 21
7±36
26
3±60
40
±1
16±4
49
0±10
5 7.
9±1.
4 S
tand
ing
4.
0±0.
9 24
8±53
26
3±65
36
±2
13±3
73
4±19
9 9.
8±2.
7 P
val
ue*
0.00
2 n.
s.
n.s.
<
0.0
01
0.03
0.
005
0.03
—Chapter 3— 35
H
Time(s)
-120 -60 0 60 120
BA
PE
TC
O2
(mm
Hg)
20
30
40
50
G
Time (s)
-120 -60 0 60 120
PE
TC
O2
(mm
Hg)
20
30
40
50
FE
PE
TC
O2
(mm
Hg)
20
30
40
50
DC
PE
TC
O2
(mm
Hg)
20
30
40
50
r2 = 0.49
r2 = 0.86
r2 = 0.71r2 = 0.76
r2 = 0.60 r2 = 0.43
r2 = 0.75
r2 = 0.84
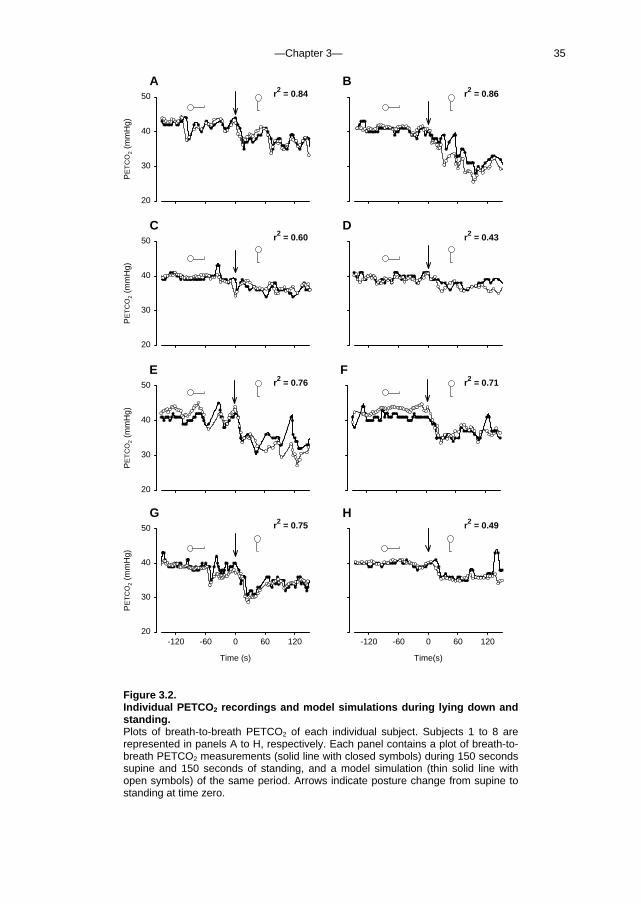
Figure 3.2. Individual PETCO2 recordings and model simulations during lying down and standing. Plots of breath-to-breath PETCO2 of each individual subject. Subjects 1 to 8 are represented in panels A to H, respectively. Each panel contains a plot of breath-to-breath PETCO2 measurements (solid line with closed symbols) during 150 seconds supine and 150 seconds of standing, and a model simulation (thin solid line with open symbols) of the same period. Arrows indicate posture change from supine to standing at time zero.
—Chapter 3— 36
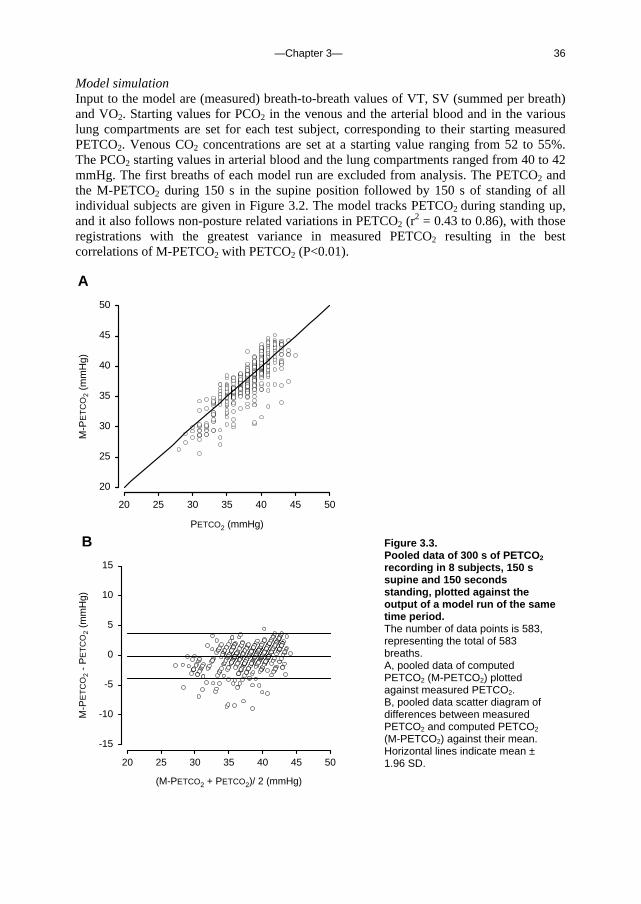
Model simulation Input to the model are (measured) breath-to-breath values of VT, SV (summed per breath) and VO2. Starting values for PCO2 in the venous and the arterial blood and in the various lung compartments are set for each test subject, corresponding to their starting measured PETCO2. Venous CO2 concentrations are set at a starting value ranging from 52 to 55%. The PCO2 starting values in arterial blood and the lung compartments ranged from 40 to 42 mmHg. The first breaths of each model run are excluded from analysis. The PETCO2 and the M-PETCO2 during 150 s in the supine position followed by 150 s of standing of all individual subjects are given in Figure 3.2. The model tracks PETCO2 during standing up, and it also follows non-posture related variations in PETCO2 (r
2 = 0.43 to 0.86), with those registrations with the greatest variance in measured PETCO2 resulting in the best correlations of M-PETCO2 with PETCO2 (P<0.01). A
PETCO2 (mmHg)
20 25 30 35 40 45 50
M-P
ET
CO
2 (m
mH
g)
20
25
30
35
40
45
50
B
(M-PETCO2 + PETCO2)/ 2 (mmHg)
20 25 30 35 40 45 50
M-P
ET
CO
2 -
PE
TC
O2
(mm
Hg)
-15
-10
-5
0
5
10
15
Figure 3.3. Pooled data of 300 s of PETCO2 recording in 8 subjects, 150 s supine and 150 seconds standing, plotted against the output of a model run of the same time period. The number of data points is 583, representing the total of 583 breaths. A, pooled data of computed PETCO2 (M-PETCO2) plotted against measured PETCO2. B, pooled data scatter diagram of differences between measured PETCO2 and computed PETCO2 (M-PETCO2) against their mean. Horizontal lines indicate mean ± 1.96 SD.
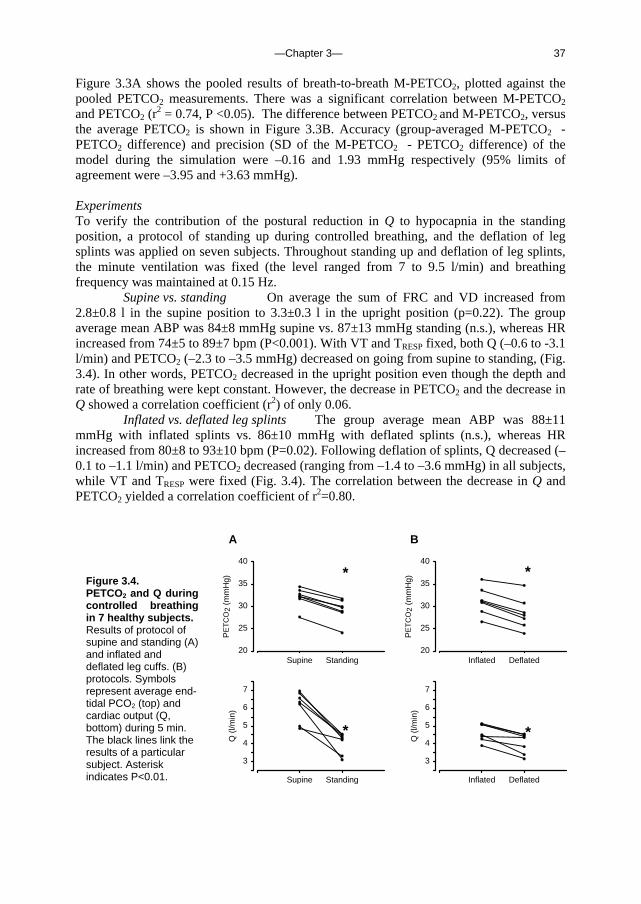
—Chapter 3— 37
Figure 3.3A shows the pooled results of breath-to-breath M-PETCO2, plotted against the pooled PETCO2 measurements. There was a significant correlation between M-PETCO2 and PETCO2 (r
2 = 0.74, P <0.05). The difference between PETCO2 and M-PETCO2, versus the average PETCO2 is shown in Figure 3.3B. Accuracy (group-averaged M-PETCO2 - PETCO2 difference) and precision (SD of the M-PETCO2 - PETCO2 difference) of the model during the simulation were –0.16 and 1.93 mmHg respectively (95% limits of agreement were –3.95 and +3.63 mmHg). Experiments To verify the contribution of the postural reduction in Q to hypocapnia in the standing position, a protocol of standing up during controlled breathing, and the deflation of leg splints was applied on seven subjects. Throughout standing up and deflation of leg splints, the minute ventilation was fixed (the level ranged from 7 to 9.5 l/min) and breathing frequency was maintained at 0.15 Hz.
Supine vs. standing On average the sum of FRC and VD increased from 2.8±0.8 l in the supine position to 3.3±0.3 l in the upright position (p=0.22). The group average mean ABP was 84±8 mmHg supine vs. 87±13 mmHg standing (n.s.), whereas HR increased from 74±5 to 89±7 bpm (P<0.001). With VT and TRESP fixed, both Q (–0.6 to -3.1 l/min) and PETCO2 (–2.3 to –3.5 mmHg) decreased on going from supine to standing, (Fig. 3.4). In other words, PETCO2 decreased in the upright position even though the depth and rate of breathing were kept constant. However, the decrease in PETCO2 and the decrease in Q showed a correlation coefficient (r2) of only 0.06.
Inflated vs. deflated leg splints The group average mean ABP was 88±11 mmHg with inflated splints vs. 86±10 mmHg with deflated splints (n.s.), whereas HR increased from 80±8 to 93±10 bpm (P=0.02). Following deflation of splints, Q decreased (–0.1 to –1.1 l/min) and PETCO2 decreased (ranging from –1.4 to –3.6 mmHg) in all subjects, while VT and TRESP were fixed (Fig. 3.4). The correlation between the decrease in Q and PETCO2 yielded a correlation coefficient of r2=0.80.
B
Inflated Deflated
PE
TC
O2
(mm
Hg)
20
25
30
35
40
Inflated Deflated
Q (
l/min
)
3
4
5
6
7
Supine Standing
Q (
l/min
)
3
4
5
6
7
A
Supine Standing
PE
TC
O2
(mm
Hg)
20
25
30
35
40
*
*
*
*
Figure 3.4. PETCO2 and Q during controlled breathing in 7 healthy subjects. Results of protocol of supine and standing (A) and inflated and deflated leg cuffs. (B) protocols. Symbols represent average end-tidal PCO2 (top) and cardiac output (Q, bottom) during 5 min. The black lines link the results of a particular subject. Asterisk indicates P<0.01.
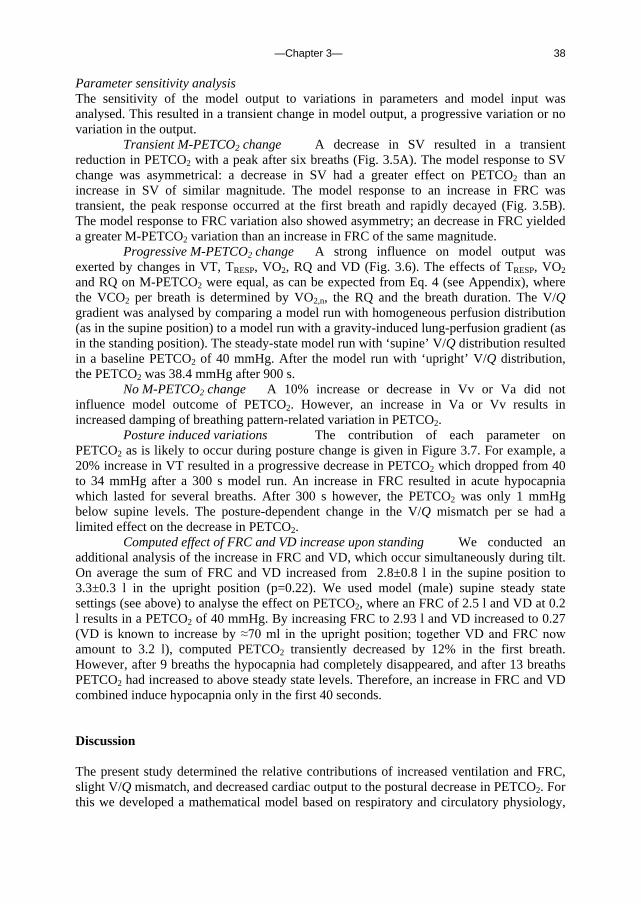
—Chapter 3— 38
Parameter sensitivity analysis The sensitivity of the model output to variations in parameters and model input was analysed. This resulted in a transient change in model output, a progressive variation or no variation in the output.
Transient M-PETCO2 change A decrease in SV resulted in a transient reduction in PETCO2 with a peak after six breaths (Fig. 3.5A). The model response to SV change was asymmetrical: a decrease in SV had a greater effect on PETCO2 than an increase in SV of similar magnitude. The model response to an increase in FRC was transient, the peak response occurred at the first breath and rapidly decayed (Fig. 3.5B). The model response to FRC variation also showed asymmetry; an decrease in FRC yielded a greater M-PETCO2 variation than an increase in FRC of the same magnitude.
Progressive M-PETCO2 change A strong influence on model output was exerted by changes in VT, TRESP, VO2, RQ and VD (Fig. 3.6). The effects of TRESP, VO2 and RQ on M-PETCO2 were equal, as can be expected from Eq. 4 (see Appendix), where the VCO2 per breath is determined by VO2,n, the RQ and the breath duration. The V/Q gradient was analysed by comparing a model run with homogeneous perfusion distribution (as in the supine position) to a model run with a gravity-induced lung-perfusion gradient (as in the standing position). The steady-state model run with ‘supine’ V/Q distribution resulted in a baseline PETCO2 of 40 mmHg. After the model run with ‘upright’ V/Q distribution, the PETCO2 was 38.4 mmHg after 900 s.
No M-PETCO2 change A 10% increase or decrease in Vv or Va did not influence model outcome of PETCO2. However, an increase in Va or Vv results in increased damping of breathing pattern-related variation in PETCO2.
Posture induced variations The contribution of each parameter on PETCO2 as is likely to occur during posture change is given in Figure 3.7. For example, a 20% increase in VT resulted in a progressive decrease in PETCO2 which dropped from 40 to 34 mmHg after a 300 s model run. An increase in FRC resulted in acute hypocapnia which lasted for several breaths. After 300 s however, the PETCO2 was only 1 mmHg below supine levels. The posture-dependent change in the V/Q mismatch per se had a limited effect on the decrease in PETCO2.
Computed effect of FRC and VD increase upon standing We conducted an additional analysis of the increase in FRC and VD, which occur simultaneously during tilt. On average the sum of FRC and VD increased from 2.8±0.8 l in the supine position to 3.3±0.3 l in the upright position (p=0.22). We used model (male) supine steady state settings (see above) to analyse the effect on PETCO2, where an FRC of 2.5 l and VD at 0.2 l results in a PETCO2 of 40 mmHg. By increasing FRC to 2.93 l and VD increased to 0.27 (VD is known to increase by ≈70 ml in the upright position; together VD and FRC now amount to 3.2 l), computed PETCO2 transiently decreased by 12% in the first breath. However, after 9 breaths the hypocapnia had completely disappeared, and after 13 breaths PETCO2 had increased to above steady state levels. Therefore, an increase in FRC and VD combined induce hypocapnia only in the first 40 seconds. Discussion The present study determined the relative contributions of increased ventilation and FRC, slight V/Q mismatch, and decreased cardiac output to the postural decrease in PETCO2. For this we developed a mathematical model based on respiratory and circulatory physiology,
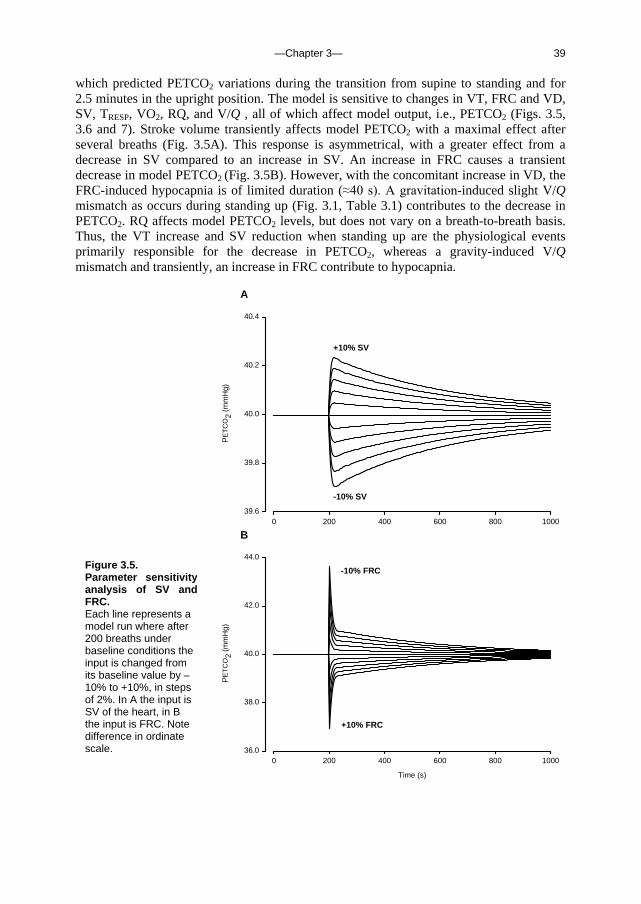
—Chapter 3— 39
which predicted PETCO2 variations during the transition from supine to standing and for 2.5 minutes in the upright position. The model is sensitive to changes in VT, FRC and VD, SV, TRESP, VO2, RQ, and V/Q , all of which affect model output, i.e., PETCO2 (Figs. 3.5, 3.6 and 7). Stroke volume transiently affects model PETCO2 with a maximal effect after several breaths (Fig. 3.5A). This response is asymmetrical, with a greater effect from a decrease in SV compared to an increase in SV. An increase in FRC causes a transient decrease in model PETCO2 (Fig. 3.5B). However, with the concomitant increase in VD, the FRC-induced hypocapnia is of limited duration (≈40 s). A gravitation-induced slight V/Q mismatch as occurs during standing up (Fig. 3.1, Table 3.1) contributes to the decrease in PETCO2. RQ affects model PETCO2 levels, but does not vary on a breath-to-breath basis. Thus, the VT increase and SV reduction when standing up are the physiological events primarily responsible for the decrease in PETCO2, whereas a gravity-induced V/Q mismatch and transiently, an increase in FRC contribute to hypocapnia.
A
0 200 400 600 800 1000
PE
TC
O2
(mm
Hg)
39.6
39.8
40.0
40.2
40.4
+10% SV
-10% SV
B
Time (s)
0 200 400 600 800 1000
PE
TC
O2
(mm
Hg)
36.0
38.0
40.0
42.0
44.0
-10% FRC
+10% FRC
Figure 3.5. Parameter sensitivity analysis of SV and FRC. Each line represents a model run where after 200 breaths under baseline conditions the input is changed from its baseline value by –10% to +10%, in steps of 2%. In A the input is SV of the heart, in B the input is FRC. Note difference in ordinate scale.
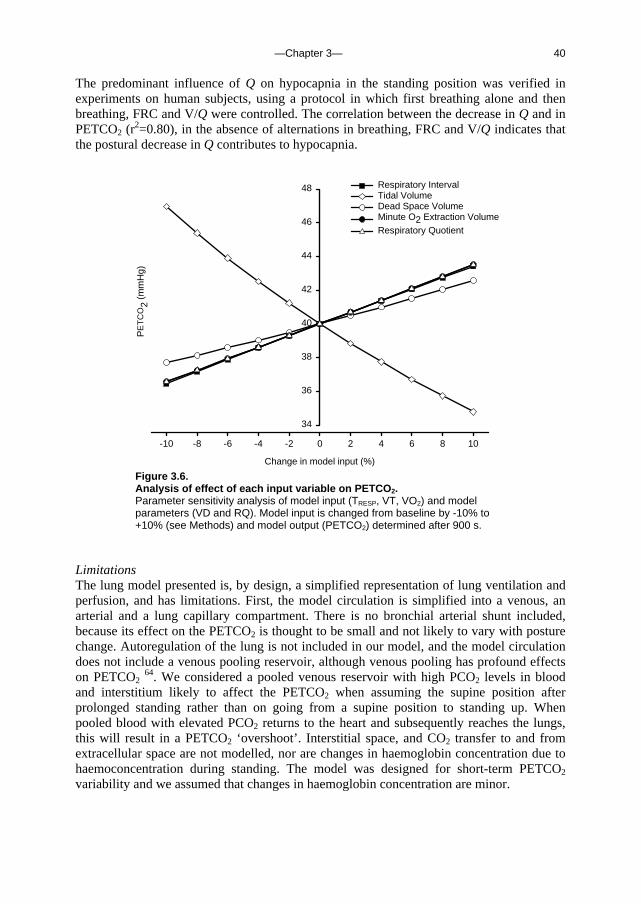
—Chapter 3— 40
The predominant influence of Q on hypocapnia in the standing position was verified in experiments on human subjects, using a protocol in which first breathing alone and then breathing, FRC and V/Q were controlled. The correlation between the decrease in Q and in PETCO2 (r
2=0.80), in the absence of alternations in breathing, FRC and V/Q indicates that the postural decrease in Q contributes to hypocapnia.
Change in model input (%)
-10 -8 -6 -4 -2 0 2 4 6 8 10
PE
TC
O2
(mm
Hg)
34
36
38
40
42
44
46
48 Respiratory IntervalTidal VolumeDead Space VolumeMinute O2 Extraction VolumeRespiratory Quotient
Figure 3.6. Analysis of effect of each input variable on PETCO2. Parameter sensitivity analysis of model input (TRESP, VT, VO2) and model parameters (VD and RQ). Model input is changed from baseline by -10% to +10% (see Methods) and model output (PETCO2) determined after 900 s.
Limitations The lung model presented is, by design, a simplified representation of lung ventilation and perfusion, and has limitations. First, the model circulation is simplified into a venous, an arterial and a lung capillary compartment. There is no bronchial arterial shunt included, because its effect on the PETCO2 is thought to be small and not likely to vary with posture change. Autoregulation of the lung is not included in our model, and the model circulation does not include a venous pooling reservoir, although venous pooling has profound effects on PETCO2
64. We considered a pooled venous reservoir with high PCO2 levels in blood and interstitium likely to affect the PETCO2 when assuming the supine position after prolonged standing rather than on going from a supine position to standing up. When pooled blood with elevated PCO2 returns to the heart and subsequently reaches the lungs, this will result in a PETCO2 ‘overshoot’. Interstitial space, and CO2 transfer to and from extracellular space are not modelled, nor are changes in haemoglobin concentration due to haemoconcentration during standing. The model was designed for short-term PETCO2 variability and we assumed that changes in haemoglobin concentration are minor.

—Chapter 3— 41
The apex to base V/Q distribution inequality in the standing position results in a decrease in PETCO2 because the air expired from alveoli active in gas exchange is diluted by air from apical lung segments which are relatively underperfused, suggesting that the reduction in PETCO2 will be more pronounced than the reduction in arterial PCO2 when standing up. In 1962 Bjurstedt et al. 15 observed that changing from the supine to the standing position was associated with a significant rise in the arterial to end-tidal PCO2 difference. However, our current model and experimental data do not allow us to analyse the arterial to end-tidal PCO2 difference due to the afore mentioned model limitations, including the absence of a bronchial arterial shunt, a venous pooling reservoir and lung-autoregulation.
Time (s)
100 200 300 400 500
PE
TC
O2
(mm
Hg)
30
35
40
45
50
VT
Q
ALL
V/Q
VD
FRC
Figure 3.7. Effect of active-standing induced variations in model input variables on PETCO2. Each thin line indicates the output of a model run starting with supine settings and with parameter settings varied 200 s as is likely to occur on standing up: Q, output when Q was reduced by 40%, VT, output when VT was increased by 20%, FRC, output when FRC was increased by 20%, VD, output when the VD was increased by 70 ml, V/Q, output when V/Q shifted from equal distribution to model settings for a gravitationally induced V/Q mismatch. The thick black line labelled ALL indicates model PETCO2 levels when each of these changes occurred simultaneously.
To convert [CO2] to PCO2 and vice versa, we fitted blood CO2 equilibrium curves (see Appendix), without accounting for O2–dependency. We did not implement Kelman’s digital computer procedure for conversion of PCO2 into blood CO2 content, which in our model would yield a linear relationship because haemoglobin concentration and temperature are assumed to remain constant (76).
Step changes in Vv and in Va did not influence PETCO2 in the sensitivity analysis, where all other model settings were kept constant. This does not imply that settings for Vv and Va are of no consequence. These compartments act as buffers for PETCO2 changes
—Chapter 3— 42
brought about by variations in VT, SV, etc. Therefore, a larger Vv or Va will result in damping of PETCO2 variations.
Several model parameters are estimated based on previous studies. The distribution of ventilation and perfusion in the upright position are based on measurements of West 126. The distribution of ventilation and perfusion over the lung are influenced by a gravity-invoked hydrostatic pressure gradient (perfusion) and a pleural pressure gradient influencing the alveolar pressure/volume relationship (ventilation). Although in the supine position there is still some effect of gravity, this will be less because the vertical height of the lung is less than in the upright position. Therefore, we chose to model the distribution of ventilation and perfusion in the supine position as equally distributed from apex to base. Conclusions In human subjects assuming the upright position, end-tidal CO2 levels drop. The present study shows that the CO2 levels during posture change can be tracked using a mathematical model, with breath-to-breath values for tidal volume, stroke volume, pulmonary O2 uptake and respiratory interval as input variables. We found that the decrease in end-tidal CO2 level in the standing position is due to increased tidal volume and, transiently, decreased cardiac output increased FRC, and that the gravity-induced slight ventilation/perfusion mismatch contributes to the hypocapnia. Acknowledgement We thank Professor G. Kim Prisk for his critical evaluation of the model.

—Chapter 3— 43
Appendix
Symbols Definition Units
[CO2]a arterial CO2 content % [CO2]v venous partial CO2 content % ABP arterial blood pressure mmHg FRC functional residual capacity ml HR heart rate bpm PETCO2 end-tidal partial CO2 pressure mmHg M-PETCO2 model output end-tidal partial CO2 pressure mmHg PkCO2 lung compartment ‘k’ partial CO2 pressure mmHg PtcCO2 PCO2 of blood draining the lungs mmHg Q cardiac output l min-1 RQ respiratory quotient unitless R-R respiratory rate min-1 SV stroke volume per breath ml TRESP respiratory interval s Va arterial blood volume ml Vcap lung capillary blood volume ml VD anatomical dead space ml VE ventilation l min-1 VO2 pulmonary O2 uptake ml min-1 V/Q ventilation-perfusion ratio unitless VT tidal volume ml Vv venous blood volume ml
Model equations Conversion and weight functions The CO2 equilibrium curve relating blood CO2 content ([CO2]) to blood partial CO2 pressure (PCO2) is described as [CO2] = f(PCO2), with
f(x) = 0.53 · (1.266 – exp (-0.0257x) )
To compute PCO2 from [CO2] in blood, we use the inverse function
f -1(x) = -ln (1.266 – (x / 0.53)) / 0.0257
To convert PCO2 in air (mmHg) to [CO2] (%), we use the conversion factor c, which amounts to 0.1316 %/mmHg. The distribution of SV and VT over each lung compartment k (k = 1…9) is described by functions g and h, respectively. These functions, which are different for the supine and upright positions and yield the fractions for SV and VT listed in Table 3.2, are given by
g(k) =
+ position)upright (in thek 0.0263 0.0205-
position) supine (in the 1/9
and
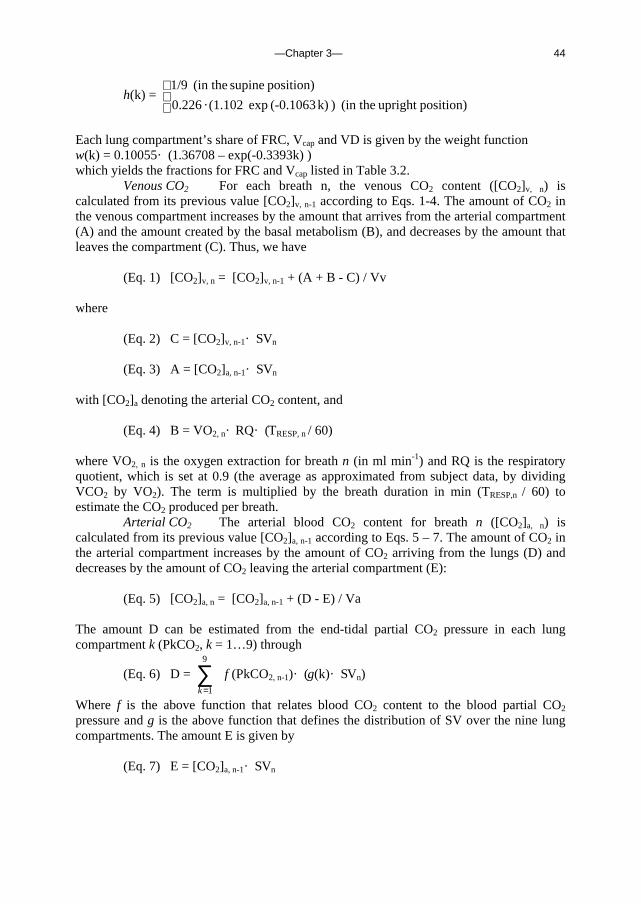
—Chapter 3— 44
h(k) =
position)upright (in the ) k) (-0.1063 exp (1.102 · 0.226
position) supine (in the 1/9
Each lung compartment’s share of FRC, Vcap and VD is given by the weight function w(k) = 0.10055 · (1.36708 – exp(-0.3393k) ) which yields the fractions for FRC and Vcap listed in Table 3.2.
Venous CO2 For each breath n, the venous CO2 content ([CO2]v, n) is calculated from its previous value [CO2]v, n-1 according to Eqs. 1-4. The amount of CO2 in the venous compartment increases by the amount that arrives from the arterial compartment (A) and the amount created by the basal metabolism (B), and decreases by the amount that leaves the compartment (C). Thus, we have
(Eq. 1) [CO2]v, n = [CO2]v, n-1 + (A + B - C) / Vv
where
(Eq. 2) C = [CO2]v, n-1 · SVn (Eq. 3) A = [CO2]a, n-1 · SVn
with [CO2]a denoting the arterial CO2 content, and
(Eq. 4) B = VO2, n · RQ · (TRESP, n / 60)
where VO2, n is the oxygen extraction for breath n (in ml min-1) and RQ is the respiratory quotient, which is set at 0.9 (the average as approximated from subject data, by dividing VCO2 by VO2). The term is multiplied by the breath duration in min (TRESP,n / 60) to estimate the CO2 produced per breath.
Arterial CO2 The arterial blood CO2 content for breath n ([CO2]a, n) is calculated from its previous value [CO2]a, n-1 according to Eqs. 5 – 7. The amount of CO2 in the arterial compartment increases by the amount of CO2 arriving from the lungs (D) and decreases by the amount of CO2 leaving the arterial compartment (E):
(Eq. 5) [CO2]a, n = [CO2]a, n-1 + (D - E) / Va
The amount D can be estimated from the end-tidal partial CO2 pressure in each lung compartment k (PkCO2, k = 1…9) through
(Eq. 6) D = ∑=
9
1k
f (PkCO2, n-1) · (g(k) · SVn)
Where f is the above function that relates blood CO2 content to the blood partial CO2 pressure and g is the above function that defines the distribution of SV over the nine lung compartments. The amount E is given by
(Eq. 7) E = [CO2]a, n-1 · SVn

—Chapter 3— 45
Lung CO2 The PCO2 of blood draining the lungs (PtcCO2) is dependent on the gravity-induced perfusion and ventilation gradients, as described by the above functions g and h. For each breath, the PCO2 in each lung segment k (PkCO2, n) is calculated according to Eqs. 8 -13. At FRC, the amount of CO2 in lung segment k (F) is determined by the CO2 content in the lung capillaries, in the FRC and in the VD:
(Eq. 8) F = f (PkCO2, n-1) · w(k) · Vcap + c · PkCO2, n-1 · w(k) · FRC
+ c · PETCO2, n-1 · w(k) · VD with the weight function w and conversion factor c as described above. The contribution of CO2 in dead space (the right-most term) is computed noting that end-tidal air from the previous breath is returned to the lungs from dead space. The amount of CO2 carried to the lungs from the venous compartment (G) is given by
(Eq. 9) G = [CO2]v, n-1 · SVn · g(k)
The ratio a of [CO2] in blood and [CO2] in air is approximated from the previous breath, n-1, according to
(Eq. 10) a = f (PETCO2, n-1) / (c · PETCO2, n-1)
The ratio b of the end-tidal amount of CO2 in air and the total amount of CO2 is given by
(Eq. 11) b = (w(k) · FRC + h(k) · VTn)
/ {a(w(k) · Vcap + g(k) · SVn) + w(k) · FRC + h(k) · VTn)} The end-tidal [CO2] in each lung compartment k is determined by the total amount of CO2 (F+G), which is distributed over air and blood with ratio b, and the end-tidal volume of air in compartment k:
(Eq. 12) [CO2]k, n = b (F + G) / (w(k) · FRC + h(k) · VTn)
A simple conversion using the above constant c then yields PkCO2, n. The PETCO2 depends on the distribution of tidal volume, which is given by the fraction h(k), k = 1..9, and differs between the supine and the standing position, and is computed as
(Eq. 13) PETCO2, n = ∑=
9
1k
h(k) · PkCO2, n

—Chapter 3— 46
—Chapter 4— 47
Chapter 4. Sublingual nitroglycerine used in routine tilt testing provokes cardiac output mediated vasovagal response
J.Gisolf, B.E.Westerhof, N.van Dijk, K.H.Wesseling, W.Wieling and J.M.Karemaker, J Am Coll Cardiol 2004 Aug 4;44(3):588-93
Sublingual nitroglycerine can be used during routine tilt testing of patients with a history of vasovagal syncope, to enhance venous pooling and thereby increase the test sensitivity. In the following study we investigate the circulatory changes brought about by nitroglycerine during the tilt test, and we compare the response of tilt-positive patients (those who experienced a vasovagal response after nitroglycerine) to the response of tilt-negative patients. Introduction Recurrent syncope is a common medical problem. Head-up tilt testing with or without pharmacological intervention has been shown to be a useful diagnostic test to document a tendency for vasovagal faints 10; 11; 22; 77; 101; 113; 119. Nitroglycerine (NTG) is commonly administered to increase the diagnostic yield of the procedure 1; 102; 103 because as potent venodilators 90, nitrates might facilitate vasovagal syncope (VVS) by enhancing venous pooling in the upright posture. NTG has been proposed to enter smooth muscle cells where it undergoes metabolic activation to nitric oxide (NO) 20; 68. There is mounting evidence that NO-donors have pronounced central effects 133. NTG is lipid soluble and readily crosses cell membranes. Animal studies suggest a direct effect of NTG on the central nervous system resulting in sympathetic inhibition 88. We therefore hypothesized that NTG facilitates a vasovagal reaction in routine head-up tilt testing not only via venous vasodilatation, but also by acting centrally on circulatory control and inhibiting the baroreflex control of heart rate and arterial peripheral resistance, thus leading to syncope by dual pathways. The purpose of this study was to investigate the effect of NTG, as used in routine tilt testing in otherwise healthy patients with a history of VVS, on hemodynamic characteristics and baroreflex control of heart rate (HR) and systemic vascular resistance (SRV). We further sought to assess whether immediate cardiovascular response to NTG was related to test outcome.

—Chapter 4— 48
Methods Study population The study group consisted of patients with suspected vasovagal syncope, referred for routine tilt-table testing to the Syncope Unit of the Academic Medical Center in the period of June 2002 to July 2003. Excluded were patients with a history of cardiovascular disease, carotid sinus syndrome or any disease that might affect the autonomic nervous system, and patients using medication that might affect the circulation or circulatory control. Subsequently we excluded patients who experienced a vasovagal episode before administration of nitroglycerine (2 patients). A total of 39 patients (18 females) were included in the study.
Abbreviations and Acronyms
NTG VVS NO BRS SV CO HR MAP IBI SVR SAP DAP LF SNP
nitroglycerine vasovagal syncope nitric oxide baroreflex sensitivity stroke volume cardiac output heart rate mean arterial pressure interbeat interval systemic vascular resistance systolic arterial pressure diastolic arterial pressure low frequency sodium nitroprusside
Tilt test protocol and measurements The tests were done between 9:00 AM and 1:00 PM in a temperature controlled room (23ºC). A manually operated tilt table with a footboard was used. Blood pressure was measured continuously and non-invasively using Finapres Model 5 (TNO Biomedical Instrumentation, Amsterdam, the Netherlands). Beat-to-beat changes in stroke volume (SV) were estimated by modeling flow from arterial pressure (Modelflow, TNO Biomedical Instrumentation) 125 71 57. The tilt-table test started with 5 minutes of supine rest followed by 20 minutes head-up tilt (60º). If no VVS developed, nitroglycerine was administered sublingually (0.4 mg) for an additional 15-minute tilt duration 21. Oncoming syncope was aborted by means of tilt back or counter-maneuvers such as leg crossing 79, before loss of consciousness set in. The study was approved by the Medical Ethical Committee of the Academic Medical Center, University of Amsterdam, the Netherlands. Data acquisition and analysis The Finapres arterial pressure signal was analog/digital converted at 100 Hz and stored on hard disk for off-line analysis. Mean arterial pressure (MAP) was the true integral of the arterial pressure wave over 1 beat divided by the corresponding beat interval. HR was computed as the inverse of the interbeat interval (IBI) and expressed in beats per minute. Cardiac output (CO) was the product of SV and HR, and SVR was MAP at heart level divided by CO. Beat-to-beat values were computed and averaged per minute. SV, CO and
—Chapter 4— 49
SVR were set at 100% (baseline) in the upright posture, 5 minutes prior to NTG, and variations were expressed as percentages of this baseline. Slopes were computed of the minute-averages of HR, systolic and diastolic arterial pressure (SAP and DAP respectively), MAP, SV, CO, and SVR over a 4-minute time frame starting at NTG administration, in all patients.
Of those patients who developed VVS during the tilt test, minute averages were calculated of beat-to-beat data up to a point where a drop in HR and/or arterial blood pressure preceding the vasovagal episode was detected. To analyze the hypotensive, presyncopal episode in tilt positive patients, the last 15 seconds prior to intervention such as tilt back were analyzed.
Baroreflex sensitivity Beat-to-beat SAP and IBI time series were detrended and Hanning Windowed. Power spectral density and cross-spectra of SAP and IBI in the low-frequency (LF) band (0.06 – 0.15 Hz) were computed using Discrete Fourier Transform as described elsewhere 38. For time-domain analysis of spontaneous baroreflex sensitivity (BRS) we used the cross-correlation method PRVXBRS that is now standard part of the software packages delivered with Portapres and Finometer products (FMS, Netherlands). The SAP and IBI time series were resampled at 1 Hz. In a 10 s window, the correlation and regression slope between SAP and IBI were computed. Delays of 0 to 5 s increments in IBI were computed, and the delay with the highest positive coefficient of correlation was selected. The slope between SAP and IBI was recorded as a BRS estimate if the correlation was significant at P=0.01. Statistical analysis Variables were tested for normality using the Kolmogorov-Smirnov test, and expressed as mean and SD, unless stated otherwise. Responses to sublingual nitroglycerine were analyzed using non-parametric tests for 2 related samples (Wilcoxon signed rank test), or paired t-tests where appropriate. Differences between groups were analyzed using non-parametric tests for 2 independent samples (Mann-Whitney U test), or t-test where appropriate. Pearson’s correlation coefficient was computed for the correlation between the BRS results in the time and frequency domain. The association between data (computed slopes) and test outcome (time to faint), including censored data of those patients without vasovagal syncope during the test, was assessed using Cox regression analysis (SPSS for Windows, release 11.5.2). Significance of the Walt statistic was computed. Results Subjects NTG induced presyncope in 22 (56%) of the 39 otherwise healthy patients included in the study. The average age (36±16 years), height (175±10 cm), weight (73±15 kg) and distribution of gender did not differ between the patients who experienced near syncope during the tilt test and those who did not. The time from administration of NTG to presyncope in the tilt-positive patients ranged from 2 min 50 s to 14 min 50 s. All vasovagal patients indicated prodromal symptoms such as light-headedness or nausea. Data recording stopped in 2 tilt-negative patients (in the 4th and 10th minute after NTG administration) for technical reasons.
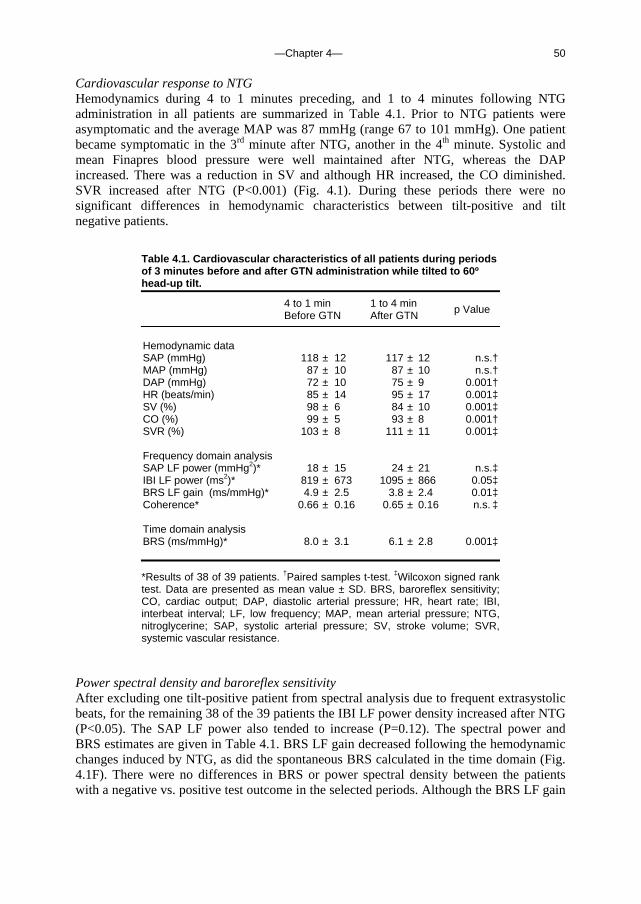
—Chapter 4— 50
Cardiovascular response to NTG Hemodynamics during 4 to 1 minutes preceding, and 1 to 4 minutes following NTG administration in all patients are summarized in Table 4.1. Prior to NTG patients were asymptomatic and the average MAP was 87 mmHg (range 67 to 101 mmHg). One patient became symptomatic in the 3rd minute after NTG, another in the 4th minute. Systolic and mean Finapres blood pressure were well maintained after NTG, whereas the DAP increased. There was a reduction in SV and although HR increased, the CO diminished. SVR increased after NTG (P<0.001) (Fig. 4.1). During these periods there were no significant differences in hemodynamic characteristics between tilt-positive and tilt negative patients.
Table 4.1. Cardiovascular characteristics of all patients during periods of 3 minutes before and after GTN administration while tilted to 60º head-up tilt.
*Results of 38 of 39 patients. †Paired samples t-test. ‡Wilcoxon signed rank test. Data are presented as mean value ± SD. BRS, baroreflex sensitivity; CO, cardiac output; DAP, diastolic arterial pressure; HR, heart rate; IBI, interbeat interval; LF, low frequency; MAP, mean arterial pressure; NTG, nitroglycerine; SAP, systolic arterial pressure; SV, stroke volume; SVR, systemic vascular resistance.
Power spectral density and baroreflex sensitivity After excluding one tilt-positive patient from spectral analysis due to frequent extrasystolic beats, for the remaining 38 of the 39 patients the IBI LF power density increased after NTG (P<0.05). The SAP LF power also tended to increase (P=0.12). The spectral power and BRS estimates are given in Table 4.1. BRS LF gain decreased following the hemodynamic changes induced by NTG, as did the spontaneous BRS calculated in the time domain (Fig. 4.1F). There were no differences in BRS or power spectral density between the patients with a negative vs. positive test outcome in the selected periods. Although the BRS LF gain
4 to 1 min Before GTN
1 to 4 min After GTN p Value
Hemodynamic data SAP (mmHg) 118 ± 12 117 ± 12 n.s.† MAP (mmHg) 87 ± 10 87 ± 10 n.s.† DAP (mmHg) 72 ± 10 75 ± 9 0.001† HR (beats/min) 85 ± 14 95 ± 17 0.001‡ SV (%) 98 ± 6 84 ± 10 0.001‡ CO (%) 99 ± 5 93 ± 8 0.001† SVR (%) 103 ± 8 111 ± 11 0.001‡ Frequency domain analysis SAP LF power (mmHg2)* 18 ± 15 24 ± 21 n.s.‡ IBI LF power (ms2)* 819 ± 673 1095 ± 866 0.05‡ BRS LF gain (ms/mmHg)* 4.9 ± 2.5 3.8 ± 2.4 0.01‡ Coherence* 0.66 ± 0.16 0.65 ± 0.16 n.s. ‡ Time domain analysis BRS (ms/mmHg)* 8.0 ± 3.1 6.1 ± 2.8 0.001‡

—Chapter 4— 51
results were lower compared to the time domain BRS estimates, methods correlated well (Pearson’s R=0.79 with P<0.001).
A
-5 0 5 10 15
MA
P (
mm
Hg)
70
80
90
100
C
Time (min)
-5 0 5 10 15
CO
(%
)
50
75
100
125
B
-5 0 5 10 15
SV
(%
)
50
75
100
125
D
-5 0 5 10 15
SV
R (
%)
75
100
125
150
F
Time (min)
-5 0 5 10 15
BR
S (
ms/
mm
Hg)
0
5
10
15
E
-5 0 5 10 15
HR
(bp
m)
70
80
90
100
110
Figure 4.1 Hemodynamic response to nitroglycerine during the 60º-tilt test. At 0 minutes NTG is administered. A Mean arterial pressure (MAP); B Stoke volume (SV); C Cardiac output (CO); D Systemic vascular resistance (SVR); E Heart rate (HR); F Baroreflex sensitivity (BRS). Circles denote minute averages and S.E.M. Empty circles, negative tilt test, solid circles, positive tilt test.
Computed trends after NTG administration Cardiovascular trends in patients who experienced presyncope and those who did not are shown in Figure 4.1; the tilt-positive patients demonstrated a greater drop in SV, CO and arterial blood pressure. The HR in the period preceding NTG appears higher in the tilt-
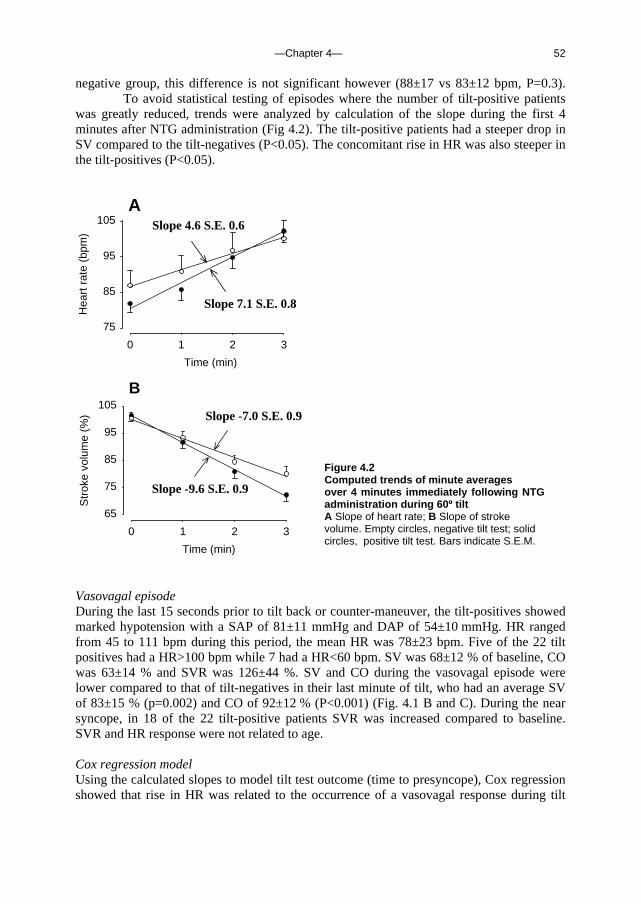
—Chapter 4— 52
negative group, this difference is not significant however (88±17 vs 83±12 bpm, P=0.3). To avoid statistical testing of episodes where the number of tilt-positive patients was greatly reduced, trends were analyzed by calculation of the slope during the first 4 minutes after NTG administration (Fig 4.2). The tilt-positive patients had a steeper drop in SV compared to the tilt-negatives (P<0.05). The concomitant rise in HR was also steeper in the tilt-positives (P<0.05).
A
Time (min)
0 1 2 3
Hea
rt r
ate
(bpm
)
75
85
95
105
B
Time (min)
0 1 2 3
Str
oke
volu
me
(%)
65
75
85
95
105
Slope 4.6 S.E. 0.6
Slope 7.1 S.E. 0.8
Slope -7.0 S.E. 0.9
Slope -9.6 S.E. 0.9
Vasovagal episode During the last 15 seconds prior to tilt back or counter-maneuver, the tilt-positives showed marked hypotension with a SAP of 81±11 mmHg and DAP of 54±10 mmHg. HR ranged from 45 to 111 bpm during this period, the mean HR was 78±23 bpm. Five of the 22 tilt positives had a HR>100 bpm while 7 had a HR<60 bpm. SV was 68±12 % of baseline, CO was 63±14 % and SVR was 126±44 %. SV and CO during the vasovagal episode were lower compared to that of tilt-negatives in their last minute of tilt, who had an average SV of 83±15 % (p=0.002) and CO of 92±12 % (P<0.001) (Fig. 4.1 B and C). During the near syncope, in 18 of the 22 tilt-positive patients SVR was increased compared to baseline. SVR and HR response were not related to age. Cox regression model Using the calculated slopes to model tilt test outcome (time to presyncope), Cox regression showed that rise in HR was related to the occurrence of a vasovagal response during tilt
Figure 4.2 Computed trends of minute averages over 4 minutes immediately following NTG administration during 60º tilt A Slope of heart rate; B Slope of stroke volume. Empty circles, negative tilt test; solid circles, positive tilt test. Bars indicate S.E.M.
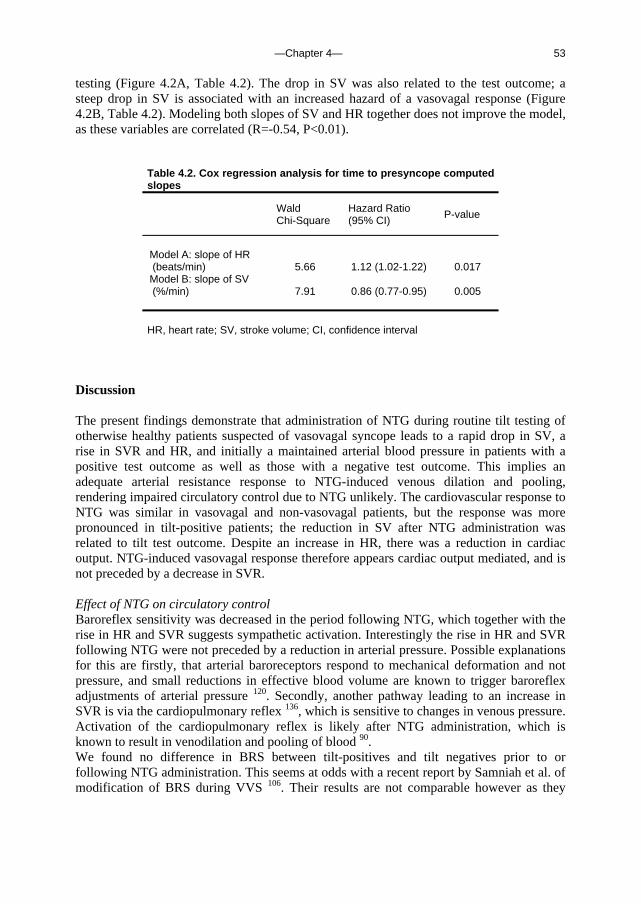
—Chapter 4— 53
testing (Figure 4.2A, Table 4.2). The drop in SV was also related to the test outcome; a steep drop in SV is associated with an increased hazard of a vasovagal response (Figure 4.2B, Table 4.2). Modeling both slopes of SV and HR together does not improve the model, as these variables are correlated (R=-0.54, P<0.01).
Table 4.2. Cox regression analysis for time to presyncope computed slopes
Wald Chi-Square
Hazard Ratio (95% CI) P-value
Model A: slope of HR (beats/min) 5.66 1.12 (1.02-1.22) 0.017 Model B: slope of SV (%/min) 7.91 0.86 (0.77-0.95) 0.005 HR, heart rate; SV, stroke volume; CI, confidence interval
Discussion The present findings demonstrate that administration of NTG during routine tilt testing of otherwise healthy patients suspected of vasovagal syncope leads to a rapid drop in SV, a rise in SVR and HR, and initially a maintained arterial blood pressure in patients with a positive test outcome as well as those with a negative test outcome. This implies an adequate arterial resistance response to NTG-induced venous dilation and pooling, rendering impaired circulatory control due to NTG unlikely. The cardiovascular response to NTG was similar in vasovagal and non-vasovagal patients, but the response was more pronounced in tilt-positive patients; the reduction in SV after NTG administration was related to tilt test outcome. Despite an increase in HR, there was a reduction in cardiac output. NTG-induced vasovagal response therefore appears cardiac output mediated, and is not preceded by a decrease in SVR. Effect of NTG on circulatory control Baroreflex sensitivity was decreased in the period following NTG, which together with the rise in HR and SVR suggests sympathetic activation. Interestingly the rise in HR and SVR following NTG were not preceded by a reduction in arterial pressure. Possible explanations for this are firstly, that arterial baroreceptors respond to mechanical deformation and not pressure, and small reductions in effective blood volume are known to trigger baroreflex adjustments of arterial pressure 120. Secondly, another pathway leading to an increase in SVR is via the cardiopulmonary reflex 136, which is sensitive to changes in venous pressure. Activation of the cardiopulmonary reflex is likely after NTG administration, which is known to result in venodilation and pooling of blood 90. We found no difference in BRS between tilt-positives and tilt negatives prior to or following NTG administration. This seems at odds with a recent report by Samniah et al. of modification of BRS during VVS 106. Their results are not comparable however as they
—Chapter 4— 54
studied the BRS during tilt back immediately following full syncope, whereas we computed BRS in the lead-up to presyncope.
The present findings indicate an increase in SVR after NTG administration in all patients, and a sustained increase in SVR at the onset of presyncope. This seems at odds with previous reports of an early progressive decrease in SVR leading to syncope in healthy young subjects without use of NTG 37. The supine recording is commonly used as control period for expressing SVR as percentage of baseline. In the present study however we explicitly omitted the supine recording as baseline and used the upright tilt recording prior to NTG administration as baseline, to avoid SV estimations during posture change 118. After 20 minutes upright tilt with corresponding cardiovascular adjustments to orthostatic stress, NTG is administered. We have not analyzed the changes in SV, CO and SVR from the supine to the upright tilt position, and we therefore limit our conclusions to the effect of NTG administration during routine tilt testing in otherwise healthy, medication-free patients.
Central effects of NTG Since the discovery that NO is not only a regulator of smooth muscle tone but also a neuromodulator within the central and peripheral nervous system 19; 49, it is likely that the cardiovascular actions of NO are not confined to its direct effects on blood vessels but include effects on the central and peripheral nervous system 133. In humans the effect of NO-donors on cardiovascular autonomic control has been investigated using infusions of sodium nitroprusside (SNP), and the results suggested SNP had no effects on the cardiac/vagal limb of the baroreflex 65. SNP is, however, hydrophilic, and the compound has difficulty crossing membranes. Nitroglycerine on the other hand is lipophilic and the compounds readily enter cells to form NO. Results of animal studies suggest that within the central nervous system there are sites that modulate the cardiovascular effects of NTG and the hypotensive effects of NTG may be modified by central noradrenergic activity controlling the circulation 88. In the present study we demonstrate that baroreflex sensitivity, established using time and frequency domain methods, diminished following sublingual NTG. The increase in DAP and SVR however, together with the increase in HR and IBI LF spectral power, provide strong circumstantial evidence of increased sympathetic outflow 99. We therefore consider sympathico-inhibition due to a central effect of NTG as used during routine clinical tilt testing unlikely. Study limitations The present results were obtained in patients with no cardiovascular or neurological diseases and no medication. The patient group has thus been selected, resulting in a group that is relatively younger and healthier than the total of patients referred for unexplained syncope. Included were only those patients who did not have a vasovagal episode before NTG, thus excluding the most outspoken cases. Vasovagal response was aborted before loss of consciousness set in, and we therefore limited our analysis and our conclusions to the prodromal phase and the onset of vasovagal response. We used a new method of BRS computation (time domain cross-correlations) and an established method (frequency domain cross-spectral calculations). Although these methods correlated well, the frequency domain BRS gain was lower compared to the time domain BRS. Considering that both methods calculated the correlation between spontaneous variations in SAP and IBI, we would ideally expect identical results. However, in the frequency domain method we have made a frequency band selection (the LF band),
—Chapter 4— 55
whereas the time domain method in principle includes all frequencies, which might explain the greater BRS estimates we found using the latter method. Conclusions Our study of otherwise healthy patients suspected of vasovagal syncope demonstrates a rapid decrease in stroke volume and an increase in systemic vascular resistance and heart rate following NTG administration during tilt testing. We found strong indications that sublingual NTG induces an increase in sympathetic outflow, resulting in initially maintained arterial pressure. The NTG-triggered syncopal episode is not preceded by a decrease in SVR, but appears cardiac output mediated. Our finding that the decrease in stroke volume after NTG administration is related to the time to presyncope supports this. Acknowledgements This study was supported by a grant of the Space Research Organization Netherlands (SRON), project MG-052, and a grant of the Netherlands Heart Foundation, project 99.181. We thank Dr D.L. Jardine and Dr J.J. van Lieshout for their review of the manuscript.

—Chapter 4— 56
—Chapter 5— 57
Chapter 5. Orthostatic blood pressure control before and after space flight, determined by time-domain baroreflex method
J. Gisolf, R.V. Immink, J.J. van Lieshout, W.J. Stok and J.M. Karemaker, J Appl Physiol (Revised version accepted for publication)
Orthostatic tachycardia and hypotention after space flight are related to volume depletion and excessive venous pooling. In the following study we investigate whether the postflight orthostatic response can be mimicked preflight, by using venous occlusion thigh cuffs to ‘trap’ venous blood in the lower limbs. We report preflight baseline, preflight venous occlusion and postflight hemodynamics, as well as time- and frequency domain baroreflex sensitivities. Introduction Astronauts returning from spaceflight suffer from varying degrees of orthostatic intolerance 25; 26, and they commonly present with orthostatic tachycardia and hypotension. The cardiovascular adaptations to microgravity leading to post-flight reduced orthostatic tolerance have been studied extensively. The carotid baroreceptor cardiac reflex response (BRS), as established using the neck cuff method to provoke neck pressure changes, is found to be decreased postflight 46. Furthermore standing systemic vascular resistance is reported to be greater in those who could complete a stand test compared to those who could not 25; 47. This does not appear to be due to an impaired sympathoadrenal system by exposure to microgravity, as found by examining the cardiovascular response to plasma catecholamines in human volunteers before and after space flight 130. Results of muscle sympathetic nerve activity recordings during post-spaceflight stand tests also suggest an intact and appropriate sympathetic response 84. Rather than malfunction of the sympathetic response, decreased orthostatic function after spaceflight (or bed-rest deconditioning) has been attributed to excessive reductions in stroke volume 25; 84; 130 possibly due to hypovolemia 98 and increased pooling of blood during standing 24. We therefore set out to determine the blood pressure, heart rate and baroreflex response to standing, before and after space flight, using time- and frequency domain BRS computation. We conducted a preflight stand test with and without venous thigh cuffs to induce venous ‘trapping’ of blood in the lower limbs 4; 87. We hypothesized that if the tachycardia and hypotension after space flight are indeed related central hypovolemia and excessive pooling of blood during orthostatic stress, reductions in central blood volume could mimic post-space flight response to standing.
—Chapter 5— 58
Methods Subjects We studied 5 male cosmonauts who each took part in one of 3 different (10-11 day) Soyuz missions. At preflight data collection, average cosmonaut age was 40 (SD 3) years, height 180 (SD 4) cm and weight 76 (SD 10) kg. Each subject was informed of the experimental procedures and signed an informed consent form. The experimental protocol was approved by the Medical Ethics Committee of the Academic Medical Center, Univ. of Amsterdam (MEC00/069), the ESA Medical Board and the JSC Institutional Review Board. Experimental Design and Protocol Preflight measurements were conducted in a temperature-controlled laboratory (21-23ºC) in the Academic Medical Center in Amsterdam, 3-5 months before launch. Subjects refrained from alcohol and caffeine for at least 5 hours prior to data collection. After answering some preliminary questions regarding caffeine habits (none of the subjects habitually drank more than 3 units of caffeinated beverages per day), subjects were instrumented on a motorized, computer-controlled tilt table in the supine position 51. Pneumatic cuffs (D.E. Hokanson Inc., Issaquah, Washington, U.S.A.) were applied to the upper thighs, kept in place with Velcro and connected to an air compressor (Stratos Model 65 Pressure Regulator, Fairchild, Winston-Salem N.C., U.S.A.) to ensure smooth and rapid inflation. Subjects were instructed to pace their breathing to an audio-stimulus. They learned to prevent hypocapnia by varying the depth of breathing and keeping their end-tidal carbon dioxide partial pressure (PCO2) within a normal range as viewed on an in-house developed feedback leds-bar. A practice head-up tilt (HUT) to 70º and back to supine was carried out and paced breathing was practiced. Preflight The baseline protocol started after at least 15 minutes rest in the supine position. Cuffs were kept deflated throughout the baseline session. To induce variations in blood pressure at several frequencies, in the supine position the breathing was paced first at 10/min, followed by 6/min and finally 15/min. Each breathing frequency was held for a duration of one minute plus two extra breaths and followed by a minute rest (spontaneous breathing). The complete capnogram was displayed on an oscilloscope and visually checked by the experimenters; paced breathing was repeated if necessary. Subjects were then rapidly tilted to 70º; after 5 minutes HUT they were tilted back to supine. After a short break (3-5 min), venous return from the legs was impeded by inflating thigh cuffs to 40 mmHg; cuff pressure was maintained at this level while subjects were supine. Subjects rested for 4 minutes before repeating the paced breathing protocol. They were then tilted to 70º HUT within one second 51 and simultaneously thigh cuff pressure was increased to 100 mmHg, to compensate for the hydrostatic pressure increase during tilt. After 5 minutes in the HUT position they were tilted back to supine; simultaneously thigh cuffs were deflated completely.
Postflight Within 3 days of landing, a post-spaceflight protocol was conduced in the Gagarin Cosmonaut Training Center in Russia. Subjects refrained from alcoholic or caffeinated beverages starting at least 5 hours prior to measurements. The sessions took place at an ambient room temperature; a bed was used instead of a tilt table. The protocol was largely similar to preflight baseline (a supine rest period of at least 10 minutes followed by paced breathing at 10, 6 and 15 /min as described previously); however, the supine measurements were followed by 5 minutes active standing rather than passive HUT; furthermore in 3 of the 5 sessions the subject was seated for 3-5 minutes

—Chapter 5— 59
following supine recording and prior to standing up. PCO2 was not monitored but the cosmonauts were carefully instructed to avoid hyperventilation and the experimenter visually checked respiratory excursions during paced breathing.
Immediately postflight One of the cosmonauts performed a 10-minute stand test in the medical tent at the landing site, within hours after landing. The crew surgeon conducted non-invasive finger blood pressure measurements using Portapres M2. Measurements and Data Processing Arterial blood pressure was continuously measured by a servo-controlled photophletysmograph (Preflight: Finapres, Model 5; Postflight: Portapres, Model 2; Netherlands Organization for Applied Scientific Research, Biomedical Instrumentation, TNO-BMI, Amsterdam, the Netherlands) placed on the midphalanx of the middle finger of the right hand 69, which was positioned at heart level and held in place using an arm-sling. The finger cuff pressure was used to track arterial blood pressure. Preflight, expiratory carbon dioxide was sampled continuously and measured using a capnometer (Hewlett Packard). Finger blood pressure was digitised at 100 Hz. Mean arterial blood pressure (MBP) was the true integral of the arterial pressure wave over 1 beat divided by the corresponding beat interval. Heart rate (HR) was computed as the inverse of the inter-beat interval (IBI) and expressed in beats per minute. For preflight baseline, preflight thigh cuffs and postflight sessions, minute averages of hemodynamic variables were calculated, starting 10 minutes prior to tilt/standing. For frequency analysis, beat-to-beat systolic blood pressure (SBP) and IBI time series were detrended and Hanning Windowed. Power spectral density and cross-spectra of SBP and IBI were computed using discrete Fourier Transform 38. Spectra of paced breathing recordings were computed per breathing frequency; spectral density and cross-spectral gain, phase and coherence were computed at the appropriate (respiratory) frequency band. Of the HUT/standing recording, 4 minutes were analysed (omitting data from the first minute in the upright position). Spontaneous spectra were computed in the low-frequency (LF) and high frequency (HF) band, ranging from 0.06-0.15 and 0.15 to 0.5 Hz, respectively. For time-domain analysis of spontaneous baroreflex sensitivity (XBRS) we used the cross-correlation method PRVXBRS 129. The SBP and IBI time series were spline interpolated and resampled at 1 Hz. In 10 s windows, the correlation and regression slopes between SBP and IBI were computed. Delays of 0 to 5 s increments in IBI were computed, and the delay with the highest positive coefficient of correlation was selected; the optimal delay (Tau) was stored. The slope between SBP and IBI was recorded as a XBRS estimate if the correlation was significant at P=0.01. In figures 5.1 and 5.3, individual XBRS estimates are shown as well as clusters; clusters of estimates not more than 1.5 s apart were averaged and timed at the cluster mid-position, thus indicating joint events 129. Statistical Analysis Data are given as mean (SD) unless stated otherwise. Hemodynamic measurements, spectral indices and XBRS results were averaged per body position and per paced breathing frequency where appropriate and analysed across conditions as well as across frequency regions, using the Friedman test (equivalent to a two-way ANOVA on ranks) or Wilcoxon Signed Rank test where appropriate. Differences between preflight baseline and postflight conditions were tested using paired T-Test. Differences in Tau (optimal delay, output of PRVXBRS) between conditions were tested using the Chi Square test. Agreement between
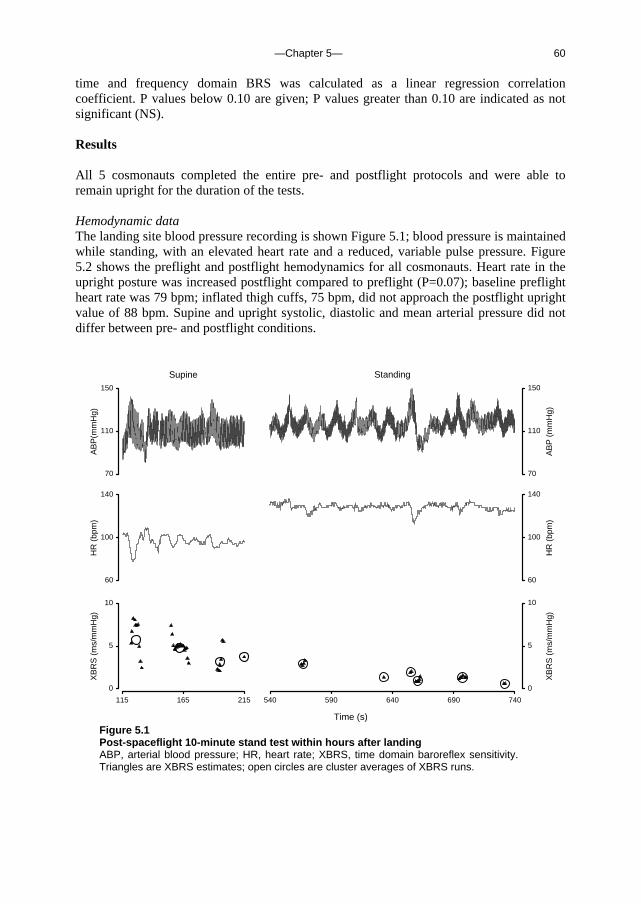
—Chapter 5— 60
time and frequency domain BRS was calculated as a linear regression correlation coefficient. P values below 0.10 are given; P values greater than 0.10 are indicated as not significant (NS). Results All 5 cosmonauts completed the entire pre- and postflight protocols and were able to remain upright for the duration of the tests. Hemodynamic data The landing site blood pressure recording is shown Figure 5.1; blood pressure is maintained while standing, with an elevated heart rate and a reduced, variable pulse pressure. Figure 5.2 shows the preflight and postflight hemodynamics for all cosmonauts. Heart rate in the upright posture was increased postflight compared to preflight (P=0.07); baseline preflight heart rate was 79 bpm; inflated thigh cuffs, 75 bpm, did not approach the postflight upright value of 88 bpm. Supine and upright systolic, diastolic and mean arterial pressure did not differ between pre- and postflight conditions.
540 590 640 690 740
XB
RS
(m
s/m
mH
g)
0
5
10
HR
(bp
m)
60
100
140
Time (s)
115 165 215
XB
RS
(m
s/m
mH
g)
0
5
10
HR
(bp
m)
60
100
140
Standing
AB
P (
mm
Hg)
70
110
150
Supine
AB
P(m
mH
g)
70
110
150
Figure 5.1 Post-spaceflight 10-minute stand test within hours after landing ABP, arterial blood pressure; HR, heart rate; XBRS, time domain baroreflex sensitivity. Triangles are XBRS estimates; open circles are cluster averages of XBRS runs.
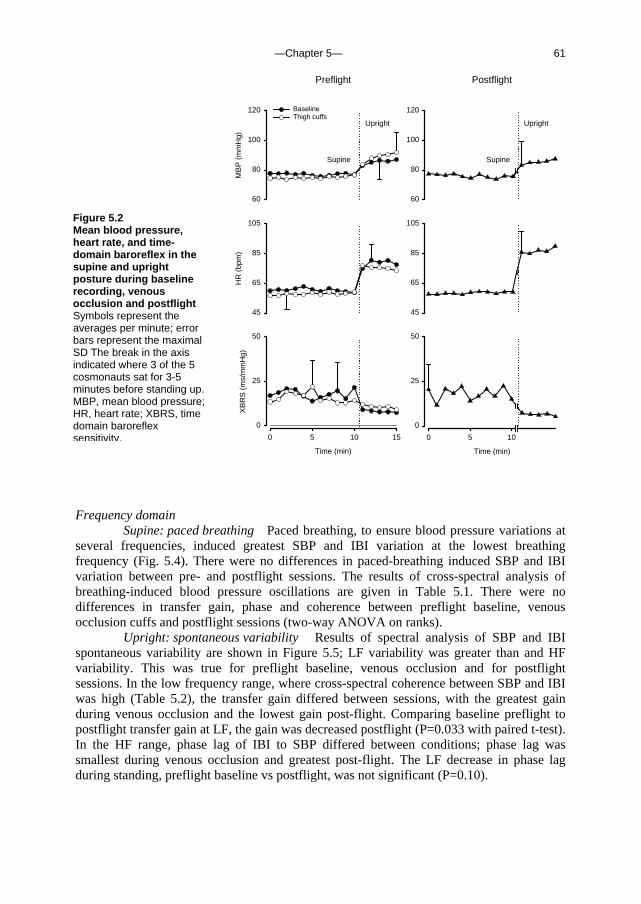
—Chapter 5— 61
Time (min)
0 5 10
0
25
50
Postflight
60
80
100
120
45
65
85
105
Preflight
MB
P (
mm
Hg)
60
80
100
120
HR
(bp
m)
45
65
85
105
Time (min)
0 5 10 15
XB
RS
(m
s/m
mH
g)
0
25
50
BaselineThigh cuffs
Upright
Supine Supine
Upright
Frequency domain
Supine: paced breathing Paced breathing, to ensure blood pressure variations at several frequencies, induced greatest SBP and IBI variation at the lowest breathing frequency (Fig. 5.4). There were no differences in paced-breathing induced SBP and IBI variation between pre- and postflight sessions. The results of cross-spectral analysis of breathing-induced blood pressure oscillations are given in Table 5.1. There were no differences in transfer gain, phase and coherence between preflight baseline, venous occlusion cuffs and postflight sessions (two-way ANOVA on ranks).
Upright: spontaneous variability Results of spectral analysis of SBP and IBI spontaneous variability are shown in Figure 5.5; LF variability was greater than and HF variability. This was true for preflight baseline, venous occlusion and for postflight sessions. In the low frequency range, where cross-spectral coherence between SBP and IBI was high (Table 5.2), the transfer gain differed between sessions, with the greatest gain during venous occlusion and the lowest gain post-flight. Comparing baseline preflight to postflight transfer gain at LF, the gain was decreased postflight (P=0.033 with paired t-test). In the HF range, phase lag of IBI to SBP differed between conditions; phase lag was smallest during venous occlusion and greatest post-flight. The LF decrease in phase lag during standing, preflight baseline vs postflight, was not significant (P=0.10).
Figure 5.2 Mean blood pressure, heart rate, and time-domain baroreflex in the supine and upright posture during baseline recording, venous occlusion and postflight Symbols represent the averages per minute; error bars represent the maximal SD The break in the axis indicated where 3 of the 5 cosmonauts sat for 3-5 minutes before standing up. MBP, mean blood pressure; HR, heart rate; XBRS, time domain baroreflex sensitivity.
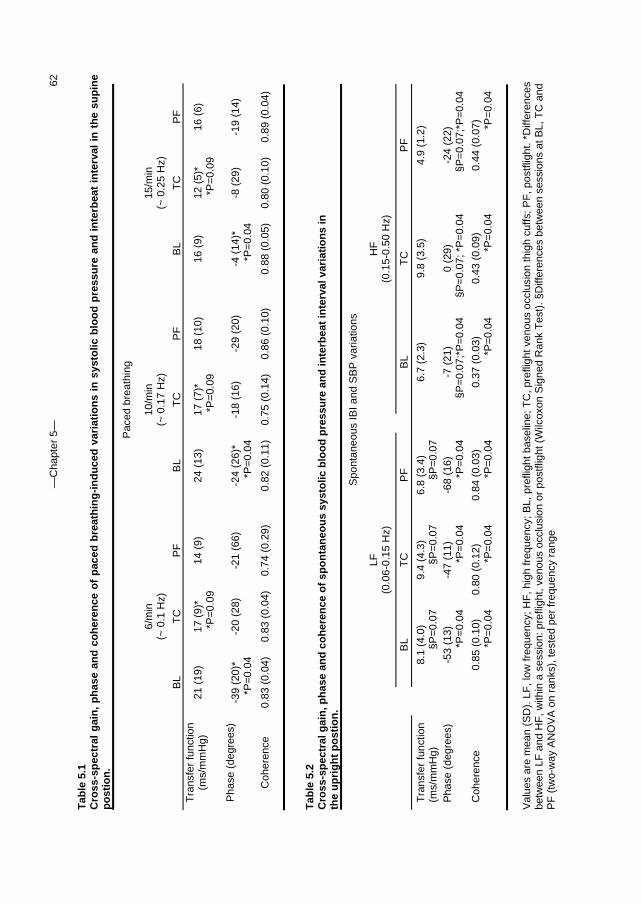
—C
hapt
er 5
—
62
Tab
le 5
.1
Cro
ss-s
pec
tral
gai
n,
ph
ase
and
co
her
ence
of
pac
ed b
reat
hin
g-i
nd
uce
d v
aria
tio
ns
in s
ysto
lic b
loo
d p
ress
ure
an
d i
nte
rbea
t in
terv
al i
n t
he
sup
ine
po
stio
n.
P
aced
bre
athi
ng
6/m
in
(~ 0
.1 H
z)
10/m
in
(~ 0
.17
Hz)
15/m
in
(~ 0
.25
Hz)
B
L T
C
PF
BL
TC
P
F
B
L T
C
PF
T
rans
fer
func
tion
(ms/
mm
Hg)
21
(19
)
17 (
9)*
*P=
0.09
14
(9)
24
(13
)
17
(7)
* *P
=0.
09
18 (
10)
16
(9)
12 (
5)*
*P=
0.09
16
(6)
Pha
se (
degr
ees)
-3
9 (2
0)*
*P=
0.04
-2
0 (2
8)
-2
1 (6
6)
-2
4 (2
6)*
*P=
0.04
-1
8 (1
6)
-2
9 (2
0)
-4
(14
)*
*P=
0.04
-8
(29
)
-19
(14)
Coh
eren
ce
0.83
(0.
04)
0.
83 (
0.04
)
0.74
(0.
29)
0.82
(0.
11)
0.
75 (
0.14
)
0.86
(0.
10)
0.88
(0.
05)
0.
80 (
0.10
)
0.89
(0.
04)
Tab
le 5
.2
Cro
ss-s
pec
tral
gai
n, p
has
e an
d c
oh
eren
ce o
f sp
on
tan
eou
s sy
sto
lic b
loo
d p
ress
ure
an
d in
terb
eat
inte
rval
var
iati
on
s in
th
e u
pri
gh
t p
ost
ion
.
Spo
ntan
eous
IBI a
nd S
BP
var
iatio
ns
LF
(0.0
6-0.
15 H
z)
HF
(0
.15-
0.50
Hz)
BL
TC
P
F
B
L T
C
PF
Tra
nsfe
r fu
nctio
n (m
s/m
mH
g)
8.
1 (4
.0)
§P=
0.07
9.
4 (4
.3)
§P=
0.07
6.
8 (3
.4)
§P=
0.07
6.7
(2.3
)
9.8
(3.5
)
4.9
(1.2
)
Pha
se (
degr
ees)
-53
(13)
*P
=0.
04
-47
(11)
*P
=0.
04
-68
(16)
*P
=0.
04
-7
(21
) §P
=0.
07;*
P=
0.04
0
(29)
§P=
0.07
; *P
=0.
04
-24
(22)
§P=
0.07
;*P
=0.
04
Coh
eren
ce
0.
85 (
0.10
) *P
=0.
04
0.80
(0.
12)
*P=
0.04
0.
84 (
0.03
) *P
=0.
04
0.
37 (
0.03
) *P
=0.
04
0.43
(0.
09)
*P=
0.04
0.
44 (
0.07
) *P
=0.
04
V
alue
s ar
e m
ean
(SD
). L
F, l
ow fr
eque
ncy;
HF
, hig
h fr
eque
ncy;
BL,
pre
fligh
t bas
elin
e; T
C, p
refli
ght v
enou
s oc
clus
ion
thig
h cu
ffs; P
F, p
ostfl
ight
. *D
iffer
ence
s be
twee
n LF
and
HF
, with
in a
ses
sion
: pre
fligh
t, ve
nous
occ
lusi
on o
r po
stfli
ght (
Wilc
oxon
Sig
ned
Ran
k T
est)
. §D
iffer
ence
s be
twee
n se
ssio
ns a
t BL,
TC
and
P
F (
two-
way
AN
OV
A o
n ra
nks)
, tes
ted
per
freq
uenc
y ra
nge
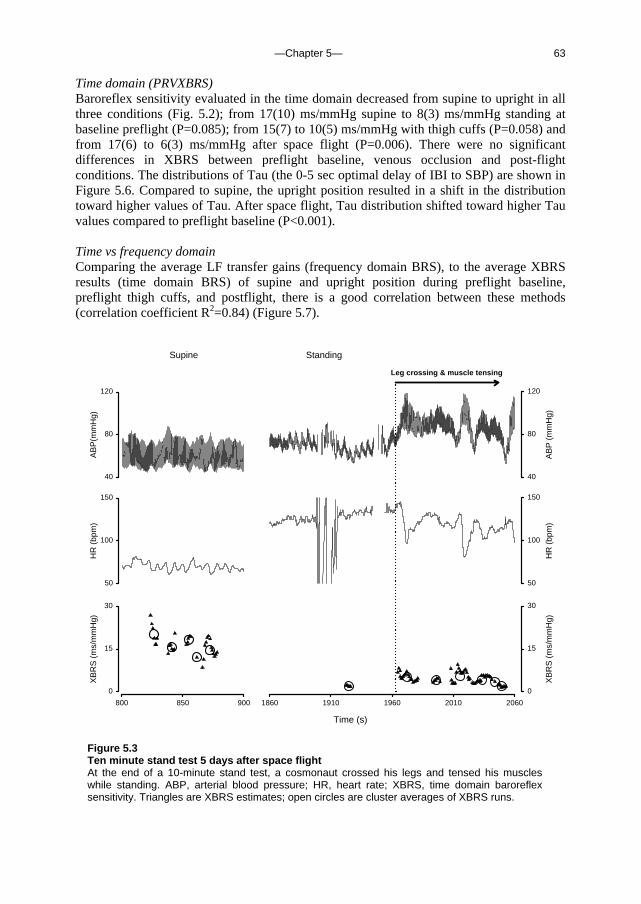
—Chapter 5— 63
Time domain (PRVXBRS) Baroreflex sensitivity evaluated in the time domain decreased from supine to upright in all three conditions (Fig. 5.2); from 17(10) ms/mmHg supine to 8(3) ms/mmHg standing at baseline preflight (P=0.085); from 15(7) to 10(5) ms/mmHg with thigh cuffs (P=0.058) and from 17(6) to 6(3) ms/mmHg after space flight (P=0.006). There were no significant differences in XBRS between preflight baseline, venous occlusion and post-flight conditions. The distributions of Tau (the 0-5 sec optimal delay of IBI to SBP) are shown in Figure 5.6. Compared to supine, the upright position resulted in a shift in the distribution toward higher values of Tau. After space flight, Tau distribution shifted toward higher Tau values compared to preflight baseline (P<0.001). Time vs frequency domain Comparing the average LF transfer gains (frequency domain BRS), to the average XBRS results (time domain BRS) of supine and upright position during preflight baseline, preflight thigh cuffs, and postflight, there is a good correlation between these methods (correlation coefficient R2=0.84) (Figure 5.7).
1860 1910 1960 2010 2060
XB
RS
(m
s/m
mH
g)
0
15
30
HR
(bp
m)
50
100
150
Time (s)
800 850 900
XB
RS
(m
s/m
mH
g)
0
15
30
HR
(bp
m)
50
100
150
Standing
AB
P (
mm
Hg)
40
80
120
Supine
AB
P(m
mH
g)
40
80
120
Leg crossing & muscle tensing
Figure 5.3 Ten minute stand test 5 days after space flight At the end of a 10-minute stand test, a cosmonaut crossed his legs and tensed his muscles while standing. ABP, arterial blood pressure; HR, heart rate; XBRS, time domain baroreflex sensitivity. Triangles are XBRS estimates; open circles are cluster averages of XBRS runs.

—Chapter 5— 64
Additional stand test with leg crossing The end of an additional 10 minute stand test of one cosmonaut 5 days after landing is shown in Figure 5.3; at the end of the stand test he crossed his legs and tensed leg muscles while still standing. Finger blood pressure was low in supine position, while brachial pressure (Omron automatic digital blood pressure monitor HEM-705CP) was 120/68 mmHg and HR was 63 bpm. Immediately after standing up the brachial blood pressure was 105/75, HR was 106 bpm. At the end of the 10-minute stand test, pulse pressure was reduced (Fig 5.3), but prodromal symptoms were not reported. While still standing, the cosmonaut crossed his legs and tensed his leg muscles; this was followed by a rapid recovery of pulse pressure and a decrease in HR.
LF HF
SB
P v
aria
blity
, mm
Hg2
0
20
40
60
Frequency range
LF HF
IBI v
aria
blity
x10
3 (m
s2 )
0
2
4
6
8
Preflight baselinePreflight thigh cuffsPostflight
P=0.04**
*P=0.04
P=0.04
P=0.04**
*P=0.04
P=0.04
Breathing frequency
6/min 10/min 15/min
IBI v
aria
blity
x10
3 (m
s2 )
0
2
4
6
8
6/min 10/min 15/min
SB
P v
aria
blity
, mm
Hg2
0
20
40
60
**
P=0.09 *P=0.007
P=0.015
**
P=0.015P=0.015
Figure 5.4 (Left) Frequency analysis results of paced breathing in the supine position, before and after spaceflight Figure 5.5 (Right) Frequency analysis results of spontaneous blood pressure and beat interval variability in the upright position, before and after space flight Systolic blood pressure (SBP) and inter-beat interval (IBI) variability are computed per breathing frequency.(Fig. 5.4, left) or between set frequency ranges (Fig. 5.5, right). P-values of differences between breathing frequencies are given when below 0.10. There are no significant differences across the conditions: baseline, thigh cuffs and postflight. N=5. LF = low frequency; HF = high frequency

—Chapter 5— 65
Tau (s)
0 1 2 3 4 5
Tau
dis
trib
utio
n (%
)
0
20
40
60
80
Tau (s)
0 1 2 3 4 5
Tau
dis
trib
utio
n (%
)
0
20
40
60
80
Preflight baselinePreflight thigh cuffsPostflight
A
B
Supine
Standing
XBRS (ms/mmHg)
0 10 20 30
LF c
ross
-spe
ctra
l gai
n (m
s/m
mH
g)
0
10
20
30
R2 = 0.84
Figure 5.6 Preflight and post-spaceflight distributions of Tau Time-domain baroreflex program PRVXBRS computes the correlation between beat-to-beat SBP and IBI, resampled at 1 Hz, in a sliding 10 s window. Delays of 0-5 s between SBP and IBI are computed; the delay (Tau) with the greatest positive correlation is selected when significant at the P=0.01 level. A: supine; and B: upright position.
Figure 5.7 Correlation between time and frequency domain BRS Linear regression and correlation between average LF (0.06-0.15 Hz) transfer gains (frequency domain BRS) and average XBRS results (time domain BRS) of supine (breathing at 0.1 Hz) and upright position during preflight baseline, preflight thigh cuffs, and postflight. BRS, baroreflex sensitivity; LF, low frequency. Error bars represent S.E.
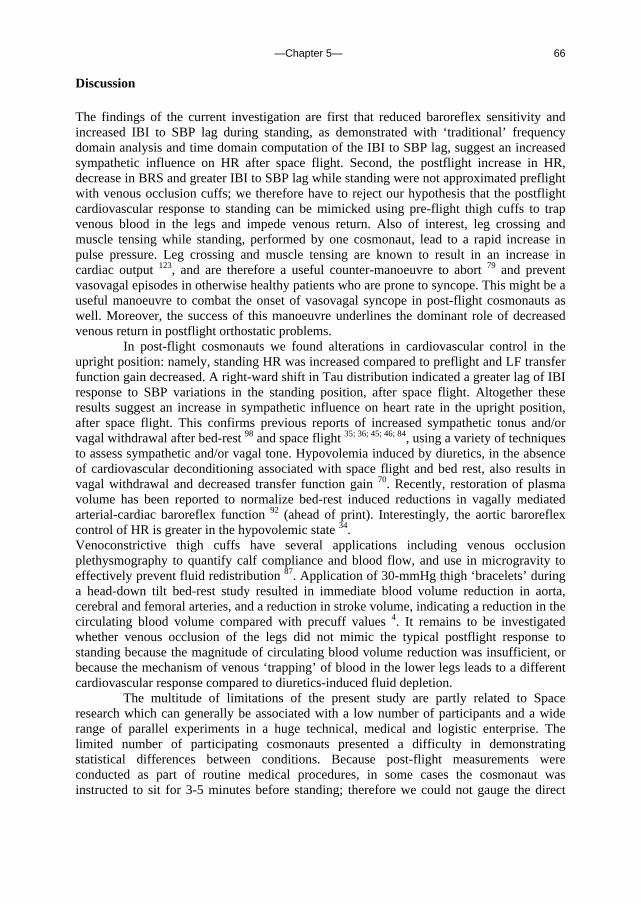
—Chapter 5— 66
Discussion The findings of the current investigation are first that reduced baroreflex sensitivity and increased IBI to SBP lag during standing, as demonstrated with ‘traditional’ frequency domain analysis and time domain computation of the IBI to SBP lag, suggest an increased sympathetic influence on HR after space flight. Second, the postflight increase in HR, decrease in BRS and greater IBI to SBP lag while standing were not approximated preflight with venous occlusion cuffs; we therefore have to reject our hypothesis that the postflight cardiovascular response to standing can be mimicked using pre-flight thigh cuffs to trap venous blood in the legs and impede venous return. Also of interest, leg crossing and muscle tensing while standing, performed by one cosmonaut, lead to a rapid increase in pulse pressure. Leg crossing and muscle tensing are known to result in an increase in cardiac output 123, and are therefore a useful counter-manoeuvre to abort 79 and prevent vasovagal episodes in otherwise healthy patients who are prone to syncope. This might be a useful manoeuvre to combat the onset of vasovagal syncope in post-flight cosmonauts as well. Moreover, the success of this manoeuvre underlines the dominant role of decreased venous return in postflight orthostatic problems.
In post-flight cosmonauts we found alterations in cardiovascular control in the upright position: namely, standing HR was increased compared to preflight and LF transfer function gain decreased. A right-ward shift in Tau distribution indicated a greater lag of IBI response to SBP variations in the standing position, after space flight. Altogether these results suggest an increase in sympathetic influence on heart rate in the upright position, after space flight. This confirms previous reports of increased sympathetic tonus and/or vagal withdrawal after bed-rest 98 and space flight 35; 36; 45; 46; 84, using a variety of techniques to assess sympathetic and/or vagal tone. Hypovolemia induced by diuretics, in the absence of cardiovascular deconditioning associated with space flight and bed rest, also results in vagal withdrawal and decreased transfer function gain 70. Recently, restoration of plasma volume has been reported to normalize bed-rest induced reductions in vagally mediated arterial-cardiac baroreflex function 92 (ahead of print). Interestingly, the aortic baroreflex control of HR is greater in the hypovolemic state 34. Venoconstrictive thigh cuffs have several applications including venous occlusion plethysmography to quantify calf compliance and blood flow, and use in microgravity to effectively prevent fluid redistribution 87. Application of 30-mmHg thigh ‘bracelets’ during a head-down tilt bed-rest study resulted in immediate blood volume reduction in aorta, cerebral and femoral arteries, and a reduction in stroke volume, indicating a reduction in the circulating blood volume compared with precuff values 4. It remains to be investigated whether venous occlusion of the legs did not mimic the typical postflight response to standing because the magnitude of circulating blood volume reduction was insufficient, or because the mechanism of venous ‘trapping’ of blood in the lower legs leads to a different cardiovascular response compared to diuretics-induced fluid depletion.
The multitude of limitations of the present study are partly related to Space research which can generally be associated with a low number of participants and a wide range of parallel experiments in a huge technical, medical and logistic enterprise. The limited number of participating cosmonauts presented a difficulty in demonstrating statistical differences between conditions. Because post-flight measurements were conducted as part of routine medical procedures, in some cases the cosmonaut was instructed to sit for 3-5 minutes before standing; therefore we could not gauge the direct
—Chapter 5— 67
transition from supine to standing. Orthostatic stress was induced preflight using a tilt table, postflight by active standing. Finally, sympathetic tone was assessed indirectly in this study from HR and blood pressure measurements, analysed in the frequency and time-domain, rather than more direct methods such as muscle sympathetic nerve activity recordings. In conclusion, the present study demonstrates that time-domain BRS computation provides a high time-resolution indication of baroreflex response to standing after space flight; distribution of Tau is a novel way of expressing IBI to SBP lag as an indication of sympathetic tone similar to the phase lag in frequency analysis. Time and frequency analysis of post-spaceflight sessions suggest increased sympathetic tone during standing. Thigh cuffs, applied to reduce venous return in preflight cosmonauts, did not predict post-spaceflight cardiovascular response to standing. Leg crossing and muscle tensing performed by one post-flight cosmonaut while standing, rapidly restored a reduced pulse pressure. This could prove a useful counter manoeuvre to combat orthostatic intolerance after space flight. Acknowledgements We wish to thank the cosmonauts who participated in this study; the European and Russian crew surgeons for their helpfulness and co-operation; the Russian Institute for Biomedical Problems and the European Space Agency for making this project possible. In particular we wish to thank Marine LeGouic and Mark Mouret for their efforts in the organisation and logistics.

—Chapter 5— 68
—Reference List— 69
Chapter 6. Reference List
1. Aerts A, Dendale P, Strobel G, Block P: Sublingual nitrates during head-up tilt
testing for the diagnosis of vasovagal syncope. Am Heart J 1997;133:504-507
2. Akkerman, EM: Dynamics of blood pressure regulation under influence of gravity, a mathematical model, a fast tilt table, and experiments. PhD thesis, 1991. University of Amsterdam.
3. Anthonisen NR, Milic-Emili J: Distribution of pulmonary perfusion in erect man. J Appl Physiol 1966;21:760-766
4. Arbeille P, Herault S, Fomina G, Roumy J, Alferova I, Gharib C: Influences of thigh cuffs on the cardiovascular system during 7-day head-down bed rest. J Appl Physiol 1999;87:2168-76
5. Avasthey P: Venous pressure changes during orthostasis. Cardiovasc Res 1972;6:657-63
6. Badeer HS, Hicks JW: Hemodynamics of vascular 'waterfall': is the analogy justified? Respir Physiol 1992;87:205-17
7. Barach JH, Marks WL: Effect of change of posture -without active muscular exertion- on the arterial and venous pressures. Arch Int Med 1913;11:485-494
8. Batson OV: The function of the vertebral veins and their role in the spread of metastases. Ann Surg 1940;112:138-149
9. Batson OV: Anatomical problems concerned in the study of cerebral blood flow. Fed Proc 1944;3:139-144
10. Benditt DG, Ferguson DW, Grubb BP, Kapoor WN, Kugler J, Lerman BB, Maloney JD, Raviele A, Ross B, Sutton R, Wolk MJ, Wood DL: Tilt table testing for assessing syncope. American College of Cardiology. J Am Coll Cardiol 1996;28:263-75
—Reference List— 70
11. Benditt DG, Remole S, Bailin S, Dunnigan A, Asso A, Milstein S: Tilt table testing for evaluation of neurally-mediated (cardioneurogenic) syncope: rationale and proposed protocols. Pacing Clin Electrophysiol 1991;14:1528-1537
12. Bernardi L, Valenti C, Wdowczyck-Szulc J, Frey AW, Rinaldi M, Spadacini G, Passino C, Martinelli L, Vigano M, Finardi G: Influence of type of surgery on the occurrence of parasympathetic reinnervation after cardiac transplantation. Circulation 1998;97:1368-74
13. Bertinieri G, Di Rienzo M, Cavallazzi A, Ferrari AU, Pedotti A, Mancia G: Evaluation of baroreceptor reflex by blood pressure monitoring in unanesthetized cats. Am J Physiol 1988;254:H377-83
14. Birch AA, Dirnhuber MJ, Hartley-Davies R, Iannotti F, Neil-Dwyer G: Assessment of autoregulation by means of periodic changes in blood pressure. Stroke 1995;26:834-837
15. Bjurstedt H, Hesser CM, Liljestrand G, Matell G: Effects of Posture on Alveolar-Arterial CO2 and O2 Differences and on Alveolar Dead Space in Man. Acta Physiol Scand 1962;54:65-82
16. Blumenthal SR, Voorhees WD: The relationship between airway carbon dioxide excretion and cardiac output during cardiopulmonary resuscitation. Resuscitation 1997;34:263-270
17. Borst C, Karemaker JM: Time delays in the human baroreceptor reflex. J Auton Nerv Syst 1983;9:399-409
18. Braakman R, Sipkema P, Westerhof N: A dynamic nonlinear lumped parameter model for skeletal muscle circulation. Ann Biomed Eng 1989;17:593-616
19. Bredt DS, Hwang PM, Snyder SH: Localization of nitric oxide synthase indicating a neural role for nitric oxide. Nature 1990;347:768-770
20. Brien JF, McLaughlin BE, Kobus SM, Kawamoto JH, Nakatsu K, Marks GS: Mechanism of glyceryl trinitrate-induced vasodilation. I. Relationship between drug biotransformation, tissue cyclic GMP elevation and relaxation of rabbit aorta. J Pharmacol Exp Ther 1988;244:322-327
21. Brignole M, Alboni P, Benditt D, Bergfeldt L, Blanc JJ, Bloch TP, van Dijk JG, Fitzpatrick A, Hohnloser S, Janousek J, Kapoor W, Kenny RA, Kulakowski P, Moya A, Raviele A, Sutton R, Theodorakis G, Wieling W: Guidelines on
—Reference List— 71
management (diagnosis and treatment) of syncope. Eur Heart J 2001;22:1256-1306
22. Brignole M, Menozzi C, Gianfranchi L, Oddone D, Lolli G, Bertulla A: Carotid sinus massage, eyeball compression, and head-up tilt test in patients with syncope of uncertain origin and in healthy control subjects. Am Heart J 1991;122:1644-1651
23. Bryan AC, Milic-Emili J, Pengelly D: Effect of gravity on the distribution of pulmonary ventilation. J Appl Physiol 1966;21:778-784
24. Buckey JC, Lane LD, Plath G, Gaffney FA, Baisch F, Blomqvist CG: Effects of head-down tilt for 10 days on the compliance of the leg. Acta Physiol Scand Suppl 1992;604:53-9
25. Buckey JCJ, Lane LD, Levine BD, Watenpaugh DE, Wright SJ, Moore WE, Gaffney FA, Blomqvist CG: Orthostatic intolerance after spaceflight. J Appl Physiol 1996;81:7-18
26. Bungo MW, Johnson PCJ: Cardiovascular examinations and observations of deconditioning during the space shuttle orbital flight test program. Aviat Space Environ Med 1983;54:1001-1004
27. Burton AC: Physiology and Biophysics of the Circulation. 2nd Ed. Chicago, Year Book Medical Publishers, 1972,
28. Castiglioni P, Parati G, Omboni S, Mancia G, Imholz BP, Wesseling KH, Di Rienzo M: Broad-band spectral analysis of 24 h continuous finger blood pressure: comparison with intra-arterial recordings. Clin Sci (Lond) 1999;97:129-39
29. Cencetti S, Bandinelli G, Lagi A: Effect of PCO2 changes induced by head-upright tilt on transcranial Doppler recordings. Stroke 1997;28:1195-1197
30. Chaynes P, Verdie JC, Moscovici J, Zadeh J, Vaysse P, Becue J: Microsurgical anatomy of the internal vertebral venous plexuses. Surg Radiol Anat 1998;20:47-51
31. Chou CH, Chao AC, Hu HH: Ultrasonographic evaluation of vertebral venous valves. Am J Neuroradiol 2002;23:1418-20
32. Cirovic S, Walsh C, Fraser WD, Gulino A: The effect of posture and positive

—Reference List— 72
pressure breathing on the hemodynamics of the internal jugular vein. Aviat Space Environ Med 2003;74:125-31
33. Conroy GC, Vannier MW, Tobias PV: Endocranial features of Australopithecus africanus revealed by 2- and 3-D computed tomography. Science 1990;247:838-41
34. Convertino VA, Baumgartner N: Effects of hypovolemia on aortic baroreflex control of heart rate in humans. Aviat Space Environ Med 1997;68:838-843
35. Cooke WH, Ames JEI, Crossman AA, Cox JF, Kuusela TA, Tahvanainen KU, Moon LB, Drescher J, Baisch FJ, Mano T, Levine BD, Blomqvist CG, Eckberg DL: Nine months in space: effects on human autonomic cardiovascular regulation. J Appl Physiol 2000;89:1039-1045
36. Dawson EA, Secher NH, Dalsgaard MK, Ogoh S, Yoshiga CC, Gonzalez-Alonso J, Steensberg A, Raven PB: Standing up to the challenge of standing: a siphon does not support cerebral blood flow in humans. Am J Physiol Regul Integr Comp Physiol 2004;287:R911-4
37. de Jong-de Vos van Steenwijk CC, Wieling W, Johannes JM, Harms MP, Kuis W, Wesseling KH: Incidence and hemodynamic characteristics of near-fainting in healthy 6- to 16-year old subjects. J Am Coll Cardiol 1995;25:1615-21
38. de Boer RW, Karemaker JM, Strackee J: Hemodynamic fluctuations and baroreflex sensitivity in humans: a beat-to-beat model. Am J Physiol 1987;253:H680-H689
39. di Rienzo M, Bertinieri G, Mancia G, Perdotti A: A new method for evaluating the baroreflex role by a joint pattern analysis of pulse interval and systolic blood pressure series. Med Biol Eng Comput 1985;23 :313-314
40. Doepp F, Schreiber SJ, Von Munster T, Rademacher J, Klingebiel R, Valdueza JM: How does the blood leave the brain? A systematic ultrasound analysis of cerebral venous drainage patterns. Neuroradiology 2004;46:565-70
41. Eckberg DL: The human respiratory gate. J Physiol 2003;548:339-52
42. Eckberg DL, Abboud FM, Mark AL: Modulation of carotid baroreflex responsiveness in man: effects of posture and propranolol. J Appl Physiol 1976;41:383-7

—Reference List— 73
43. Edwards MR, Shoemaker JK, Hughson RL: Dynamic modulation of cerebrovascular resistance as an index of autoregulation under tilt and controlled PET(CO(2)). Am J Physiol Regul Integr Comp Physiol 2002;283:R653-R662
44. Epstein HM, Linde HW, Crampton AR, Ciric IS, Eckenhoff JE: The vertebral venous plexus as a major cerebral venous outflow tract. Anesthesiology 1970;32:332-7
45. Fritsch JM, Charles JB, Bennett BS, Jones MM, Eckberg DL: Short-duration spaceflight impairs human carotid baroreceptor-cardiac reflex responses. J Appl Physiol 1992;73:664-671
46. Fritsch-Yelle JM, Charles JB, Jones MM, Beightol LA, Eckberg DL: Spaceflight alters autonomic regulation of arterial pressure in humans. J Appl Physiol 1994;77:1776-1783
47. Fritsch-Yelle JM, Whitson PA, Bondar RL, Brown TE: Subnormal norepinephrine release relates to presyncope in astronauts after spaceflight. J Appl Physiol 1996;81:2134-2141
48. Gabrielsen A, Videbaek R, Schou M, Damgaard M, Kastrup J, Norsk P: Non-invasive measurement of cardiac output in heart failure patients using a new foreign gas rebreathing technique. Clin Sci (Lond) 2002;102:247-252
49. Garthwaite J, Charles SL, Chess-Williams R: Endothelium-derived relaxing factor release on activation of NMDA receptors suggests role as intercellular messenger in the brain. Nature 1988;336:385-388
50. Gerritsen J, TenVoorde BJ, Dekker JM, Kostense PJ, Bouter LM, Heethaar RM: Baroreflex sensitivity in the elderly: influence of age, breathing and spectral methods. Clin Sci (Lond) 2000;99:371-81
51. Gisolf J, Akkerman EM, Schreurs AW, Strackee J, Stok WJ, Karemaker JM: Tilt table design for rapid and sinusoidal posture change with minimal vestibular stimulation. Aviat Space Environ Med 2004;75:1086-91
52. Gisolf J, van Lieshout JJ, van Heusden K, Pott F, Stok WJ, Karemaker JM: Human cerebral venous outflow pathway depends on posture and central venous pressure. J Physiol 2004;560:317-27
53. Goedhard WJA, Wesseling KH, Settels JJ: Baroreflex pressure control responding to orthostasis changes with age, in Orlebeke JF, Mulder G, van Doornen LJP
—Reference List— 74
(eds): Psychophysiology of Cardiovascular Control. New York, Plenum, 1985, pp 191-202
54. Hamming RW: Digital Filters. New York, Prentice-Hall, 1977,
55. Hargens AR, Millard RW, Pettersson K, Johansen K: Gravitational haemodynamics and oedema prevention in the giraffe. Nature 1987;329:59-60
56. Harms MP, Colier WN, Wieling W, Lenders JW, Secher NH, van Lieshout JJ: Orthostatic tolerance, cerebral oxygenation, and blood velocity in humans with sympathetic failure. Stroke 2000;31:1608-1614
57. Harms MP, Wesseling KH, Pott F, Jenstrup M, Van Goudoever J, Secher NH, Van Lieshout JJ: Continuous stroke volume monitoring by modelling flow from non-invasive measurement of arterial pressure in humans under orthostatic stress. Clin Sci (Lond) 1999;97:291-301
58. Hart MC, Orzalesi MM, Cook CD: Relation between anatomic respiratory dead space and body size and lung volume. J Appl Physiol 1963;18:519-522
59. Heldt T, Shim EB, Kamm RD, Mark RG: Computational modeling of cardiovascular response to orthostatic stress. J Appl Physiol 2002;92:1239-54
60. Hicks JW, Badeer HS: Siphon mechanism in collapsible tubes: application to circulation of the giraffe head. Am J Physiol 1989;256:R567-71
61. Hicks JW, Badeer HS: Gravity and the circulation: "open" vs. "closed" systems. Am J Physiol 1992;262:R725-32
62. Hill L: The influence of the force of gravity on the circulation of the blood. J Physiol 1895;18:15-53
63. Hill L, Barnard H: The influence of the force of gravity on the circulation. Part II. J Physiol 1897;21:328-352
64. Hitchcock FA, Ferguson JKW: Respiratory and circulatory adjustments to the erect posture. Am J Physiol 1938;12:457-465
65. Hogan N, Kardos A, Paterson DJ, Casadei B: Effect of exogenous nitric oxide on baroreflex function in humans. Am J Physiol 1999;277:H221-H227
—Reference List— 75
66. Holt JP: The collaps factor in the measurement of venous pressure. Am J Physiol 1941;134:292-299
67. Hughson RL, Edwards MR, O'Leary DD, Shoemaker JK: Critical analysis of cerebrovascular autoregulation during repeated head-up tilt. Stroke 2001;32:2403-2408
68. Ignarro LJ, Lippton H, Edwards JC, Baricos WH, Hyman AL, Kadowitz PJ, Gruetter CA: Mechanism of vascular smooth muscle relaxation by organic nitrates, nitrites, nitroprusside and nitric oxide: evidence for the involvement of S-nitrosothiols as active intermediates. J Pharmacol Exp Ther 1981;218:739-749
69. Imholz BP, Wieling W, van Montfrans GA, Wesseling KH: Fifteen years experience with finger arterial pressure monitoring: assessment of the technology. Cardiovasc Res 1998;38:605-616
70. Iwasaki KI, Zhang R, Zuckerman JH, Pawelczyk JA, Levine BD: Effect of head-down-tilt bed rest and hypovolemia on dynamic regulation of heart rate and blood pressure. Am J Physiol Regul Integr Comp Physiol 2000;279:R2189-R2199
71. Jellema WT, Wesseling KH, Groeneveld AB, Stoutenbeek CP, Thijs LG, van Lieshout JJ: Continuous cardiac output in septic shock by simulating a model of the aortic input impedance: a comparison with bolus injection thermodilution. Anesthesiology 1999;90:1317-1328
72. Karemaker, JM: Vagal effects of the baroreflex on heart rate. PhD thesis, 1980. University of Amsterdam.
73. Karemaker JM, Akkerman EM: Computer modelling the effects of gravity on the cardiovascular system. Physiologist 1992;35:S162-S164
74. Katsube Y, Saro H, Naka M, Kim BH, Kinoshita N, Koretsune Y, Hori M: Decreased baroreflex sensitivity in patients with stable coronary artery disease is correlated with the severity of coronary narrowing. Am J Cardiol 1996;78:1007-10
75. Kellie G: On death from cold, and on congestion of the brain. Transactions of the Medico-Chirurgical Society of Edinburgh 1822;1:84-169
76. Kelman GR: Digital computer procedure for the conversion of PCO2 into blood CO2 content. Respir Physiol 1967;3:111-115
—Reference List— 76
77. Kenny RA, Ingram A, Bayliss J, Sutton R: Head-up tilt: a useful test for investigating unexplained syncope. Lancet 1986;1:1352-1355
78. Kongstad L, Grände PO: The role of arterial and venous pressure for volume regulation of an organ enclosed in a rigid compartment with application to the injured brain. Acta Anaesthesiol Scand 1999;43:501-508
79. Krediet CT, van Dijk N, Linzer M, van Lieshout JJ, Wieling W: Management of vasovagal syncope: controlling or aborting faints by leg crossing and muscle tensing. Circulation 2002;106:1684-1689
80. La Rovere MT, Specchia G, Mortara A, Schwartz PJ: Baroreflex sensitivity, clinical correlates, and cardiovascular mortality among patients with a first myocardial infarction. A prospective study. Circulation 1988;78:816-24
81. Lassen NA: Control of cerebral circulation in health and disease. Circ Res 1974;34:749-60
82. Laude D, Elghozi JL, Girard A, Bellard E, Bouhaddi M, Castiglioni P, Cerutti C, Cividjian A, Di Rienzo M, Fortrat JO, Janssen B, Karemaker JM, Leftheriotis G, Parati G, Persson PB, Porta A, Quintin L, Regnard J, Rudiger H, Stauss HM: Comparison of various techniques used to estimate spontaneous baroreflex sensitivity (the EuroBaVar study). Am J Physiol Regul Integr Comp Physiol 2004;286:R226-31
83. Levenhagen DK, Evans JM, Wang M, Knapp CF: Cardiovascular regulation in humans in response to oscillatory lower body negative pressure. Am J Physiol 1994;267:H593-H604
84. Levine BD, Pawelczyk JA, Ertl AC, Cox JF, Zuckerman JH, Diedrich A, Biaggioni I, Ray CA, Smith ML, Iwase S, Saito M, Sugiyama Y, Mano T, Zhang R, Iwasaki K, Lane LD, Buckey JC Jr, Cooke WH, Baisch FJ, Eckberg DL, Blomqvist CG: Human muscle sympathetic neural and haemodynamic responses to tilt following spaceflight. J Physiol 2002;538:331-40
85. Lilijestrand G, Wollin G: Einfluss der Körperstellung auf die Zusammensetzung der Alveolarluft des Menschen. Zentralbl.f.Physiol. 1914;27:1268-1270
86. Lillywhite HB: Snakes, blood circulation and gravity. Sci Am 1988;66-72
87. Lindgren KN, Kraft D, Ballard RE, Tucker A, Hargens AR: Venoconstrictive thigh cuffs impede fluid shifts during simulated microgravity. Aviat Space

—Reference List— 77
Environ Med 1998;69:1052-8
88. Ma S, Long JP: Central noradrenergic activity and the cardiovascular effects of nitroglycerin and amyl nitrate. J Cardiovasc Pharmacol 1992;20:826-836
89. Main RJ: Alterations of alveolar CO2 in man accompanying postural change. Am J Physiol 1937;118:435-440
90. Mason DT, Braunwald E: The effects of nitroglycerin and amyl nitrite on arteriolar and venous tone in the human forearm. Circulation 1965;32:755-766
91. Meck JV, Waters WW, Ziegler MG, deBlock HF, Mills PJ, Robertson D, Huang PL: Mechanisms of postspaceflight orthostatic hypotension: low alpha1-adrenergic receptor responses before flight and central autonomic dysregulation postflight. Am J Physiol Heart Circ Physiol 2004;286:H1486-95
92. Migeotte PF, Prisk GK, Paiva M: Microgravity alters respiratory sinus arrhythmia and short-term heart rate variability in humans. Am J Physiol Heart Circ Physiol 2003;284:H1995-2006
93. Milic-Emili J, Henderson JA, Dolovich MB, Trop D, Kaneko K: Regional distribution of inspired gas in the lung. J Appl Physiol 1966;21:749-759
94. Musch G, Layfield JD, Harris RS, Melo MF, Winkler T, Callahan RJ, Fischman AJ, Venegas JG: Topographical distribution of pulmonary perfusion and ventilation, assessed by PET in supine and prone humans. J Appl Physiol 2002;93:1841-1851
95. Nelson GE: Fundamental Concepts of Biology. New York, Wiley, 1982, p262
96. Novak V, Spies JM, Novak P, McPhee BR, Rummans TA, Low PA: Hypocapnia and cerebral hypoperfusion in orthostatic intolerance. Stroke 1998;29:1876-1881
97. Parlow J, Viale JP, Annat G, Hughson R, Quintin L: Spontaneous cardiac baroreflex in humans. Comparison with drug-induced responses. Hypertension 1995;25:1058-68
98. Pawelczyk JA, Zuckerman JH, Blomqvist CG, Levine BD: Regulation of muscle sympathetic nerve activity after bed rest deconditioning. Am J Physiol Heart Circ Physiol 2001;280:H2230-H2239
—Reference List— 78
99. Pomeranz B, Macaulay RJ, Caudill MA, Kutz I, Adam D, Gordon D, Kilborn KM, Barger AC, Shannon DC, Cohen RJ: Assessment of autonomic function in humans by heart rate spectral analysis. Am J Physiol 1985;248:H151-H153
100. Pott F, van Lieshout JJ, Ide K, Madsen P, Secher NH: Middle cerebral artery blood velocity during a valsalva maneuver in the standing position. J Appl Physiol 2000;88:1545-1550
101. Raviele A, Gasparini G, Di Pede F, Delise P, Bonso A, Piccolo E: Usefulness of head-up tilt test in evaluating patients with syncope of unknown origin and negative electrophysiologic study. Am J Cardiol 1990;65:1322-1327
102. Raviele A, Gasparini G, Di Pede F, Menozzi C, Brignole M, Dinelli M, Alboni P, Piccolo E: Nitroglycerin infusion during upright tilt: a new test for the diagnosis of vasovagal syncope. Am Heart J 1994;127:103-11
103. Raviele A, Menozzi C, Brignole M, Gasparini G, Alboni P, Musso G, Lolli G, Oddone D, Dinelli M, Mureddu R: Value of head-up tilt testing potentiated with sublingual nitroglycerin to assess the origin of unexplained syncope. Am J Cardiol 1995;76:267-272
104. Rea HH, Withy SJ, Seelye ER, Harris EA: The effects of posture on venous admixture and respiratory dead space in health. Am Rev Respir Dis 1977;115:571-580
105. Robbe HW, Mulder LJ, Ruddel H, Langewitz WA, Veldman JB, Mulder G: Assessment of baroreceptor reflex sensitivity by means of spectral analysis. Hypertension 1987;10:538-43
106. Samniah N, Sakaguchi S, Ermis C, Lurie KG, Benditt DG: Transient modification of baroreceptor response during tilt-induced vasovagal syncope. Europace 2004;6:48-54
107. Schreiber SJ, Lambert UK, Doepp F, Valdueza JM: Effects of prolonged head-down tilt on internal jugular vein cross-sectional area. Br J Anaesth 2002;89:769-71
108. Seymour RS, Hargens AR, Pedley TJ: The heart works against gravity. Am J Physiol 1993;265:R715-20
109. Seymour RS, Johansen K: Blood flow uphill and downhill: does a siphon facilitate circulation above the heart? Comp Biochem Physiol A 1987;88:167-70

—Reference List— 79
110. Sharpey-Schafer EP: Effect of respiratory acts on the circulation. In Handbook of Physiology. Circulation. Sect. 2, Vol III. Washington, DC, 1965, pp 1875-1886
111. Shibutani K, Muraoka M, Shirasaki S, Kubal K, Sanchala VT, Gupte P: Do changes in end-tidal PCO2 quantitatively reflect changes in cardiac output? Anesth Analg 1994;79:829-833
112. Smyth HS, Sleight P, Pickering GW: Reflex regulation of arterial pressure during sleep in man. A quantitative method of assessing baroreflex sensitivity. Circ Res 1969;24:109-21
113. Sneddon JF, Counihan PJ, Bashir Y, Haywood GA, Ward DE, Camm AJ: Impaired immediate vasoconstrictor responses in patients with recurrent neurally mediated syncope. Am J Cardiol 1993;71:72-76
114. Snedecor GW, Cochran WG: Statistical Methods. 6th Ed. The Iowa State University Press, Ames, Iowa.1967
115. Sprangers RL, Wesseling KH, Imholz AL, Imholz BP, Wieling W: Initial blood pressure fall on stand up and exercise explained by changes in total peripheral resistance. J Appl Physiol 1991;70:523-30
116. Stead EA Jr, Warren JV, Merrill AJ, Brannon ES: The cardiac output in male subjects as measured by the technique of right atrial catherization. Normal values with observations on the effect of anxiety and tilting. J Clin.Invest. 1944;24:326-331
117. Steptoe A, Vogele C: Cardiac baroreflex function during postural change assessed using non-invasive spontaneous sequence analysis in young men. Cardiovasc Res 1990;24:627-32
118. Stok WJ, Stringer RC, Karemaker JM: Noninvasive cardiac output measurement in orthostasis: pulse contour analysis compared with acetylene rebreathing. J Appl Physiol 1999;87:2266-73
119. Strasberg B, Rechavia E, Sagie A, Kusniec J, Mager A, Sclarovsky S, Agmon J: The head-up tilt table test in patients with syncope of unknown origin. Am Heart J 1989;118:923-927
120. Taylor JA, Halliwill JR, Brown TE, Hayano J, Eckberg DL: 'Non-hypotensive' hypovolaemia reduces ascending aortic dimensions in humans. J Physiol 1995;483 ( Pt 1):289-98
—Reference List— 80
121. Toung TJK, Aizawa H, Traystman RJ: Effects of positive end-expiratory pressure ventilation on cerebral venous pressure with head elevation in dogs. J Appl Physiol 2000;88:655-661
122. Valdueza JM, von Munster T, Hoffman O, Schreiber S, Einhaupl KM: Postural dependency of the cerebral venous outflow. Lancet 2000;355:200-1
123. van Dijk N, de Bruin IG, Gisolf J, de Bruin-Bon HA, Linzer M, van Lieshout JJ, Wieling W: Hemodynamic effects of legcrossing and skeletal muscle tensing during free standing in patients with vasovagal syncope. J Appl Physiol 2004;
124. van Lieshout JJ, Pott F, Madsen PL, van Goudoever J, Secher NH: Muscle Tensing During Standing : Effects on Cerebral Tissue Oxygenation and Cerebral Artery Blood Velocity. Stroke 2001;32:1546-1551
125. Wesseling KH, Jansen JR, Settels JJ, Schreuder JJ: Computation of aortic flow from pressure in humans using a nonlinear, three-element model. J Appl Physiol 1993;74:2566-2573
126. West JB: Regional differences in gas exchange in the lung of erect man. J Appl Physiol 1962;17:893-898
127. West JB, Dollery CT: Distribution of blood flow and ventilation-perfusion ratio in the lung, measured with radioactive CO2. J Appl Physiol 1959;15:405-410
128. West JB, Dollery CT, Naimark A: Distribution of blood flow in isolated lung; relation to vascular and alveolar pressures. J Appl Physiol 1963;19:713-724
129. Westerhof BE, Gisolf J, Stok WJ, Wesseling KH, Karemaker JM: Time-domain cross-correlation baroreflex sensitivity: performance on the EUROBAVAR data set. J Hypertens 2004;22:1371-80
130. Whitson PA, Charles JB, Williams WJ, Cintron NM: Changes in sympathoadrenal response to standing in humans after spaceflight. J Appl Physiol 1995;79:428-433
131. Wolthuis RA, Bergman SA, Nicogossian AE: Physiological effects of locally applied reduced pressure in man. Physiol Rev 1974;54:566-95
132. Youde J, Panerai RB, Gillies C, Potter JF: Continuous cardiac baroreceptor measurement during tilt in healthy elderly subjects. Clin Auton Res 2002;12:379-84

—Reference List— 81
133. Zanzinger J: Role of nitric oxide in the neural control of cardiovascular function. Cardiovasc Res 1999;43:639-649
134. Zardini P, West JB: Topographical distribution of ventilation in isolated lung. J Appl Physiol 1966;21:794-802
135. Zippel KC, Lillywhite HB, Mladinich CR: New vascular system in reptiles: anatomy and postural hemodynamics of the vertebral venous plexus in snakes. J Morphol 2001;250:173-84
136. Zoller RP, Mark AL, Abboud FM, Schmid PG, Heistad DD: The role of low pressure baroreceptors in reflex vasoconstrictor responses in man. J Clin Invest 1972;51:2967-2972
137. Zouaoui A, Hidden G: The cervical vertebral venous plexus, a drainage route for the brain. Surg Radiol Anat 1989;11:79-80

—Reference List— 82
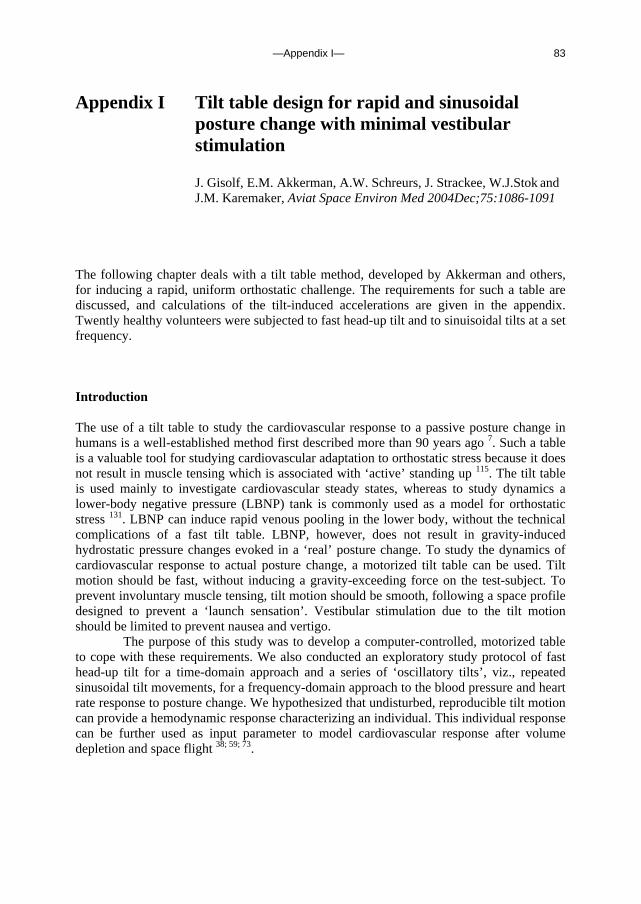
—Appendix I— 83
Appendix I Tilt table design for rapid and sinusoidal posture change with minimal vestibular stimulation
J. Gisolf, E.M. Akkerman, A.W. Schreurs, J. Strackee, W.J.Stok and J.M. Karemaker, Aviat Space Environ Med 2004Dec;75:1086-1091
The following chapter deals with a tilt table method, developed by Akkerman and others, for inducing a rapid, uniform orthostatic challenge. The requirements for such a table are discussed, and calculations of the tilt-induced accelerations are given in the appendix. Twently healthy volunteers were subjected to fast head-up tilt and to sinuisoidal tilts at a set frequency. Introduction The use of a tilt table to study the cardiovascular response to a passive posture change in humans is a well-established method first described more than 90 years ago 7. Such a table is a valuable tool for studying cardiovascular adaptation to orthostatic stress because it does not result in muscle tensing which is associated with ‘active’ standing up 115. The tilt table is used mainly to investigate cardiovascular steady states, whereas to study dynamics a lower-body negative pressure (LBNP) tank is commonly used as a model for orthostatic stress 131. LBNP can induce rapid venous pooling in the lower body, without the technical complications of a fast tilt table. LBNP, however, does not result in gravity-induced hydrostatic pressure changes evoked in a ‘real’ posture change. To study the dynamics of cardiovascular response to actual posture change, a motorized tilt table can be used. Tilt motion should be fast, without inducing a gravity-exceeding force on the test-subject. To prevent involuntary muscle tensing, tilt motion should be smooth, following a space profile designed to prevent a ‘launch sensation’. Vestibular stimulation due to the tilt motion should be limited to prevent nausea and vertigo.
The purpose of this study was to develop a computer-controlled, motorized table to cope with these requirements. We also conducted an exploratory study protocol of fast head-up tilt for a time-domain approach and a series of ‘oscillatory tilts’, viz., repeated sinusoidal tilt movements, for a frequency-domain approach to the blood pressure and heart rate response to posture change. We hypothesized that undisturbed, reproducible tilt motion can provide a hemodynamic response characterizing an individual. This individual response can be further used as input parameter to model cardiovascular response after volume depletion and space flight 38; 59; 73.
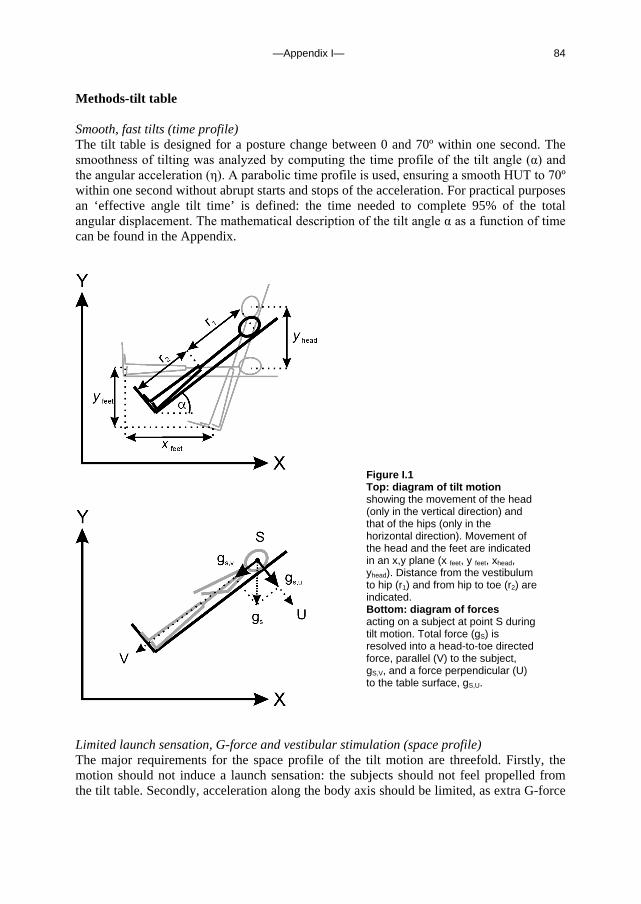
—Appendix I— 84
Methods-tilt table Smooth, fast tilts (time profile) The tilt table is designed for a posture change between 0 and 70º within one second. The smoothness of tilting was analyzed by computing the time profile of the tilt angle (α) and the angular acceleration (η). A parabolic time profile is used, ensuring a smooth HUT to 70º within one second without abrupt starts and stops of the acceleration. For practical purposes an ‘effective angle tilt time’ is defined: the time needed to complete 95% of the total angular displacement. The mathematical description of the tilt angle α as a function of time can be found in the Appendix.
Limited launch sensation, G-force and vestibular stimulation (space profile) The major requirements for the space profile of the tilt motion are threefold. Firstly, the motion should not induce a launch sensation: the subjects should not feel propelled from the tilt table. Secondly, acceleration along the body axis should be limited, as extra G-force
Figure I.1 Top: diagram of tilt motion showing the movement of the head (only in the vertical direction) and that of the hips (only in the horizontal direction). Movement of the head and the feet are indicated in an x,y plane (x feet, y feet, xhead, yhead). Distance from the vestibulum to hip (r1) and from hip to toe (r2) are indicated. Bottom: diagram of forces acting on a subject at point S during tilt motion. Total force (gS) is resolved into a head-to-toe directed force, parallel (V) to the subject, gS,V, and a force perpendicular (U) to the table surface, gS,U.
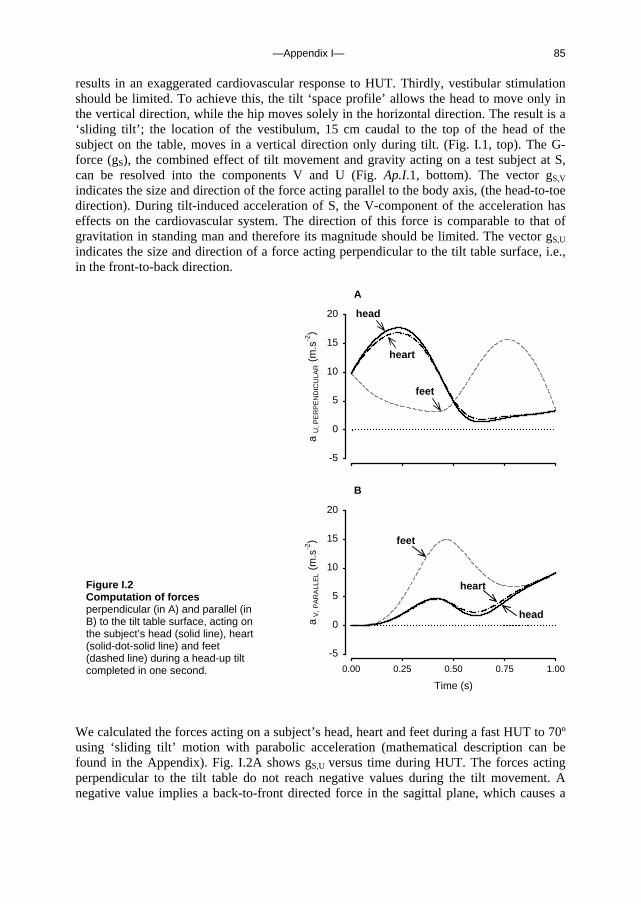
—Appendix I— 85
results in an exaggerated cardiovascular response to HUT. Thirdly, vestibular stimulation should be limited. To achieve this, the tilt ‘space profile’ allows the head to move only in the vertical direction, while the hip moves solely in the horizontal direction. The result is a ‘sliding tilt’; the location of the vestibulum, 15 cm caudal to the top of the head of the subject on the table, moves in a vertical direction only during tilt. (Fig. I.1, top). The G-force (gS), the combined effect of tilt movement and gravity acting on a test subject at S, can be resolved into the components V and U (Fig. Ap.I.1, bottom). The vector gS,V indicates the size and direction of the force acting parallel to the body axis, (the head-to-toe direction). During tilt-induced acceleration of S, the V-component of the acceleration has effects on the cardiovascular system. The direction of this force is comparable to that of gravitation in standing man and therefore its magnitude should be limited. The vector gS,U indicates the size and direction of a force acting perpendicular to the tilt table surface, i.e., in the front-to-back direction.
A
a U
, PE
RP
EN
DIC
ULA
R (
m.s
-2)
-5
0
5
10
15
20
feet
head
heart
B
Time (s)
0.00 0.25 0.50 0.75 1.00
a V
, PA
RA
LLE
L (m
.s-2
)
-5
0
5
10
15
20
feet
head
heart
We calculated the forces acting on a subject’s head, heart and feet during a fast HUT to 70º using ‘sliding tilt’ motion with parabolic acceleration (mathematical description can be found in the Appendix). Fig. I.2A shows gS,U versus time during HUT. The forces acting perpendicular to the tilt table do not reach negative values during the tilt movement. A negative value implies a back-to-front directed force in the sagittal plane, which causes a
Figure I.2 Computation of forces perpendicular (in A) and parallel (in B) to the tilt table surface, acting on the subject’s head (solid line), heart (solid-dot-solid line) and feet (dashed line) during a head-up tilt completed in one second.

—Appendix I— 86
‘launch’ sensation. The forces acting along the body axis, gS,V, are shown in Fig. I.2B. At 70º HUT the gS,V is 9.4 m.s-2, which is the gravitational component (g0) at 70º. During the tilt movement gS,V at head-level and the one at heart level do not exceed g0 at 70º, thereby limiting the additional ‘gravitational’ stress induced by the tilt motion itself.
Tilt table construction The tilt table was designed and constructed by two of us (E.M.A. and A.W.S.); the design is shown in Fig. I.3. To make the table stable and as stiff as possible, square profiled iron bars and massive axles for the rotation points were used for the construction. The total mass of the table is 360 kg. The tilt table motion is powered by a motor drive consisting of a screw (SKF, SRF 30x20R) driven by an electromotor (Contraves, CMT40ZD4-60), which pushes or pulls the table to a new position. The transmission to the screw consists of two gearing wheels connected by a tooth belt, giving a transmission factor of 25/46 from the motor to the screw.
Figure I.3 Diagram of the design of the motorized tilt table showing rotation points and positioning of the motor beneath the table surface
Control system The motor is steered by a programmable servo controller and a microcomputer, allowing easy and efficient operation of the table during experiments. The control parameters to the servo system can be adjusted interactively or by dedicated software, running on a PC; the tilt moves are programmed. The servo controller (Galil Motion Control, DMC 210) gives its digital output signal to a current amplifier (Elmo Engineering, ESA 25/200 RC) that feeds the motor.
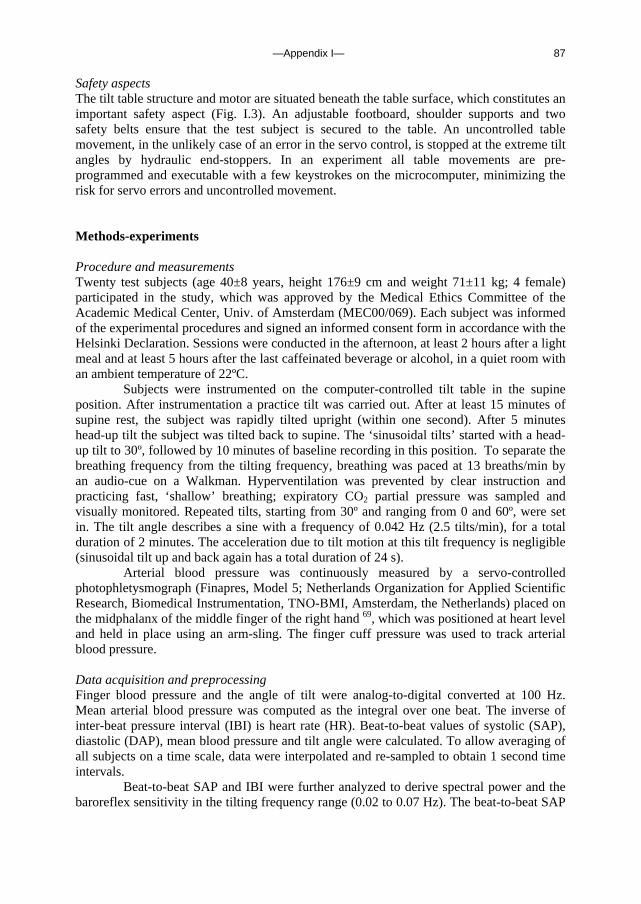
—Appendix I— 87
Safety aspects The tilt table structure and motor are situated beneath the table surface, which constitutes an important safety aspect (Fig. I.3). An adjustable footboard, shoulder supports and two safety belts ensure that the test subject is secured to the table. An uncontrolled table movement, in the unlikely case of an error in the servo control, is stopped at the extreme tilt angles by hydraulic end-stoppers. In an experiment all table movements are pre-programmed and executable with a few keystrokes on the microcomputer, minimizing the risk for servo errors and uncontrolled movement. Methods-experiments Procedure and measurements Twenty test subjects (age 40±8 years, height 176±9 cm and weight 71±11 kg; 4 female) participated in the study, which was approved by the Medical Ethics Committee of the Academic Medical Center, Univ. of Amsterdam (MEC00/069). Each subject was informed of the experimental procedures and signed an informed consent form in accordance with the Helsinki Declaration. Sessions were conducted in the afternoon, at least 2 hours after a light meal and at least 5 hours after the last caffeinated beverage or alcohol, in a quiet room with an ambient temperature of 22ºC.
Subjects were instrumented on the computer-controlled tilt table in the supine position. After instrumentation a practice tilt was carried out. After at least 15 minutes of supine rest, the subject was rapidly tilted upright (within one second). After 5 minutes head-up tilt the subject was tilted back to supine. The ‘sinusoidal tilts’ started with a head-up tilt to 30º, followed by 10 minutes of baseline recording in this position. To separate the breathing frequency from the tilting frequency, breathing was paced at 13 breaths/min by an audio-cue on a Walkman. Hyperventilation was prevented by clear instruction and practicing fast, ‘shallow’ breathing; expiratory CO2 partial pressure was sampled and visually monitored. Repeated tilts, starting from 30º and ranging from 0 and 60º, were set in. The tilt angle describes a sine with a frequency of 0.042 Hz (2.5 tilts/min), for a total duration of 2 minutes. The acceleration due to tilt motion at this tilt frequency is negligible (sinusoidal tilt up and back again has a total duration of 24 s).
Arterial blood pressure was continuously measured by a servo-controlled photophletysmograph (Finapres, Model 5; Netherlands Organization for Applied Scientific Research, Biomedical Instrumentation, TNO-BMI, Amsterdam, the Netherlands) placed on the midphalanx of the middle finger of the right hand 69, which was positioned at heart level and held in place using an arm-sling. The finger cuff pressure was used to track arterial blood pressure. Data acquisition and preprocessing Finger blood pressure and the angle of tilt were analog-to-digital converted at 100 Hz. Mean arterial blood pressure was computed as the integral over one beat. The inverse of inter-beat pressure interval (IBI) is heart rate (HR). Beat-to-beat values of systolic (SAP), diastolic (DAP), mean blood pressure and tilt angle were calculated. To allow averaging of all subjects on a time scale, data were interpolated and re-sampled to obtain 1 second time intervals.
Beat-to-beat SAP and IBI were further analyzed to derive spectral power and the baroreflex sensitivity in the tilting frequency range (0.02 to 0.07 Hz). The beat-to-beat SAP

—Appendix I— 88
and the IBI of the sinusoidal tilt episode was detrended and Hanning Windowed. Power spectra were computed using a Discrete Fourier Transform as described elsewhere 38. Spectral smoothing was applied using a triangular window with a 9-points width. Power spectral density was computed, and cross spectra of SAP and IBI were calculated for the 0.02 to 0.07 Hz range for baroreflex sensitivity (BRS) gain analysis. Statistical Analysis Results are presented as means ± SE, unless stated otherwise. All data were tested for normality and using the Kolmogorov-Smirnov test. The hemodynamic responses to tilt were normally distributed; differences were tested with Student’s paired t-Test. Bivariate correlation was tested using Pearson’s regression coefficient. For all tests, the level of significance was set at P≤ 0.05. Results Fast head-up tilt The fast head-up tilt movement was experienced by all subjects as smooth. None of the subjects reported lightheadedness during the tilt motion or during the 5 minutes passive standing. Averaged over intervals 60 to 120 seconds prior to and 60 to 120 seconds following HUT, the SAP increased from 113±9 mmHg to 119±11 mmHg (P<0.05). IBI decreased from 987±154 ms to 785±124 ms (P<0.05), the corresponding rise in HR is 62±11 to 78±13 bpm. The dynamic IBI response to HUT was calculated as the range (difference between maximum and minimum) over the 15 seconds from the start of tilt motion, normalized for the IBI value just prior to the tilt motion, with IBI computed from beat-to-beat data resampled at 1 Hz. The IBI just prior to HUT was 978±145 ms, the IBI range over the 15 seconds was 212±89 ms and the normalized IBI response to HUT was 0.22±0.08. Similarly calculated, the SAP just prior to HUT was 115±10 mmHg, the SAP range over 15 seconds from the start of tilt motion was 16±7mmHg and the normalized SAP response to HUT was 0.14±0.05. Sinusoidal tilts All subjects experienced sinusoidal tilts as a smooth motion that did not result in lightheadedness or dizziness. Subjects were able to follow the auditory cue to pace the breathing at 13 breaths/min, separating the breathing from the tilt frequency. Per-second averaged SAP, DAP, IBI and tilt angle, averaged for all subjects, are shown in Fig. I.4. Note the phase lag in the IBI with respect to the tilt angle; the cyclic IBI minimum occurs some 4 to 6 seconds after the peak tilt angle. Spectral analysis of SAP and IBI of the sinusoidal tilt period and selection of the frequency band of the tilt frequency (0.02 to 0.07 Hz), gave a SAP spectral power of 27±6 mmHg2.Hz-1 (Fig. I.5, top), an IBI spectral power of 4.5±0.6 103 s2.Hz-1 (Fig. I.5, bottom) and a cross-spectral gain of 13±5 ms.mmHg-1. The cross-spectral coherence ranged from 0.4 to 0.9 with median 0.7. We used SAP as measured at heart level without computing heart-to-carotid sinus hydrostatic height corrections. Tilt test results as individual parameters To find individual response parameters to tilt suitable for input to a model using a control-system approach to modeling reflexes, we calculated the correlation (Pearson) between
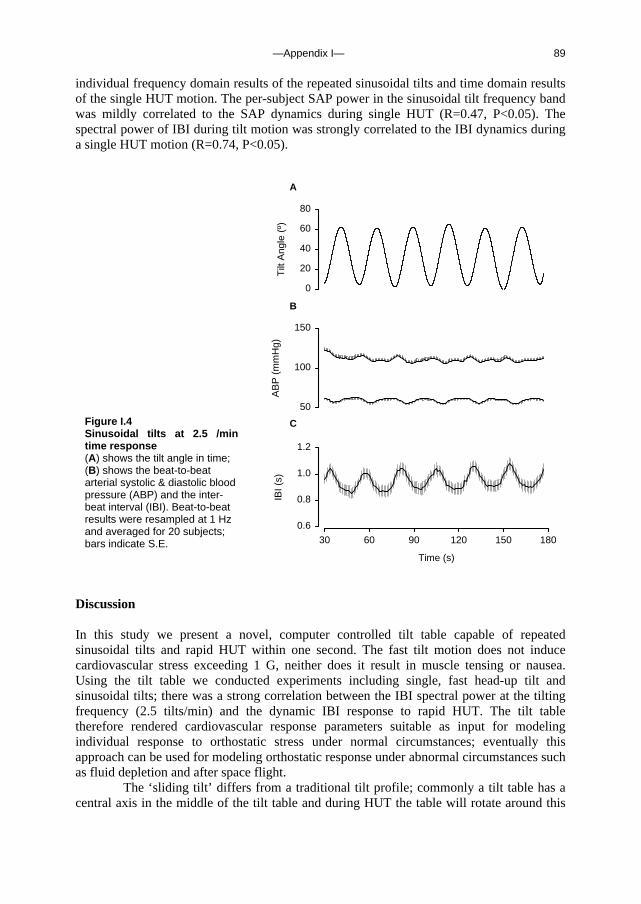
—Appendix I— 89
individual frequency domain results of the repeated sinusoidal tilts and time domain results of the single HUT motion. The per-subject SAP power in the sinusoidal tilt frequency band was mildly correlated to the SAP dynamics during single HUT (R=0.47, P<0.05). The spectral power of IBI during tilt motion was strongly correlated to the IBI dynamics during a single HUT motion (R=0.74, P<0.05).
B
AB
P (
mm
Hg)
50
100
150
C
Time (s)
30 60 90 120 150 180
IBI (
s)
0.6
0.8
1.0
1.2
A
Tilt
Ang
le (
º)0
20
40
60
80
Discussion In this study we present a novel, computer controlled tilt table capable of repeated sinusoidal tilts and rapid HUT within one second. The fast tilt motion does not induce cardiovascular stress exceeding 1 G, neither does it result in muscle tensing or nausea. Using the tilt table we conducted experiments including single, fast head-up tilt and sinusoidal tilts; there was a strong correlation between the IBI spectral power at the tilting frequency (2.5 tilts/min) and the dynamic IBI response to rapid HUT. The tilt table therefore rendered cardiovascular response parameters suitable as input for modeling individual response to orthostatic stress under normal circumstances; eventually this approach can be used for modeling orthostatic response under abnormal circumstances such as fluid depletion and after space flight. The ‘sliding tilt’ differs from a traditional tilt profile; commonly a tilt table has a central axis in the middle of the tilt table and during HUT the table will rotate around this
Figure I.4 Sinusoidal tilts at 2.5 /min time response (A) shows the tilt angle in time; (B) shows the beat-to-beat arterial systolic & diastolic blood pressure (ABP) and the inter-beat interval (IBI). Beat-to-beat results were resampled at 1 Hz and averaged for 20 subjects; bars indicate S.E.
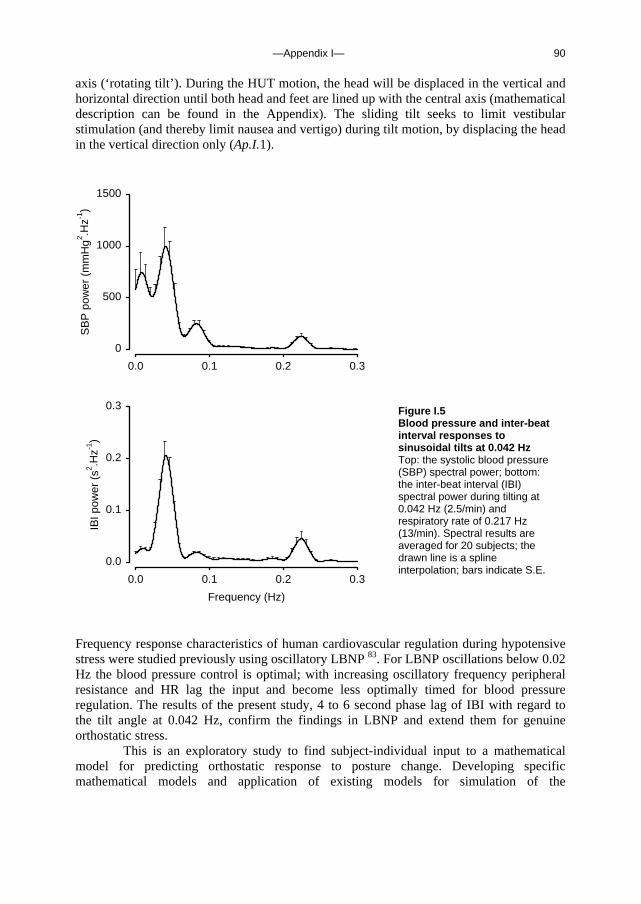
—Appendix I— 90
axis (‘rotating tilt’). During the HUT motion, the head will be displaced in the vertical and horizontal direction until both head and feet are lined up with the central axis (mathematical description can be found in the Appendix). The sliding tilt seeks to limit vestibular stimulation (and thereby limit nausea and vertigo) during tilt motion, by displacing the head in the vertical direction only (Ap.I.1).
0.0 0.1 0.2 0.3
SB
P p
ower
(m
mH
g2 .H
z-1)
0
500
1000
1500
Frequency (Hz)
0.0 0.1 0.2 0.3
IBI p
ower
(s2 .H
z-1)
0.0
0.1
0.2
0.3
Frequency response characteristics of human cardiovascular regulation during hypotensive stress were studied previously using oscillatory LBNP 83. For LBNP oscillations below 0.02 Hz the blood pressure control is optimal; with increasing oscillatory frequency peripheral resistance and HR lag the input and become less optimally timed for blood pressure regulation. The results of the present study, 4 to 6 second phase lag of IBI with regard to the tilt angle at 0.042 Hz, confirm the findings in LBNP and extend them for genuine orthostatic stress.
This is an exploratory study to find subject-individual input to a mathematical model for predicting orthostatic response to posture change. Developing specific mathematical models and application of existing models for simulation of the
Figure I.5 Blood pressure and inter-beat interval responses to sinusoidal tilts at 0.042 Hz Top: the systolic blood pressure (SBP) spectral power; bottom: the inter-beat interval (IBI) spectral power during tilting at 0.042 Hz (2.5/min) and respiratory rate of 0.217 Hz (13/min). Spectral results are averaged for 20 subjects; the drawn line is a spline interpolation; bars indicate S.E.

—Appendix I— 91
cardiovascular response to orthostatic stress after fluid depletion or space flight, are plans for future use of the tilt table and the sinusoidal tilt protocol. Concluding, in this study designed to determine individual characteristics of hemodynamic response to orthostatic stress, we introduce a computer controlled tilt table capable of fast HUT and repeated sinusoidal tilt motion. Sinusoidal tilts provide frequency domain IBI power that correlates with the time-domain IBI response to fast HUT.

—Appendix I— 92
Appendix
Symbols Definition Units
α tilt angle degrees (º) η angular acceleration degrees.s-2 T tilt duration s τ running time s αMAX maximal tilt angle degrees (º) {x head, y
head} position of the vestibulum m
{x heart, y
heart} position of the heart m
{x feet, yfeet} position of the feet m r1 distance from the vestibulum to the rotation point m r2 distance from the rotation point to the feet m l distance from the vestibulum to the heart m {ax,i , ay,i} acceleration of i (i = head, heart, feet) m .s-2 βi angle of the acceleration of i (i = head, heart, feet) degrees (º)
Time Profile The tilt angle (α) and the angular acceleration (η) as a function of time, read for 0 < τ ≤ 0.5 as,
α (τ) = 8 αMAX τ 3 (1- τ) η (τ) = 48 (αMAX /T
2) τ (1-2 τ) and for 0.5 < τ ≤ 1 as
α (τ) = αMAX -8 αMAX τ (1- τ)3
η (τ) = -48 (αMAX /T
2) (1- τ) (2τ -1)
with T the tilt duration, τ the running time divided by T and αMAX the maximal angle of tilt. Space profile The tilt movement takes place in a 2-dimensional plane. We define the horizontal axis as x and the vertical one as y. The position of the vestibulum {x head, y head}, defined as a location 15 cm caudal to the top of the head, of the heart {x heart, y heart} and of the feet {x feet, y feet} are calculated as a function of tilt angle, α. Position is indicated by its {x,y} coordinates:
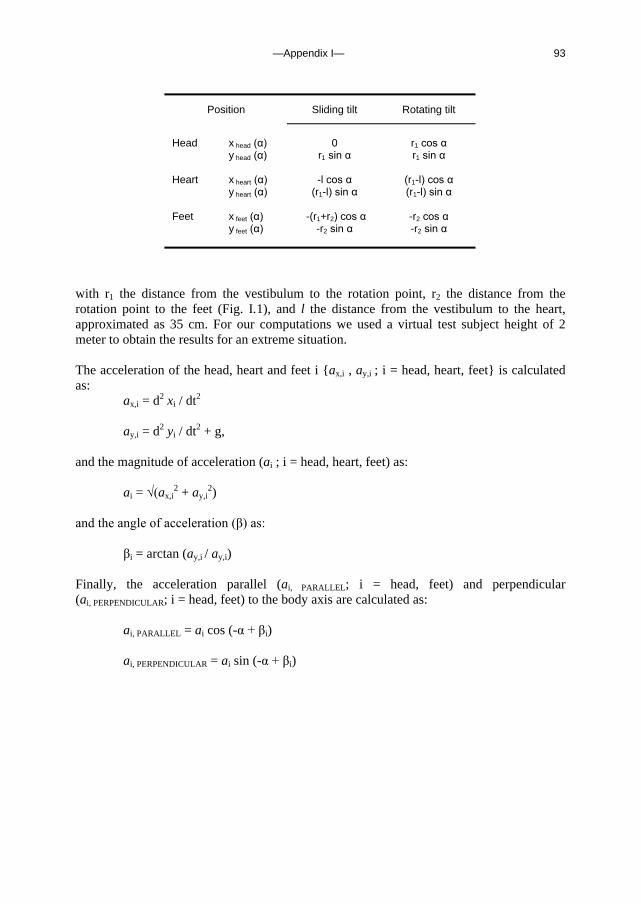
—Appendix I— 93
Position Sliding tilt Rotating tilt
Head x head (α) 0 r1 cos α y head (α) r1 sin α r1 sin α Heart x heart (α) -l cos α (r1-l) cos α y heart (α) (r1-l) sin α (r1-l) sin α Feet x feet (α) -(r1+r2) cos α -r2 cos α
y feet (α) -r2 sin α -r2 sin α
with r1 the distance from the vestibulum to the rotation point, r2 the distance from the rotation point to the feet (Fig. I.1), and l the distance from the vestibulum to the heart, approximated as 35 cm. For our computations we used a virtual test subject height of 2 meter to obtain the results for an extreme situation. The acceleration of the head, heart and feet i {ax,i , ay,i ; i = head, heart, feet} is calculated as:
ax,i = d2 xi / dt2
ay,i = d2 yi / dt2 + g,
and the magnitude of acceleration (ai ; i = head, heart, feet) as: ai = √(ax,i
2 + ay,i2)
and the angle of acceleration (β) as:
βi = arctan (ay,i / ay,i)
Finally, the acceleration parallel (ai, PARALLEL; i = head, feet) and perpendicular (ai, PERPENDICULAR; i = head, feet) to the body axis are calculated as:
ai, PARALLEL = ai cos (-α + βi)
ai, PERPENDICULAR = ai sin (-α + βi)

—Appendix I— 94
—Appendix II— 95
Appendix II Time-domain cross-correlation baroreflex sensitivity: performance on the EUROBAVAR data set
B.E. Westerhof, J. Gisolf, W.J. Stok, K.H. Wesseling and J.M. Karemaker, J Hypertens 2004 Jul;22(7):1371-80
The following chapter explains a method, developed by Wesseling and Karemaker, for computing baroreflex sensitivy, using time-domain cross-correlation of inter-beat interval and systolic blood pressure series. The method is applied to the Eurobavar database, allowing comparison with existing, established methods for determining baroreflex sensitivity. Introduction Baroreflex sensitivity (BRS) is now a prognostic factor in cardiology 74; 80; 82. It is the amount of response in heart beat interval to a change in blood pressure, expressed in ms/mmHg. A blood pressure increment must lead to an increment in interval within 3 or 4 s, and similarly a blood pressure decrement must lead to an interval decrement within 3 or 4 s, for the changes to be considered to be baroreflex action. Since the concept was proposed in 1969 112, a number of methods have been developed for the assessment of BRS, some using a circulatory challenge such as injections of vasoconstrictor or vasodilator agents 112, neck suction 42 or a change from supine to standing 53; 132, and some using spontaneous blood pressure and interval variability, studied in the time domain 13; 38; 39 or in the frequency domain 38; 105. These various methods produce somewhat different numerical values 50, although results obtained on the same data set show acceptable correlation 82. Before the cross-correlation method described below, we developed a sequential method (sBRS) based on and comparable to the well known method of Di Rienzo et al. 39. During the development of that technique, when spontaneous fluctuations in pressure and interval were plotted against each other, we often noticed open Lissajous loops, which indicated that allowance should be made for any delay between pressure and interval, as was suggested at an early stage by Karemaker 72. As the amount of delay for each patient and patient state is not known in advance, we decided to compute BRS as a cross-correlation function of blood pressure and pulse interval and call this method cross-correlation baroreflex sensitivity, or xBRS.
Recently, the European Society of Hypertension working group on baroreflex and cardiovascular variability, in which 11 centres participate, has produced a comprehensive database which is available for the testing and comparison of methods 82. We tested the xBRS method on that data set, comparing the results obtained by xBRS using our local
—Appendix II— 96
Amsterdam sequence and spectral algorithms with the 21 results obtained with various methods returned by the 11 centres participating in EUROBAVAR 82. Methods The xBRS, sBRS and spectral methods described below we will refer to as Amsterdam ‘local’ methods and results, to distinguish them from those in the EUROBAVAR study. The EUROBAVAR data set The EUROBAVAR data set consists of 10–12 min recordings obtained in 21 patients (four men and 17 women) who were monitored non-invasively with a Finapres 2300 (Ohmeda, Louisville, Coloradro, USA) and a Cardiocap II (Datex Engstrom, Helsinki, Finland) in both the supine (henceforth referred to as ‘lying’) and the standing positions. Their ages ranged from 20 to 68 years. One patient had diabetes with evident cardiac autonomic neuropathy, one was a recent recipient of a heart transplant, one had diabetes without cardiac neuropathy, eight were normotensive patients, one had hypertension, two had hypertension that was treated, two had hypercholesterolaemia that was treated, one woman was pregnant in her first term, and four were healthy volunteers. (For further details see Laude et al. 82.) The EUROBAVAR data set is available from the internet as beat-to-beat systolic and interval values. A set (a) consists of 16 files from eight patients, identified as a001l for lying and a001s for standing, and so on. A set (b) consists of 30 files identified as b001l andb001s and so on; these were from 13 new patients and two copied from the previous (a) set to test repeatability. Cross-correlation baroreflex sensitivity The xBRS method differs from the original 39 timedomain sequential method in that it observes blood pressure and heart interval variability over a fixed time period rather than over a variable number of beats. Cross-correlation and regression between systolic blood pressure and R–R interval are computed over 10 s sliding windows, a time-span sufficient to accommodate fully a 10 s variability in rhythm, or several cycles at ventilatory frequencies. The method thus may observe two or more slopes simultaneously. Often, the interval variability is delayed with respect to systolic pressure variability. Steptoe and Vögele 117 found a 0-, 1- or 2-beat delay to be adequate in young men. Delays in the baroreflex, however, are measured in seconds of time, not beats 17. We therefore programmed delays in the pulse interval series to compensate for physiological delays by applying time shifts of 0–5 s to interval, thereby correlating current pressure with later interval values. A 5 s delay should suffice for sympathetically mediated reflexes on pulse interval.
Systolic pressure and heart interval series were taken from the EUROBAVAR files. Beat events were spaced on the time axis by distances equal to heart interval. Cubic splines were fitted to the blood pressure and interval event series and the splines were resampled at 1 Hz. For each window, the correlation coefficient was computed six times. The first computation was for zero delay and was executed between the first 10 pressure and interval value pairs (t = 1–10 s). The next computation was for a delay of 1 s and was carried out between the same 10 pressures, but with interval values at t = 2–11 s. Computations continued until the 10 pressure values (t = 1–10 s) were correlated with

—Appendix II— 97
interval values at t = 6–15 s. The cross-correlation with the greatest value was selected, and the corresponding regression slope was taken as a determination of BRS, provided it was positive and its probability of being a random regression was less than 1% (P < 0.01). When these conditions were not met, there was no result for this time segment. The accepted regression slope was divided by the correlation coefficient to obtain a slope fitting pressure and interval variability simultaneously 114; this was done because the pressure and the interval values are both disturbed by random variability in excess of that explained by baroreflex variability. The corresponding delay was recorded as best delay τ. There were no thresholds for pressure or interval changes within a segment. The timing point of a valid xBRS was the middle position of the pressure and possibly time-shifted interval windows. A simulated spike of short duration demonstrates timing in Figure II.1. Such short events cause clusters of BRS detection, 1 s apart. In the software, such clusters are detected as contiguous values not more than 1.5 s apart; the BRS values in a cluster are averaged and timed at the cluster midposition, thus indicating the joint event. Spiked events are rare, however, and approximately sinusoidal events of limited duration are more probable. These may also cause clusters. Values within clusters were usually not as stable as in the simulation example, but were seen to vary over a 2:1 range in amplitude. The results presented are based on individual determinations, not on clusters. With each new determination, the window was advanced 1 s, cumulative means and ranges were updated, and histograms were formed of xBRS and best delay τ, for inspection.
Figure II.1 Simulated pressure and interval plots to demonstrate timing. The upper line is pressure; the lower line is interval. X, Time of a cross-correlation determination of baroreflex sensitivity (BRS); □, cluster midpoint. SBP, systolic blood pressure.
Sequential baroreflex sensitivity For comparison, we include results obtained with the sBRS method, programmed previously in consultation with Di Rienzo and colleagues 39. This method detects sequences of beats with simultaneously increasing or decreasing pressure and interval. A minimum of three sequential beats (three intervals, four R-waves) is required, and a pulse interval delay
—Appendix II— 98
of 0 is taken – that is, systolic pressure falls within the R–R interval considered. The method requires a systolic pressure variation of at least 2.5 mmHg over the beats in the sequence, but has no threshold for interval. The estimate is accepted when correlation is significant at P = 0.05. At the occurrence of the next beat, the direction of the changes in interval and pressure are compared with those of the previous beats. If directions are the same, then correlation and regression are again computed over the longer sequence and evaluated for significance. This leads to clusters of sBRS values similar to the clusters that the xBRS method produces. Our results are based on the individual values. Spectral method Our spectral method computes baroreflex sensitivity as the transfer gain of the cross-spectra between pressure and interval. Their coherence is usually high in the 10 s rhythm band taken from 0.06 to 0.15 Hz and at ventilatory frequencies in the spectra between 0.15 and 0.5 Hz. Spectral estimates of the entire recording were computed with in-house developed software (Graphical User Interface For Fourier Transform), providing an easy-to-use interface on top of proven Matlab signal analysis procedures. Signals were de-trended and a von Hann window 54 applied. A discrete Fourier transform was used that needed no interpolation or zero padding. Triangular spectral smoothing was set at a width of 10 for this study, in view of the 10 min duration of the records. Spectral density, coherence, pressure–interval transfer gain and phase plots are shown on a computer screen and in addition a cursor allows manual selection of bands in which coherence and spectral power are high. An output program lists the resultant data and all the choices made for later analysis. Statistics Histograms of xBRS values per patient file most often conformed to a log-normal distribution. For log-normally distributed variables, the geometric average is a better estimate of central tendency than the arithmetic average. To obtain the geometric average, we took the logarithm of the numbers, computed their arithmetic average, and exponentiated the resultant mean. The numbers were required to be positive or the logarithm could not be taken. BRS values were positive. Values of xBRS best delay τ were averaged arithmetically per patient file, as were values for sBRS. In addition, the distributions of best delay τ per patient file were pooled separately for the lying and standing positions and compared using the χ2 test 114. Multiple regression was used in an attempt to correlate xBRS to patient parameters, to explain variability between patients. When grouped data were compared, non-parametric statistics were used. To maintain comparability with the results of the EUROBAVAR study, we present the pooled arithmetic mean, SD and range. For goodness of fit to a distribution, we used the Kolmogorov–Smirnov one-sample test. For correlation, we used Spearman rank correlation. For significance of differences we used the Mann–Whitney U-test or the Wilcoxon matched pair signed ranks test where appropriate. Results Duplicates The duplicate files were b014 and b015. They gave results identical to their twins (a003 and a008) with our local methods. Identical results were expected, because no manual selection
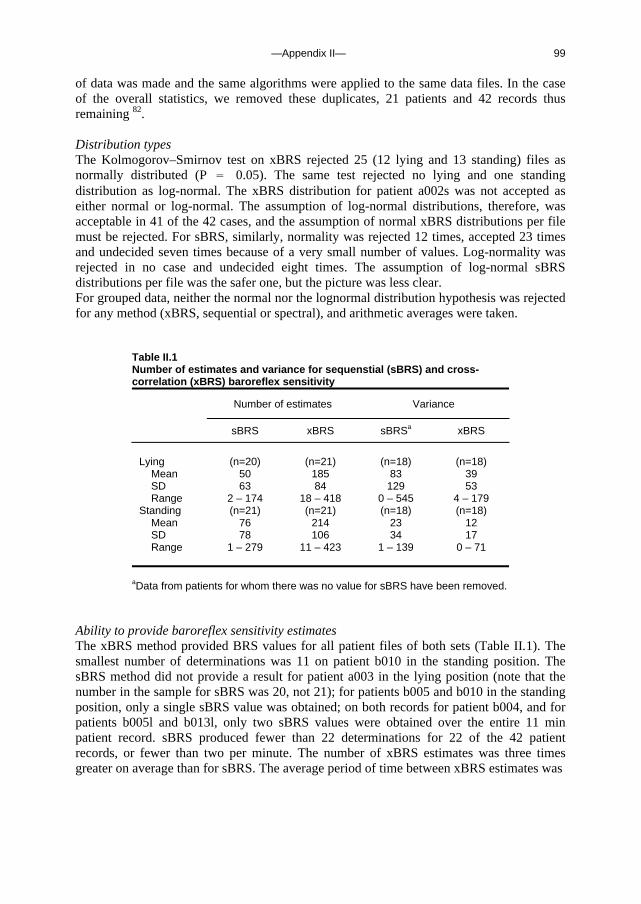
—Appendix II— 99
of data was made and the same algorithms were applied to the same data files. In the case of the overall statistics, we removed these duplicates, 21 patients and 42 records thus remaining 82. Distribution types The Kolmogorov–Smirnov test on xBRS rejected 25 (12 lying and 13 standing) files as normally distributed (P = 0.05). The same test rejected no lying and one standing distribution as log-normal. The xBRS distribution for patient a002s was not accepted as either normal or log-normal. The assumption of log-normal distributions, therefore, was acceptable in 41 of the 42 cases, and the assumption of normal xBRS distributions per file must be rejected. For sBRS, similarly, normality was rejected 12 times, accepted 23 times and undecided seven times because of a very small number of values. Log-normality was rejected in no case and undecided eight times. The assumption of log-normal sBRS distributions per file was the safer one, but the picture was less clear. For grouped data, neither the normal nor the lognormal distribution hypothesis was rejected for any method (xBRS, sequential or spectral), and arithmetic averages were taken.
Table II.1 Number of estimates and variance for sequenstial (sBRS) and cross-correlation (xBRS) baroreflex sensitivity
Number of estimates Variance
sBRS xBRS sBRSa xBRS
Lying (n=20) (n=21) (n=18) (n=18)
Mean 50 185 83 39 SD 63 84 129 53 Range 2 – 174 18 – 418 0 – 545 4 – 179
Standing (n=21) (n=21) (n=18) (n=18) Mean 76 214 23 12 SD 78 106 34 17 Range 1 – 279 11 – 423 1 – 139 0 – 71
aData from patients for whom there was no value for sBRS have been removed. Ability to provide baroreflex sensitivity estimates The xBRS method provided BRS values for all patient files of both sets (Table II.1). The smallest number of determinations was 11 on patient b010 in the standing position. The sBRS method did not provide a result for patient a003 in the lying position (note that the number in the sample for sBRS was 20, not 21); for patients b005 and b010 in the standing position, only a single sBRS value was obtained; on both records for patient b004, and for patients b005l and b013l, only two sBRS values were obtained over the entire 11 min patient record. sBRS produced fewer than 22 determinations for 22 of the 42 patient records, or fewer than two per minute. The number of xBRS estimates was three times greater on average than for sBRS. The average period of time between xBRS estimates was
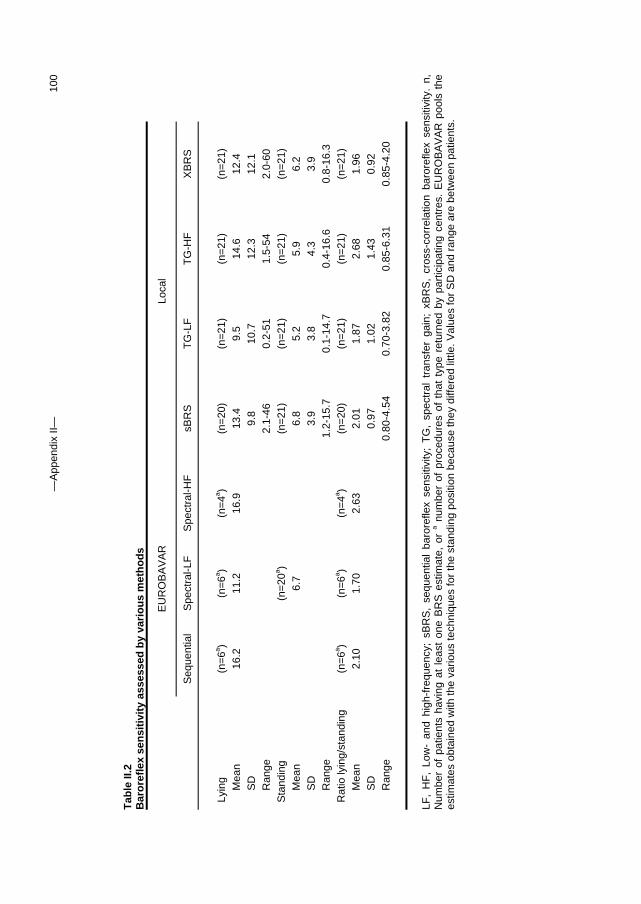
—A
ppen
dix
II—
100
Tab
le II
.2
Bar
ore
flex
sen
siti
vity
ass
esse
d b
y va
rio
us
met
ho
ds
E
UR
OB
AV
AR
Lo
cal
S
eque
ntia
l S
pect
ral-L
F
Spe
ctra
l-HF
sB
RS
T
G-L
F
TG
-HF
X
BR
S
Lyin
g (n
=6a )
(n=
6a ) (n
=4a )
(n=
20)
(n=
21)
(n=
21)
(n=
21)
Mea
n 16
.2
11.2
16
.9
13.4
9.
5 14
.6
12.4
S
D
9.
8 10
.7
12.3
12
.1
Ran
ge
2.
1-46
0.
2-51
1.
5-54
2.
0-60
S
tand
ing
(n
=20
a )
(n=
21)
(n=
21)
(n=
21)
(n=
21)
Mea
n
6.7
6.
8 5.
2 5.
9 6.
2 S
D
3.
9 3.
8 4.
3 3.
9 R
ange
1.2-
15.7
0.
1-14
.7
0.4-
16.6
0.
8-16
.3
Rat
io ly
ing/
stan
ding
(n
=6a )
(n=
6a ) (n
=4a )
(n=
20)
(n=
21)
(n=
21)
(n=
21)
Mea
n 2.
10
1.70
2.
63
2.01
1.
87
2.68
1.
96
SD
0.97
1.
02
1.43
0.
92
Ran
ge
0.
80-4
.54
0.70
-3.8
2 0.
85-6
.31
0.85
-4.2
0
LF
, H
F,
Low
- an
d hi
gh-f
requ
ency
; sB
RS
, se
quen
tial
baro
refle
x se
nsiti
vity
; T
G,
spec
tral
tra
nsfe
r ga
in;
xBR
S,
cros
s-co
rrel
atio
n ba
rore
flex
sens
itivi
ty.
n,
Num
ber
of p
atie
nts
havi
ng a
t le
ast
one
BR
S e
stim
ate,
or
a num
ber
of p
roce
dure
s of
tha
t ty
pe r
etur
ned
by p
artic
ipat
ing
cent
res.
EU
RO
BA
VA
R p
ools
the
es
timat
es o
btai
ned
with
the
vario
us te
chni
ques
for
the
stan
ding
pos
ition
bec
ause
they
diff
ered
littl
e. V
alue
s fo
r S
D a
nd r
ange
are
bet
wee
n pa
tient
s.

—Appendix II— 101
3.0 s; between sBRS estimates it was 7.7 s. A total of 0.2% of xBRS values were obtained at intervals longer than 60 s, compared with 1.8% of sBRS values, not including the three patients in whom no or only single estimates were obtained. Excluding both patients with impaired baroreflexes, xBRS provided 20 values per minute, sBRS just six. With the spectral methods, occasionally, we had to accept bands without significant coherence. Lying and standing baroreflex sensitivity values Table II.2 provides a comparison between the EUROBAVAR results averaged over the various centres and techniques, results from our local sequential and spectral techniques, and those from the new xBRS method. Values for the lying and standing positions and their ratio (which is also considered an important statistic) are listed separately. Note that the number in the sample is 20 for sBRS in the lying position, because no value was obtained for patient record a003l. There was a clear difference between results for lying and standing, with lying values for baroreflex sensitivity approximately two times greater than standing values for all techniques. The SD and range for the local techniques are for the group of 21 patients. The greater value for xBRS SD in the lying position is accounted for by patient b013l, treated separately below (Outlier patient). The differences between the xBRS and sBRS methods were small and not significant (U-test), and rank correlation at 0.95 (Spearman) was highly signifi-cant (P < 0.0001). Within-patient variance in baroreflex sensitivity The within-patient stability of BRS values was analysed by computing the variance (SD squared) for each method. In three cases, no sBRS variance was available because no, or only a single, BRS value was obtained; the results from these patients were removed from the averages of both methods. Table II.1 gives the variances. For xBRS, the average variance per patient file and position was approximately 50% of that for sBRS. The variance ratio became 2.2 when the lying and standing data for each method were combined. All differences were significant (Wilcoxon at P = 0.0001). The coefficient of variation (SD in % of the mean per patient record) was on average 41% for xBRS (range 19–62%) and 52% for sBRS (range 3–96%); in both cases it was nearly proportional to the BRS – that is, large and small values of sensitivity had approximately the same percentage scatter.
Table II.3 Sequential (sBRS) and cross-correlation (xBRS) baroreflex sensitivity in patients with impaired baroreflex
sBRS xBRS
File Value n Value n
b005s 1.2 1 0.8 ± 0.3 46 b005l 2.1 ± 0.6 2 2.3 ± 0.8 82 b010s 2.5 1 1.3 ± 0.4 11 b010l 2.2 ± 0.7 3 2.0 ± 1.8 18
Values are mean ± SD. n, Number of values obtained per record. Note that the number of sBRS estimates was so small that it was not always possible to establish a value for SD.
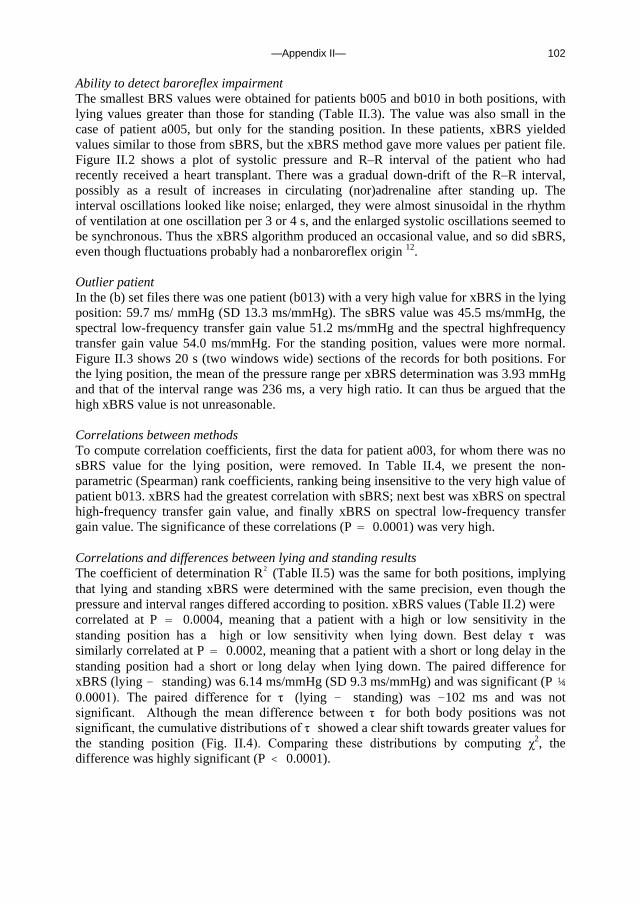
—Appendix II— 102
Ability to detect baroreflex impairment The smallest BRS values were obtained for patients b005 and b010 in both positions, with lying values greater than those for standing (Table II.3). The value was also small in the case of patient a005, but only for the standing position. In these patients, xBRS yielded values similar to those from sBRS, but the xBRS method gave more values per patient file. Figure II.2 shows a plot of systolic pressure and R–R interval of the patient who had recently received a heart transplant. There was a gradual down-drift of the R–R interval, possibly as a result of increases in circulating (nor)adrenaline after standing up. The interval oscillations looked like noise; enlarged, they were almost sinusoidal in the rhythm of ventilation at one oscillation per 3 or 4 s, and the enlarged systolic oscillations seemed to be synchronous. Thus the xBRS algorithm produced an occasional value, and so did sBRS, even though fluctuations probably had a nonbaroreflex origin 12. Outlier patient In the (b) set files there was one patient (b013) with a very high value for xBRS in the lying position: 59.7 ms/ mmHg (SD 13.3 ms/mmHg). The sBRS value was 45.5 ms/mmHg, the spectral low-frequency transfer gain value 51.2 ms/mmHg and the spectral highfrequency transfer gain value 54.0 ms/mmHg. For the standing position, values were more normal. Figure II.3 shows 20 s (two windows wide) sections of the records for both positions. For the lying position, the mean of the pressure range per xBRS determination was 3.93 mmHg and that of the interval range was 236 ms, a very high ratio. It can thus be argued that the high xBRS value is not unreasonable. Correlations between methods To compute correlation coefficients, first the data for patient a003, for whom there was no sBRS value for the lying position, were removed. In Table II.4, we present the non-parametric (Spearman) rank coefficients, ranking being insensitive to the very high value of patient b013. xBRS had the greatest correlation with sBRS; next best was xBRS on spectral high-frequency transfer gain value, and finally xBRS on spectral low-frequency transfer gain value. The significance of these correlations (P = 0.0001) was very high. Correlations and differences between lying and standing results The coefficient of determination R2 (Table II.5) was the same for both positions, implying that lying and standing xBRS were determined with the same precision, even though the pressure and interval ranges differed according to position. xBRS values (Table II.2) were correlated at P = 0.0004, meaning that a patient with a high or low sensitivity in the standing position has a high or low sensitivity when lying down. Best delay τ was similarly correlated at P = 0.0002, meaning that a patient with a short or long delay in the standing position had a short or long delay when lying down. The paired difference for xBRS (lying - standing) was 6.14 ms/mmHg (SD 9.3 ms/mmHg) and was significant (P ¼ 0.0001). The paired difference for τ (lying - standing) was -102 ms and was not significant. Although the mean difference between τ for both body positions was not significant, the cumulative distributions of τ showed a clear shift towards greater values for the standing position (Fig. II.4). Comparing these distributions by computing χ2, the difference was highly significant (P < 0.0001).

—Appendix II— 103
Figure II.2 Recording in the heart transplant patient in the standing position. Upper trace: systolic blood pressure (SBP); lower trace: R–R interval. Sequential baroreflex sensitivity (∆), cross-correlation baroreflex sensitivity (xBRS, X) and xBRS cluster (□) are marked. The full time scale is 660 s (11 min). An sBRS value occurs near t= 40 s reading 2.5 ms/mmHg; xBRS is 1.31 ms/mmHg (SD 0.4 ms/mmHg) averaged over 11 estimates To show details of variability, the period marked by a thick bar on the time axis between 450 and 490 s is also shown enlarged: X4.4 with respect to the time, x4 with respect to the R–R interval and X2 with respect to the pressure.
Figure II.3 Section of the standing (left) and the lying (right) recordings in patient b013, who had the highest BRS values in the group. The bold line is pressure; the thin line is interval. X, Time of cross-correlation determination of baroreflex sensitivity (BRS); □, cluster midpoint. SBP, systolic blood pressure. Both diagrams have the same vertical scales, with the common pressure scale at the left and the interval scale at the far right. In this figure, standing BRS is about 20 ms/mmHg, and lying BRS ranges between 45 and 70 ms/mmHg.
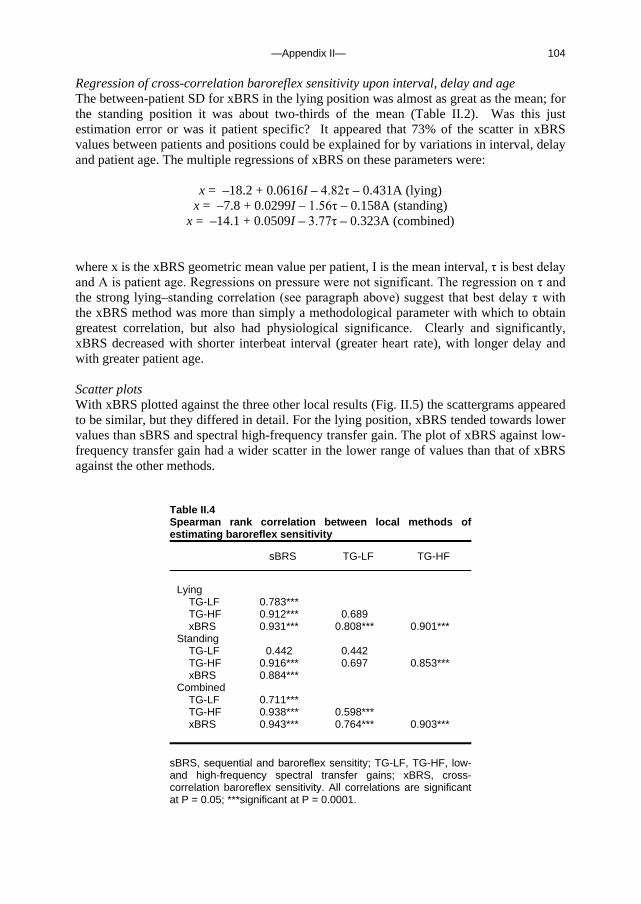
—Appendix II— 104
Regression of cross-correlation baroreflex sensitivity upon interval, delay and age The between-patient SD for xBRS in the lying position was almost as great as the mean; for the standing position it was about two-thirds of the mean (Table II.2). Was this just estimation error or was it patient specific? It appeared that 73% of the scatter in xBRS values between patients and positions could be explained for by variations in interval, delay and patient age. The multiple regressions of xBRS on these parameters were:
x = –18.2 + 0.0616I – 4.82τ – 0.431A (lying) x = –7.8 + 0.0299I – 1.56τ – 0.158A (standing)
x = –14.1 + 0.0509I – 3.77τ – 0.323A (combined) where x is the xBRS geometric mean value per patient, I is the mean interval, τ is best delay and A is patient age. Regressions on pressure were not significant. The regression on τ and the strong lying–standing correlation (see paragraph above) suggest that best delay τ with the xBRS method was more than simply a methodological parameter with which to obtain greatest correlation, but also had physiological significance. Clearly and significantly, xBRS decreased with shorter interbeat interval (greater heart rate), with longer delay and with greater patient age. Scatter plots With xBRS plotted against the three other local results (Fig. II.5) the scattergrams appeared to be similar, but they differed in detail. For the lying position, xBRS tended towards lower values than sBRS and spectral high-frequency transfer gain. The plot of xBRS against low-frequency transfer gain had a wider scatter in the lower range of values than that of xBRS against the other methods.
Table II.4 Spearman rank correlation between local methods of estimating baroreflex sensitivity
sBRS TG-LF TG-HF
Lying
TG-LF 0.783*** TG-HF 0.912*** 0.689 xBRS 0.931*** 0.808*** 0.901***
Standing TG-LF 0.442 0.442 TG-HF 0.916*** 0.697 0.853*** xBRS 0.884***
Combined TG-LF 0.711*** TG-HF 0.938*** 0.598*** xBRS 0.943*** 0.764*** 0.903***
sBRS, sequential and baroreflex sensitity; TG-LF, TG-HF, low- and high-frequency spectral transfer gains; xBRS, cross-correlation baroreflex sensitivity. All correlations are significant at P = 0.05; ***significant at P = 0.0001.
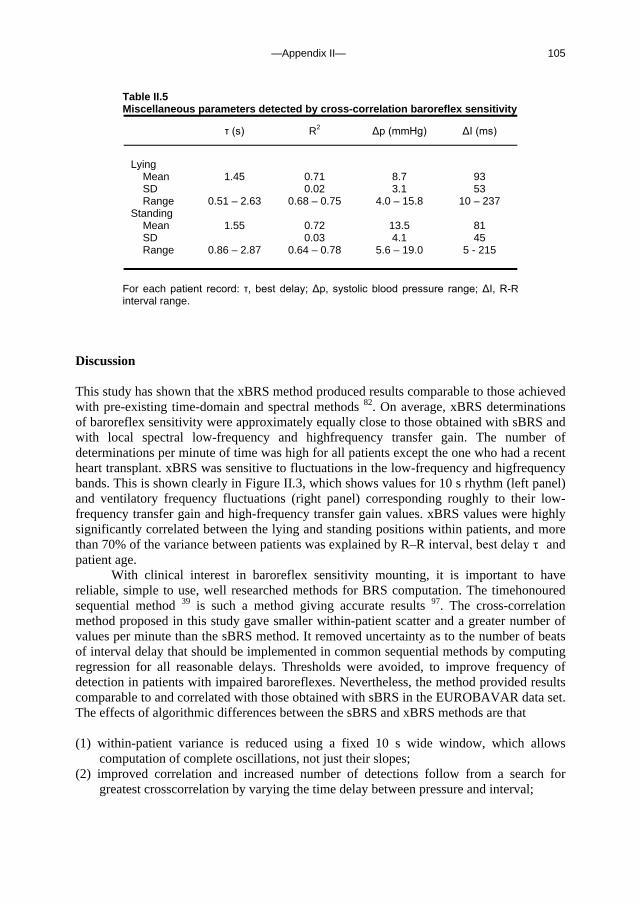
—Appendix II— 105
Table II.5 Miscellaneous parameters detected by cross-correlation baroreflex sensitivity
τ (s) R2 ∆p (mmHg) ∆I (ms)
Lying
Mean 1.45 0.71 8.7 93 SD 0.02 3.1 53 Range 0.51 – 2.63 0.68 – 0.75 4.0 – 15.8 10 – 237
Standing Mean 1.55 0.72 13.5 81 SD 0.03 4.1 45 Range 0.86 – 2.87 0.64 – 0.78 5.6 – 19.0 5 - 215
For each patient record: τ, best delay; ∆p, systolic blood pressure range; ∆I, R-R interval range.
Discussion This study has shown that the xBRS method produced results comparable to those achieved with pre-existing time-domain and spectral methods 82. On average, xBRS determinations of baroreflex sensitivity were approximately equally close to those obtained with sBRS and with local spectral low-frequency and highfrequency transfer gain. The number of determinations per minute of time was high for all patients except the one who had a recent heart transplant. xBRS was sensitive to fluctuations in the low-frequency and higfrequency bands. This is shown clearly in Figure II.3, which shows values for 10 s rhythm (left panel) and ventilatory frequency fluctuations (right panel) corresponding roughly to their low-frequency transfer gain and high-frequency transfer gain values. xBRS values were highly significantly correlated between the lying and standing positions within patients, and more than 70% of the variance between patients was explained by R–R interval, best delay τ and patient age.
With clinical interest in baroreflex sensitivity mounting, it is important to have reliable, simple to use, well researched methods for BRS computation. The timehonoured sequential method 39 is such a method giving accurate results 97. The cross-correlation method proposed in this study gave smaller within-patient scatter and a greater number of values per minute than the sBRS method. It removed uncertainty as to the number of beats of interval delay that should be implemented in common sequential methods by computing regression for all reasonable delays. Thresholds were avoided, to improve frequency of detection in patients with impaired baroreflexes. Nevertheless, the method provided results comparable to and correlated with those obtained with sBRS in the EUROBAVAR data set. The effects of algorithmic differences between the sBRS and xBRS methods are that (1) within-patient variance is reduced using a fixed 10 s wide window, which allows
computation of complete oscillations, not just their slopes; (2) improved correlation and increased number of detections follow from a search for
greatest crosscorrelation by varying the time delay between pressure and interval;
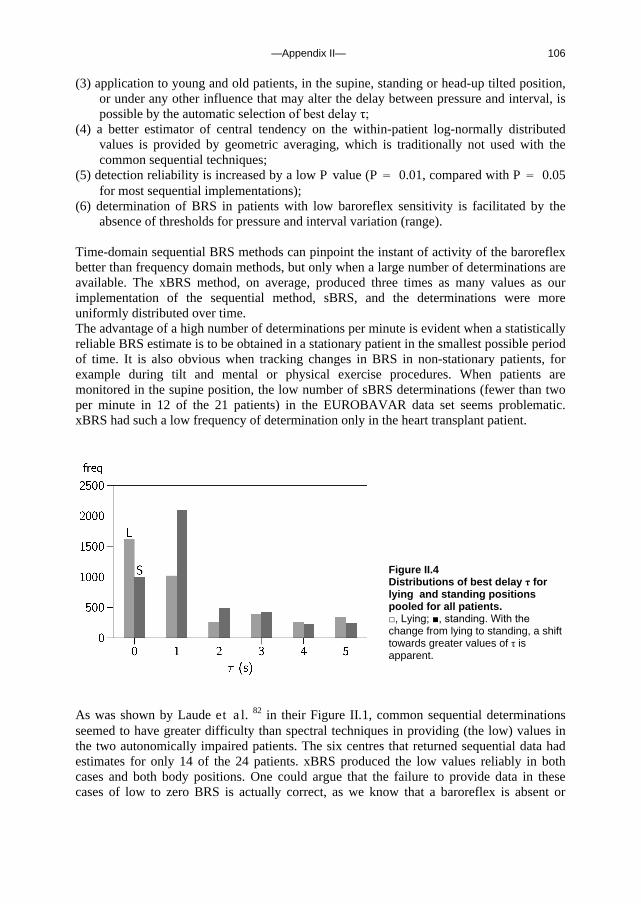
—Appendix II— 106
(3) application to young and old patients, in the supine, standing or head-up tilted position, or under any other influence that may alter the delay between pressure and interval, is possible by the automatic selection of best delay τ;
(4) a better estimator of central tendency on the within-patient log-normally distributed values is provided by geometric averaging, which is traditionally not used with the common sequential techniques;
(5) detection reliability is increased by a low P value (P = 0.01, compared with P = 0.05 for most sequential implementations);
(6) determination of BRS in patients with low baroreflex sensitivity is facilitated by the absence of thresholds for pressure and interval variation (range).
Time-domain sequential BRS methods can pinpoint the instant of activity of the baroreflex better than frequency domain methods, but only when a large number of determinations are available. The xBRS method, on average, produced three times as many values as our implementation of the sequential method, sBRS, and the determinations were more uniformly distributed over time. The advantage of a high number of determinations per minute is evident when a statistically reliable BRS estimate is to be obtained in a stationary patient in the smallest possible period of time. It is also obvious when tracking changes in BRS in non-stationary patients, for example during tilt and mental or physical exercise procedures. When patients are monitored in the supine position, the low number of sBRS determinations (fewer than two per minute in 12 of the 21 patients) in the EUROBAVAR data set seems problematic. xBRS had such a low frequency of determination only in the heart transplant patient.
As was shown by Laude et al. 82 in their Figure II.1, common sequential determinations seemed to have greater difficulty than spectral techniques in providing (the low) values in the two autonomically impaired patients. The six centres that returned sequential data had estimates for only 14 of the 24 patients. xBRS produced the low values reliably in both cases and both body positions. One could argue that the failure to provide data in these cases of low to zero BRS is actually correct, as we know that a baroreflex is absent or
Figure II.4 Distributions of best delay τ for lying and standing positions pooled for all patients. □, Lying; ■, standing. With the change from lying to standing, a shift towards greater values of τ is apparent.
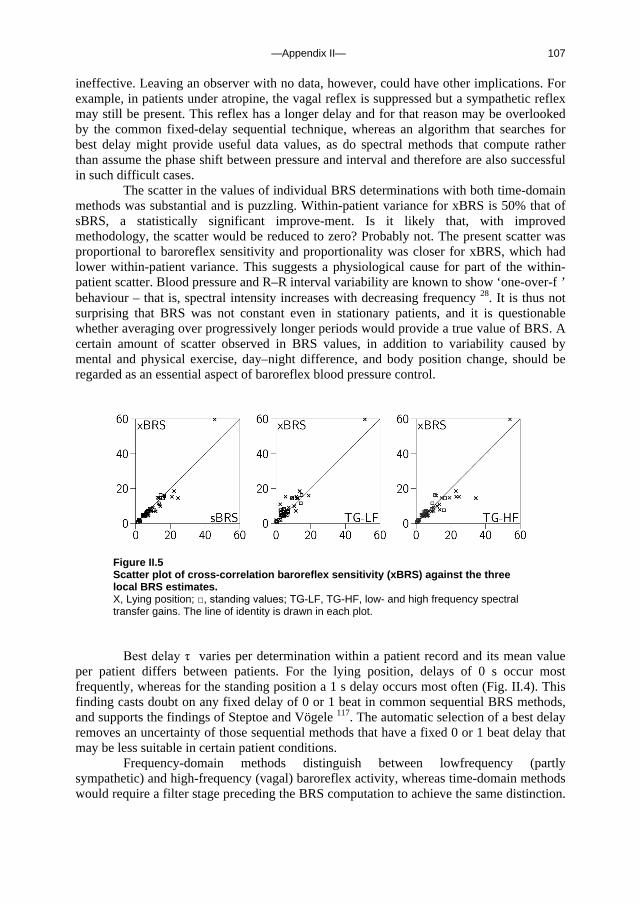
—Appendix II— 107
ineffective. Leaving an observer with no data, however, could have other implications. For example, in patients under atropine, the vagal reflex is suppressed but a sympathetic reflex may still be present. This reflex has a longer delay and for that reason may be overlooked by the common fixed-delay sequential technique, whereas an algorithm that searches for best delay might provide useful data values, as do spectral methods that compute rather than assume the phase shift between pressure and interval and therefore are also successful in such difficult cases.
The scatter in the values of individual BRS determinations with both time-domain methods was substantial and is puzzling. Within-patient variance for xBRS is 50% that of sBRS, a statistically significant improve-ment. Is it likely that, with improved methodology, the scatter would be reduced to zero? Probably not. The present scatter was proportional to baroreflex sensitivity and proportionality was closer for xBRS, which had lower within-patient variance. This suggests a physiological cause for part of the within-patient scatter. Blood pressure and R–R interval variability are known to show ‘one-over-f ’ behaviour – that is, spectral intensity increases with decreasing frequency 28. It is thus not surprising that BRS was not constant even in stationary patients, and it is questionable whether averaging over progressively longer periods would provide a true value of BRS. A certain amount of scatter observed in BRS values, in addition to variability caused by mental and physical exercise, day–night difference, and body position change, should be regarded as an essential aspect of baroreflex blood pressure control.
Figure II.5 Scatter plot of cross-correlation baroreflex sensitivity (xBRS) against the three local BRS estimates. X, Lying position; □, standing values; TG-LF, TG-HF, low- and high frequency spectral transfer gains. The line of identity is drawn in each plot.
Best delay τ varies per determination within a patient record and its mean value
per patient differs between patients. For the lying position, delays of 0 s occur most frequently, whereas for the standing position a 1 s delay occurs most often (Fig. II.4). This finding casts doubt on any fixed delay of 0 or 1 beat in common sequential BRS methods, and supports the findings of Steptoe and Vögele 117. The automatic selection of a best delay removes an uncertainty of those sequential methods that have a fixed 0 or 1 beat delay that may be less suitable in certain patient conditions.
Frequency-domain methods distinguish between lowfrequency (partly sympathetic) and high-frequency (vagal) baroreflex activity, whereas time-domain methods would require a filter stage preceding the BRS computation to achieve the same distinction.
—Appendix II— 108
A limitation of the xBRS method in its present form is that it does not discriminate between oscillations in ventilatory and 10 s rhythm bands. In a recent review 41, Eckberg concluded that ventilatory pressure and interval variability had little to do with baroreflex action, because there is a common cause: the human respiratory gate. This limitation might not be too serious in practice if it is argued that respiratory gating suppresses the baroreflex to a degree depending on ventilatory rate, and is therefore responsible for the lower BRS values found in exercise. BRS determinations on spontaneous fluctuations are, indeed, highly correlated between both spectral bands and between spectral and time-domain estimates, and produce similar values. However, there is no guarantee that such correlation and similarity would be maintained under all circumstances met clinically.
In conclusion, the proposed time-domain, cross-correlation computation of BRS (xBRS) yielded values for BRS to spontaneous systolic pressure and R–R interval variability that were close to those achieved with earlier methods, and including those for the lying to standing ratio, the values of which tended to show less scatter within patients compared with those obtained from the sequential method. xBRS is able to deal with situations in which changes in R–R interval lag behind pressure changes – in the elderly, at high heart rates, or when the baroreflex tends towards sympathetic – because it searches for best delay. Statistically unbiased estimates of central tendency on the log-normal distributions of xBRS values result from geometric averaging. Time resolution is good, with 20 xBRS determinations per minute on average. In autonomically impaired patients with low interval variability and thus baroreflex sensitivity, the absence of thresholds for pressure and interval changes is probably responsible for the ability of the method to provide acceptable results.

—Summary and concluding remarks— 109
Summary and concluding remarks So far we have dealt with the effects of gravity on certain aspects of the circulation. We will now summarise the objectives and the findings of the studies, and provide some concluding remarks. The siphon controversy: integration of concepts The possibility of a siphon in blood flow to and from the brain in standing man is a much-disputed topic. The siphon concept can be demonstrated using a model of rigid and collapsible tubes; a siphon can still operate when the descending limb of the model is partly collapsed. A different model of the blood flow to and from the brain is the ‘vascular waterfall’ concept: flow in the ascending limb is subjected to a hydrostatic gradient, while flow in the descending limb is not. In the waterfall model the descending limb does not assist the ascending limb, therefore there is no siphon. The resistance of the cerebral venous outflow pathway, consisting of two (collapsed) internal jugular veins and a vertebral venous plexus, is approximately 0.055 mmHg.s.ml-1 in standing man. The cerebral vascular resistance, assuming a hydrostatic pressure gradient in the ascending limb, is approximately 4.7 mmHg.s.ml-1; this is 85-fold the resistance of the venous outflow pathway. A siphon facilitating blood flow through the brain is therefore highly unlikely; the brain can be regarded as a throttle (or ‘baffle’) disrupting the continuity that is required for a siphon. Therefore the heart does have to work against gravity, and collapse of internal jugular veins will not measurably affect cerebral blood flow in the presence of a functional venous vertebral plexus pathway. Cerebral venous outflow pathway is posture dependent Internal jugular veins are the major cerebral venous outflow pathway in supine humans. In upright humans the positioning of these veins above heart level causes them to collapse. An alternative cerebral outflow pathway is the vertebral venous plexus. We set out to determine the effect of posture and central venous pressure (CVP) on the distribution of cerebral outflow over the internal jugular veins and the vertebral plexus, using a mathematical model. Input to the model was a data set of beat-to-beat cerebral blood flow velocity and CVP measurements in 10 healthy subjects, during baseline rest and a straining (Valsalva) manoeuvre in the supine and standing position. The model, consisting of 2 jugular veins, each a chain of 10 units containing non-linear resistances and capacitors, and a vertebral plexus containing a resistance, showed blood flow mainly through the internal jugular veins in the supine position, but mainly through the vertebral plexus in the upright position. A Valsalva manoeuvre, performed while standing, completely re-opened the collapsed jugular veins. Results of ultrasound imaging of the right internal jugular vein cross-sectional area at the level of the laryngeal prominence in six healthy subjects, before

—Summary and concluding remarks— 110
and during a Valsalva manoeuvre in both body positions, correlated highly with model simulation of the jugular cross-sectional area (R2=0.97). The results suggest that the cerebral venous flow distribution depends on posture and CVP: in supine humans the internal jugular veins are the primary pathway. The internal jugular veins are collapsed in the standing position and blood is shunted to an alternative venous pathway, but a marked deliberate increase in CVP while standing completely re-opens the jugular veins. Model of end-tidal CO2 during posture change In man assuming the upright position, end-tidal PCO2 (PETCO2) decreases. With the rising interest in cerebral autoregulation during posture change, which is known to be affected by PETCO2, we sought to determine the factors leading to hypocapnia during standing up from the supine position. To study the individual contribution of an increase in tidal volume (VT) and breathing frequency, a decrease in stroke volume (SV), a ventilation-perfusion (V/Q) gradient and an increase in functional residual capacity (FRC) to hypocapnia in the standing position we developed a mathematical model of the lung to follow breath-to-breath variations in PETCO2. A gravity-induced apical to basal V/Q gradient in the lung was modelled using 9 lung segments. We tested the model using an eight-subject data set with measurements of VT, pulmonary O2 uptake and breath-to-breath lumped SV. On average, the PETCO2 decreased from 40 mmHg to 36 mmHg after 150 s standing. Results show that the model is able to track breath-to-breath PETCO2 variations (r2 = 0.74, p<0.05). Model parameter sensitivity analysis demonstrates that the decrease in PETCO2 during standing is due primarily to increased VT, and transiently to decreased SV and increased FRC; a slight gravity-induced V/Q mismatch also contributes to the hypocapnia. The influence of cardiac output on hypocapnia in the standing position was verified in experiments on human subjects, where first breathing alone, then breathing, FRC and V/Q were controlled. Effects of nitroglycerine in routine tilt testing We set out to determine the effect of sublingual nitroglycerine (NTG), as used during routine tilt testing in patients with unexplained syncope, on hemodynamic characteristics and baroreflex control of heart rate (HR) and systemic vascular resistance (SVR). NTG is used in tilt testing to elicit a vasovagal response by venous dilation and enhance pooling. NTG is lipophilic and readily passes cell membranes, and animal studies suggest a sympatho-inhibitory effect of NTG on circulatory control. Tilt testing was conducted in 39 patients presenting with suspected vasovagal syncope (age 36±16 years, 18 female). Patients were otherwise healthy and free of medication. Before loss of consciousness set in, imminent syncope was cut short by tilt back or counter-manoeuvres. Finger arterial pressure was monitored continuously (Finapres). Left ventricular stroke volume (SV) was computed from the pressure pulsations (Modelflow). Spontaneous baroreflex control of HR was estimated in the time and frequency domains. During tilt testing 22 patients developed presyncope. Following NTG administration but prior to presyncope, SV and cardiac output decreased (p<0.001), while SVR and HR increased (p<0.001) in all patients. Arterial pressure was initially maintained. Baroreflex sensitivity decreased after NTG. On Cox Regression Analysis, the occurrence of a vasovagal response was related to the drop in stroke volume following NTG (hazard ratio 0.86; p=0.005). The cardiovascular response to
—Summary and concluding remarks— 111
NTG is similar in vasovagal and non-vasovagal patients, but more pronounced in tilt positives. The NTG-facilitated presyncope appears to be cardiac output mediated, and there is no evidence of NTG-induced sympathetic inhibition. Orthostatic blood pressure control before and after space flight Orthostatic tachycardia and hypotension after space flight are thought to be primarily due to reductions in plasma volume and increased pooling of blood in the legs. We set out to determine time- and frequency domain baroreflex (BRS) function during preflight baseline, preflight venous occlusion by thigh cuff inflation, and post flight orthostatic stress; testing the hypothesis that a reduction in central blood volume mimics the postflight orthostatic response. In 5 cosmonauts we measured finger arterial pressure in supine and upright positions. Preflight measurements were repeated using venous occlusion thigh cuffs; postflight sessions were within 3 days after return from 10-11 day spaceflight. BRS was determined by spectral analysis and by PRVXBRS, a time-domain BRS computation method. All cosmonauts completed the protocols. Postflight (compared to preflight) standing resulted in increased heart rate, decreased cross-spectral gain at low frequency (0.06-0.15 Hz), and a shift in time-domain determined IBI to SBP lag, Tau, toward higher values. None of these postflight results were mimicked during preflight venous occlusion. In conclusion, time-domain BRS computation provides an improved time-resolution indication of BRS; distribution of Tau is a novel way of expressing IBI to SBP lag and might indicate increased sympathetic tone during standing after space flight. Preflight venous occlusion does not mimic the postflight orthostatic response. A fast tilt table for sinusoidal tilts Cardiovascular response to fast posture change can be used to model individual orthostatic response under normal circumstances and after space flight. We set out to construct a computer controlled tilt table suitable for repeated sinusoidal tilt motion as well as fast, single head-up tilt (HUT). The movement profile of the table should prevent muscle tensing and limit vestibular stimulation. On the new table, twenty healthy subjects underwent a protocol of fast HUT and sinusoidal tilt motion at 2.5 tilts per minute. Blood pressure (BP) was measured non-invasively. Time domain dynamic response to HUT as well as frequency domain response to sinusoidal tilts were derived from the beat-to-beat BP and from interbeat-interval (IBI) series. Tilt motion did not induce dizziness and was experienced by all subjects as smooth. The systolic BP response to fast HUT correlated mildly with the systolic BP spectral power at the sinusoidal tilt frequency (R=0.47). The IBI response to fast HUT correlated well with the IBI power at the sinusoidal tilts frequency (R=0.74). In this study we present a computer controlled tilt table capable of fast posture change and sinusoidal tilts. An exploratory protocol demonstrated that the table is suitable for obtaining cardiovascular response to posture change for modeling purposes.
—Summary and concluding remarks— 112
Time-domain cross-correlation baroreflex sensitivity Objectives were to test a new method (cross-correlation baroreflex sensitivity, xBRS) for the computation of time-domain baroreflex sensitivity on spontaneous blood pressure and heart interval variability using the EUROBAVAR data set. We applied xBRS to the 42 records in the EUROBAVAR data set, obtained from 21 patients in the lying and standing positions. One patient had a recent heart transplant and one was diabetic with evident cardiac autonomic neuropathy. xBRS computes the correlation between beat-to-beat systolic blood pressure and R–R interval, resampled at 1 Hz, in a sliding 10 s window, with delays of 0–5 s for interval. The delay with the greatest positive correlation is selected and, when significant at P = 0.01, slope and delay are recorded as one xBRS value. Each 1 s of the recording is the start of a new computation. Non-parametric tests are used. With patients in the lying position, xBRS yielded a value of 12.4 ms/mmHg compared with the EUROBAVAR sequential 16.2 ms/mmHg, and for the standing positions the respective values were 6.2 ms/mmHg and 6.7 ms/ mmHg, giving lying to standing ratios of 1.96 and 2.10, respectively. xBRS yielded results for all files, with 20 values per minute on average at a lower within-patient variance. Best delays were 0, 1 and 2 s, and the delay increased by 102 ms when the patient was in the standing position. The xBRS method was successful in the patients with diabetes and the heart transplant. The xBRS method should be considered for experimental and clinical use, because it yielded values that correlated strongly with and were close to the EUROBAVAR averages, yielded more values per minute, had lower within-patient variance and measured baroreflex delay. Concluding remarks Having summarised these studies, the question arises what the above findings teach us about the effects of gravity on brain perfusion and orthostatic tolerance. Brain perfusion and CO2 Cerebral blood flow is affected by PCO2: when arterial PCO2 drops, such as results from hyperventilation, cerebrovascular resistance increases. On standing up, end-tidal PCO2 (PETCO2) is known to decrease, which seems disadvantageous for total brain blood flow. PETCO2 in physiological studies is commonly described as related exclusively to respiration; variations in PETCO2 are attributed to changes in functional residual capacity, breathing frequency and tidal volume. On standing up, however, we found the reduction in PETCO2 to be not only due to (relative) hyperventilation, but also to be a consequence of the effects of gravity on the circulation: both a decrease in cardiac output and a hydrostatic gradient in the blood supply to different lungs segments lead to a reduction in PETCO2. In other words, PETCO2 is a circulatory as well as a respiratory parameter, and when in standing man gravity affects the circulation, it alters PETCO2. We can say that PETCO2 is (partly) determined by the circulation and it, in turn, (partly) determines the circulation. Brain perfusion and collapse of jugular veins Before discussing the effects of gravity on the jugular veins and its consequences for cerebral blood flow, first a remark about a model for studying the effects of gravity on the circulation: the giraffe. The giraffe has been studied intensely to understand physiological

—Summary and concluding remarks— 113
adaptations to a huge heart-to-head distance. The giraffe, with its neck spanning a 2-meter hydrostatic gradient in arterial pressure, is still able to maintain adequate brain perfusion. Although this makes it a unique animal for studying adaptations to cope with gravity, for the same reasons it is a confusing model for understanding human physiology. Aside from the obvious difference in heart-to-head distance, humans lack the multitude of jugular valves, and the specific vascular adaptations of the giraffe, making conclusions about giraffe physiology difficult to apply directly to understand human physiology. Although the internal jugular veins in standing man are collapsed, there is an alternate venous drainage pathway for the brain: the vertebral venous plexus. Because the vertebral venous plexus is suspended to the vertebral column, it can withstand a transmural pressure gradient and it is therefore not likely to collapse. We conclude from this that under normal circumstances i.e. with bilateral functional internal jugular veins, and without obstruction of the vertebral venous plexus, in upright humans cerebral blood flow is facilitated nor impeded by effects of gravity on the (extracranial) venous outflow. Cerebrovascular resistance and height-corrected arterial pressure at brain level therefore determine cerebral blood flow. In other words, the effects of gravity on the circulation do not endanger cerebral blood flow by collapse of venous vessels in the neck, because there is a patent alternate pathway. The (modest) role of heart rate regulation in orthostatic tolerance Baroreflex sensitivity is an immensely popular parameter in clinical studies as well as in physiological studies on cardiovascular response to stimuli. The actual role of baroreflex sensitivity (i.e. the interbeat-interval /systolic blood pressure variability relation) in orthostatic tolerance is limited. Tachycardia alone is not sufficient in preventing a vasovagal response. The popularity of measuring baroreflex sensitivity in terms of heart rate and arterial pressure is to due to its accessibility, and the information it provides on the sympathetic and parasympathetic influence on heart rate. It is does not determine orthostatic tolerance (subjects with a high baseline BRS do not necessarily have a good orthostatic tolerance). Orthostatic tolerance challenged by gravity On standing up, fluid shifts result in pooling of blood in abdomen and leg vessels, and a reduction in venous return to the heart. In astronauts returning from space flight, orthostatic tachycardia and hypotension are commonly observed. [The exception proves the rule: post-flight classic vasovagal syncope with a sudden drop in heart rate to 20 beats/min, rather than postural tachycardia and a gradual onset of prodromal symptoms, has been reported 91; of several hundred stand/tilt tests on landing day, this was the first time such a response was seen by the investigators.] Excessive venous pooling and volume depletion are believed to be the main cause of this. Our own observations of postflight cosmonauts also indicate an increased heart rate when standing. Leg crossing and muscle tensing, which were performed by one cosmonaut, led to a rapid recovery of pulse pressure; this observation supports the concept of excessive venous pooling and reduced cardiac output as the mechanism leading to postflight reduced orthostatic tolerance.
Our findings on sublingual nitroglycerine (NTG), which enhances venous pooling, is that it leaves baroreflex control of blood pressure and heart rate intact in patients prone to syncope. We found the sympathetic influence on heart rate and total peripheral resistance to be increased after administration of low-dose NTG, due to a reduction in stroke volume (and cardiac output). We could therefore consider using NTG to mimic a post-spaceflight
—Summary and concluding remarks— 114
circulatory state. Administering NTG during a routine tilt test in pre-flight astronauts could well provide a valuable test (of orthostatic tolerance) resembling the post-spaceflight condition, and would be considerably faster and safer than simulated microgravity such as bed-rest studies. This could be a step towards a pre-flight test to determine individual post-flight orthostatic tolerance. This knowledge could then be used to tailor countermeasures to individual needs.
Epilogue This project was originally designed to test how candidate astronauts before flight cope with dynamic stresses imposed by manoeuvres that induce changes in blood pressure and blood supply to the brain. The test results were to be used to predict orthostatic tolerance of astronauts after spaceflight.
The study was not conducted as described in the project proposal. The Columbia crew came to the AMC twice for pre-flight tests, but never returned from their mission. The post-spaceflight data presented in Chapter 5 are from 5 cosmonauts who participated in one of 3 different Soyuz missions. These results, together with two studies on the effects of gravity under physiological conditions (Chapter 2 and 3) and a study on the effects of nitroglycerine in syncope patients (Chapter 4), do contribute to the present understanding of mechanisms leading to reduced orthostatic tolerance. Pre-flight restriction of venous return during head-up tilt is not an adequate model for the expected post-flight orthostatic response. The present findings do suggest a potential for use of sublingual nitroglycerine to test candidate astronauts’ orthostatic tolerance. Furthermore, muscle tensing and leg-crossing while standing might prove a useful manoeuvre to combat post-flight orthostatic intolerance.
—Nederlandse samenvatting— 115
Nederlandse samenvatting Ons hart pompt het bloed door de vaten. Dit rondpompen van bloed is nodig om weefsels en organen in leven te houden. Vooral de hersenen zijn afhankelijk van een regelmatige toevoer van bloed. Als het rondpompen ophoudt, zal dit na ongeveer 5 seconden al bewustzijnsverlies tot gevolg hebben. Dit gebeurt bij flauwvallen. Flauwvallen heeft alles te maken met een (meestal plotseling) tekortschieten van de bloedcirculatie.
Zwaartekracht speelt een rol bij het circuleren van bloed: er treedt een herverdeling van bloed op als we gaan staan. Door zwaartekracht is er meer bloed in de benen en de buik bij (langdurig) staan; het bloed zakt naar beneden. En iemand die op z’n hoofd staat krijgt een rood, dik gezicht, dit komt ook omdat het bloed naar beneden zakt. Deze gevolgen van zwaartekracht kunnen het moeilijk maken om langdurig stil te blijven staan. Als er veel bloed in de onderste lichaamshelft achterblijft, komt er minder bloed terug naar het hart. Dan kan het hart minder rondpompen. Het lichaam zorgt dan voor allerlei aanpassingen, zoals het krachtiger en sneller pompen van het hart, en samenknijpen van bloedvaten. Die aanpassingen zijn nodig om toch nog genoeg bloeddruk te houden om de weefsels, en in de eerste plaats de hersenen, van bloed te voorzien.
Dit proefschrift gaat over de gevolgen van zwaartekracht voor de bloedcirculatie bij de mens, in het bijzonder bij houdingsverandering. Het gaat dan vooral om opstaan vanuit de liggende houding. Verschillende hoofdstukken behandelen onderdelen van de circulatie, en omstandigheden waarin de bloedcirculatie tekort kan schieten. In een tweetal studies wordt een (wiskundig) model gepresenteerd. De modellen dienen hier om een hypothese te toetsen, om zo inzicht te krijgen in een bepaald fenomeen. Met uitzondering van hoofdstuk 4, waar het gaat om patiënten die vaak flauwvallen, gaat het onderzoek vooral over gezonde mensen. Hoofdstuk 5 gaat over gezonde mensen in uitzonderlijke omstandigheden, namelijk kosmonauten na ruimtevaart. Het is bekend dat het na ruimtevaart moeilijk is om lang stil te blijven staan. Zelfs 10 minuten staan geeft dan bij 1 op 3 kosmonauten al problemen zoals licht in het hoofd voelen en duizeligheid. Deze circulatieproblemen na ruimtevaart zullen zich na verloop van tijd spontaan herstellen. In Appendix I wordt een computer gestuurde kieptafel besproken. Deze tafel, ontwikkeld door Dr. E.M. Akkerman en anderen, is bij uitstek geschikt voor het bestuderen van effecten van zwaartekracht bij houdingsverandering. Appendix II behandelt een methode, ontwikkeld door Prof. K.H. Wesseling, om de kwaliteit van de bloeddrukregeling te bepalen. Het snelste onderdeel van de bloeddrukregeling is de regeling van de hartslag (bij een bloeddruk daling, zoals bij gaan staan, zal de hartslag versnellen om de bloeddruk daling tegen te gaan. Probeer maar). De methode in Appendix II berekent de mate van verandering in hartslag per verandering in bloeddruk. Hoofdstuk 1 geeft na een korte inleiding een verhandeling over de bloedvoorziening van het hoofd. De vraag of de bloedstroom naar en van het hoofd werkt als een hevel (of niet), heeft geleid tot veel onenigheid in de literatuur hierover. In de staande mens stroomt het bloed ‘bergopwaarts’ naar het hoofd toe. Als de circulatie naar het hoofd werkt als een hevel, wordt het bloed omhoog getrokken door het bloed dat ‘bergafwaarts’ uit de hersenen
—Nederlandse samenvatting— 116
terug naar het hart stroomt. (Vergelijk dit met een hele lange trein die over een klein heuveltje rijdt: als een deel (vooraan) van de lange trein bergafwaarts rijdt terwijl een deel (achteraan) bergopwaarts rijdt, is de heuvel geen belemmering omdat bergopwaartse en bergafwaartse delen van de trein verbonden zijn.) Als de bloedstroom naar het hoofd werkt als een hevel, wordt de bloedstroom door de hersenen dus niet gehinderd door zwaartekracht in de staande houding. Wij suggereren een ander model: het ‘smoorprop’ model. Als de kleine vaten in de hersenen werken als een ‘smoorprop’, wordt het bloed niet ‘bergopwaarts’ getrokken door de ‘bergafwaartse’ bloedstroom. Een hevel is alleen mogelijk als opstijgende en afdalende stroomtrajecten verbonden zijn. We pleiten er voor dat de hersenenvaten, die een hoge weerstand, een complexe vaatstructuur en talloze vertakkingen hebben, een onderbreking van de hevel zijn: een smoorprop. Volgends dit model wordt de bloedstroom door de hersenen wel belemmerd in de staande houding, door de daling van de druk op het niveau van de hersenen. Bij de interpretatie van meetgegevens van bloedstroom door de hersenen, moet er dan ook rekening gehouden worden met de lichaamshouding. Hoofdstuk 2 is een studie naar hoe aderlijk bloed (veneus bloed) uit de hersenen terugkeert naar het hart. Het is bekend dat grote aderen in de hals (vv jugulares internae) de afvoerweg zijn van dit veneuze bloed. Bloed dat terugkeert naar de rechterharthelft heeft, als het bij het hart komt, een druk van ongeveer 0. Omdat bij de staande mens de nek zo’n 40 cm boven het hart zit, zou de druk in die grote aderen in de hals onder de nul zijn. Vergelijk dit met een rietje vol water: als je niet wil dat het water uit het rietje stroomt aan de onderkant, moet je er aan de bovenkant aan zuigen. Als het rietje een slappe structuur heeft, zal het dichtvallen aan de bovenkant. Onze hypothese was dat in de staande mens, de druk in de grote vaten in de hals zo laag is, dat ze zullen dichtvallen. Aderen hebben namelijk een slappe wand. Bloed kan ook nog via een andere afvoerweg terug naar het hart: de vertebrale veneuze plexus. Dit is een netwerk van kleine vaatjes dat in, om en langs het wervelkanaal ligt. Deze vaatjes zijn nauw verbonden met botstrukturen. Deze afvoerweg zal daarom niet zo snel samenvallen. We hebben een wiskundig model gemaakt van beide afvoerwegen (de slappe aderen in de hals en de plexus), die parallel lopen. Vervolgens hebben we meetgegevens gebruikt om met het model te voorspellen hoe het veneuze bloed zich verdeelt over de grote venen en de plexus, tijdens liggen, staan en persen. De modelsimulaties wezen op een herverdeling van bloedstroom bij gaan staan: in de liggende houding stroomt het bloed terug naar het hart via de grote venen in de hals, in staande houding zijn die aderen bijna helemaal dichtgevallen en stroomt het bloed vooral via de plexus. Bij persen zijn de aderen in de hals weer wijd opengesperd. We hebben echobeeldvorming gebruikt voor het bevestigen van de modelvoorspellingen ten aanzien van het al dan niet dichtvallen van de venen in de hals. Met echo hebben we het oppervlak van de dwarsdoorsnede van de grote halsaderen bepaald bij liggen, staan en persen. Deze beelden klopte goed met de modelvoorspellingen. Een lage koolzuur (CO2) concentratie in het slagaderlijke bloed kan duizeligheid tot gevolg hebben, zoals bij hyperventilatie. Bij opstaan daalt de CO2 concentratie in de uitademinglucht. Hoofdstuk 3 is een studie naar hoe deze daling, technisch aangeduid als hypocapnie, tot stand komt. CO2 is een product van de stofwisseling. Het wordt afgevoerd in het bloed en komt voor als gas in de uitademinglucht. Veranderingen in CO2 concentratie worden meestal beschouwd als een weerspiegeling van het adempatroon (b.v. een daling in CO2 kan wijzen op een versnelde ademhaling). De hypocapnie bij gaan staan is te wijten
—Nederlandse samenvatting— 117
aan het groter worden van het longvolume: dit is een mechanisch gevolg van staan bij de mens. De buikinhoud trekt wat aan het middenrif; een grotere longinhoud en grotere ademteugen zijn de gevolgen. Maar veranderingen in bloedcirculatie bij gaan staan zijn ook van invloed op de hypocapnie. De hoeveelheid bloed die rondgepompt wordt per minuut (het ‘hartminuutvolume’) is staand minder dan liggend. Er stroomt in de staande houding minder CO2-rijk bloed door de longen. Gepaard met flinke ademteugen en een toegenomen longvolume draagt dit bij aan de hypocapnie. Bovendien is er in de staande houding een verschil in bloedvoorziening van verschillende longdelen. De bloedstroom door de longtoppen is gering, terwijl deze onderin de long fors is. Dit draagt ook bij aan de CO2 daling bij gaan staan. We hebben deze gelijktijdige ademhaling- en bloedsomloop veranderingen in een wiskundig model gesimuleerd. Alle bovengenoemde veranderingen blijken significant bij te dragen aan hypocapnie. Het grotere longvolume en afgenomen hartminuutvolume zorgen voor CO2-daling direct na gaan staan, na wat langer staan leveren vooral de toegenomen teugvolumes een belangrijke bijdrage aan de hypocapnie. Ook bij gezonde mensen onder normale omstandigheden (liggen, staan) is de uitademing CO2 niet alleen gerelateerd aan het adempatroon maar ook aan de bloedcirculatie. Sommige mensen vallen vaak flauw. Als wegrakingen vaak voorkomen, moeten bepaalde neurologische- en hartaandoeningen eerst uitsloten worden. Daarna kan de diagnose ‘gewoon flauwvallen’ meestal gesteld worden aan de hand van het verhaal van de patiënt (en van degenen die aanwezig waren tijdens de wegraking). Een kanteltafel onderzoek kan bij deze patiënten worden verricht om flauwvallen uit te lokken. Dit is nuttig om de voortekenen van de wegraking te herkennen (‘prodromal symptoms’ zoals zweten, misselijkheid, licht in het hoofd). De patiënt kan zo leren op tijd maatregelen te nemen om het flauwvallen af te wenden (benen kruisen en spieren aanspannen, of anders voorovergebogen gaan zitten of hurken). Bij kanteltafel onderzoek wordt gevraagd een tijd lang ontspannen overeind te blijven staan. Lang niet altijd lukt het om met kanteltafel onderzoek flauwvallen uit te lokken bij deze patiënten. Daarom wordt er vaak nitroglycerine (een vaatverwijder) onder de tong gegeven, na 20 min staan. Hoofdstuk 4 gaat over het gebruik van nitroglycerine bij kanteltafel onderzoek. De vraagstelling is hoe nitroglycerine het flauwvallen uitlokt: doordat de aderen slapper worden (veneuze dilatatie, dit is een bekend effect van nitroglycerine) of ook doordat de (hart- en vaat)reflexen geremd worden. Nitroglycerine is een stof die stikstofmonoxide (NO) afsplitst, en van NO is het bekend dat het effect heeft op de zenuwen. De resultaten van deze studie wijzen niet op een reflexremmend effect van nitroglycerine, althans niet bij lage dosering. Integendeel, na nitroglycerine stijgen hartfrequentie en totale vaatweerstand, terwijl de bloeddruk constant blijft vóórdat bij 22 van de 39 patiënten het flauwvallen begint. We vonden dat het slagvolume van het hart daalde in de eerste drie minuten na nitroglycerine toediening, en die daling was het hevigst bij degenen die het snelste flauwvielen (er waren nog geen voortekenen in de eerste 3 minuten na nitroglycerine toediening). We concluderen uit deze studie dat nitroglycerine flauwvallen uitlokt doordat het hartminuutvolume afneemt, niet door remmen van de reflexen. Na ruimtevaart hebben astronauten vaak moeite met een tijd rechtop staan. Het is gebleken dat het na ruimtevaart moeilijk is om de bloeddruk te handhaven tijdens staan. Er is vaak een beeld van kleine slagvolumina van het hart en een hele hoge hartfrequentie, gepaard met klachten van duizeligheid en een licht gevoel in het hoofd. Er zijn aanwijzigen dat deze symptomen vooral het gevolg zijn van afgenomen bloedvolume na ruimtevaart. We hebben

—Nederlandse samenvatting— 118
in Hoofdstuk 5 onderzocht of het beeld na ruimtevaart, zoals hierboven beschreven, nagebootst kan worden vóór ruimtevaart door het centraal bloedvolume te verkleinen. Om dit te bereiken hebben we bovenbeenmanchetten gebruikt. Deze werden opgeblazen met een druk waarbij wèl bloed de benen ingepompt wordt, maar het iets moeilijker terugkomt naar het hart (druk tussen aderlijke en slagaderlijke druk). Zo wordt er extra volume in de benen vastgehouden, terwijl de terugvloed naar het hart afneemt. Vijf kosmonauten hebben deelgenomen aan de studie. We hebben ze alle vijf één keer vooraf gemeten op het AMC; liggend en staand met en zonder beenmanchetten. De volgende meting was binnen 5 dagen na terugkeer van ruimtevaart (ruimtereizen duurde 8 tot 11 dagen). De resultaten wijzen erop dat de reactie op staan na ruimtevaart (zoals o.a. een hoge hartfrequentie) niet nagebootst kan worden met beenmanchetten vóór de vlucht. Wel bleek de nieuwe methode om baroreflex te berekenen (xBRS, zoals beschreven in Appendix II), extra inzicht te geven in de kwaliteit van de bloeddrukregeling, wegens de hoge tijdsresolutie van baroreflex gevoeligheid schattingen, en de bescheiden benodigde meetgegevens (alleen slag-op-slag niet-invasieve bloeddruk). We zagen bij één astronaut, die zijn benen kruiste en spieren aanspande tijdens staan, een toename van polsdruk en een herstel van (zeer hoge) hartfrequentie. Dit biedt mogelijkheden voor benen kruisen als manoeuvre om bloeddrukdalingen bij staan na ruimtevaart tegen te gaan.

—Dankwoord— 119
Dankwoord Er zijn een aantal mensen die ik zou willen bedanken voor hun bijdrage aan dit onderzoek, om te beginnen Prof. dr. Jan Hindrik Ravesloot die de deur naar de afdeling Fysiologie voor mij heeft opengezet en bereid was als mijn promotor op te treden. Dr. John Karemaker, co-promotor en begeleider, wil ik bedanken voor vier uiterst leerzame jaren; zonder je fysische en fysiologische bijscholing, nauwkeurige analyse en je vertrouwen was van dit onderzoek niets terecht gekomen. Dr. Johannes van Lieshout, co-promotor en begeleider wil ik bedanken voor het enthousiasme en het altijd bereid zijn mijn schrijfsels zorgvuldig door te nemen, na te rekenen, referenties te vinden, kant en klare datasetjes aan te leveren en de stemming er in te houden. Drs. Wim Stok was de technische ondersteuning van dit onderzoek, dankzij Wim heb ik nooit hoeven panieken over de opstelling, over data analyse of over software. Dit onderzoek is uitgevoerd in het CRIA-32 deelprogramma ‘Fysiologie en Pathofysiologie van de Circulatie’, aangevoerd door Dr. Wouter Wieling, die ik dan ook wil bedanken niet alleen voor ‘supportiveness’ in het algemeen maar ook voor de mogelijkheid mee te doen aan patiëntgebonden onderzoek in de ‘syncope-unit’. Van deze werkgroep hebben vooral Berend Westerhof, Rogier Immink, Sander Bogert en Ilja Guelen bijgedragen aan dit onderzoek. Ik had de eer samen te mogen werken met Prof. Karel Wesseling, die met het programma xBRS een enorme bijdrage heeft geleverd aan dit proefschrift.
Van de afdeling Fysiologie heeft Dr. Ronald Wilders de eerste publicatie mogelijk gemaakt. Klaske van Heusden, inmiddels niet meer student maar Ir. van de ‘Systems and Control Group’ van Werktuigbouwkunde, Technische Universiteit Delft, heeft bijna twee jaar gewerkt aan een nieuw bloeddrukmodel om respons op houdingsverandering te simuleren. Ze heeft daarnaast nog tijd gevonden om mij bijlessen te geven in Simulink (Matlab) en was een enorme bron van kennis van fysiologische modellen en techniek. Bij het ruimtevaart onderzoek waren verschillende teams betrokken die verantwoordelijk waren voor organisatie, apparatuur, planning, veiligheid en financiering. Daarom wil ik Stichting Ruimte Onderzoek Nederland (SRON), de European Space Agency (ESA) en de Russian Institute for Biomedical Problems bedanken voor het mogelijk maken van dit onderzoek.