postsecondary and labor force transitions among …nces.ed.gov/pubs2011/2011234.pdf archive.php)...
TRANSCRIPT

ISSUE TABLES U.S. DEPARTMENT OF EDUCATION JANUARY 2011 NCES 2011-234
Postsecondary and Labor Force Transitions Among
Public High School Career and Technical Education
Participants
This report was prepared for the National Center for Education Statistics under Contract No. ED-07-CO-0104 with MPR Associates, Inc. Mention of trade names, commercial products, or organizations does not imply endorsement by the U.S. Government. These Issue Tables were authored by Vera Bersudskaya and Xianglei Chen of MPR Associates, Inc. The NCES Project Officer was Lisa Hudson. For questions about content or to view this report online, go to http://nces.ed.gov/pubsearch/pubsinfo.asp?pubid=2011234.
Career and technical education (CTE) is
a significant component of high school
education. For the last several decades,
more than 90 percent of public high
school graduates have earned at least
some credits in CTE, with graduates
from the class of 2005 earning an aver-
age of 4.0 CTE credits (Hudson and
Laird 2009; Levesque 2003; Levesque et
al. 2008; Tuma 1996).1 As demand for a
high-skill workforce has increased, re-
forms have focused on changing high
school CTE from an alternative to the
college preparatory curriculum to an
educational pathway for all students
that connects high schools, colleges,
and the workforce (Kazis 2005; Lekes et
al. 2007; Silverberg et al. 2004).
This set of Issue Tables provides infor-
mation on the transition of CTE partici-
pants into postsecondary education
and the labor market during the first 2
years after their high school gradua-
tion. In these tables, CTE participants
are identified based on the courses
they took in high school. The National
Center for Education Statistics (NCES)
classifies the courses listed in high
school transcripts into various subject
areas (mathematics, science, social stu-
dies, and so on) using the Secondary
School Taxonomy (SST) (Bradby and
Hudson 2007). The SST divides CTE into
three major categories—family and
consumer sciences education, general
labor market preparation, and occupa-
tional education,2 with occupational
education further divided into 21 spe-
cific occupational areas (business man-
agement, marketing, manufacturing,
and so on). To ensure adequate sam-
ples for the analysis presented here,
the 21 occupational program areas in
the SST are aggregated into the follow-
ing 12 broad areas:
• agriculture and natural resources
• business
• communications and design
• computer and information sciences
• construction and architecture
• consumer and culinary services
• engineering technologies
• health sciences
• manufacturing
• marketing
• public services
• repair and transportation
The Issue Tables focus on occupational
coursetaking because this is the part of
the CTE curriculum that provides stu-
dents with the technical skills neces-
sary for entering the labor market, and
it is also the largest of the three CTE
curricular areas.3 The tables include in-
formation on graduates who earned
different numbers of occupational cre-
dits, and on occupational concentra-

2
tors. Occupational concentrators are
defined in two ways: students who
earned at least 2.0 credits in any one of
the 12 occupational areas listed above,
and students who earned at least 3.0
credits in any one of the 12 occupa-
tional areas.
Table 1 presents the percentage of
students from the class of 2004 who
concentrated in occupational educa-
tion during high school and who
earned different numbers of occupa-
tional credits.
Table 2 displays data on the transition
of CTE students into postsecondary
education and the labor force within 2
years after high school graduation.
Tables 3 through 6 provide information
about students who enrolled in post-
secondary education, with a focus on
their enrollment characteristics, persis-
tence, and undergraduate major.
Tables 7 through 10 present data on
CTE students’ employment, including
their labor force status, average hourly
wage, and occupation.
Table 11 shows the percentage of CTE
concentrators who were pursuing a
major or an occupation related to their
high school CTE concentration area.
DATA The analyses in these Issue Tables are
based on data from the Education
Longitudinal Study of 2002
(ELS:2002/06), the most recent NCES
longitudinal survey providing data on
students’ paths through and out of
high school. The ELS:2002/06 base-year
survey was conducted in spring 2002
with a nationally representative sample
of 10th-graders. These cohort mem-
bers were surveyed again in spring
2004, when most were seniors in high
school, and again in 2006, when most
had been out of high school for 2 years.
In 2004, high school transcripts cover-
ing 4 academic years (grades 9−12)
were also collected for all students.
Consistent with previous NCES reports
on CTE (Hudson and Laird 2009; Leves-
que 2003; Levesque et al. 2008), the
ELS:2002/06 sample used in these
tables is restricted to public high
school graduates.
TECHNICAL NOTES
Confidence Intervals
Definition
The confidence interval (CI) is one way
of expressing the uncertainty of a sam-
ple estimate due to sampling variation.
Confidence intervals (with a lower and
upper bound) for a sample estimate
can be constructed such that if we
drew repeated samples from the same
population many times, we would
expect a certain percentage of the es-
timates from these samples to fall with-
in the interval. For example, a 95
percent confidence interval for an es-
timate is constructed and expressed as:
(1) ( 1.96 1.96 )i i i iX S X X S− < < +
where iX is the estimated mean of the
specific (ith X) sample being used, is
any of the estimated means from poss-
ible replicated samples, is the sam-
ple estimate of the standa𝑖
rd error of
the mean constructed from the sample
being used, and 1.96 is a t or z (normal)
distribution constant for the 95 percent
probability.
Note that in equation above, 95
percent refers to the confidence, not
the probability.
𝑆
Special Bounding Conditions in Constructing Confidence Intervals
CIs are bound at the minimum and
maximum possible values for percen-
tages and at the minimum possible
value for amounts. This means that the
CIs are bound at zero at the lower
bound for both percentages and
amounts, and at 100 at the upper
bound for percentages. This bounding
may result in asymmetrical intervals.
Bounding will be apparent for low es-
timates (i.e., near zero) or high esti-
mates (i.e., near 100 percent or near the
maximum possible amount).

3
CIs and Hypothesis Testing (or Overlapping CIs and Statistical Significance)
Can two CIs constructed for estimates
of the same statistic from two different
populations be used to determine if
the two estimates are statistically sig-
nificantly different (say, in place of
doing a hypothesis test)? The answer is
sometimes but not always.
In the case of two nonoverlapping CIs,
the difference between the estimates is
necessarily statistically significant. If 95
percent CIs are being used, then the
estimates are significantly different
with p ≤ 0.05. This is equivalent to
doing a t-test (or z-test if comparing
proportions) with a = 0.05 and reject-
ing the null hypothesis of equality.
However, in the case of two overlap-
ping CIs, the estimates can be either
significant or not significant. An as-
sumption that overlapping CIs neces-
sarily indicate nonsignificance is false.
In this case, a hypothesis test must be
done, and under some conditions, the
test can find that the estimates are in-
deed significantly different despite their
overlapping CIs.
Here is an explanation of why this hap-
pens. For two 95 percent CIs con-
structed as in equation (1), the
algebraic relationships constrain the
CIs so that they can only overlap when:
(2) ( ) ( )1 2 1 21.96X X S S− ≤ + .
Similarly, the CIs cannot overlap when:
(3) ( ) ( )1 2 1 21.96X X S S− > + .
The formula for a t-test of the
difference between two means is:
(4) ( )
( )1 2
2 21 21.96
X Xt
S S
−=
+ .
The means are significantly different
when:
(5) ( ) ( )2 21 2 1 21.96X X S S− > + .
This is because, algebraically, the
square root of the sum of squares of
two numbers is always less than the
sum of those two numbers:
(6) 2 21 2 1 2S S S S+ < + ,
and as the difference in means
1 2X X− increases, the t associated ( )with that difference becomes signifi-
cant before the two confidence inter-
vals cease to overlap. Refer to the
following figure:
Not Significant Significant CI overlap No CI overlap
( )1 2−X X
( )2 21 21.96 +S S
1 21.96( )+S S
The figure demonstrates that there is an interval of values of ( )1 2X X−
where the difference is significant and
the CIs overlap. Thus, while nonover-
lapping CIs do indicate a significant dif-
ference, overlapping CIs do not indi-
cate nonsignificance.4
Data Analysis
The ELS:2002/06 sample design in-
volved stratification, the disproportio-
nate sampling of certain strata, and
multistage probability sampling. The
resulting statistics are more variable
than they would have been if they had
been based on data from a simple ran-
dom sample of the same size. As a re-
sult, simple random sampling
techniques for estimating sampling er-
rors cannot be applied to these data.
Several methods such as Taylor series
approximations, balanced repeated
replication, and jackknife repeated rep-
lication can be used to estimate correct
standard errors. This set of Issue Tables
used balanced repeated replication to
generate appropriate standard errors
for the complex sampling designs used
by ELS: 2002/06.
Dataset Methodology
For an overview of the ELS:2002/06
survey methodology, see the Education
Longitudinal Study of 2002 (ELS:2002)
Base-Year to Second Follow-up Public
Use Data File Documentation (NCES
2008-347), available at
http://nces.ed.gov/pubsearch/
pubsinfo.asp?pubid=2008347.
(7)

4
REFERENCES Bradby, D., and Hudson, L. (2007). The
2007 Revision of the Career/ Technical
Education Portion of the Secondary
School Taxonomy (NCES 2008-030).
National Center for Education Statis-
tics, Institute of Education Sciences,
U.S. Department of Education. Wash-
ington, DC.
Cornell University, Cornell Statistical Con-
sulting Unit (2008, October). Overlap-
ping Confidence Intervals and
Statistical Significance. StatNews, 73.
Retrieved October 29, 2009, from
http://www.cscu.cornell.edu/news/
archive.php)
Hudson, L., and Laird, J. (2009). New Indi-
cators of High School Career/Technical
Education Coursetaking: Class of 2005
(NCES 2009-038). National Center for
Education Statistics, Institute of Edu-
cation Sciences, U.S. Department of
Education. Washington, DC.
.
Kazis, R. (2005). Remaking Career and
Technical Education for the 21st Cen-
tury. Washington, DC: The Aspen Insti-
tute.
Lekes, N., Bragg, D.D., Loeb, J.W., Oleksiw,
C.A., Marszalek, J., Brooks-LaRaviere,
M., Zhu, R., Kremidas, C.C., Akukwe, G.,
Lee, H.J., and Hood, L.K. (2007). Career
and Technical Education Pathway Pro-
grams, Academic Performance, and the
Transition to College and Career. St.
Paul: National Research Center for Ca-
reer and Technical Education, Univer-
sity of Minnesota.
Levesque, K. (2003). Trends in High School
Vocational/ Technical Coursetaking:
1982–1998 (NCES 2003-025). National
Center for Education Statistics, Insti-
tute of Education Sciences, U.S. De-
partment of Education. Washington,
DC.
Levesque, K., Laird, J., Hensley, E., Choy,
S.P., Cataldi, E.F., and Hudson, L.
(2008). Career/Technical Education in
the United States: 1990 to 2005 (NCES
2008-035). National Center for Educa-
tion Statistics, Institute of Education
Sciences, U.S. Department of Educa-
tion. Washington, DC.
Silverberg, M., Warner, E., Fong, M., and
Goodwin, D. (2004). National Assess-
ment of Vocational Education: Final Re-
port to Congress. U.S. Department of
Education. Washington, DC: Office of
the Under Secretary, Policy and Pro-
gram Studies Service.
Tuma, J. (1996). Trends in Participation in
Secondary Vocational Education:
1982−1992 (NCES 96-004). National
Center for Education Statistics, U.S.
Department of Education. Washing-
ton, DC.
U.S. Department of Education, National
Center for Education Statistics. (2002).
Classification of Instructional Programs:
2000 Edition (NCES 2002-165). Wash-
ington, DC.
Wolfe, R., and Hanley, J. (2002). If We’re So
Different, Why Do We Keep Overlap-
ping? When 1 Plus 1 Doesn’t Make 2.
Canadian Medical Journal, 166(1): 65–
66.
ENDNOTES 1 “Credits” refer to standardized Carnegie units. One Carnegie unit represents the completion of a course that meets one period per day for the entire school year. For the purpose of sim-plicity, the term “credits” is used in this brief in place of “Carnegie units.”
2 Family and consumer sciences education is intended to prepare students for adult roles outside the paid labor market. General labor market preparation is designed to teach gen-eral employment skills used across a wide range of occupational areas, such as keyboard-ing and word processing. Occupational educa-tion aims to teach skills required in a specific occupation or occupational cluster such as agriculture, business services, or transporta-tion. 3 Among the class of 2005 high school gra-duates, for example, 66 percent of all CTE cre-dits earned were in occupational education (Hudson and Laird 2009). 4 For more detailed discussions of nonoverlap-ping CIs, see Cornell University, Cornell Statis-tical Consulting Unit (2008) or Wolfe and Hanley (2002).

National Center for Education Statistics
Pct. 95% CI
Total 100.0 [†]
2-credit concentratorsNonconcentrators 66.1 [64.1–68.1]Occupational concentrators2 33.9 [31.9–35.9]
Agriculture and natural resources 4.5 [3.5–5.5]Business 7.9 [7.0–8.8]Communications and design 5.5 [4.6–6.4]Computer and information sciences 3.1 [2.4–3.7]Construction and architecture 1.8 [1.4–2.2]Consumer and culinary services 3.7 [3.1–4.2]Engineering technologies 2.2 [1.7–2.8]Health sciences 2.4 [1.9–2.9]Manufacturing 3.1 [2.6–3.7]Marketing 2.4 [1.9–3.0]Public services 0.7 [0.4–1.0]Repair and transportation 2.9 [2.5–3.4]
3-credit concentratorsNonconcentrators 83.4 [81.9–84.8]Occupational concentrators2 16.6 [15.2–18.1]
Agriculture and natural resources 2.4 [1.8–3.1]Business 2.6 [2.1–3.2]Communications and design 2.1 [1.6–2.6]Computer and information sciences 0.8 [0.6–1.1]Construction and architecture 1.0 [0.7–1.3]Consumer and culinary services 1.9 [1.5–2.2]Engineering technologies 0.9 [0.6–1.3]Health sciences 1.3 [1.0–1.7]Manufacturing 1.5 [1.2–1.9]Marketing 1.1 [0.8–1.4]Public services 0.2 [0.1–0.3]Repair and transportation 1.8 [1.4–2.1]
Number of occupational credits 0.00–1.99 credits 45.3 [43.2–47.4]2.00–3.99 credits 32.2 [30.8–33.7]4.00 or more credits 22.4 [20.5–24.4]
† Not applicable.
2 Detail on specific occupational concentrators does not sum to totals because some graduates concentrated in more than one occupational area.NOTE: See the Technical Notes for the definition of 95% CI (confidence interval). Detail may not sum to totals because of rounding.
Table 1.—Percentage distributions of 2004 public high school graduates by occupational concentrator Table 1.—status and area of concentration, and by number of occupational credits earned in highTable 1.—school: 2004
1 The 2- and 3-credit occupational concentrators are graduates who earned at least 2.0 and 3.0 credits, respectively, in one of the 12 occupational areas listed in the table. Graduates can concentrate in more than one occupational area.
SOURCE: U.S. Department of Education, National Center for Education Statistics, Education Longitudinal Study of 2002 (ELS:2002), “First Follow-up, 2004” and High School Transcript Study (HSTS), 2004.
Occupational concentrator status,1 area ofconcentration, and number of occupational credits

National Center for Education Statistics
Pct. 95% CI Pct. 95% CI Pct. 95% CI
All graduates 78.7 [77.4–80.0] 20.0 [18.7–21.2] 1.4 [1.0–1.7]
2-credit concentratorsNonconcentrators 80.8 [79.2–82.4] 17.8 [16.3–19.3] 1.5 [1.1–1.9]Occupational concentrators 74.4 [72.4–76.5] 24.4 [22.4–26.4] 1.2 [0.7–1.7]
Agriculture and natural resources 66.2 [59.5–73.0] 32.6 [26.0–39.1] 1.2 [0.0–2.6]Business 81.1 [77.7–84.5] 17.6 [14.4–20.9] 1.3 [0.3–2.3]Communications and design 80.9 [76.6–85.1] 18.7 [14.4–23.0] 0.4 [0.0–1.1]Computer and information sciences 82.2 [77.2–87.3] 16.1 [11.0–21.1] 1.7 [0.0–3.9]Construction and architecture 60.0 [48.6–71.4] 37.5 [26.9–48.0] 2.5 [0.0–5.5]Consumer and culinary services 67.3 [60.8–73.8] 29.8 [23.5–36.0] 2.9 [0.1–5.7]Engineering technologies 77.1 [69.4–84.7] 22.3 [14.6–29.9] 0.7 [0.0–1.8]Health sciences 80.3 [73.1–87.6] 17.8 [10.9–24.8] 1.8 [0.0–4.1]Manufacturing 56.5 [47.6–65.4] 43.1 [34.3–52.0] 0.4 [0.0–1.1]Marketing 80.1 [73.5–86.8] 19.0 [12.5–25.4] 0.9 [0.0–2.0]Public services 86.6 [76.5–96.8] 13.4 [3.2–23.5] # [†]Repair and transportation 52.5 [45.2–59.7] 46.8 [39.7–54.0] 0.7 [0.0–1.8]
3-credit concentratorsNonconcentrators 80.4 [79.0–81.8] 18.3 [17.0–19.6] 1.3 [1.0–1.7]Occupational concentrators 69.9 [66.7–73.1] 28.6 [25.4–31.7] 1.6 [0.8–2.3]
Agriculture and natural resources 69.1 [59.7–78.5] 29.6 [20.4–38.7] 1.3 [0.0–3.1]Business 78.3 [72.4–84.2] 19.4 [13.9–24.9] 2.3 [0.1–4.5]Communications and design 80.3 [71.5–89.0] 18.5 [9.7–27.3] 1.2 [0.0–3.2]Computer and information sciences 84.3 [73.3–95.3] 11.6 [3.6–19.6] 4.1 [0.0–11.5]Construction and architecture 54.5 [37.6–71.3] 42.7 [26.9–58.6] 2.8 [0.0–6.9]Consumer and culinary services 59.3 [50.4–68.1] 37.4 [28.6–46.2] 3.4 [0.0–7.0]Engineering technologies 72.0 [57.3–86.6] 28.0 [13.4–42.7] # [†]Health sciences 80.8 [70.5–91.1] 17.5 [7.3–27.6] 1.7 [0.0–4.5]Manufacturing 51.5 [39.4–63.5] 47.8 [35.8–59.8] 0.8 [0.0–2.4]Marketing 72.1 [61.9–82.3] 26.3 [16.4–36.2] 1.6 [0.0–4.0]Public services ‡ [†] ‡ [†] ‡ [†]Repair and transportation 52.0 [43.6–60.5] 48.0 [39.5–56.4] # [†]
Number of occupational credits0.00–1.99 credits 82.7 [80.9–84.4] 15.8 [14.2–17.4] 1.5 [1.0–2.0]2.00–3.99 credits 78.6 [76.5–80.7] 20.2 [18.2–22.3] 1.2 [0.7–1.7]4.00 or more credits 70.4 [67.7–73.1] 28.3 [25.6–31.0] 1.3 [0.7–1.9]
† Not applicable.# Rounds to zero.‡ Reporting standards not met.
Occupational concentrator status,1
area of concentration, andnumber of occupational credits
Ever enrolled in postsecondary
educationNever enrolled but
worked for payNever enrolled nor
worked for pay
1 The 2- and 3-credit occupational concentrators are graduates who earned at least 2.0 and 3.0 credits, respectively, in one of the 12 occupational areas listed in the table. Graduates can concentrate in more than one occupational area.
Table 2.—Percentage distribution of 2004 public high school graduates, by postsecondary education andTable 2.—work status within the first 2 years after high school graduation, overall and for occupationalTable 2.—concentrators, nonconcentrators, and graduates earning different numbers of occupationalTable 2.—credits: 2006
NOTE: See the Technical Notes for the definition of 95% CI (confidence interval). The time frame for postsecondary enrollment and employment was between high school graduation and the 2006 interview date. Detail may not sum to totals because of rounding.SOURCE: U.S. Department of Education, National Center for Education Statistics, Education Longitudinal Study of 2002 (ELS:2002), “Second Follow-up, 2006” and High School Transcript Study (HSTS), 2004.
National Center for Education Statistics
Pct. 95% CI Pct. 95% CI Pct. 95% CI
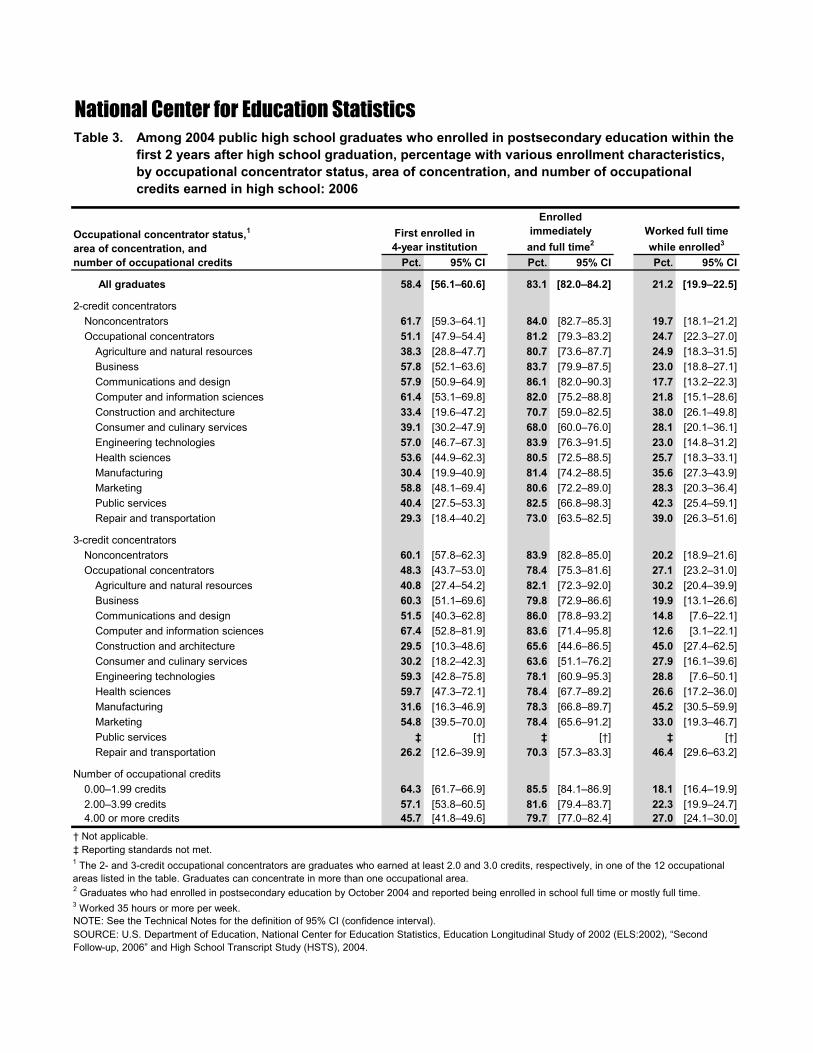
All graduates 58.4 [56.1–60.6] 83.1 [82.0–84.2] 21.2 [19.9–22.5]
2-credit concentratorsNonconcentrators 61.7 [59.3–64.1] 84.0 [82.7–85.3] 19.7 [18.1–21.2]Occupational concentrators 51.1 [47.9–54.4] 81.2 [79.3–83.2] 24.7 [22.3–27.0]
Agriculture and natural resources 38.3 [28.8–47.7] 80.7 [73.6–87.7] 24.9 [18.3–31.5]Business 57.8 [52.1–63.6] 83.7 [79.9–87.5] 23.0 [18.8–27.1]Communications and design 57.9 [50.9–64.9] 86.1 [82.0–90.3] 17.7 [13.2–22.3]Computer and information sciences 61.4 [53.1–69.8] 82.0 [75.2–88.8] 21.8 [15.1–28.6]Construction and architecture 33.4 [19.6–47.2] 70.7 [59.0–82.5] 38.0 [26.1–49.8]Consumer and culinary services 39.1 [30.2–47.9] 68.0 [60.0–76.0] 28.1 [20.1–36.1]Engineering technologies 57.0 [46.7–67.3] 83.9 [76.3–91.5] 23.0 [14.8–31.2]Health sciences 53.6 [44.9–62.3] 80.5 [72.5–88.5] 25.7 [18.3–33.1]Manufacturing 30.4 [19.9–40.9] 81.4 [74.2–88.5] 35.6 [27.3–43.9]Marketing 58.8 [48.1–69.4] 80.6 [72.2–89.0] 28.3 [20.3–36.4]Public services 40.4 [27.5–53.3] 82.5 [66.8–98.3] 42.3 [25.4–59.1]Repair and transportation 29.3 [18.4–40.2] 73.0 [63.5–82.5] 39.0 [26.3–51.6]
3-credit concentratorsNonconcentrators 60.1 [57.8–62.3] 83.9 [82.8–85.0] 20.2 [18.9–21.6]Occupational concentrators 48.3 [43.7–53.0] 78.4 [75.3–81.6] 27.1 [23.2–31.0]
Agriculture and natural resources 40.8 [27.4–54.2] 82.1 [72.3–92.0] 30.2 [20.4–39.9]Business 60.3 [51.1–69.6] 79.8 [72.9–86.6] 19.9 [13.1–26.6]Communications and design 51.5 [40.3–62.8] 86.0 [78.8–93.2] 14.8 [7.6–22.1]Computer and information sciences 67.4 [52.8–81.9] 83.6 [71.4–95.8] 12.6 [3.1–22.1]Construction and architecture 29.5 [10.3–48.6] 65.6 [44.6–86.5] 45.0 [27.4–62.5]Consumer and culinary services 30.2 [18.2–42.3] 63.6 [51.1–76.2] 27.9 [16.1–39.6]Engineering technologies 59.3 [42.8–75.8] 78.1 [60.9–95.3] 28.8 [7.6–50.1]Health sciences 59.7 [47.3–72.1] 78.4 [67.7–89.2] 26.6 [17.2–36.0]Manufacturing 31.6 [16.3–46.9] 78.3 [66.8–89.7] 45.2 [30.5–59.9]Marketing 54.8 [39.5–70.0] 78.4 [65.6–91.2] 33.0 [19.3–46.7]Public services ‡ [†] ‡ [†] ‡ [†]Repair and transportation 26.2 [12.6–39.9] 70.3 [57.3–83.3] 46.4 [29.6–63.2]
Number of occupational credits0.00–1.99 credits 64.3 [61.7–66.9] 85.5 [84.1–86.9] 18.1 [16.4–19.9]2.00–3.99 credits 57.1 [53.8–60.5] 81.6 [79.4–83.7] 22.3 [19.9–24.7]4.00 or more credits 45.7 [41.8–49.6] 79.7 [77.0–82.4] 27.0 [24.1–30.0]
† Not applicable.‡ Reporting standards not met.
2 Graduates who had enrolled in postsecondary education by October 2004 and reported being enrolled in school full time or mostly full time.3 Worked 35 hours or more per week.NOTE: See the Technical Notes for the definition of 95% CI (confidence interval).
Table 3.—Among 2004 public high school graduates who enrolled in postsecondary education within the Table 3.—first 2 years after high school graduation, percentage with various enrollment characteristics,Table 3.—by occupational concentrator status, area of concentration, and number of occupationalTable 3.—credits earned in high school: 2006
SOURCE: U.S. Department of Education, National Center for Education Statistics, Education Longitudinal Study of 2002 (ELS:2002), “Second Follow-up, 2006” and High School Transcript Study (HSTS), 2004.
1 The 2- and 3-credit occupational concentrators are graduates who earned at least 2.0 and 3.0 credits, respectively, in one of the 12 occupational areas listed in the table. Graduates can concentrate in more than one occupational area.
Worked full time while enrolled3
Enrolledimmediatelyand full time2
First enrolled in4-year institution
Occupational concentrator status,1
area of concentration, andnumber of occupational credits

National Center for Education Statistics
Pct. 95% CI
All graduates 82.0 [80.8–83.3]
2-credit concentratorsNonconcentrators 82.6 [81.1–84.1]Occupational concentrators 80.8 [78.8–82.8]
Agriculture and natural resources 76.3 [70.6–82.1]Business 82.1 [78.5–85.7]Communications and design 86.9 [82.5–91.3]Computer and information sciences 84.8 [78.8–90.9]Construction and architecture 73.2 [60.6–85.7]Consumer and culinary services 71.2 [62.9–79.5]Engineering technologies 87.2 [80.4–94.0]Health sciences 82.1 [74.6–89.6]Manufacturing 73.0 [65.0–81.1]Marketing 85.8 [78.8–92.8]Public services 80.1 [69.5–90.6]Repair and transportation 71.9 [62.5–81.4]
3-credit concentratorsNonconcentrators 82.4 [81.1–83.8]Occupational concentrators 79.7 [76.6–82.8]
Agriculture and natural resources 79.3 [71.0–87.7]Business 81.6 [74.5–88.8]Communications and design 84.3 [76.7–91.9]Computer and information sciences 82.8 [69.1–96.5]Construction and architecture 69.7 [51.7–87.7]Consumer and culinary services 70.2 [57.4–83.1]Engineering technologies 87.3 [74.4–100.0]Health sciences 81.3 [71.2–91.5]Manufacturing 77.6 [65.9–89.3]Marketing 84.2 [73.1–95.4]Public services ‡ [†]Repair and transportation 69.0 [56.2–81.7]
Number of occupational credits0.00–1.99 credits 84.3 [82.6–86.0]2.00–3.99 credits 80.1 [77.9–82.2]4.00 or more credits 79.6 [77.1–82.1]
† Not applicable.‡ Reporting standards not met.
Occupational concentrator status,1 area ofconcentration, and number of occupational credits
Table 4.—Among 2004 public high school graduates who enrolled in postsecondary education within theTable 4.—first 2 years after high school graduation, percentage who persisted (either attained aTable 4.—credential or were still enrolled), by occupational concentrator status, area of concentration, Table 4.—and number of occupational credits earned in high school: 2006
1 The 2- and 3-credit occupational concentrators are graduates who earned at least 2.0 and 3.0 credits, respectively, in one of the 12 occupational areas listed in the table. Graduates can concentrate in more than one occupational area.NOTE: See the Technical Notes for the definition of 95% CI (confidence interval). Persistence status was measured as of the time of the 2006 interview.SOURCE: U.S. Department of Education, National Center for Education Statistics, Education Longitudinal Study of 2002 (ELS:2002), “Second Follow-up, 2006” and High School Transcript Study (HSTS), 2004.

National Center for Education Statistics
Postsecondary field of study Pct. 95% CI Pct. 95% CI Pct. 95% CI Pct. 95% CI Pct. 95% CI
Total 100.0 [†] 100.0 [†] 100.0 [†] 100.0 [†] 100.0 [†]
CTE-related fields2 53.1 [51.3–54.8] 50.5 [48.3–52.6] 59.0 [56.1–61.9] 52.2 [50.3–54.1] 58.6 [54.1–63.0]Agriculture, natural resources, and conservation 0.9 [0.6–1.2] 0.5 [0.3–0.8] 1.8 [0.9–2.6] 0.6 [0.3–0.8] 2.9 [1.3–4.5]Business support, management, and finance 11.0 [10.0–11.9] 9.7 [8.6–10.8] 13.8 [11.8–15.8] 10.6 [9.6–11.6] 13.2 [10.1–16.3]Communication, media studies, journalism, design and
applied arts, and commercial and advertising arts 5.0 [4.3–5.7] 5.0 [4.1–5.9] 5.1 [3.7–6.4] 5.2 [4.4–6.0] 3.9 [2.2–5.7]Computer, information sciences, and support technology 2.2 [1.7–2.7] 1.8 [1.3–2.3] 3.1 [2.1–4.1] 2.0 [1.5–2.4] 3.7 [1.9–5.4]Construction and architecture 1.4 [1.0–1.7] 0.9 [0.5–1.3] 2.4 [1.4–3.3] 1.1 [0.7–1.5] 3.1 [1.5–4.6]Education, legal studies, public administration, social
services, and security and protective services 11.7 [10.7–12.7] 11.7 [10.3–13.0] 11.7 [9.9–13.5] 11.9 [10.7–13.0] 10.4 [7.7–13.1]Engineering and related technologies 4.5 [3.8–5.1] 4.6 [3.8–5.3] 4.3 [3.0–5.5] 4.7 [4.0–5.4] 3.2 [1.7–4.6]Health professions and clinical sciences 10.5 [9.4–11.6] 10.7 [9.4–12.1] 10.1 [8.2–12.0] 10.5 [9.3–11.7] 10.7 [7.7–13.7]Marketing and real estate 2.0 [1.6–2.5] 2.1 [1.5–2.7] 1.8 [1.0–2.6] 2.1 [1.6–2.5] 1.9 [0.8–3.1]Mechanical and repair technologies, transportation,
and materials moving 1.4 [1.0–1.8] 1.0 [0.6–1.5] 2.2 [1.4–3.1] 1.2 [0.7–1.6] 2.9 [1.5–4.4]Parks, recreation, leisure, and fitness studies, personal
and culinary services, family, consumer, and human sciences 2.6 [2.1–3.1] 2.5 [1.9–3.1] 2.8 [1.9–3.6] 2.5 [2.0–3.1] 2.7 [1.4–4.0]
Precision production # [†] # [†] # [†] # [†] # [†]All other fields 23.1 [21.7–24.5] 26.2 [24.3–28.0] 16.1 [14.0–18.2] 24.2 [22.6–25.7] 16.4 [13.4–19.5]Undeclared or not in a degree program 23.8 [22.4–25.2] 23.4 [21.8–25.0] 24.9 [22.4–27.3] 23.7 [22.2–25.1] 25.0 [21.4–28.6]
† Not applicable.# Rounds to zero.
NOTE: See the Technical Notes for the definition of 95% CI (confidence interval). Detail may not sum to totals because of rounding.
All graduates Nonconcentrators Nonconcentrators
Table 5-A.—Among 2004 public high school graduates who were enrolled in postsecondary education in 2006, percentage distributionTable 5-A.—by postsecondary field of study, overall and for high school nonconcentrators and concentrators: 2006
2-credit occupational concentrator status1 3-credit occupational concentrator status1
2 CTE stands for career and technical education. CTE-related fields are based on the Classification of Instructional Programs (CIP).
SOURCE: U.S. Department of Education, National Center for Education Statistics, Education Longitudinal Study of 2002 (ELS:2002), “Second Follow-up, 2006” and High School Transcript Study (HSTS), 2004.
1 The 2- and 3-credit occupational concentrators are graduates who earned at least 2.0 and 3.0 credits, respectively, in one of the following 12 occupational areas: agriculture and natural resources, business, communications and design, computer and information sciences, construction and architecture, consumer and culinary services, engineering technologies, health sciences, manufacturing, marketing, public services, and repair and transportation. Graduates can concentrate in more than one occupational area.
Occupational concentrators
Occupational concentrators

National Center for Education Statistics
Postsecondary field of study Pct. 95% CI Pct. 95% CI Pct. 95% CI
Total 100.0 [†] 100.0 [†] 100.0 [†]
CTE-related fields1 48.4 [45.8–50.9] 56.1 [52.9–59.2] 60.7 [57.2–64.3]Agriculture, natural resources, and conservation 0.5 [0.2–0.8] 0.8 [0.3–1.4] 2.0 [0.9–3.1]Business support, management, and finance 9.1 [7.7–10.5] 11.6 [9.7–13.5] 14.9 [12.2–17.6]Communication, media studies, journalism, design
and applied arts, and commercial and advertising arts 5.4 [4.3–6.5] 5.4 [4.1–6.7] 3.4 [2.2–4.7]
Computer, information sciences, and support technology 1.3 [0.8–1.8] 3.0 [2.1–3.9] 3.3 [1.9–4.7]
Construction and architecture 0.8 [0.4–1.1] 1.5 [0.8–2.3] 2.7 [1.4–3.9]Education, legal studies, public administration,
social services, and security and protective services 11.4 [9.8–13.0] 12.0 [10.2–13.8] 11.7 [9.6–13.8]
Engineering and related technologies 4.4 [3.5–5.3] 4.5 [3.3–5.7] 4.6 [3.1–6.0]Health professions and clinical sciences 10.3 [8.8–11.8] 10.9 [9.0–12.8] 10.6 [7.9–13.3]Marketing and real estate 2.2 [1.4–3.0] 1.9 [1.2–2.6] 1.9 [1.0–2.8]Mechanical and repair technologies, transportation,
and materials moving 0.7 [0.3–1.1] 1.3 [0.6–2.0] 3.6 [2.2–5.0]Parks, recreation, leisure, and fitness studies,
personal and culinary services, family, consumer, and human sciences 2.4 [1.7–3.1] 3.2 [2.2–4.1] 2.1 [1.2–3.0]
Precision production # [†] # [†] # [†]All other fields 29.3 [27.1–31.5] 17.9 [15.6–20.3] 15.0 [12.5–17.5]Undeclared or not in a degree program 22.3 [20.4–24.2] 26.0 [23.2–28.8] 24.2 [21.2–27.3]
† Not applicable.# Rounds to zero.
NOTE: See the Technical Notes for the definition of 95% CI (confidence interval). Detail may not sum to totals because of rounding. SOURCE: U.S. Department of Education, National Center for Education Statistics, Education Longitudinal Study of 2002 (ELS:2002), “Second Follow-up, 2006” and High School Transcript Study (HSTS), 2004.
Table 5-B.—Among 2004 public high school graduates who were enrolled in postsecondary educationTable 5-B.—in 2006, percentage distribution of graduates by postsecondary field of study, overall andTable 5-B.—among graduates who earned different numbers of occupational credits in high school: 2006
0.00–1.99 credits 2.00–3.99 credits 4.00 or more credits
1 CTE stands for career and technical education. CTE-related fields are based on the Classification of Instructional Programs (CIP).

National Center for Education Statistics
Area of concentration1 Pct. 95% CI
2-credit occupational concentrators 18.1 [15.4–20.7]Agriculture and natural resources 12.5 [6.3–18.7]Business 24.1 [18.8–29.4]Communications and design 12.6 [7.8–17.3]Computer and information sciences 13.5 [7.5–19.6]Construction and architecture 14.2 [3.2–25.1]Consumer and culinary services 7.9 [1.8–14.1]Engineering technologies 11.8 [4.1–19.5]Health sciences 32.8 [23.1–42.4]Manufacturing # [†]Marketing 5.1 [1.3–9.0]Public services 17.7 [0.9–34.5]Repair and transportation 18.2 [8.6–27.9]
3-credit occupational concentrators 18.7 [15.0–22.3]Agriculture and natural resources 15.4 [6.9–24.0]Business 26.1 [16.8–35.3]Communications and design 16.5 [7.8–25.2]Computer and information sciences 18.1 [4.6–31.6]Construction and architecture ‡ [†]Consumer and culinary services 12.4 [1.1–23.8]Engineering technologies 12.1 [0.0–25.2]Health sciences 30.8 [18.4–43.2]Manufacturing # [†]Marketing 9.3 [0.9–17.7]Public services ‡ [†]Repair and transportation 24.3 [8.6–40.0]
† Not applicable.# Rounds to zero.‡ Reporting standards not met.
NOTE: See the Technical Notes for the definition of 95% CI (confidence interval). See Exhibit 1 for fields of study for postsecondary majors related to occupational concentration areas listed in this table.SOURCE: U.S. Department of Education, National Center for Education Statistics, Education Longitudinal Study of 2002 (ELS:2002), “Second Follow-up, 2006” and High School Transcript Study (HSTS), 2004.
Table 6.—Among 2004 public high school graduates who were enrolled in postsecondary education inTable 6.—2006, percentage of occupational concentrators who had a postsecondary field of studyTable 6.—related to their concentration area in high school: 2006
1 The 2- and 3-credit occupational concentrators are graduates who earned at least 2.0 and 3.0 credits, respectively, in one of the 12 occupational areas listed in the table. Graduates can concentrate in more than one occupational area.

National Center for Education Statistics
Pct. 95% CI Pct. 95% CI Pct. 95% CI
All graduates 93.6 [92.2–95.0] 38.5 [35.6–41.3] 12.5 [10.5–14.4]
2-credit concentratorNonconcentrators 92.4 [90.5–94.3] 40.0 [36.0–44.0] 13.7 [11.1–16.4]Occupational concentrators 95.5 [93.6–97.4] 36.2 [31.5–40.9] 10.6 [7.9–13.3]
Agriculture and natural resources 96.4 [92.4–100.0] 41.6 [29.2–53.9] 11.8 [4.0–19.6]Business 93.2 [88.2–98.3] 45.2 [35.8–54.7] 15.6 [7.3–23.8]Communications and design 97.7 [93.8–100.0] 36.7 [23.0–50.4] 16.4 [8.1–24.7]Computer and information sciences 90.4 [78.2–100.0] 49.6 [34.3–64.9] 9.0 [0.0–21.9]Construction and architecture 93.7 [86.6–100.0] 30.7 [15.6–45.8] 5.8 [0.0–12.3]Consumer and culinary services 91.0 [82.9–99.2] 47.6 [35.7–59.6] 13.8 [4.4–23.3]Engineering technologies 97.0 [92.3–100.0] 33.2 [17.5–49.0] 8.2 [0.0–17.6]Health sciences 90.6 [78.4–100.0] 36.6 [19.4–53.8] 12.2 [0.0–27.9]Manufacturing 99.1 [97.4–100.0] 22.4 [14.1–30.6] 9.8 [3.2–16.3]Marketing 95.6 [89.6–100.0] 13.3 [2.0–24.6] 4.0 [0.0–11.4]Public services ‡ [†] ‡ [†] ‡ [†]Repair and transportation 98.5 [96.2–100.0] 32.9 [21.6–44.1] 3.3 [0.0–6.6]
3-credit concentratorNonconcentrators 93.3 [91.6–94.9] 40.2 [36.8–43.6] 12.9 [10.6–15.2]Occupational concentrators 94.8 [92.4–97.3] 32.7 [27.4–38.0] 11.1 [7.4–14.8]
Agriculture and natural resources 95.8 [90.1–100.0] 39.0 [23.3–54.7] 12.3 [0.4–24.2]Business 89.5 [80.1–98.8] 31.2 [15.8–46.5] 12.3 [0.5–24.1]Communications and design ‡ [†] ‡ [†] ‡ [†]Computer and information sciences ‡ [†] ‡ [†] ‡ [†]Construction and architecture 93.8 [85.3–100.0] 20.1 [1.5–38.8] 5.4 [0.0–13.5]Consumer and culinary services 91.7 [83.1–100.0] 48.6 [33.9–63.2] 12.3 [1.3–23.4]Engineering technologies ‡ [†] ‡ [†] ‡ [†]Health sciences ‡ [†] ‡ [†] ‡ [†]Manufacturing 98.4 [95.0–100.0] 17.7 [8.0–27.5] 11.8 [0.7–22.9]Marketing ‡ [†] ‡ [†] ‡ [†]Public services ‡ [†] ‡ [†] ‡ [†]Repair and transportation 100.0 [100.0–100.0] 27.6 [14.3–40.9] 3.8 [0.0–8.4]
Number of occupational credits0.00–1.99 credits 91.3 [88.6–93.9] 38.9 [34.1–43.7] 14.5 [11.0–18.0]2.00–3.99 credits 94.4 [92.2–96.6] 41.7 [36.8–46.7] 12.9 [9.4–16.4]4.00 or more credits 95.7 [93.7–97.7] 34.5 [29.4–39.5] 9.7 [6.8–12.6]
† Not applicable.‡ Reporting standards not met.
NOTE: See the Technical Notes for the definition of 95% CI (confidence interval).
Table 7.—Among 2004 public high school graduates who did not enroll in postecondary education withinTable 7.—the first 2 years after high school graduation, percentage who ever worked or were everTable 7.—unemployed during this period, and their current unemployment rate, by occupationalTable 7.—concentrator status, area of concentration, and number of occupational credits earned inTable 7.—high school: 2006
2 The unemployment rate represents the percentage of graduates in the labor force who were unemployed at the time of the 2006 interview. It is equal to the number of graduates who were unemployed divided by the sum of the number of graduates who were unemployed and the number who were working.
2006 unemployment rate2Occupational concentrator status,1
area of concentration, andnumber of occupational credits
Ever worked for pay Ever unemployed2004–06
SOURCE: U.S. Department of Education, National Center for Education Statistics, Education Longitudinal Study of 2002 (ELS:2002), “Second Follow-up, 2006” and High School Transcript Study (HSTS), 2004.
1 The 2- and 3-credit occupational concentrators are graduates who earned at least 2.0 and 3.0 credits, respectively, in one of the 12 occupational areas listed in the table. Graduates can concentrate in more than one occupational area.

National Center for Education Statistics
Pct. 95% CI Amt. 95% CI
All graduates 63.7 [61.0–66.3] $9.70 [$9.40–$10.00]
2-credit concentratorNonconcentrators 60.0 [56.2–63.8] 9.61 [9.20–10.00]Occupational concentrators 69.1 [65.3–72.9] 9.83 [9.50–10.20]
Agriculture and natural resources 75.0 [66.0–84.0] 9.74 [9.00–10.50]Business 57.8 [48.3–67.3] 8.99 [8.10–9.90]Communications and design 59.3 [44.8–73.8] 9.50 [8.10–10.90]Computer and information sciences 62.6 [41.0–84.2] 9.17 [7.70–10.60]Construction and architecture 84.9 [74.8–95.0] 10.83 [9.60–12.10]Consumer and culinary services 54.6 [41.4–67.9] 9.19 [8.20–10.20]Engineering technologies 77.3 [61.3–93.3] 9.64 [8.50–10.80]Health sciences 53.0 [35.0–71.0] ‡ [†]Manufacturing 74.5 [64.4–84.7] 11.09 [10.00–12.20]Marketing 72.9 [54.6–91.1] 9.55 [8.00–11.10]Public services ‡ [†] ‡ [†]Repair and transportation 82.2 [74.5–89.9] 10.06 [9.30–10.80]
3-credit concentratorNonconcentrators 62.1 [58.9–65.3] 9.59 [9.20–9.90]Occupational concentrators 68.8 [63.8–73.8] 10.04 [9.60–10.50]
Agriculture and natural resources 77.4 [63.6–91.2] 9.66 [8.90–10.40]Business 57.9 [40.9–74.9] 9.23 [7.70–10.80]Communications and design ‡ [†] ‡ [†]Computer and information sciences ‡ [†] ‡ [†]Construction and architecture 89.4 [79.6–99.2] 10.70 [9.20–12.20]Consumer and culinary services 50.0 [35.3–64.7] 9.46 [7.80–11.10]Engineering technologies ‡ [†] ‡ [†]Health sciences ‡ [†] ‡ [†]Manufacturing 75.1 [62.2–87.9] 11.04 [9.20–12.90]Marketing ‡ [†] ‡ [†]Public services ‡ [†] ‡ [†]Repair and transportation 79.4 [68.8–90.0] 9.66 [8.90–10.40]
Number of occupational credits0.00–1.99 credits 59.9 [55.0–64.8] 9.46 [8.90–10.00]2.00–3.99 credits 62.1 [57.2–67.0] 9.83 [9.30–10.40]4.00 or more credits 69.8 [65.7–73.8] 9.84 [9.40–10.30]
† Not applicable.‡ Reporting standards not met.
2 Worked 35 hours or more per week.
NOTE: See the Technical Notes for the definition of 95% CI (confidence interval). SOURCE: U.S. Department of Education, National Center for Education Statistics, Education Longitudinal Study of 2002 (ELS:2002), “Second Follow-up, 2006” and High School Transcript Study (HSTS), 2004.
1 The 2- and 3-credit occupational concentrators are graduates who earned at least 2.0 and 3.0 credits, respectively, in one of the 12 occupational areas listed in the table. Graduates can concentrate in more than one occupational area.
Occupational concentrator status,1 area ofconcentration, and number of occupational credits
3 Graduates who earned less than $2.00 or more than $30.00 hourly in their 2006 job (about 2 percent) were excluded.
Table 8.—Among 2004 public high school graduates who did not enroll in postsecondary education butTable 8.—worked for pay within the first 2 years after high school graduation, percentage currently Table 8.—working full time and average hourly wage for their current job, by occupational concentrator Table 8.—status, area of concentration, and number of occupational credits earned in high school: 2006
Percent working full time2 Average hourly wage3

National Center for Education Statistics
Current occupation Pct. 95% CI Pct. 95% CI Pct. 95% CI Pct. 95% CI Pct. 95% CI
Total 100.0 [†] 100.0 [†] 100.0 [†] 100.0 [†] 100.0 [†]
Business operations, management, and administrative support 19.2 [16.6–21.9] 20.4 [16.8–23.9] 17.6 [13.9–21.4] 20.2 [17.0–23.3] 16.2 [11.3–21.0]Computer and mathematical sciences 0.4 [0.0–0.8] 0.7 [0.0–1.4] # [†] 0.5 [0.0–1.1] # [†]Construction, architecture, and building and grounds maintenance 15.6 [13.0–18.2] 14.0 [10.8–17.2] 17.9 [13.9–21.8] 14.3 [11.5–17.2] 19.7 [14.1–25.3]Education and library, community, social, legal, and protective services 3.5 [2.3–4.8] 3.9 [2.2–5.5] 3.0 [1.2–4.8] 4.0 [2.4–5.5] 2.1 [0.0–4.1]Engineering and military specific occupations 3.9 [2.6–5.2] 4.6 [2.6–6.5] 2.9 [1.5–4.4] 4.3 [2.7–6.0] 2.4 [0.7–4.0]Farming, fishing, and forestry 1.8 [0.9–2.7] 1.3 [0.3–2.2] 2.6 [0.9–4.2] 1.8 [0.7–2.8] 1.9 [0.1–3.8]Health care practitioners, technicians, and support 3.0 [2.1–4.0] 3.0 [1.6–4.3] 3.1 [1.7–4.4] 2.9 [1.8–4.1] 3.3 [1.3–5.3]Installation, maintenance, repair, transportation, and materials moving 12.8 [10.6–14.9] 10.5 [7.9–13.0] 16.0 [12.5–19.5] 10.5 [8.2–12.9] 20.0 [14.6–25.4]Media, communication, and design 0.6 [0.1–1.1] 0.8 [0.0–1.7] 0.3 [0.0–0.7] 0.7 [0.0–1.4] 0.3 [0.0–0.9]Personal care and food preparation services 15.5 [13.3–17.7] 18.2 [14.8–21.6] 11.7 [8.5–14.8] 16.9 [14.2–19.7] 10.8 [6.4–15.2]Production 9.1 [7.2–11.1] 6.3 [4.2–8.4] 13.2 [9.8–16.5] 7.6 [5.6–9.7] 14.2 [9.5–18.8]Sales and related occupations 13.8 [11.5–16.0] 15.7 [12.5–19.0] 11.0 [7.9–14.0] 15.2 [12.3–18.1] 9.0 [5.5–12.5]All other occupations 0.8 [0.2–1.4] 0.8 [0.0–1.5] 0.8 [0.0–1.8] 1.0 [0.2–1.7] 0.2 [0.0–0.6]
† Not applicable.# Rounds to zero.
Table 9-A.—Among 2004 public high school graduates who did not enroll in postsecondary education but worked for pay within the firstTable 9-A.—2 years after high school graduation, percentage distribution by current occupation, overall and for high schoolTable 9-A.—nonconcentrators and concentrators: 2006
2-credit occupational concentrator status1 3-credit occupational concentrator status1
SOURCE: U.S. Department of Education, National Center for Education Statistics, Education Longitudinal Study of 2002 (ELS:2002), “Second Follow-up, 2006” and High School Transcript Study (HSTS), 2004.
All graduates
1 The 2- and 3-credit occupational concentrators are graduates who earned at least 2.0 and 3.0 credits, respectively, in one of the following 12 occupational areas: agriculture and natural resources, business, communications and design, computer and information sciences, construction and architecture, consumer and culinary services, engineering technologies, health sciences, manufacturing, marketing, public services, and repair and transportation. Graduates can concentrate in more than one occupational area.
NonconcentratorsOccupational concentrators Nonconcentrators
Occupational concentrators
NOTE: See the Technical Notes for the definition of 95% CI (confidence interval). Current occupation refers to graduate’s occupation at the time of the 2006 interview. Detail may not sum to totals because of rounding.
National Center for Education Statistics
Current occupation Pct. 95% CI Pct. 95% CI Pct. 95% CI
Total 100.0 [†] 100.0 [†] 100.0 [†]
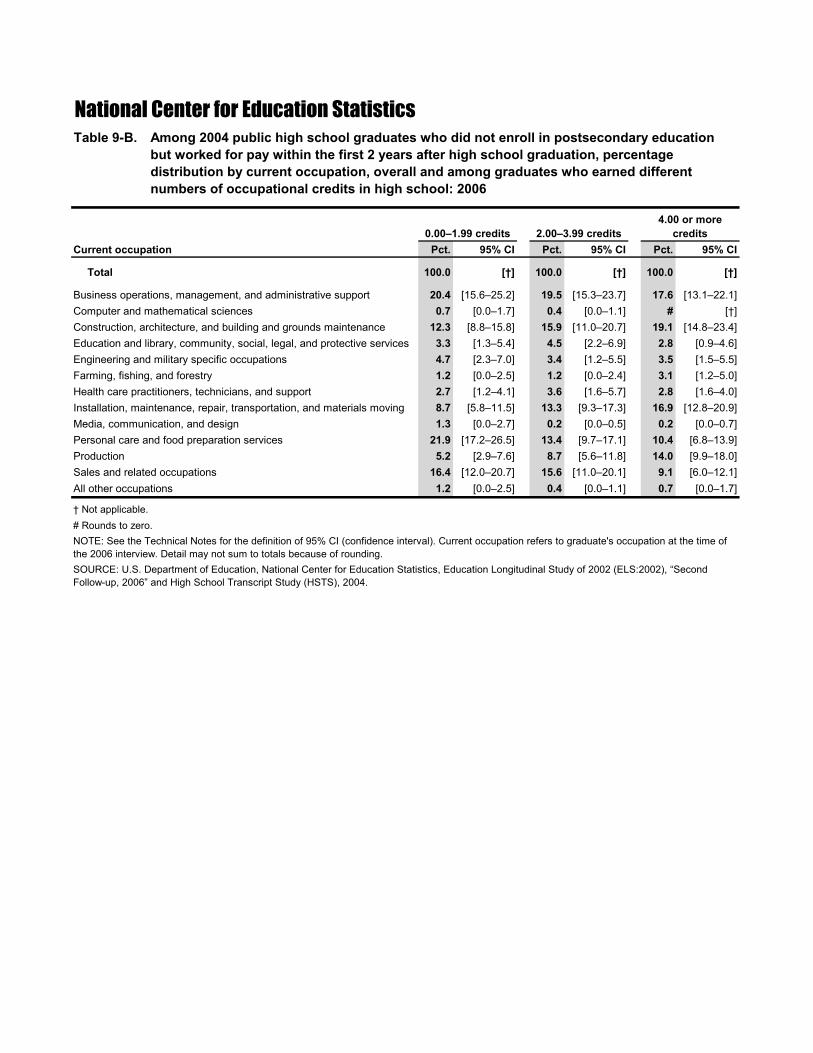
Business operations, management, and administrative support 20.4 [15.6–25.2] 19.5 [15.3–23.7] 17.6 [13.1–22.1]Computer and mathematical sciences 0.7 [0.0–1.7] 0.4 [0.0–1.1] # [†]Construction, architecture, and building and grounds maintenance 12.3 [8.8–15.8] 15.9 [11.0–20.7] 19.1 [14.8–23.4]Education and library, community, social, legal, and protective services 3.3 [1.3–5.4] 4.5 [2.2–6.9] 2.8 [0.9–4.6]Engineering and military specific occupations 4.7 [2.3–7.0] 3.4 [1.2–5.5] 3.5 [1.5–5.5]Farming, fishing, and forestry 1.2 [0.0–2.5] 1.2 [0.0–2.4] 3.1 [1.2–5.0]Health care practitioners, technicians, and support 2.7 [1.2–4.1] 3.6 [1.6–5.7] 2.8 [1.6–4.0]Installation, maintenance, repair, transportation, and materials moving 8.7 [5.8–11.5] 13.3 [9.3–17.3] 16.9 [12.8–20.9]Media, communication, and design 1.3 [0.0–2.7] 0.2 [0.0–0.5] 0.2 [0.0–0.7]Personal care and food preparation services 21.9 [17.2–26.5] 13.4 [9.7–17.1] 10.4 [6.8–13.9]Production 5.2 [2.9–7.6] 8.7 [5.6–11.8] 14.0 [9.9–18.0]Sales and related occupations 16.4 [12.0–20.7] 15.6 [11.0–20.1] 9.1 [6.0–12.1]All other occupations 1.2 [0.0–2.5] 0.4 [0.0–1.1] 0.7 [0.0–1.7]
† Not applicable.# Rounds to zero.
SOURCE: U.S. Department of Education, National Center for Education Statistics, Education Longitudinal Study of 2002 (ELS:2002), “Second Follow-up, 2006” and High School Transcript Study (HSTS), 2004.
Table 9-B.—Among 2004 public high school graduates who did not enroll in postsecondary educationTable 9-B.—but worked for pay within the first 2 years after high school graduation, percentageTable 9-B.—distribution by current occupation, overall and among graduates who earned differentTable 9-B.—numbers of occupational credits in high school: 2006
4.00 or more credits0.00–1.99 credits 2.00–3.99 credits
NOTE: See the Technical Notes for the definition of 95% CI (confidence interval). Current occupation refers to graduate's occupation at the time of the 2006 interview. Detail may not sum to totals because of rounding.

National Center for Education Statistics
Area of concentration1 Pct. 95% CI
2-credit occupational concentrators 25.9 [21.4–30.5]Agriculture and natural resources 0.6 [0.0–1.7]Business 15.7 [6.2–25.1]Communications and design # [†]Computer and information sciences # [†]Construction and architecture 37.1 [20.3–53.9]Consumer and culinary services 30.7 [15.5–45.8]Engineering technologies 10.2 [0.0–22.1]Health sciences ‡ [†]Manufacturing 19.2 [9.7–28.8]Marketing 13.2 [1.2–25.1]Public services ‡ [†]Repair and transportation 30.4 [18.9–41.8]
3-credit occupational concentrators 30.6 [23.9–37.3]Agriculture and natural resources # [†]Business 25.7 [9.0–42.5]Communications and design ‡ [†]Computer and information sciences ‡ [†]Construction and architecture 42.8 [20.2–65.3]Consumer and culinary services 38.8 [19.6–58.1]Engineering technologies ‡ [†]Health sciences ‡ [†]Manufacturing 16.6 [5.2–28.0]Marketing ‡ [†]Public services ‡ [†]Repair and transportation 38.9 [24.3–53.5]
† Not applicable.# Rounds to zero.‡ Reporting standards not met.1 The 2- and 3-credit occupational concentrators are graduates who earned at least 2.0 and 3.0 credits, respectively, in one of the 12 occupational areas listed in the table. Graduates can concentrate in more than one occupational area.NOTE: See the Technical Notes for the definition of 95% CI (confidence interval). See Exhibit 1 for occupations related to occupational concentration areas listed in this table.SOURCE: U.S. Department of Education, National Center for Education Statistics, Education Longitudinal Study of 2002 (ELS:2002), “Second Follow-up, 2006” and High School Transcript Study (HSTS), 2004.
Table 10.—Among 2004 public high school graduates who were not enrolled in postsecondary educationTable 10.—but were working for pay in 2006, percentage of occupational concentrators working inTable 10.—occupational areas related to their concentration areas in high school: 2006

National Center for Education Statistics
Area of concentration1 Pct. 95% CI
2-credit occupational concentrators 20.1 [18.1–22.0]Agriculture and natural resources 16.4 [11.2–21.6]Business 27.6 [23.5–31.8]Communications and design 12.8 [9.0–16.6]Computer and information sciences 17.2 [11.9–22.6]Construction and architecture 26.2 [17.3–35.2]Consumer and culinary services 28.5 [22.1–34.8]Engineering technologies 16.9 [10.6–23.2]Health sciences 29.5 [21.6–37.4]Manufacturing 20.2 [13.8–26.5]Marketing 15.4 [9.7–21.2]Public services 16.9 [3.2–30.5]Repair and transportation 36.9 [29.5–44.3]
3-credit occupational concentrators 22.1 [19.3–24.9]Agriculture and natural resources 10.5 [5.7–15.3]Business 28.6 [21.7–35.5]Communications and design 10.9 [5.0–16.7]Computer and information sciences 19.6 [8.1–31.1]Construction and architecture 28.5 [16.0–41.0]Consumer and culinary services 32.9 [24.5–41.4]Engineering technologies 10.7 [2.5–18.9]Health sciences 28.6 [19.3–38.0]Manufacturing 18.0 [9.6–26.5]Marketing 18.3 [8.5–28.2]Public services ‡ [†]Repair and transportation 40.0 [30.4–49.7]
† Not applicable.‡ Reporting standards not met.
Table 11.—Among 2004 public high school graduates who concentrated in each occupational area inTable 11.—high school, percentage whose postsecondary major, first job, or current job was relatedTable 11.—to their area of concentration: 2006
SOURCE: U.S. Department of Education, National Center for Education Statistics, Education Longitudinal Study of 2002 (ELS:2002), “Second Follow-up, 2006” and High School Transcript Study (HSTS), 2004.
1 The 2- and 3-credit occupational concentrators are graduates who earned at least 2.0 and 3.0 credits, respectively, in one of the 12 occupational areas listed in the table. Graduates can concentrate in more than one occupational area.NOTE: See the Technical Notes for the definition of 95% CI (confidence interval). See Exhibit 1 for postsecondary majors and occupations related to occupational concentration areas listed in this table.

Exhibit 1. Crosswalk of high school occupational concentration areas, related postsecondary majors, and related fields of employment
High school occupational concentration area, based on the Secondary School Taxonomy (SST)
Field of study for postsecondary major, based on the Classification of Instructional Programs (CIP)
Occupation, based on the Occupational Information Network (O*NET)
Agriculture and natural resources Agriculture, natural resources, and conservation Farming, fishing, and forestry
Business Business support, management, and finance Business operations, management, and administrative support
Communications and design Communication, media studies, journalism, design and applied arts, and commercial and advertising arts
Media, communication, and design
Computer and information sciences Computer, information sciences, and support technology Computer and mathematical sciences
Construction and architecture Construction and architecture Construction, architecture, and building and grounds maintenance
Consumer and culinary services Parks, recreation, leisure, and fitness studies, personal and culinary services, family, consumer, and human sciences
Personal care and food preparation services
Engineering technologies Engineering and related technologies Engineering and military specific occupations
Health sciences Health professions and clinical sciences Healthcare practitioners, technicians, and support
Marketing Marketing and real estate Sales and related occupations
Manufacturing Precision production Production
Public services Education, legal studies, public administration, social services, and security and protective services
Education and library, community social, legal, and protective services
Repair and transportation Mechanical and repair technologies, transportation, and materials moving
Installation, maintenance, repair, transportation and materials moving
SOURCE: Bradby and Hudson (2007) for Secondary School Taxonomy (SST). U.S. Department of Education (2002) for Classification of Instructional Programs (CIP). Occupational Information Network (O*NET) http://online.onetcenter.org/.

LABEL
GLOSSARY G1
Glossary All of the variables that were used in the Issue Tables are described in this glossary. The variables were taken or derived from the Education Longitudinal Study Base-Year to Second Follow-up data (ELS:2002/06). The items are listed in alphabetical order by the variable label.
2006 unemployment rate The unemployment rate is calculated based on the status of 2004 public high school graduates at the time of the 2006 interview. It excludes graduates who were out of the labor force. It is calculated as: Unemployment rate = (number of graduates who were not working but looking for work (F2C13=0 and F2C15=1 or 2)) / (number of graduates who were not working but looking for work (F2C13=0 and F2C15=1 or 2) + number of graduates who were working (F2C13=1)).
Area of concentration See Occupational concentrator status and area of concentration.
Average hourly wage for the 2006 job For 2004 public school graduates who did not enroll in postsecondary education but worked for pay within the first 2 years after high school graduation, this varia-ble indicates the average hourly wage for their job at the time of the 2006 inter-view. Respondents’ reported earnings (F2C19A) were converted into hourly wages according to the unit of working time for the earnings (e.g., per hour, per day, per week, etc.) (F2C19B). Students who had earned less than $2.00 or more than $30.00 per hour in their 2006 job (about 2 percent of cases for each variable) were excluded as outliers.
Enrolled immediately and full time This variable indicates that 2004 public high school graduates had enrolled in postsecondary education by October 2004 (F2RTYPE=1 or 3) and were enrolled full time or mainly full time (F2PS1FTP=1).
Ever enrolled in postsecondary education This variable indicates that the respondent had enrolled in postsecondary educa-tion by the time of the 2006 interview (F2RTYPE=1 to 4).
Ever unemployed For 2004 public school graduates who did not enroll in postsecondary education but worked for pay within the first 2 years after high school graduation, this varia-ble indicates whether the graduate has ever been unemployed since leaving high school (F2NUNEMP>0).
Ever worked for pay This variable indicates whether the respondent ever held a job within the first 2 years after leaving high school (F2EVRJOB=1).
First enrolled in 4-year institution For those who had enrolled in postsecondary education within the first 2 years af-ter high school graduation, this variable indicates that the graduate first enrolled in a 4-year college or university (F2PS1SEC=1 to 3).

LABEL
GLOSSARY G2
Job at the time of the 2006 interview For 2004 public school graduates who did not enroll in postsecondary education but worked for pay within the first 2 years after high school graduation, this varia-ble indicates that the respondent held a job at the time of the 2006 interview (F2C13=1).
Never enrolled but worked for pay This variable indicates that the graduate had not enrolled in postsecondary edu-cation (F2RTYPE=5 to 6), but had held a job within the first 2 years after high school graduation (F2EVRJOB=1).
Never enrolled nor worked for pay This variable indicates that the graduate had neither enrolled (F2RTYPE=5 to 6) nor held a job within the first 2 years after high school graduation (F2EVRJOB=0).
Number of occupational credits Occupational credits are credits that students earn in any area of occupational education (see Occupational concentrator status and area of concentration). The number of occupational credits a student earned (F1CSCRED) was summed and aggregated into three categories: 0.00−1.99 credits, 2.00−3.99 credits, and 4.00 or more credits.
Occupation at the time of the 2006 interview For 2004 public school graduates who did not enroll in postsecondary education but worked for pay within the first 2 years after high school graduation, this varia-ble indicates the respondent’s occupation at the time of the 2006 interview (F2ONETC2, F2ONETC6).
Occupational concentrator status and area of concentration Occupational concentrator status indicates whether a student has earned the minimum number of credits (i.e., 2 or 3 credits depending on the definition of oc-cupational concentrators) in a specific area of occupational education in high school. A credit is equal to a Carnegie unit, which is awarded for a class that meets for one period per day for the entire school year or the equivalent instruc-tional time. The variable was constructed based on the number of credits a stu-dent earned (F1CSCRED) in occupational areas (F1CCSSC)(see below). The variable was aggregated into the following two categories:
Concentrator A concentrator is defined in two ways. The first definition uses the 2-credit threshold and defines an occupational concentrator as a student who earned at least 2 credits in at least one of the 12 broad occupational areas listed below. The second definition uses the 3-credit threshold and defines an occupa-tional concentrator as a student who earned at least 3 credits in at least one of the 12 broad occupational areas.

LABEL
GLOSSARY G3
Occupational concentrator status and area of concentration—continued Nonconcentrator A student who has not earned the minimum
number of credits within any specific area of occupational education required to be con-sidered a concentrator
Twelve broad occupational areas of concentration were identified from students’ transcript data file (F1CCSSC, course codes based on the Secondary School Taxonomy):
agriculture and natural resources (F1CCSSC=10100, 10111, 10121, 10131, 10141, 10161, 10171, 10172, 10181, 10182, 10200, 10211, 10212, 10213, 10214, 10221, 10231, 10241, 10251, 10261, 10271, 10300, 10311, 10312, 10313, 10321, 10331, 10400, 10411, 10412, 10421, 10500, 10511, 10600, 10611, 10621, 10631, 10632, 10641, 10651, 10661, 10662, 10671, 10681, 10700, 19900, 20100, 20111, 20121, 20122, 20123, 20124, 20200, 20211, 20212, 20221, 20222, 20231, 20241, 20251, 20261, 20262, 20271, 20272, 20281, 20300, 20400, 20411, 20421, 20422, 20423, 20500, 20511, 29900, 30100, 30200, 30211, 30212, 30213, 30221, 30300, 30311, 30400, 30500, 30511, 30512, 30521, 30600, 30611, 30621, 30711, 30712, 39900, 480400, 551011, 551019, 551021, 551029, 551031, 551039, 551111, 551119, 551121, 551129, 551211, 551219, 551221, 551229, 551311, 551319, 551321, 551329, 551411, 551419, 551511, 551519)
business (F1CCSSC=70151, 70152, 70161, 70162, 70300, 70311, 70321, 70322, 70331, 70332, 70341, 70351, 70352, 70371, 70600, 70611, 70612, 70621, 70631, 70632, 70641, 70642, 70643, 70651, 70661, 70671, 70681, 70700, 70712, 70713, 70731, 70732, 70733, 70741, 70742, 79900, 80781, 80782, 552011, 552019, 552021, 552031, 552111, 552121, 552211, 552221, 552311, 552321 60100, 60111, 60121, 60131, 60141, 60400, 60411, 60500, 60511, 60600, 60700, 60711, 60900, 61100, 61200, 61300, 61400, 61411, 61500, 61600, 61800, 61811, 62000, 69900, 70400, 70500, 80300, 80311, 80321, 60151 60200, 60211, 60300, 60311, 60321, 60331, 60800, 60811, 61000, 61011, 61900, 70100, 70111, 70112, 70121, 70122, 70131, 70141, 70142, 70200, 70201, 70211, 70231, 70241, 70251)
communications and design (F1CCSSC=40500, 40511, 80121, 90100, 90111, 90200, 90211, 90300, 90441, 90442, 90600, 90611, 90612, 90700, 90711, 90721, 99900, 100100, 100111, 100121, 100131, 100132, 100141, 100142, 100143, 100151, 100152, 100161, 100171, 100172, 100173, 100174, 100181, 100191, 100192, 200511, 200512, 200513, 200521, 200531, 480200, 480211, 480212, 480213, 480214, 480221, 480222, 480223, 480224, 480231, 480232, 480233, 480241, 480251, 480261, 480271, 500400, 500411, 500800, 500811, 557111, 557119, 557121, 557129, 480281, 480282, 480283, 90121, 90500)

LABEL
GLOSSARY G4
Occupational concentrator status and area of concentration—continued computer and information sciences (F1CCSSC=110100, 110121, 110122, 110131, 110132, 110141, 110143, 110144, 110151, 110200, 110211, 110212, 110213, 110221, 110231, 110232, 110241, 110242, 110251, 110252, 110261, 110271, 110272, 110273, 110300, 110311, 110312, 110313, 110321, 110400, 110500, 110600, 110601, 110602, 110603, 110604, 119900, 151001) construction and architecture (F1CCSSC=210113, 210114, 210130, 210131, 460100, 460111, 460112, 460113, 460121, 460131, 460200, 460211, 460212, 460213, 460311, 460312, 460400, 460411, 460412, 460413, 460421, 460422, 460431, 460451, 460452, 460500, 460511, 460512, 469900, 558011, 558019, 558021, 558029, 558031, 558039, 558111, 558119, 558121, 558129, 558211, 558219, 558221, 558229, 558311, 558319, 558321, 558329, 558411, 558419, 558421, 558429, 558511, 558519, 558521, 558529, 460432, 40100, 40200, 40211, 40212, 40221, 40300, 40400, 40600, 40700, 49900, 480121, 480122, 480123, 480124)
consumer and culinary services (F1CCSSC=10521, 81111, 81121, 120100, 120111, 120112, 120200, 120300, 120400, 120411, 120412, 120413, 120414, 120415, 120421, 120422, 120423, 120431, 129900, 190300, 200121, 200122, 200123, 200124, 200125, 200126, 200151, 200152, 200153, 200154, 200161, 200162, 200193, 200194, 200200, 200211, 200221, 200231, 200241, 200261, 200262, 200321, 200361, 200371, 200500, 200541, 200571, 200572, 200573, 200574, 200600, 200611, 200621, 200631, 200641, 200642, 200643, 200644, 200651, 200661, 200671, 209900, 310100, 310211, 310300, 310400, 319900, 490131, 554111, 554119, 554121, 554129, 556111, 556119, 556121, 556129, 556211, 556219, 556221, 556229, 556411, 556419, 556421, 556429, 556511, 556519, 556521, 556529, 556611, 556619, 556621, 556629, 310111, 310200, 200188, 200400, 200411, 200412, 200413, 200421, 200431, 200441, 200451, 200471, 200481, 480411, 480412, 520106, 556311, 556319, 556321, 556329, 557311, 557319, 557321, 557329)
engineering technologies (F1CCSSC=150100, 150111, 150200, 150211, 150221, 150300, 150311, 150321, 150331, 150332, 150333, 150341, 150400, 150411, 150412, 150421, 150431, 150500, 150511, 150600, 150601, 150611, 150612, 150621, 150631, 150700, 150711, 150800, 150811, 150821, 150900, 150911, 150921, 159900, 410100, 410200, 410300, 419900, 480100, 480111, 480112, 480113, 480114, 480131, 480132, 480141, 480151, 480152)

LABEL
GLOSSARY G5
Occupational concentrator status and area of concentration—continued health sciences (F1CCSC=70100, 170111, 170112, 170121, 170131, 170132, 170200, 170211, 170221, 170300, 170311, 170312, 170321, 170322, 170400, 170411, 170421, 170431, 170500, 170511, 170521, 170522, 170531, 170541, 170551, 170571, 170591, 170592, 170593, 170600, 170611, 170621, 170631, 170641, 170700, 170711, 170800, 179900, 180100, 180200, 180300, 180400, 180500, 180600, 180700, 180800, 180900, 181000, 181100, 181200, 181300, 181400, 181411, 181500, 181600, 181700, 181800, 181801, 181900, 182000, 182200, 182300, 182400, 189900, 200461, 553011, 553019, 553021, 553029, 553031, 553039, 553111, 553119, 553121, 553129, 553211, 553219, 553221, 553229, 170561, 310121) manufacturing (F1CCSC=170100, 170111, 170112, 170121, 170131, 170132, 170200, 170211, 170221, 170300, 170311, 170312, 170321, 170322, 170400, 170411, 170421, 170431, 170500, 170511, 170521, 170522, 170531, 170541, 170551, 170571, 170591, 170592, 170593, 170600, 170611, 170621, 170631, 170641, 170700, 170711, 170800, 179900, 180100, 180200, 180300, 180400, 180500, 180600, 180700, 180800, 180900, 181000, 181100, 181200, 181300, 181400, 181411, 181500, 181600, 181700, 181800, 181801, 181900, 182000, 182200, 182300, 182400, 189900, 200461, 553011, 553019, 553021, 553029, 553031, 553039, 553111, 553119, 553121, 553129, 553211, 553219, 553221, 553229, 170561, 310121)
marketing (F1CCSC=60712, 61700, 61711, 80100, 80111, 80131, 80132, 80200, 80400, 80500, 80511, 80600, 80611, 80612, 80621, 80622, 80700, 80711, 80712, 80713, 80721, 80722, 80731, 80741, 80751, 80771, 80800, 80811, 80900, 80911, 80921, 80922, 81000, 81100, 81200, 81211, 81221, 89900, 80331)
repair and transportation (F1CCSC=120511, 120512, 120513, 120514, 120521, 120522, 120523, 120531, 120532, 460300, 460321, 470100, 470111, 470121, 470122, 470123, 470124, 470131, 470132, 470141, 470151, 470181, 470200, 470211, 470212, 470213, 470300, 470311, 470312, 470321, 470331, 470332, 470341, 470342, 470343, 470400, 470411, 470421, 470433, 470434, 470500, 470511, 470512, 470513, 470514, 470521, 470600, 470611, 470612, 470621, 470622, 470623, 470624, 470625, 470631, 470632, 470633, 470641, 470642, 470661, 470662, 470671, 470672, 470673, 470674, 470681, 470682, 470691, 470692, 479900, 490141, 490142, 490311, 490312, 490341, 559011, 559019, 559021, 559029, 559111, 559119, 559121, 559129, 80761, 490100, 490111, 490112, 490200, 490211, 490212, 490213, 490214, 490300, 490331, 490411, 490412, 490421, 499900)

LABEL
GLOSSARY G6
Occupational concentrator status and area of concentration—continued public services (F1CCSC=130100, 130200, 130300, 130400, 130500, 130600, 130700, 130800, 130900, 131000, 131100, 131200, 131300, 131400, 139900, 200251, 200252, 131201, 131202, 250100, 250111, 250200, 250300, 250311, 250400, 250500, 259900, 440100, 440200, 440400, 440500, 440600, 440700, 440711, 449900, 440300, 70662, 182100, 430100, 430111, 430121, 430200, 430211, 430300, 430311, 439900, 450400, 430221)
Persisted in postsecondary education For 2004 public high school graduates who enrolled in postsecondary education within the first 2 years after high school graduation, this variable indicates that they either attained a credential (F2RTYPE=3 or 4 and F2B29A=1) or were still enrolled in a postsecondary institution at the time of the 2006 interview (F2RTYPE=1 or 2).
Postsecondary major For 2004 public high school graduates who enrolled in postsecondary education within the first 2 years after high school graduation, this variable indicates their field of study at the 2006 postsecondary institution (F2MAJOR4).
Worked full time while enrolled For 2004 public high school graduates who enrolled in postsecondary education within the first 2 years after high school graduation, this variable indicates that they worked 35 hours or more per week while enrolled (F2C26R≥35 or F2C31R≥35).
Working full time For 2004 public school graduates who did not enroll in postsecondary education but worked for pay within the first 2 years after high school graduation, this varia-ble indicates that the respondent worked 35 hours or more per week (F2C18R).