postnatal development of layer iii pyramidal cells in the ... › download › pdf ›...
TRANSCRIPT
ORIGINAL RESEARCH ARTICLEpublished: 08 March 2013
doi: 10.3389/fncir.2013.00031
Postnatal development of layer III pyramidal cells in theprimary visual, inferior temporal, and prefrontal corticesof the marmosetTomofumi Oga1,2, Hirosato Aoi1,2, Tetsuya Sasaki1, Ichiro Fujita 2,3 and Noritaka Ichinohe1*
1 Department of Ultrastructural Research, National Institute of Neuroscience, National Center of Neurology and Psychiatry, Kodaira, Tokyo, Japan2 Laboratory for Cognitive Neuroscience, Graduate School of Frontier Biosciences, Osaka University, Toyonaka, Osaka, Japan3 Center for Information and Neural Networks, National Institute of Information and Communications Technology, Osaka University, Yamadaoka, Suita, Osaka, Japan
Edited by:
Yoshiyuki Kubota, National Institutefor Physiological Sciences, Japan
Reviewed by:
Kathleen S. Rockland,Massachusetts Institute ofTechnology, USAGuy Elston, Centre for CognitiveNeuroscience, Australia
*Correspondence:
Noritaka Ichinohe, Department ofUltrastructural Research, NationalInstitute of Neuroscience, NationalCenter of Neurology and Psychiatry,4-1-1 Ogawa-Higashi, Kodaira,Tokyo 187-8502, Japan.e-mail: [email protected]
Abnormalities in the processes of the generation and/or pruning of dendritic spines havebeen implicated in several mental disorders including autism and schizophrenia. We havechosen to examine the common marmoset (Callithrix jacchus) as a primate model toexplore the processes. As a first step, we studied the postnatal development of basaldendritic trees and spines of layer-III pyramidal cells in the primary visual sensory cortex(V1), a visual association cortex (inferior temporal area, TE), and a prefrontal cortex (area12, PFC). Basal dendrites in all three areas were longer in adulthood compared with thosein the newborn. In particular, rapid dendritic growth occurred in both TE and PFC aroundthe second postnatal month. This early growth spurt resulted in much larger dendriticarbors in TE and PFC than in V1. The density of the spines along the dendrites peaked at3 months of age and declined afterwards in all three areas: the degree of spine pruningbeing greater in V1 than in TE and PFC. The estimates of the total numbers of spinesin the basal dendrites of a single pyramidal cell were larger in TE and PFC than in V1throughout development and peaked around 3 months after birth in all three areas. Thesedevelopmental profiles of spines and dendrites will help in determining assay points forthe screening of molecules involved in spinogenesis and pruning in the marmoset cortex.
Keywords: autism, area differences, dendritic spine, schizophrenia, spinogenesis
INTRODUCTIONInvestigating the mechanisms underlying neuropsychiatric dis-orders, including autism spectrum disorders, Rett syndrome,and schizophrenia is a rapidly progressing area in neuroscience.Recent studies have identified many genes and copy numbervariants related to these disorders, and these are suggested tocause morphological and functional synaptic abnormalities, cir-cuit alterations, changes in excitatory and inhibitory balance,and behavioral symptoms (van Spronsen and Hoogenraad, 2010;Penzes et al., 2011; Levenga and Willemsen, 2012). Among thesealtered endophenotypes, an abnormal number of spines is animportant pathogenesis shared by several neuropsychiatric disor-ders (Kaufmann and Moser, 2000; Penzes et al., 2011).
In the cerebral cortex of macaque monkeys and humans, thenumber of dendritic spines rapidly increases after birth and peaksaround the end of the neonatal period or in an early phase ofthe infantile period (Huttenlocher, 1990; Petanjek et al., 2008,2011; Elston et al., 2009, 2010a,b, 2011). Spine density thendecreases during the later infantile period and adolescence periodto reach the adult level, suggesting that the pruning of exist-ing spines exceeds the generation of new spines in this period(Missler et al., 1993). This overshoot-type time course of spineformation and pruning has attracted the attention of researchersbecause of its possible involvement in developmental disordersand psychiatric diseases (Penzes et al., 2011). In autism, excessive
spine formation and/or incomplete spine pruning may occurin childhood, which has been discussed as possibly providinga diagnostically useful increase in spine number (Hutsler andZhang, 2010). In Rett syndrome and several other developmen-tal disorders with autism-like symptoms, dendrites, and spines inpyramidal neurons decrease in number (Kaufmann and Moser,2000). In subjects with schizophrenia, the over-pruning of spinesduring late childhood or adolescence has been implicated in thefindings of a decreased number of spines (Glantz and Lewis, 2000;Kalus et al., 2000; Broadbelt et al., 2002; Garey, 2010). An under-standing of the molecular underpinnings of spine pathology mayprovide insights into the etiology of these diseases and lead to thediscovery of new drug targets.
The common marmoset (Callithrix jacchus) has become anincreasingly important animal model in studies of the neu-ronal mechanisms of neuropsychiatric disorders involving socialand emotional impairments. The reason is several-fold. First,there is the possibility of applying transgenic manipulations tothis species (Sasaki et al., 2009). Second, this species rapidlymatures, which makes developmental studies feasible. Third, themarmoset has rich social communication, which is critically dev-astated in autism spectrum disorders (Snowdon, 1997; Eliadesand Wang, 2008; Agustín-Pavón et al., 2012). Finally, rodentsdo not show the peaking (overshoot-type) profile of dendriticspine development characteristic of the primate cerebral cortex
Frontiers in Neural Circuits www.frontiersin.org March 2013 | Volume 7 | Article 31 | 1
NEURAL CIRCUITS

Oga et al. Spine development in marmoset cortex
(Micheva and Beaulieu, 1996), and they may not represent amodel suitable for examining the relationship between spinedevelopment and neuropsychiatric disorders.
In this study, we studied the developmental profiles of thebasal dendritic trees and spines of layer-III pyramidal cells in theprimary visual sensory cortex (V1), a visual association cortex(inferior temporal area, TE), and an executive control area (area12 of the prefrontal cortex, PFC) of the common marmoset. Wefound that all three areas showed an overshoot-type pattern ofspine development, which was similar to that seen in humansand macaques. Basal dendrites in all three areas became longerafter birth. In particular, neurons in TE and PFC exhibited dra-matic growth of the basal dendrites during the first 2 monthsafter birth; the basal dendrites of layer-III pyramidal cells in TEand PFC thus covered a wider cortical area than those in V1. Thethree areas exhibited similar developmental changes in the timecourses of the density of spines along dendrites with a peak inthe third month after birth. In addition, the estimated total num-ber of spines on basal dendrites peaked at 3 months of age inall three areas, and it was nearly three times larger in TE and inPFC than in V1. The developmental time courses of the dendritesand spines and the areal differences will help to determine assaypoints for the future screening of the molecules that are involvedin spinogenesis and pruning in the marmoset cortex.
MATERIALS AND METHODSAs shown in Table 1, we used common marmosets (Callithrix jac-chus) of either sex with the following ages: postnatal day 0 (0D;n = 1), 2 postnatal months (2M; n = 3), 3 postnatal months (3M;n = 1), 6 postnatal months (6M; n = 1), and 4.5 postnatal years(4.5Y; n = 1). All animal care procedures and experiments wereconducted in accordance with protocols that were approved bythe ethics committee for primate research at the National Centerof Neurology and Psychiatry in Japan and that were in compliancewith the National Institutes of Health Guide for the Care and Useof Laboratory Animals.
The above-mentioned time points were selected according tothe following rationale. The 0D animal was examined because ofits few visual experiences. McKinnell et al. (2001) have proposedthat the life of the common marmoset can be divided into threeperiods based on testosterone blood concentrations, which areparticularly important for androgen-related signaling. The three
Table 1 | Vital data of the animals used in the present study.
Age Animal Sex Body weight (g)
0D CJ4 Female 27.0
2Ma CJ6 Female 96.4
2Mb CJ9 Female 95.3
2Mc CJ13 Male 94.2
3M CJ3 Male 101.0
6M CJ5 Male 194.2
4.5 Y CJ1 Male 301.0
Note: 0D, 0 days of age; 2M, 2 months of age; 3M, 3 months of age; 6M,
6 months of age; and 4.5 years of age.
periods have been referred to as neonatal, infantile, and peripu-bertal (McKinnell et al., 2001). Thus, the 2M point is the timewhen plasma testosterone levels markedly decrease, which is asign of the end of the neonatal period (McKinnell et al., 2001).The age of 3M corresponds to the time between the neonataland infantile periods, and the age of 6M corresponds to the timebetween the infantile and prepubertal periods (McKinnell et al.,2001). Finally, four-and-a-half years (4.5 Years) corresponds to amature adult (Chandolia et al., 2006).
The animals were sedated with ketamine hydrochloride(Ketalar, 25 mg/kg i.m.; Daiichi Sankyo Co., Ltd., Tokyo, Japan)and overdosed with sodium pentobarbital (Nembutal, 75 mg/kgi.p.; Dainippon Sumitomo Pharma Co., Ltd., Osaka, Japan).The animals were perfused intracardially with 0.1 M potas-sium phosphate-buffered saline (pH 7.2), followed by 4%paraformaldehyde (Merck, Whitehouse Station, NY). Blocks oftissue were excised from the posterior part of the occipital oper-culum, which corresponded to the central 5–8◦ of the visualfield representation in V1 (Fritsches and Rosa, 1996), the infe-rior temporal gyrus (TE) 2 mm ventral to the posterior edge ofthe superior temporal sulcus (Kaas, 1997), which correspondedto area ITd (Rosa et al., 2009) or TE3 (Paxinos et al., 2011), andthe ventrolateral convexity of PFC, which corresponded to thearea 12l + 12v (Burman and Rosa, 2009) or the area 12L + 12M(Paxinos et al., 2011) (Figure 1A). Note that area 12 in these ref-erences corresponds to area 10 of Brodmann (1909). The blocks
FIGURE 1 | Cortical sampling position (A) and labeled cells (B–D). Theanimals were lightly fixed with paraformaldehyde, and the brains wereremoved, trimmed and flattened, and sliced at 250 µm tangential to thecortical surface. Slices were incubated in 4,6-diamidino-2-phenylindolesolution to visualize neuronal nuclei. Layer III pyramidal cells wereindividually injected with Lucifer yellow and reacted for diaminobenzidineproduct (B–D). Examples of injected cells from the primary visual cortex(V1), the inferior temporal cortex (TE), and the prefrontal cortex (PFC) of a3-month-old monkey are shown in (B), (C), and (D), respectively.Abbreviations: LS, lateral sulcus; STS, superior temporal sulcus. ScaleBars = 300 mm (A), 100 µm (B–D).
Frontiers in Neural Circuits www.frontiersin.org March 2013 | Volume 7 | Article 31 | 2

Oga et al. Spine development in marmoset cortex
were trimmed, flattened, and sliced parallel to the cortical surfaceat a thickness of 250 µm. Slices were incubated in 4,6-diamidino-2-phenylindole (DAPI; Sigma-Aldrich Co. LLC, St. Louis, MO)solution to visualize the cell bodies.
Pyramidal cells were individually injected with 8% LuciferYellow (Sigma-Aldrich Co. LLC, St. Louis, MO) under the visualguidance of ultraviolet illumination (Elston et al., 1997). Allcell bodies of the injected cells were located in the supragran-ular layer, which was immediately above the granular layer andeasily identified in 0.1% DAPI-stained preparations (Elston andRosa, 1997). Only cells located in the lower part of layer III wereinjected.
The sections were processed with a biotinylated antibody (LifeTechnologies Corporation, Grand Island, NY) that was raisedagainst Lucifer Yellow at a concentration of 1:5000 in a stocksolution (2% bovine serum albumin, 1% Triton X-100, and 5%sucrose in 0.1 M phosphate buffer). They were then processedwith a biotin-horseradish peroxidase complex (GE HealthcareBiosciences, Pittsburgh, PA; 1:100 in 0.1 M phosphate buffer)and reacted to obtain a light-stable reaction product of 3,3′-diaminobenzidine tetrahydrochloride (DAB; Sigma-Aldrich Co.
LLC, St. Louis, MO). Figures 1B–D shows examples of injectedcells in V1, TE, and PFC of a 3M monkey.
For the analysis, we included only those cells that had anunambiguous apical dendrite, had their complete basal den-dritic arbors contained within the section, and were well filled.The basal dendritic trees of 324 cells from V1, TE, and PFCwere reconstructed in two dimensions with a computer-aidedtracing system (Neurolucida, MBF Bioscience, Williston, VT;Figure 2). Only the basal dendrites that could be verified asbeing issued from the cell body were included in the analyses.Two-dimensional reconstructions were selected for these analy-ses for the data to be compared directly with previous studies onmacaque cerebral cortex (Elston et al., 2009, 2010a,b, 2011). Fiveto forty-seven cells were included in the analyses of each area/agegroup (Table 2). The branching structures of the dendritic treeswere determined by Sholl analyses (Sholl, 1955).
Spine densities were calculated by drawing the horizontallyprojecting dendrites of randomly selected cells in their entiretywhile visualizing them with a Nikon 100X oil immersion objec-tive (numerical aperture, 1.40) and then counting the number ofspines per 10-µm segment (Eayrs and Goodhead, 1959; Valverde,
FIGURE 2 | Skeletonized, tangential, reconstructions of the basal
dendritic trees of layer-III pyramidal cells (in the tangential plane) sampled
from the primary visual (V1), inferior temporal visual association (TE),
and prefrontal (PFC) cortices at day 0 (0D), 3 months (3M), and adulthood
(4.5Y). The illustrated cells represent the average of all cells sampled for each
cortical area/age group. Insets illustrate the spine density for cells of eachcortical area/age group at 50–70 µm from the cell body. Left Scale Bars= 100 µm (for all of skeletonized reconstructions of the basal dendritic trees ofpyramidal cells), Right Scale Bars = 10 µm (for all of Insets illustrate the spinedensity for cells of each cortical area/age group at 50–70 µm from the cell body).
Frontiers in Neural Circuits www.frontiersin.org March 2013 | Volume 7 | Article 31 | 3

Oga et al. Spine development in marmoset cortex
Table 2 | Vital data of the animals used in the present study.
Age 0D 2Ma 2Mb 2Mc 3M 6M 4.5Y
Animal CJ4 CJ6 CJ8 CJ13 CJ3 CJ5 CJ1
V1 19 12 – – 24 16 35
TE 14 5 5 6 17 34 47
PFC 6 6 6 – 22 15 32
Note: 0D, 0 days of age; 2M, 2 months of age; 3M, 3 months of age; 6M,
6 months of age; 4.5Y, 4.5 years of age.
1967). Spine density was quantified as a function of distancefrom the cell body to the distal tips of the dendrites. We selectedhorizontally projecting dendrites for our calculations of spinedensities to avoid trigonometric errors. Spine densities were cal-culated per 10-µm interval along the entire length of 20 randomlyselected dendrites in each cortical area for each age group. No dis-tinction was made between the different spine types (e.g., sessileor pedunculated spines).
The mean total number of spines within the basal dendritictrees of the cells in each cortical area/age was estimated by sum-ming the products of the mean intersections of each 10 µm ofSholl annuli of the cells (see above) multiplied by the mean spinedensities of each 10 µm of the corresponding distance from thecell body of 20 dendrites (for technical details, see Elston, 2001).
For tests of the size of the dendritic trees and somata, eachcell was represented by a single data point. For each cell, Sholland spine density analyses produced data of the number of inter-sections of Sholl annuli in each 10-µm interval from the cellbody center as well as of the spine density in each 10-µm dis-tance from the cell body center. Thus, we used repeated measuresanalysis of variance (ANOVA) tests for the statistical analyses ofeach area/age (Elston et al., 1997). For comparisons between twodata groups, Student’s t-tests were conducted, and we reportedthe p values. When other statistical methods (Mann–WhitneyU-Test, One-Way ANOVA, repeated measures ANOVA) were per-formed, we specified them as such. These statistical tests wereperformed with StatView (SAS Institute, Inc., Cary, NC), and wedescribed the results as p < 0.05, p < 0.001, or p < 0.0001 withother information (e.g., F value: F-test plays an important rolein the ANOVA, and F value assesses whether any of the sam-pled groups is on average superior or inferior to the others vs.the null hypothesis that all groups yield the same mean; U value:Mann–Whitney’s U-test is a non-parametric statistical test forassessing whether one of two samples of independent observa-tions have larger values than the other. U value assesses how farthe measured data are higher in one group than in the other.). Weset the statistically significant level to p = 0.05.
RESULTSA total of 324 pyramidal cells in layer III were included in theanalyses (Table 2). The following results were based on 50,098individual dendritic spines that were drawn and tallied.
BASAL DENDRITIC FIELD AREAS AND TOTAL BASAL DENDRITICLENGTHSIn order to examine the development of dendritic arbors, we mea-sured basal dendritic field areas and the entire dendritic lengths
that were summed across the basal dendrites. V1, TE, and PFCdiffered in their growth profiles (Figure 2). The dendritic fieldareas of the pyramidal cells in V1 gradually increased from 0Dto 4.5Y, except for a small decline from 3M to 6M (Figure 3A;One-Way ANOVA, p = 2.8 × 10⁻¹⁸). The dendritic field area at4.5Y was 167% larger than that at 0D. In contrast, the dendriticfield areas of TE and PFC showed a marked increase from 0Dto 2M (TE: 319% increase, p = 4.3 × 10⁻⁷; PFC: 209% increase,p = 0.002) and then remained unchanged. Dendritic field areasof TE and PFC were larger at 4.5Y than at 0D (TE: 264% larger;p = 4.3 × 10⁻⁷; PFC: 200% larger, p = 2.9 × 10⁻⁸). Statisticalanalyses (One-Way ANOVAs) revealed that the differences in thesizes of the basal dendritic trees of pyramidal cells in any givencortical area were significant across the age groups (p < 0.001;V1, F4 = 28.00; TE, F4 = 33.15; PFC, F4 = 7.67).
Because of the different developmental profiles of the dendriticfield areas between the three cortical areas and of the differentsizes at 0D, there were relative differences in the dendritic fieldareas among the cortical areas at any given age (Figure 3A). Forexample, at 0D, the rank order of the dendritic field areas wasPFC, TE, and V1. The averaged dendritic field area of PFC neu-rons was 302% larger than that in V1 (p = 4.9 × 10⁻⁹), and theaveraged dendritic field area in TE was 195% larger than that in
FIGURE 3 | Dendritic field areas (A) and total dendritic lengths (B) of
layer-III pyramidal cells in V1, TE, and PFC at 0D, 2M, 3M, 6M, and 4.5Y.
Error bars indicate standard deviations.
Frontiers in Neural Circuits www.frontiersin.org March 2013 | Volume 7 | Article 31 | 4

Oga et al. Spine development in marmoset cortex
V1 (p = 1.4 × 10⁻⁷). Throughout the developmental course, therank order did not change. At 4.5Y, the dendritic field areas ofTE and PFC neurons were 269% and 324% larger than those ofV1, respectively (t-test; p = 1.3 × 10⁻²⁴ for TE vs. V1, p = 1.3 ×10⁻²⁴ for PFC vs. V1). Statistical analyses (One-Way ANOVAs)revealed that the sizes of the dendritic trees of cells at any given agewere significantly different among the cortical areas in all animals(p < 0.001; 0D, F2 = 7.32; 2M, F2 = 14.19; 3M, F2 = 60.72; 6M,F2 = 192.23; 4.5Y, F2 = 114.36).
The total basal dendritic lengths that were summed across thebasal dendrites exhibited developmental changes similar to thoseof the basal dendritic field area (Figures 3A,B). The total den-dritic lengths in TE and PFC markedly increased from 0D to 2M(t-test, p = 1.8 × 10⁻⁷ for TE and 0.014 for PFC). After 2M, thedendritic lengths in TE and PFC stayed almost at the same leveluntil 4.5Y. In contrast, the dendritic lengths of V1 neurons gradu-ally increased from 0D to 4.5Y. The dendrites in TE and PFC weremarkedly longer than those in V1 throughout development. One-Way ANOVAs revealed that the differences in the total lengthsof the basal dendritic trees of pyramidal cells in any given cor-tical area were significant across the age groups (p < 0.001; V1,F4 = 37.81; TE, F4 = 32.73; PFC, F4 = 12.01). Similarly, One-Way ANOVAs revealed that the sizes of the dendritic trees of cellsat any given age were significantly different among the corticalareas in all animals (p < 0.001; 0D, F2 = 34.31; 2M, F2 = 17.46;3M, F2 = 49.46; 6M, F2 = 137.80; 4.5Y, F2 = 93.49).
BRANCHING PATTERNS OF THE BASAL DENDRITIC TREESThe branching complexities, as evidenced by their Sholl pro-files, changed with age in all three areas (Figures 4A,B). We firstexamined the maximum number of mean dendritic intersectionswith Sholl annuli (peak branching complexity; Figure 4B). InV1, the peak branching complexity increased from 0D to 2M,then decreased to 6M, and finally exhibited the largest valueat 4.5Y. The peak branching complexity of neurons in the PFCparalleled the changes in V1. TE exhibited the highest com-plexity at 6M. At 4.5Y, the peak branching complexity in TEand PFC showed a comparable value. Throughout development,V1 neurons showed a substantially lower complexity than TEand PFC neurons. At 0D, the peak numbers of dendritic inter-sections with Sholl annuli were 146% and 152% larger in TEand PFC, respectively, than in V1. At 4.5Y, the numbers were136% and 138% larger in TE and PFC, respectively, than inV1. Comparisons of the branching complexities of the dendritictrees of pyramidal cells among the cortical areas at each givenage revealed that cells in TE and PFC had higher numbers ofbranches than those in V1 at all corresponding ages (p < 0.001).Except at 0D between PFC and V1, complexity was significantlydifferent between TE and V1 and between PFC and V1 at anyages (Figure 4A; Mann–Whitney U-test: 0D, TE vs. V1, U =97,886, n1 = 378, n2 = 475; 2M, TE vs. V1, U = 165,049, n1 =1340, n2 = 300, PFC vs. V1; U = 14,651, n1 = 182, n2 = 300;3M, TE vs. V1, U = 163,875, n1 = 680, n2 = 744, PFC vs. V1,
FIGURE 4 | (A) Sholl plots of the branching patterns of the basal dendritictrees of layer-III pyramidal cells from V1, TE, and PFC. The shaded areasindicate the standard deviations. (B,C) Developmental changes in the peak
number of Sholl intersections, and the distance from the soma to theposition of the peak number of Sholl intersections of layer-III pyramidal cells.Error bars indicate standard deviations.
Frontiers in Neural Circuits www.frontiersin.org March 2013 | Volume 7 | Article 31 | 5

Oga et al. Spine development in marmoset cortex
U = 249,610, n1 = 968, n2 = 744; 6M, U = 156,418, n1 = 1360,n2 = 384, PFC vs. V1, U = 105,281, n1 = 720, n2 = 384; 4.5Y,TE vs. V1, U = 541,615, n2 = 1598, n2 = 980, PFC vs. V1, U =100,920, n2 = 576, n2 = 980).
In addition, the distance from the soma to the Sholl annu-lus with the peak branching complexity increased with age(Figure 4C). In V1, the distance of the peak dendritic complex-ity from the soma gradually increased from 0D to 6M and thenremained nearly the same until 4.5Y. In TE and PFC, the distanceincreased from 0D to 3M and then remained at the same levelfrom 3M to 4.5Y.
Lastly, the statistical analysis (One-Way repeated measuresANOVA) revealed that the numbers of dendritic intersectionswith Sholl annuli were significantly different among the corti-cal areas (p < 0.001) at each given age (0D, F2 = 39.58; 2M,F2 = 16.67; 3M, F2 = 54.85; 6M, F2 = 136.32; 4.5Y, F2 = 92.99:Figure 4A).
SPINE DENSITIES AND NUMBERS ON BASAL DENDRITESThe layer III pyramidal cells in the three cortical areas exhibitedincreases in their spine density on their basal dendrites from 0D to3M with similar time courses and similar amounts (Figures 5A,B;photomicrographs, Figure 2). This increase was evident along theentire extent of the dendrites (Figure 5A). The proximal dendriticsegment that was 10–20 µm from the soma was devoid of spinesthroughout development in all areas. The distance at which spine
density peaked was generally shorter for V1 than for TE, whichwas in turn shorter than for PFC (Figures 5A,C). During a periodfrom 6M to 4.5Y, there was a considerable decrease in spine den-sity in all cortical areas (Figures 5A,B). The decrease in spinedensity was greater in V1 than in TE and PFC (Figures 5A,B).Repeated measures ANOVA revealed that the differences in thespine densities across ages were significantly different in each cor-tical area (p < 0.001; V1, F4 = 180.08; TE, F4 = 109.02; PFC,F4 = 23.73). Repeated measures ANOVA also revealed significantdifferences (p < 0.05) in the spine densities among the corti-cal areas for a given age (0D, F2 = 6.681; 2M, F2 = 103.22; 3M,F2 = 6.627; 6M, F2 = 24.53; 4.5Y, F4 = 185.91).
By combining the data from the Sholl analyses with those ofthe spine densities, we were able to calculate estimates for thetotal number of dendritic spines in the basal dendritic trees of theaverage pyramidal cells in each area for the different age groups(Elston et al., 2001). These calculations revealed dramatic differ-ences in spinogenesis and pruning in the basal dendritic trees oflayer III pyramidal cells across the three areas (Figure 6). Layer-III pyramidal cells in V1 had approximately 180 spines in theirbasal dendritic trees at 0D; this number increased to a maximumof 2300 at 3M and subsequently decreased to 950 at 4.5Y. Neuronsin TE had 360 spines at 0D; this number increased to 6100 spinesat 3M before decreasing to 3100 spines at 4.5Y. Neurons in PFChad 310 spines at 0D; this number increased to 5900 spines at 3Mand then decreased to 3500 spines at 4.5Y. These results indicate
FIGURE 5 | (A) Profiles of the spine densities of the basal dendrites oflayer-III pyramidal cells as a function of distance from soma. The shadedareas indicate the standard deviations. The peak density (spine
number/10 µm) (B), the distance from the soma to the position of peakdensity (C) of layer-III pyramidal cells in V1, TE, and PFC at 0D, 2M, 3M, 6M,and 4.5Y. Error bars indicate standard deviations.
Frontiers in Neural Circuits www.frontiersin.org March 2013 | Volume 7 | Article 31 | 6
Oga et al. Spine development in marmoset cortex
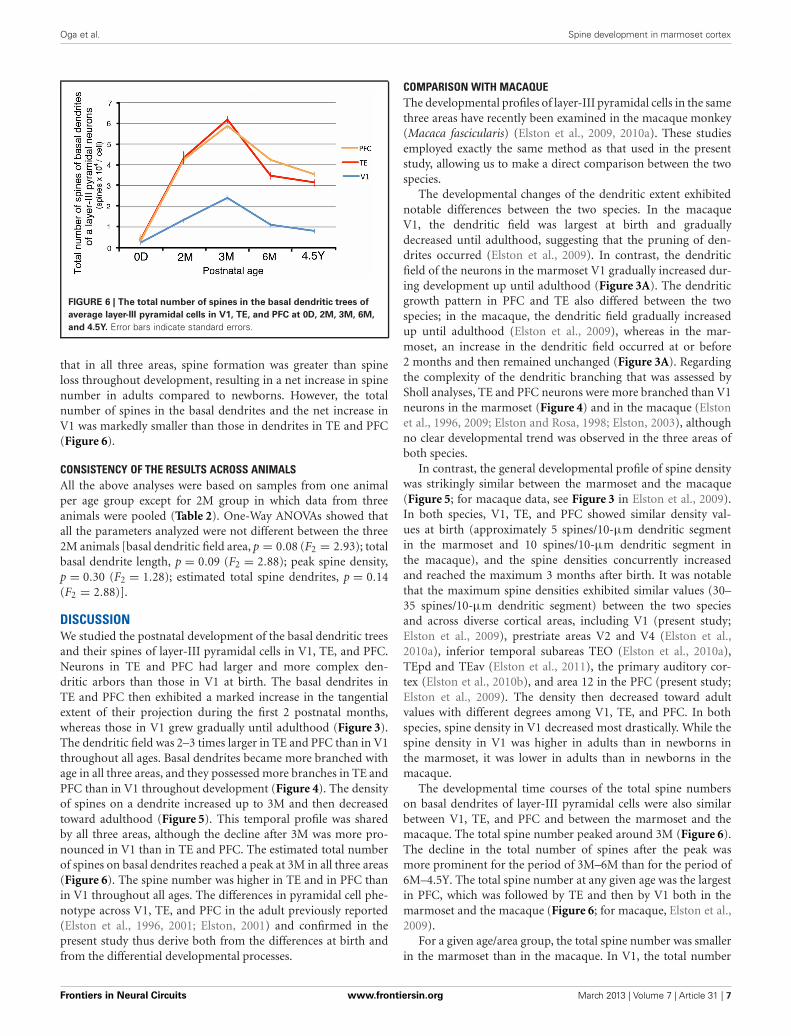
FIGURE 6 | The total number of spines in the basal dendritic trees of
average layer-III pyramidal cells in V1, TE, and PFC at 0D, 2M, 3M, 6M,
and 4.5Y. Error bars indicate standard errors.
that in all three areas, spine formation was greater than spineloss throughout development, resulting in a net increase in spinenumber in adults compared to newborns. However, the totalnumber of spines in the basal dendrites and the net increase inV1 was markedly smaller than those in dendrites in TE and PFC(Figure 6).
CONSISTENCY OF THE RESULTS ACROSS ANIMALSAll the above analyses were based on samples from one animalper age group except for 2M group in which data from threeanimals were pooled (Table 2). One-Way ANOVAs showed thatall the parameters analyzed were not different between the three2M animals [basal dendritic field area, p = 0.08 (F2 = 2.93); totalbasal dendrite length, p = 0.09 (F2 = 2.88); peak spine density,p = 0.30 (F2 = 1.28); estimated total spine dendrites, p = 0.14(F2 = 2.88)].
DISCUSSIONWe studied the postnatal development of the basal dendritic treesand their spines of layer-III pyramidal cells in V1, TE, and PFC.Neurons in TE and PFC had larger and more complex den-dritic arbors than those in V1 at birth. The basal dendrites inTE and PFC then exhibited a marked increase in the tangentialextent of their projection during the first 2 postnatal months,whereas those in V1 grew gradually until adulthood (Figure 3).The dendritic field was 2–3 times larger in TE and PFC than in V1throughout all ages. Basal dendrites became more branched withage in all three areas, and they possessed more branches in TE andPFC than in V1 throughout development (Figure 4). The densityof spines on a dendrite increased up to 3M and then decreasedtoward adulthood (Figure 5). This temporal profile was sharedby all three areas, although the decline after 3M was more pro-nounced in V1 than in TE and PFC. The estimated total numberof spines on basal dendrites reached a peak at 3M in all three areas(Figure 6). The spine number was higher in TE and in PFC thanin V1 throughout all ages. The differences in pyramidal cell phe-notype across V1, TE, and PFC in the adult previously reported(Elston et al., 1996, 2001; Elston, 2001) and confirmed in thepresent study thus derive both from the differences at birth andfrom the differential developmental processes.
COMPARISON WITH MACAQUEThe developmental profiles of layer-III pyramidal cells in the samethree areas have recently been examined in the macaque monkey(Macaca fascicularis) (Elston et al., 2009, 2010a). These studiesemployed exactly the same method as that used in the presentstudy, allowing us to make a direct comparison between the twospecies.
The developmental changes of the dendritic extent exhibitednotable differences between the two species. In the macaqueV1, the dendritic field was largest at birth and graduallydecreased until adulthood, suggesting that the pruning of den-drites occurred (Elston et al., 2009). In contrast, the dendriticfield of the neurons in the marmoset V1 gradually increased dur-ing development up until adulthood (Figure 3A). The dendriticgrowth pattern in PFC and TE also differed between the twospecies; in the macaque, the dendritic field gradually increasedup until adulthood (Elston et al., 2009), whereas in the mar-moset, an increase in the dendritic field occurred at or before2 months and then remained unchanged (Figure 3A). Regardingthe complexity of the dendritic branching that was assessed bySholl analyses, TE and PFC neurons were more branched than V1neurons in the marmoset (Figure 4) and in the macaque (Elstonet al., 1996, 2009; Elston and Rosa, 1998; Elston, 2003), althoughno clear developmental trend was observed in the three areas ofboth species.
In contrast, the general developmental profile of spine densitywas strikingly similar between the marmoset and the macaque(Figure 5; for macaque data, see Figure 3 in Elston et al., 2009).In both species, V1, TE, and PFC showed similar density val-ues at birth (approximately 5 spines/10-µm dendritic segmentin the marmoset and 10 spines/10-µm dendritic segment inthe macaque), and the spine densities concurrently increasedand reached the maximum 3 months after birth. It was notablethat the maximum spine densities exhibited similar values (30–35 spines/10-µm dendritic segment) between the two speciesand across diverse cortical areas, including V1 (present study;Elston et al., 2009), prestriate areas V2 and V4 (Elston et al.,2010a), inferior temporal subareas TEO (Elston et al., 2010a),TEpd and TEav (Elston et al., 2011), the primary auditory cor-tex (Elston et al., 2010b), and area 12 in the PFC (present study;Elston et al., 2009). The density then decreased toward adultvalues with different degrees among V1, TE, and PFC. In bothspecies, spine density in V1 decreased most drastically. While thespine density in V1 was higher in adults than in newborns inthe marmoset, it was lower in adults than in newborns in themacaque.
The developmental time courses of the total spine numberson basal dendrites of layer-III pyramidal cells were also similarbetween V1, TE, and PFC and between the marmoset and themacaque. The total spine number peaked around 3M (Figure 6).The decline in the total number of spines after the peak wasmore prominent for the period of 3M–6M than for the period of6M–4.5Y. The total spine number at any given age was the largestin PFC, which was followed by TE and then by V1 both in themarmoset and the macaque (Figure 6; for macaque, Elston et al.,2009).
For a given age/area group, the total spine number was smallerin the marmoset than in the macaque. In V1, the total number
Frontiers in Neural Circuits www.frontiersin.org March 2013 | Volume 7 | Article 31 | 7
Oga et al. Spine development in marmoset cortex
of spines was approximately 200 in the marmoset vs. 1900 in themacaque at birth, 2400 in the marmoset vs. 3900 in the macaqueat 3–3.5M, and 800 in the marmoset and 900 in the macaqueat adulthood. In TE, the counts were 400 in the marmoset and3000 in the macaque at birth; 6200 in the marmoset and 10,400in the macaque at 3–3.5M; and 3200 in the marmoset and 6200in the macaque at adulthood. In PFC, the counts were 400 in themarmoset and 5000 in the macaque at birth; 5900 in the mar-moset and 15,900 in the macaque at 3–3.5M; and 3600 in themarmoset and 8500 in the macaque at adulthood. A notable dif-ference between the two species was that the total spine numberin V1 was larger at birth than at adulthood in the macaque (Elstonet al., 2009, 2010a), whereas, in the marmoset, similar to that inTE and PFC, the total spine number was larger at adulthood thanat birth (Figure 6).
The ratio of the total spine number in the macaque divided bythat of the marmoset tended to decrease gradually from birth toadulthood in the three areas (V1: birth, 1015%, 3M, 162%, adult,112%; TE: birth, 728%, 3M, 168%, adult, 197%; PFC: 2D/0D,1408%, 3M, 270%, adult, 238%). This calculation was based onFigure 6 in the present study and data from Elston et al. (2009,2010a). The total number of spines on basal dendrites at birth wasmuch larger in the macaque than in the marmoset. The differenceat birth resulted from the 5-fold difference in the dendritic fieldsand the 2-fold difference in the spine densities between the twospecies.
The total number of spines on the basal dendrites in the adultmarmoset was consistent between this and previous studies [V1:this study, 950; Elston et al., 1996, V1, 900; TE: this study, TEr,3100; Elston et al., 1996, 3000 in TEc, 4200 in TEa (Thus, TErin our study was similar to TEc in Elston et al., 1996); PFC: thisstudy, 3500; Elston et al., 2001, 3800]. Furthermore, the mea-sured values were not different among the three 2M animals inthe present study. These results warranted the validity of oursampling and analytical methods. Although our data were basedmostly on one animal per one age/area, we believe that the resultsare reliable.
COMPARISON WITH HUMANA Golgi study showed that layer-III pyramidal cells in area 9 ofthe human PFC exhibited a peak spine density on the basal den-drites at 3 years of age (Petanjek et al., 2011). The total andmean distances of the basal dendrites of PFC layer-III pyramidalcells increased until 2 years of age and remained unchanged untiladulthood (Petanjek et al., 2008). These results indicated that theage of the peak total spine number was approximately 2–3 years ofage. The spines of the basal dendrites of pyramidal cells in humanPFC undergo pruning over an extremely long period that spans3 years of age to the third decade of life (Petanjek et al., 2011).
For humans, electron microscopy (EM) has been frequentlyused to examine synaptogenesis and pruning (Rakic et al., 1986;Huttenlocher, 1990; Zecevic and Rakic, 1991; Bourgeois andRakic, 1993; Bourgeois et al., 1994; Huttenlocher and Dabholkar,1997). Most excitatory inputs terminate on spines, and only a fewexcitatory synapses terminate on dendritic trunks (Missler et al.,1993). Thus, the number of spines is, in general, closely corre-lated to the number of excitatory synapses. Most EM studies have
described synaptic density within a certain volume of neuropilas a measure. This measure is affected by the volume of othercomponents in the neural tissue (axons, dendrites, and glial pro-cesses) and the total volume (including cell bodies and bloodvessels) and the whole cortical area size (e.g., Rakic et al., 1986).In order to compare our data with data derived from EM stud-ies, we need to know the quasi-total synapse number/one neuronand the whole volume of a cortical target area (at least the thick-ness of the cortex), the total number of neurons, and if possible,spine density on dendrites (Huttenlocher, 1990; Bourgeois andRakic, 1993). Such combined data are available only in humanV1 (Huttenlocher, 1990; Bourgeois and Rakic, 1993). With theseparameters, Huttenlocher calculated the number of synapses perneuron separately for the different layers in V1. The number ofsynapses per layer III pyramidal cell rapidly increases from 4000at birth to 18,000 at 8M (450% increase) and then decreases to12,000 (62% decrease from 8M) at 18M. After 18M, the synapsenumber per layer III neuron is almost unchanged until 30 yearsof age (the eldest age examined in Huttenlocher, 1990). Thatis, layer-III pyramidal cells in human V1, in contrast to humanPFC (Petanjek et al., 2011), do not exhibit gradual pruning frommid-childhood to adulthood. However, V1 in macaque monkeysshow the opposite tendency: the total spine number is smaller inadults than in neonates (Elston et al., 2009). A previous study(Huttenlocher, 1990) reported the spine density on the basal den-drites of layer III pyramidal cells. The age of the peak density ofspines on a dendrite is again 8M, and before and after 8M, thereis a rapid increase and a decrease of density on dendrites, respec-tively. These features of the time courses of spine and/or synapsedevelopment is similar between the marmoset and human V1,except for the magnitude of synapse or spine number and the timepoints of the peak number of synapses or spines per neuron (inmarmosets, at the peak time of 3M, the total spine number onbasal dendrites of layer-III pyramidal cells was 2200 spines perneuron; in humans, at the peak time of 8M, there is 20,000 totalsynapses). This Golgi study (Huttenlocher, 1990) showed that thepeak age of spine density on basal dendrites in V1 in human islater and the spine density is greater than that in the marmoset (inhumans, at the peak time of 8M, the density is 12 synapses/µm;in marmosets, at the peak time of 3M, there was 0.35 spines/µm).
CONCLUSIONAreas V1, TE, and PFC in the marmoset all exhibited an over-shoot type of spine development with a peak at 3M. The dendriticfield area and the total number of spines differed across ages andacross areas. These results provide a starting point for studies ofthe molecular mechanisms of spinogenesis and pruning in theprimate cerebral cortex. Comparisons among the transcriptomesof different time epochs of spine development in selected corticalareas are a strategic beginning for this endeavor. After selectingcandidate genes, we can manipulate these genes with viral vec-tor infection techniques or use the transgenic marmoset to assesstheir function in spine development.
ACKNOWLEDGMENTSWe thank Yoko Oga and Tsuguhisa Okamoto for theirtechnical help.
Frontiers in Neural Circuits www.frontiersin.org March 2013 | Volume 7 | Article 31 | 8

Oga et al. Spine development in marmoset cortex
FUNDINGThis work was supported by an Intramural Research Grant(grant number 23–7) for Neurological and Psychiatric Disordersfrom the National Center of Neurology and Psychiatry,Grant-in-Aids for Scientific Research on Innovative Areas“Face perception and recognition” and “Shitsukan” by theMinistry of Education, Science, Sports and Culture, Japan,and a Funding Program for World-Leading Innovative
R&D on Science and Technology (FIRST Program) (toNoritaka Ichinohe) by grants (23240047, 23135522) fromthe Ministry of Education, Science, Sports and Culture ofJapan (to Ichiro Fujita). Tomofumi Oga was supportedby a Grant-in-Aid for Scientific Research on InnovativeAreas (Comprehensive Brain Science Network) from theMinistry of Education, Science, Sports and Culture ofJapan.
REFERENCESAgustín-Pavón, C., Braesicke, K., Shiba,
Y., Santangelo, A. M., Mikheenko,Y., Cockroft, G., et al. (2012).Lesions of ventrolateral prefrontalor anterior orbitofrontal cortex inprimates heighten negative emo-tion. Biol. Psychiatry 72, 266–272.
Bourgeois, J. P., Goldman-Rakic, P. S.,and Rakic, P. (1994). Synaptogenesisin the prefrontal cortex of rhesusmonkeys. Cereb. Cortex 4, 78–96.
Bourgeois, J. P., and Rakic, P. (1993).Changes of synaptic density inthe primary visual cortex of themacaque monkey from fetal to adultstage. J. Neurosci. 13, 2801–2820.
Broadbelt, K., Byne, W., and Jones, L.B. (2002). Evidence for a decrease inbasilar dendrites of pyramidal cellsin schizophrenic medial prefrontalcortex. Schizophr. Res. 58, 75–81.
Brodmann, K. (1909). VergleichendeLokalisationslehre der Großhir-nrinde. Leipzig: Johann AmbrosiusBarth.
Burman, K. J., and Rosa, M. G. (2009).Architectural subdivisions of medialand orbital frontal cortices in themarmoset monkey (Callithrix jac-chus). J. Comp. Neurol. 514, 11–29.
Chandolia, R. K., Luetjens, C. M.,Wistuba, J., Yeung, C. H., Nieschlag,E., and Simoni, M. (2006). Changesin endocrine profile and repro-ductive organs during pubertyin the male marmoset monkey(Callithrix jacchus). Reproduction132, 355–363.
Eayrs, J. T., and Goodhead, B. (1959).Postnatal development of the cere-bral cortex in the rat. J. Anat. 93,385–402.
Eliades, S. J., and Wang, X. (2008).Neural substrates of vocalizationfeedback monitoring in primateauditory cortex. Nature 453,1102–1106.
Elston, G. N. (2001). Interlaminar dif-ferences in the pyramidal cell phe-notype in cortical areas 7m and STP(the superior temporal polysensoryarea) of the macaque monkey. Exp.Brain Res. 138, 141–152.
Elston, G. N. (2003). Cortex, cog-nition and the cell: new insightsinto the pyramidal neuron and
prefrontal function. Cereb. Cortex13, 1124–1138.
Elston, G. N., Benavides-Piccione, R.,and DeFelipe, J. (2001). The pyra-midal cell in cognition: a compar-ative study in human and monkey.J. Neurosci. 21, RC163.
Elston, G. N., Oga, T., and Fujita, I.(2009). Spinogenesis and pruningscales across functional hierarchies.J. Neurosci. 29, 3271–3275.
Elston, G. N., Oga, T., Okamoto, T., andFujita, I. (2010a). Spinogenesis andpruning from early visual onset toadulthood: an intracellular injectionstudy of layer III pyramidal cells inthe ventral visual cortical pathway ofthe macaque monkey. Cereb. Cortex20, 1398–1408.
Elston, G. N., Okamoto, T., Oga, T.,Dornan, D., and Fujita, I. (2010b).Spinogenesis and pruning in theprimary auditory cortex of themacaque monkey (Macaca fasci-cularis): an intracellular injectionstudy of layer III pyramidal cells.Brain Res. 1316, 35–42.
Elston, G. N., Oga, T., Okamoto, T.,and Fujita, I. (2011). Spinogenesisand pruning in the anterior ven-tral inferotemporal cortex of themacaque monkey: an intracellularinjection study of layer III pyrami-dal cells. Front. Neuroanat. 5:42. doi:10.3389/fnana.2011.00042
Elston, G. N., Pow, D. V., and Calford,M. B. (1997). Neuronal composi-tion and morphology in layer IV oftwo vibrissal barrel subfields of ratcortex. Cereb. Cortex 7, 422–431.
Elston, G. N., and Rosa, M. G. (1998).Morphological variation of layer IIIpyramidal neurones in the occipi-totemporal pathway of the macaquemonkey visual cortex. Cereb. Cortex8, 278–294.
Elston, G. N., and Rosa, M. G. P. (1997).The occipitoparietal pathway of themacaque monkey: comparison ofpyramidal cell morphology in layerIII of functionally related corti-cal visual areas. Cereb. Cortex 7,432–452.
Elston, G. N., Rosa, M. G., and Calford,M. B. (1996). Comparison of den-dritic fields of layer III pyramidalneurons in striate and extrastriate
visual areas of the marmoset: aLucifer yellow intracellular injec-tion. Cereb. Cortex 6, 807–813.
Fritsches, K. A., and Rosa, M. G. (1996).Visuotopic organization of striatecortex in the marmoset monkey(Callithrix jacchus). J. Comp. Neurol.372, 264–282.
Garey, L. (2010). When cortical devel-opment goes wrong: schizophreniaas a neurodevelopmental disease ofmicrocircuits. J. Anat. 217, 24–33.
Glantz, L. A., and Lewis, D. A. (2000).Decreased dendritic spine densityon prefrontal. cortical pyramidalneurons in schizophrenia. Arch.Gen. Psychiatry 57, 65–73.
Hutsler, J. J., and Zhang, H. (2010).Increased dendritic spine densitieson cortical projection neurons inautism spectrum disorders. BrainRes. 1309, 83–94.
Huttenlocher, P. R. (1990). Morpho-metric study of human cerebral cor-tex development. Neuropsychologia28, 517–527.
Huttenlocher, P. R., and Dabholkar,A. S. (1997). Regional differencesin synaptogenesis in human cere-bral cortex. J. Comp. Neurol. 387,167–178.
Kaas, J. H. (1997). “Theories of visualcortex organization in primates,”in Cerebral Cortex. ExtrastriateCortex in Primates, Vol. 12, eds K.Rockland, J. H. Kaas and A. Peters(New York, NY: Plenum), 91–125.
Kalus, P., Müller, T. J., Zuschratter, W.,and Senitz, D. (2000). The dendriticarchitecture of prefrontal pyramidalneurons in schizophrenic patients.Neuroreport 11, 3621–3625.
Kaufmann, W. E., and Moser, H. W.(2000). Dendritic anomalies in dis-orders associated with mental retar-dation. Cereb. Cortex 10, 981–991.
Levenga, J., and Willemsen, R. (2012).Perturbation of dendritic protru-sions in intellectual disability. Prog.Brain Res. 197, 153–168.
McKinnell, C., Saunders, P. T., Fraser,H. M., Kelnar, C. J., Kivlin, C.,Morris, K. D., et al. (2001).Comparison of androgen receptorand estrogen receptor beta immu-noexpression in the testes of thecommon marmoset (Callithrix
jacchus) from birth to adulthood:low androgen receptor immunoex-pression in Sertoli cells during theneonatal increase in testosteroneconcentrations. Reproduction 122,419–429.
Micheva, K. D., and Beaulieu, C.(1996). Quantitative aspects ofsynaptogenesis in the rat barrelfield cortex with special referenceto GABA circuitry. J. Comp. Neurol.373, 340–354.
Missler, M., Wolff, A., Merker, H. J., andWolff, J. R. (1993). Pre- and post-natal development of the primaryvisual cortex of the common mar-moset. II., Formation, remodelling,and elimination of synapses as over-lapping processes. J. Comp. Neurol.333, 53–67.
Paxinos, G., Watson, C., Petrides, M.,Rosa, M., and Tokuno, H. (2011).The Marmoset Brain in StereotaxicCoordinates. London: AcademicPress.
Penzes, P., Cahill, M. E., Jones, K. A.,VanLeeuwen, J. E., and Woolfrey, K.M. (2011). Dendritic spine pathol-ogy in neuropsychiatric disorders.Nat. Neurosci. 14, 285–293.
Petanjek, Z., Judas, M., Kostovic, I.,and Uylings, H. B. (2008). Lifespanalterations of basal dendritictrees of pyramidal neurons in thehuman prefrontal cortex: a layer-specific pattern. Cereb. Cortex 18,915–929.
Petanjek, Z., Judaš, M., Šimic, G., Rasin,M. R., Uylings, H. B., Rakic, P.,et al. (2011). Extraordinary neotenyof synaptic spines in the human pre-frontal cortex. Proc. Natl. Acad. Sci.U.S.A. 108, 13281–13286.
Rakic, P., Bourgeois, J. P., Eckenhoff, M.F., Zecevic, N., and Goldman-Rakic,P. S. (1986). Concurrent over-production of synapses in diverseregions of the primate cerebralcortex. Science 232, 232–235.
Rosa, M. G., Palmer, S. M., Gamberini,M., Burman, K. J., Yu, H. H., Reser,D. H., et al. (2009). Connectionsof the dorsomedial visual area:pathways for early integrationof dorsal and ventral streams inextrastriate cortex. J. Neurosci. 29,4548–4563.
Frontiers in Neural Circuits www.frontiersin.org March 2013 | Volume 7 | Article 31 | 9

Oga et al. Spine development in marmoset cortex
Sasaki, E., Suemizu, H., Shimada, A.,Hanazawa, K., Oiwa, R., Kamioka,M., et al. (2009). Generation oftransgenic non-human primateswith germline transmission. Nature459, 523–527.
Sholl, D. A. (1955). The surface areaof cortical neurons. J. Anat. 89,571–572.
Snowdon, C. T. (1997). Affiliative pro-cesses and vocal development. Ann.N.Y. Acad. Sci. 807, 340–351.
Valverde, F. (1967). Apical dendriticspines of the visual cortex and
light deprivation in the mouse. Exp.Brain Res. 3, 337–352.
van Spronsen, M., and Hoogenraad,C. C. (2010). Synapse pathologyin psychiatric and neurologic dis-ease. Curr. Neurol. Neurosci. Rep. 10,207–214.
Zecevic, N., and Rakic, P. (1991).Synaptogenesis in monkeysomatosensory cortex. Cereb.Cortex 1, 510–515.
Conflict of Interest Statement: Theauthors declare that the research
was conducted in the absence of anycommercial or financial relationshipsthat could be construed as a potentialconflict of interest.
Received: 11 December 2012; paperpending published: 31 December 2012;accepted: 09 February 2013; publishedonline: 08 March 2013.Citation: Oga T, Aoi H, Sasaki T,Fujita I and Ichinohe N (2013)Postnatal development of layer IIIpyramidal cells in the primary
visual, inferior temporal, and pre-frontal cortices of the marmoset. Front.Neural Circuits 7:31. doi: 10.3389/fncir.2013.00031Copyright © 2013 Oga, Aoi, Sasaki,Fujita and Ichinohe. This is an open-access article distributed under the termsof the Creative Commons AttributionLicense, which permits use, distributionand reproduction in other forums, pro-vided the original authors and sourceare credited and subject to any copy-right notices concerning any third-partygraphics etc.
Frontiers in Neural Circuits www.frontiersin.org March 2013 | Volume 7 | Article 31 | 10