postgresql and benchmarks
TRANSCRIPT
PostgreSQL and Benchmarks
Jignesh Shah – Staff Engineer, ISV Engineering, Sun Microsystems Inc
PostgreSQL East Conference March 2008
About Me
• Working with Sun Microsystems for about 7 1/2 years> Primarily responsibility at Sun is to make ISV and Open Source
Community Software applications work better on Solaris
• Prior to Sun worked as ERP Consultant
• Worked with various databases (DB2 UDB, PostgreSQL, MySQL, Progress OpenEdge, Oracle)
• Worked with various ERP (QAD, Lawson) and CRM (Dispatch-1), etc
• Previous responsibilities also included : Low Cost BIDW
Agenda
• Industry Standard Benchmarks> SPECjAppServer2004™> EAStress2004> TPC-E> TPC-H

SPECjAppServer2004

SPECjAppServer2004
• SPECjAppServer2004 is the current version
• Review by SPEC required before publishing the result (published on spec.org)
• Metric is JOPS = jAppServer Operations Per Second
• Fine workload to use to measure impacts of database from one version to another (rather than compare systems, operating systems and/or other databases)

SPECjAppServer2004 Characteristics
• J2EE Application with Database Backend• Response times do depend on Database
Performance among other things• Not a micro benchmark for Database but not
exhaustive also• Typical Single row queries/updates/inserts• No stored procedures • Mostly highlighting performance combining J2EE
and database performance together

PostgreSQL's SPECjAppServer2004 Setup

PostgreSQL's SPECjAppServer2004 Performance• Two published SPECjAppServer2004 result using
Glassfish and PostgreSQL 8.2 on Solaris> 778.14 JOPS with Glassfish v1> 813.73 JOPS with Glassfish v2
• PostgreSQL is in top category in terms of overall low price and price/performance
Mandatory Disclosure:SPECjAppServer2004 JOPS@standardSun Fire X4200 M2 (4 chips, 8 cores) - 813.73 SPECjAppServer2004 JOPS@Standard Sun Fire X4200 M2 (6 chips, 12cores) - 778.14 SPECjAppServer2004 JOPS@Standard SPEC, SPECjAppServer reg tm of Standard Performance Evaluation Corporation. All results from www.spec.org as of Jan 8,2008
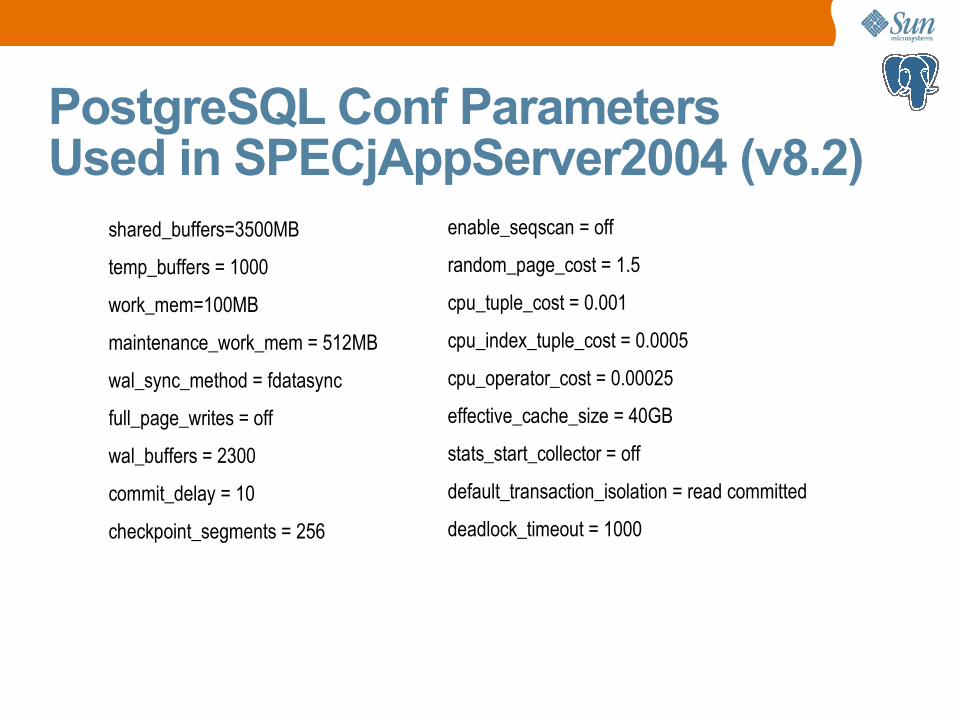
PostgreSQL Conf Parameters Used in SPECjAppServer2004 (v8.2)
shared_buffers=3500MB
temp_buffers = 1000
work_mem=100MB
maintenance_work_mem = 512MB
wal_sync_method = fdatasync
full_page_writes = off
wal_buffers = 2300
commit_delay = 10
checkpoint_segments = 256
enable_seqscan = off
random_page_cost = 1.5
cpu_tuple_cost = 0.001
cpu_index_tuple_cost = 0.0005
cpu_operator_cost = 0.00025
effective_cache_size = 40GB
stats_start_collector = off
default_transaction_isolation = read committed
deadlock_timeout = 1000
EAStress2004

EAStress2004
• EAStress2004 is RESEARCH mode of SPECjAppServer2004
• No review from SPEC required
• Metric of EAStress2004 (HASOPM) is not equivalent and hence should not be compared to metric of SpecJAppServer2004 (JOPS)
• Fine workload to use to measure impacts of database from one version to another (rather than compare systems, operating systems and/or other databases)

EAStress2004 Characteristics
• In lot of ways subset to SPECjAppServer2004 but not equivalent as SPECjAppserver2004 has more added workload tasks
• Has potential to be put into regression test suite for PostgreSQL
• Stresses IO, Scalability, Response times

PostgreSQL's EAStress2004 Performance
EAStress2004 HASOPM – Hundreds of Application Server Operations Per Minute
SPEC, SPECjAppServer reg tm of Standard Performance Evaluation Corporation.
PostgreSQL 8.2 (32-bit)
PostgreSQL 8.3 (64-bit)
0 100 200 300 400 500 600 700
EAStress2004 with PostgreSQL
EAStress Metric (HASOPM)
46% improvement just by changing the database underneath it
Highlights database performance impact to EAStress
Differences between 8.3/8.2:
• 64-bit vs 32-bit
• sync_commit=false
• Higher shared_buffers
**Missing data point with 8.3 (32-bit) which could have been very helpful

PostgreSQL Conf Parameters Used in EAStress2004 (v8.3)
shared_buffers=8000MB
temp_buffers = 8MB
work_mem=1MB
maintenance_work_mem = 512MB
wal_sync_method = fdatasync
full_page_writes = off
wal_buffers = 2500
commit_delay = 10
checkpoint_segments = 256
synchronous_commit=false
enable_seqscan = off
random_page_cost = 1.5
cpu_tuple_cost = 0.001
cpu_index_tuple_cost = 0.0005
cpu_operator_cost = 0.00025
effective_cache_size = 4GB
update_process_title=off
default_transaction_isolation = read committed
deadlock_timeout = 1000

TPC-E

TPC-E Highlights● Complex schema● Referential Integrity● Less partitionable● Increase # of trans● Transaction Frames● Non-primary key access
to data
● Data access requirements (RAID)
● Complex transaction queries
● Extensive foreign key relationships
● TPC provided core components

TPC-E Sample Setup
System Under Test
Driver Tier A Tier B
Data
Data
Data
Database Server
App. Server
App. Server
App. Server
Mandatory Network between
Driver and Tier A
Network
System Under Test
Driver Tier A Tier B
DataData
DataData
DataData
Database ServerDatabase Server
App. ServerApp. Server
App. ServerApp. Server
App. ServerApp. Server
Mandatory Network between
Driver and Tier A
Network
Image From: http://www.tpc.org/tpce/spec/TPCEpresentation.ppt

TPC-E Characteristics
• Brokerage House workload• Scale factor in terms of active customers to be used
dependent on target performance (roughly Every 1K customer = 7.1GB raw data to be loaded)
• Lots of Constraints and Foreign keys• Business logic (part of system) can be implemented
via Stored Procedures or other mechanisms• Can be used to stress multiple features of database:
Random IO reads/writes, Index performance, stored procedure performance, response times, etc

How PostgreSQL is behaving right now with TPC-E?
• Setup process very slow with PostgreSQL• Table with few rows hot for update (Broker)• High Random reads which blocks (trade and
trade_history)• Adding index hurts trade update performance and
less index hurts trade lookup performance• More contention if client streams are increased
even slightly resulting in drop in performance

How PostgreSQL is behaving right now with TPC-E?
• With some work, it could be possible to publish a competitive TPC-E with PostgreSQL

TPC-H
TPC-H
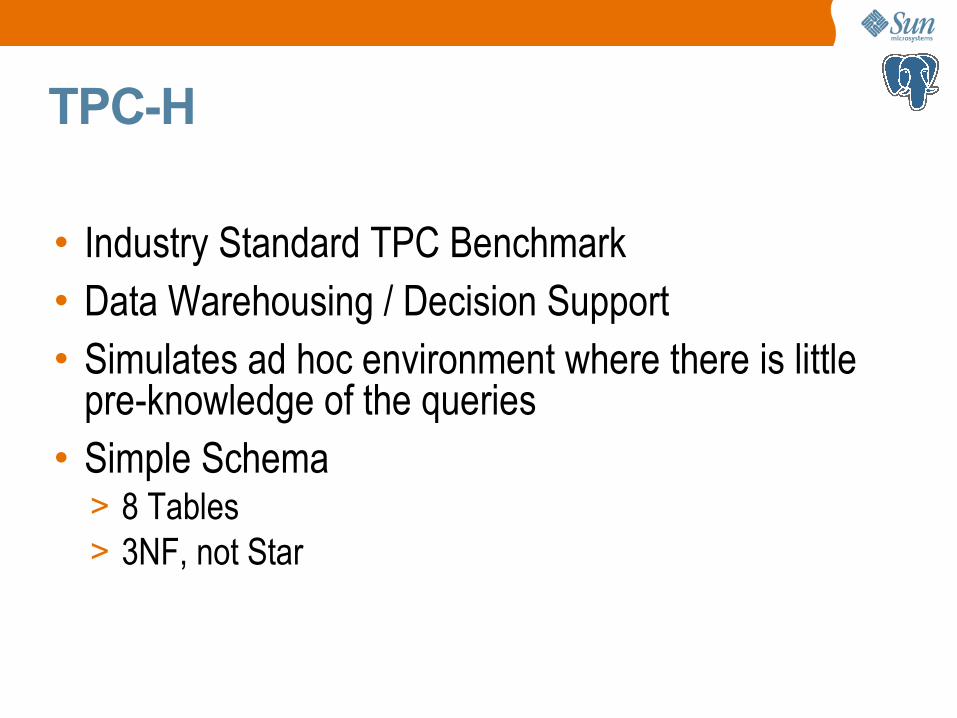
• Industry Standard TPC Benchmark• Data Warehousing / Decision Support• Simulates ad hoc environment where there is little
pre-knowledge of the queries• Simple Schema
> 8 Tables> 3NF, not Star

TPC-H
• Different scale factors: 100GB, 300GB, 1000GB, 3000GB
• 22 queries• 2 refresh functions (insert, delete)• Single-stream component . . . power• Multi-stream component . . . throughput• Ad-hoc enforced by implemention rules
> Indexes only on primary key, foreign key and date colums.
How PostgreSQL Behaves
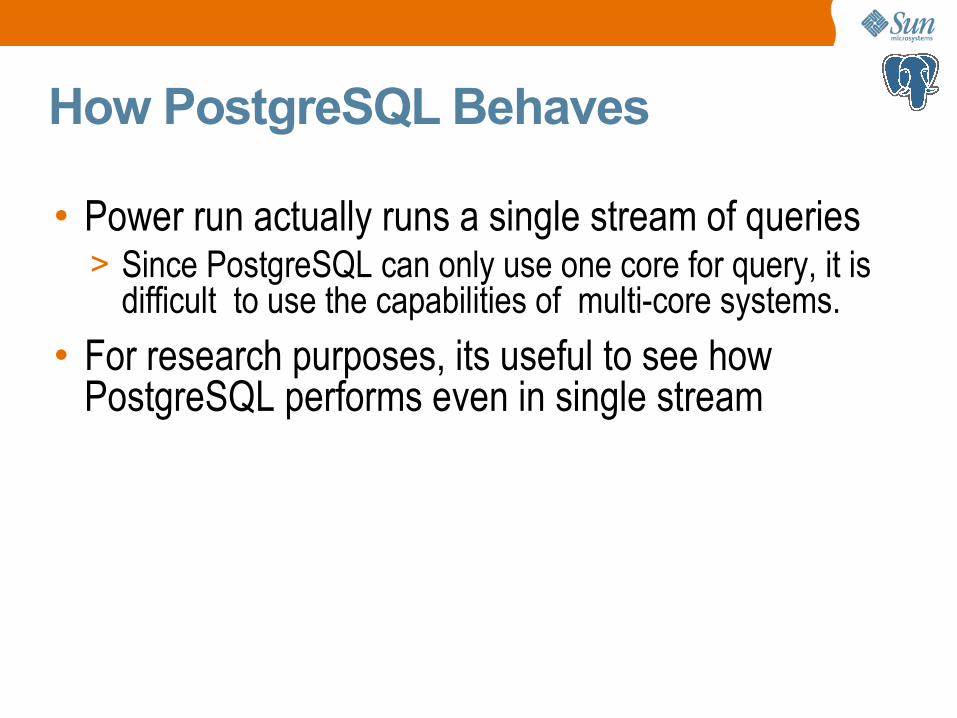
• Power run actually runs a single stream of queries> Since PostgreSQL can only use one core for query, it is
difficult to use the capabilities of multi-core systems.
• For research purposes, its useful to see how PostgreSQL performs even in single stream

How PostgreSQL Behaves• Current runs indicate that without right index(es) it is
hard for PostgreSQL Optimizer to suggest good plans.> However index on such huge tables are slow to create, plus you
can never guess the next index required (in realworld BIDW)> COPY took 02:12:06 while INDEX creations took 11:33:47> Commercial databases have figured good ways to just live with few
index for this type of workload
• Range Partitioning, Table Partitioning, Clustering are more important> Hard to provide single logical view of partitioned table for
inserts/updates. Plus very hard to setup table partitioning which can be compliant with run rules
How PostgreSQL Behaves
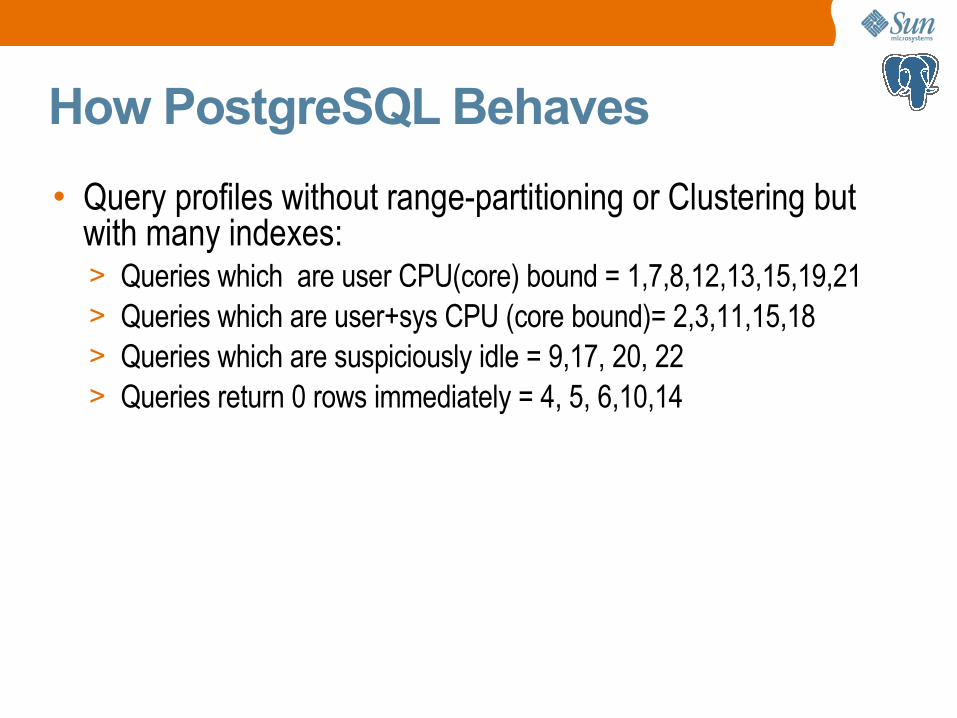
• Query profiles without range-partitioning or Clustering but with many indexes:> Queries which are user CPU(core) bound = 1,7,8,12,13,15,19,21> Queries which are user+sys CPU (core bound)= 2,3,11,15,18> Queries which are suspiciously idle = 9,17, 20, 22> Queries return 0 rows immediately = 4, 5, 6,10,14
Summary/Next Step
• Good overall status with SPECjAppServer2004 and EAStress
• EAStress good load for regression testing
• TPC-E with PostgreSQL has room for improvements. > Highlights hot contention with BROKER table> Need to work with community to see if it is a schema
problem or some inherent problem in PostgreSQL
• TPC-H with PostgreSQL will require more detailed investigation > Figure out problems with broken queries> Optimizer plan key to performance> Need to work with community

Acknowledgements
• Performance and Benchmark Team, Sun> Vince Carbone (TPC-H)> Glenn Fawcett (TPC-E)> John Fowler Jr
• ISV- Engineering, Sun> Tom Daly (SpecJAppServer / EAStress )
More Information
• PostgreSQL Question: <[email protected]>
• Blogs on PostgreSQL> Josh Berkus: http://blogs.ittoolbox.com/database/soup > Jignesh Shah: http://blogs.sun.com/jkshah/> Tom Daly: http://blogs.sun.com/tomdaly/> Robert Lor: http://blogs.sun.com/robertlor/
• PostgreSQL on Solaris Wiki: http://wikis.sun.com/display/DBonSolaris/PostgreSQL
• OpenSolaris databases community: [email protected]
Q & A
Backup Slides/ Additional Information

TPC-E Scaling Design● DBMS size and metric scales with the number of emulated
customers in the database● Transactions designed for consistent scaling; independent of
architecture● Transactions designed to access “any row, any where”.
Increases cross-node & cross schema communications.● “Any customer emulation” - Any driver can emulate any
customer at any time, and possibly the same customer simultaneously across drivers.
● All results are comparable

SettlementCommissionRate
AccountPermission
Holding
CustomerTaxrate
Customer
CustomerAccount
HoldingHistory
CashTransaction
Broker
WatchItem
WatchList
Charge
TradeHistory
Trade
TradeRequest
CompanyIndustry
CompanyCompetitor
TradeType
Company
DailyMarket
LastTrade
Industry
Exchange
Financial
NewsItem
StatusType
Security
NewsXref
Sector
ZipcodeTaxrateAddress
Customer Broker Market

TPC-E Transaction Overview● Broker Volume – Total potential volume for a subset of brokers of
all Trades in a given sector for a specific customer tier – Single Frame
● Customer Position – Reports the current market value for each account of a customer – Single Frame
● Security Detail – Returns all information pertaining to a specific security; financial, news, stock performance ... - Single Frame
● Trade Status – Status of the most recent trade for a customer – Single Frame
● Market Watch – Calculates the percentage change in value of the market capitalization for a set of securities – Multiple Independent Single Frames

TPC-E Transaction Overview – Con't● Trade Lookup – Return all information relating to a specific trade
determined by either: 1) trade-id, or 2) customer-id and a timestamp – Multiple Independent Frames
● Trade-Update – Same as Trade-Lookup, but modifies the data returned, i.e. “Settle cash transactions” - Multiple Independent Frames
● Trade Order – Request to buy/sell a quantity of a security for a customer account either via a market or limit order – Single Multi Frame Transaction
● Trade Result – The completion of a confirmed Trade Order from the “Market” - Single Multi Frame Transaction
● Market Feed – Update the last traded values for a security from the “ticker” (Market Exchange Emulator) – Single Multi Frame Transaction

TPC-E Reported Metrics● Primary Metrics
● tpsE : qualified throughput metric; total number of Trade-Result transactions completed in the measurement interval divided by the measurement interval in seconds
● $/tpsE : Total 3 year cost divided by the throughput metric
● Additional Reported Metric● # of processors, cores and threads● Durability Redundancy Level● Database Recovery Time

TPC-H Reporting Requirements
● Scale factor, e.g., @1000GB● Composite performance metric QphH● Price/performance . . . $/ QphH● System availability date● Results at different scale factors are not
comparable . . . per TPC
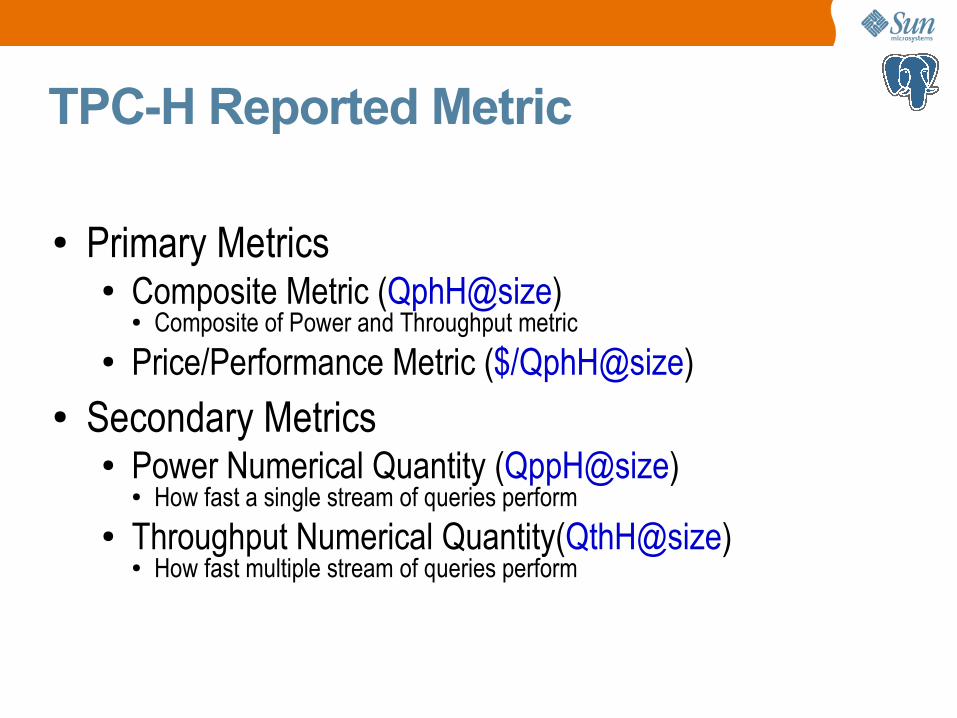
TPC-H Reported Metric
● Primary Metrics● Composite Metric (QphH@size)
● Composite of Power and Throughput metric ● Price/Performance Metric ($/QphH@size)
● Secondary Metrics● Power Numerical Quantity (QppH@size)
● How fast a single stream of queries perform● Throughput Numerical Quantity(QthH@size)
● How fast multiple stream of queries perform