poster abstracts: clinical mri—non-ischemic acquired heart ... · poster abstracts: clinical...
TRANSCRIPT
Poster Abstracts: Clinical MRI—Non-ischemic Acquired Heart Disease
261. The Incidence of Cerebral Embolism After
Retrograde Catheterization of the Aortic Valve in
Degenerative Aortic Stenosis—A Prospective and
Randomized Study in 112 Patients Using Diffusion-
Weighted Imaging
Torsten Sommer,1 Matthias Hackenbroch, MD,1
Alexandra Schmiedel, MD,1 Sebastian Flacke, MD,1
Heyder Omran, MD,2 H. Schild.1 1Department of
Radiology, University of Bonn, Bonn, Germany,2Department of Cardiology, University of Bonn, Bonn,
Germany.
Introduction: Retrograde catheterization of a stenotic
calcified valve for determination of the transvalvular
pressure gradient is frequently performed for measure-
mentof theseverityofaorticstenosis.Retrospectivecohort
studies examining clinical endpoints have shown that this
procedure is associated with a 1–2% risk of clinically
apparent neurologic complications. However, the inci-
dence of clinically silent embolism, i.e. the true frequency
of structural ischemic brain damage, is unknown.
Purpose: We performed a prospective and random-
ized study including diffusion-weighted MR imaging
(DWI) to assess the incidence of clinically apparent and
silent cerebral embolism in patients with degenerative
aortic valve stenosis (AS) undergoing cardiac catheter-
ization with transvalvular catheter passage.
Methods: From April 1997 to December 2001, 152
consecutive patients with known or suspected AS were
randomized in a 2:1 relationship to receive cardiac
catheterization either with ðn ¼ 101Þ or without passage
ðn ¼ 51Þ through the aortic valve. Patients underwent
MRI of the brain including DWI (b ¼ 0; 500 and
1000 s/mm2, TR ¼ 4000 ms; TE ¼ 120 ms; slice
thickness 5 mm, matrix 226 £ 256) and neurological
assessment both within 48 hours before and after the
procedure to assess for embolic events. 32 patients
without AS who underwent coronary angiography and
ventriculography served as controls.
Results: 22% (22 out of 101) of patients with AS
subjected to retrograde catheterization of the aortic valve
manifested new focal diffusion abnormalities consistent
with acute cerebral embolic events after the procedure;
only three of these patients (3%) had clinically apparent
neurological deficits. In contrast, none of patients
without passage through the stenotic aortic valve nor
any of the controls had any evidence of new cerebral
embolism as assessed by MRI ðp , 0:01Þ:Conclusions: The frequency of clinically silent
ischemic events after retrograde catheterization through
a stenotic aortic valve is much higher than the frequency
of clinically apparent stroke, indicating that the risk of
structural ischemic brain damage in those patients has
been markedly underestimated in the past. Therefore, we
suggest that patients should be informed about the
procedure-related risk and consideration should be given
to limiting retrograde catheterization of the stenotic
aortic valve to those patients with suboptimal or unclear
echocardiographic findings.
262. Right Ventricular Wall Motion Abnormalities
Found in Healthy Individuals Using Cardiac
Magnetic Resonance Imaging and a New Segmental
Model: Impact for the Diagnosis of Arrhythmogenic
Right Ventricular Cardiomyopathy
Burkhard Sievers, Ulrich Franken, Marvin Addo, Asli
Bakan, Simon Kirchberg, Hans-Joachim Trappe.
Cardiology and Angiology, University of Bochum,
Herne, Germany.
Aims: To evaluate right ventricular wall motion
abnormalities in healthy individuals using a new
segmental model for the right ventricle.
119
DOI: 10.1081/JCMR-120018100 1097-6647 (Print); 1532-429X (Online)
Copyright q 2003 by Marcel Dekker, Inc. www.dekker.com
JOURNAL OF CARDIOVASCULAR MAGNETIC RESONANCEw
Vol. 5, No. 1, pp. 119–143, 2003
©2002 Marcel Dekker, Inc. All rights reserved. This material may not be used or reproduced in any form without the express written permission of Marcel Dekker, Inc.
MARCEL DEKKER, INC. • 270 MADISON AVENUE • NEW YORK, NY 10016

Methods and results: 29 healthy individuals (9
female, 20 male, mean age 48.9 ^ 15 years) underwent
magnetic resonance imaging (1.5 Tesla MRI Sonata,
Siemens, Erlangen, Germany) to evaluate cardiac function
and identify possible right ventricular wall motion
abnormalities. TrueFISP gradient-echo sequences with
steady-state free precession were used for image acqui-
sition. Right ventricular wall motion abnormalities were
analysed and classified according to a segmental model
for the right ventricle. In 27 (93.1%) of the 29 individuals
right ventricular wall motion abnormalities were found.
Dyskinesia was found in 22 (75.9%), hypokinesia in 11
(37.9%) and bulging in eight individuals (27.6%). The
number of diagnosed wall motion abnormalities in the
transverse plane (86.2%) was significantly higher compa-
red to those found in the short axis plane (13.8%) or in the
horizontal longitudinal plane (41.4%) ðp ¼ 0:000Þ:Conclusion: Right ventricular wall abnormalities
can be found in healthy individuals. Since these wall
abnormalities are a criterion for the diagnosis of
arrhythmogenic right ventricular cardiomyopathy, wall
motion abnormalities around the insertion of the
muscular ligaments of the right ventricle should be
excluded to prevent an incorrectly positive diagnosis.
263. Cardiac MRI Detects Mild Left Ventricular
Hypertrophy and Increased Systolic Function in
Obese Subjects
Lilia M. Sierra-Galan, MD,1 Andrew E. Arai, MD.2
1Resonancia Magnetica Cardiovascular, Hospital
Espanol de Mexico, Mexico, D.F., Mexico, 2Laboratory
of Cardiac Energetics, National Heart, Lung and
Blood Institute/National Institutes of Health, Bethesda,
MD, USA.
Introduction: Cardiac MRI is well accepted as a gold
standard technique for basic cardiac measurements such
as left ventricular volumes and mass. To adjust for
variation in body size, many investigators index these
measurements to body surface area.
Purpose: Since a sizeable fraction of the population
is obese, we studied whether cardiac dimensions and
volumes varied with obesity and how well normalization
by body surface area adjusted these measurements.
Methods: From a database combining MRI reports
from two institutions, 150 studies were qualitatively
identified as normal. Patients were divided into three
groups according to Quetelet’s body mass index: normal
(,25), overweight (25–30), and obese (.30). Cardiac
MRI was performed in multiple long and short axis views
using steady state free precession in 93% of subjects and
fast gradient echo cine MRI in the remaining 7%. A
physician manually analyzed all images with computer-
assisted planimetry. The same protocol was used at each
institution.
Results: Of the 150 subjects, 76 (51%) were
normal weight, 44 (29%) were overweight, and 30
(20%) were obese according to Quetelet’s body mass
index. There were more women ðn ¼ 94Þ than men
ðn ¼ 56Þ in the study with the following distribution
of normal/overweight/obese subjects for women
(52%/26%/22%) and for men (48%/36%/16%). The
average age was 41.4 ^ 15.9 (11–76) for normal,
Table 1. Comparison of volumetric measurements and indexed measurements.
Volumetric measurements
Normal
(n ¼ 76)
Overweight
(n ¼ 44)
Obese
(n ¼ 30) Comments
LVED volume (ml) 136 ^ 33 150 ^ 28* 159 ^ 28*** 1
LVES volume (ml) 49 ^ 15 52 ^ 15 49 ^ 15
LV stroke volume (ml) 87 ^ 22 98 ^ 22** 110 ^ 22*** 1
LVED mass (g) 100 ^ 34 114 ^ 28* 134 ^ 39*** 3
LVED volume index (ml/m2) 80 ^ 19 79 ^ 13 79 ^ 10
LVES volume index (ml/m2) 29 ^ 9 27 ^ 8 24 ^ 7** 2
LV stroke volume index (ml/m2) 51 ^ 13 52 ^ 10 55 ^ 9
LVED mass index (g/m2) 60 ^ 34 60 ^ 12 66 ^ 16* 3
LV ejection fraction (%) 64 ^ 6 66 ^ 7 69 ^ 8*** 1
Comments: (1) raw measurements that varied significantly between groups, (2) indexed measurements that varied
significantly between groups, (3) raw and indexed measurements that varied significantly between groups.
Abbreviations: L ¼ left, V ¼ ventricular, E ¼ end, D ¼ diastolic, S ¼ systolic.
Statistical comparisons with normal group: * ¼ p , 0:05; ** ¼ p , 0:01; *** ¼ p , 0:001:
Poster Abstracts: Clinical MRI—Non-ischemic Acquired Heart Disease120
©2002 Marcel Dekker, Inc. All rights reserved. This material may not be used or reproduced in any form without the express written permission of Marcel Dekker, Inc.
MARCEL DEKKER, INC. • 270 MADISON AVENUE • NEW YORK, NY 10016
46.1 ^ 13.5 (12–76) for overweight and 43.2 ^ 14.8
(15–72) for obese.
Raw measurements of LVED volume and
LV stroke volume varied significantly between
groups but were normalized well by body surface
area (comment 1, Table 1). However, raw measure-
ment of LVES volume did not vary significantly so
“normalization” by body surface area created signifi-
cant differences between normal and obese subjects
(comment 2, Table 1). Both raw and indexed LVED
mass varied significantly between groups (comment 3,
Table 1). LV ejection fraction, which is generally not
indexed, increased significantly in the obese subjects
(Table 1).
Conclusions: Cardiac volumes and mass vary
between normal, overweight, and obese subjects with
qualitatively normal MRI studies. Normalization of
volumes and dimensions (data not shown) with body
surface area appears appropriate for some parameters but
inappropriate for others. Fundamentally, however, global
systolic function as measured by ejection fraction or
fractional shortening appears increased in obese subjects
compared with normal subjects. This may represent a
need to recruit a higher inotropic state to maintain
adequate cardiac output for the obese subject. This may
also explain the mild left ventricular hypertrophy in
obese subjects as seen on both raw and indexed
measurements.
264. Left Ventricular Dimensions and SystolicFunction in Obesity
Dorthe Pedersen,1 Arne V. Astrup,2 Henrik B. W.
Larsson,3 Lars Sondergaard.4 1Danish Research Center
of Magnetic Resonance, Hvidovre University Hospital,
Copenhagen, Denmark, 2Department of Human
Nutrition, RVA University, Copenhagen, Denmark, 3MR
Center, St. Olav University Hospital, Trondheim,
Norway, 4Department of Cardiology, Copenhagen
University Hospital, Rigshospitalet, Copenhagen,
Denmark.
Introduction: It is well known that obesity is
associated with increased cardiovascular morbidity
and mortality. The cardiovascular risks include
ischaemic heart disease as well as heart failure.
Several echocardiographic studies indicate an impaired
left ventricular (LV) function and an increased left
ventricular myocardial mass in obese subjects without
any other known cardiovascular disease.
Purpose: To quantify the impact of obesity on LV
dimensions and systolic function measured by MRI in
otherwise healthy subjects.
Methods: Forty-eight normotensive, obese subjects
without history of cardiovascular disease or diabetes
were examined (BMI: mean 36 kg/m2 (SD 1.77), range
32–40 kg/m2, age: mean 40 yr (SD 11), range 20–58 yr,
sex: 13 male, 35 female) using a whole-body MRI
scanner operating at 1.0 tesla with a phased array chest
coil as receiver coil. The images were acquired using an
electrocardiogram-triggered, breath-hold, gradient-echo
technique with an imaging plane in the true short axis of
the left ventricle. The temporal resolution was 55 msec,
slice thickness 6 mm, field-of-view of 263 £ 350 mm2
and matrix size 126 £ 256. The entire LV was enclosed
from basis to apex by a stack of imaging planes without
inter-slice gaps. For cardiac analysis, endocardial and
epicardial borders were manually detected from end-
diastolic (ED) images and endocardial borders were also
manually drawn from end-systolic (ES) images. LV mass
was calculated as the difference between ED epicardial
and endocardial volumes multiplied by a density factor
1.05 g/ml. LV stroke volume (LVSV) was calculated as
the difference between LVES volumes (LVESV) and
LVED volumes (LVEDV), and LV ejection fraction
(LVEF) as LVSV/LVEDV. All data were divided by
body surface area (BSA) by the formula: BSA ¼
Weight0.425 £ Length0.725 £ 0.007184 for indexation
and compared to normative MRI data from the literature
(Lorenz, C.H. et al. J. Cardiovasc. MR 1999; 1: 7–21).
Results: LVmass Index was significantly enlarged
in subjects with BMI $ 32 kg=m2 as compared to
non-obese subjects (mean 124 g/m2 (SD 21) vs mean
87 g/m2(SD 12)), ðp , 0:001Þ whereas LVEDVI (mean
67 ml/m2 (SD 10) vs mean 66 ml/m2 (SD 12)), LVSVI
(mean 46 ml/m2 (SD 7) vs mean 45 ml/m2(SD 8)) and
Figure 1. Left ventricular mass/body surface area (g/m2) in
subjects with BMI $ 32 kg/m2 compared to normative values
from the literature (mean: 87 g/m2 (SD 12)).
Poster Abstracts: Clinical MRI—Non-ischemic Acquired Heart Disease 121
©2002 Marcel Dekker, Inc. All rights reserved. This material may not be used or reproduced in any form without the express written permission of Marcel Dekker, Inc.
MARCEL DEKKER, INC. • 270 MADISON AVENUE • NEW YORK, NY 10016
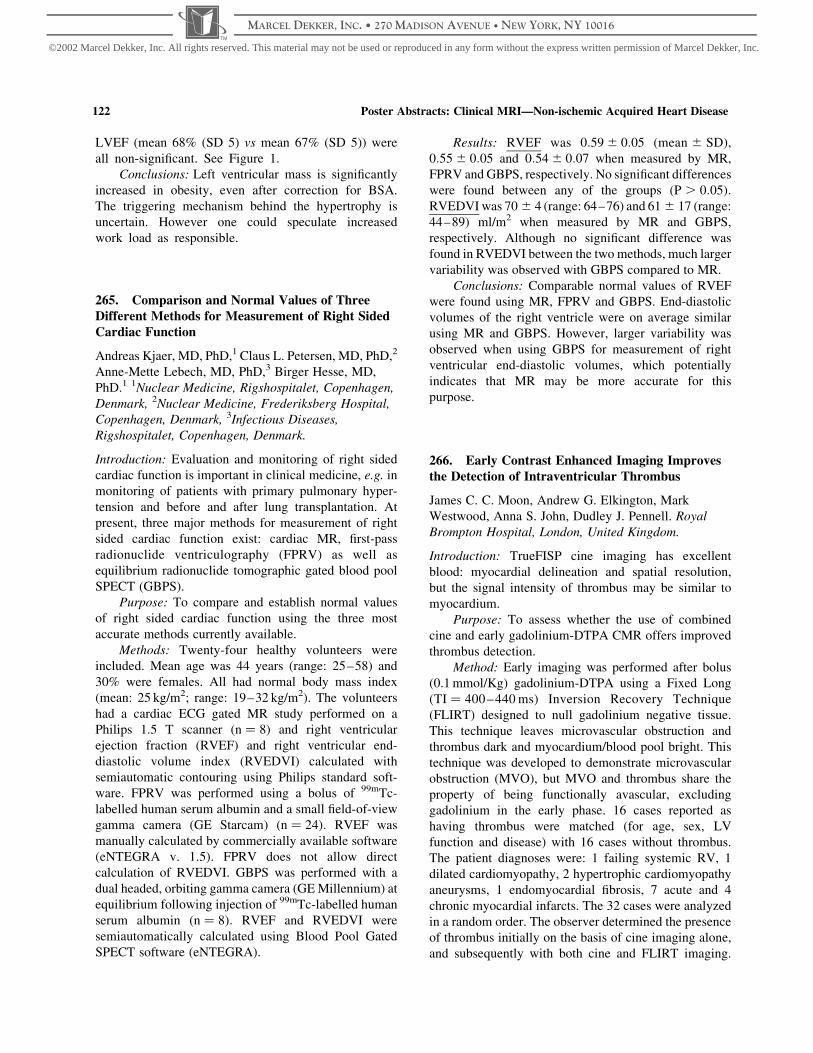
LVEF (mean 68% (SD 5) vs mean 67% (SD 5)) were
all non-significant. See Figure 1.
Conclusions: Left ventricular mass is significantly
increased in obesity, even after correction for BSA.
The triggering mechanism behind the hypertrophy is
uncertain. However one could speculate increased
work load as responsible.
265. Comparison and Normal Values of Three
Different Methods for Measurement of Right Sided
Cardiac Function
Andreas Kjaer, MD, PhD,1 Claus L. Petersen, MD, PhD,2
Anne-Mette Lebech, MD, PhD,3 Birger Hesse, MD,
PhD.1 1Nuclear Medicine, Rigshospitalet, Copenhagen,
Denmark, 2Nuclear Medicine, Frederiksberg Hospital,
Copenhagen, Denmark, 3Infectious Diseases,
Rigshospitalet, Copenhagen, Denmark.
Introduction: Evaluation and monitoring of right sided
cardiac function is important in clinical medicine, e.g. in
monitoring of patients with primary pulmonary hyper-
tension and before and after lung transplantation. At
present, three major methods for measurement of right
sided cardiac function exist: cardiac MR, first-pass
radionuclide ventriculography (FPRV) as well as
equilibrium radionuclide tomographic gated blood pool
SPECT (GBPS).
Purpose: To compare and establish normal values
of right sided cardiac function using the three most
accurate methods currently available.
Methods: Twenty-four healthy volunteers were
included. Mean age was 44 years (range: 25–58) and
30% were females. All had normal body mass index
(mean: 25 kg/m2; range: 19–32 kg/m2). The volunteers
had a cardiac ECG gated MR study performed on a
Philips 1.5 T scanner ðn ¼ 8Þ and right ventricular
ejection fraction (RVEF) and right ventricular end-
diastolic volume index (RVEDVI) calculated with
semiautomatic contouring using Philips standard soft-
ware. FPRV was performed using a bolus of 99mTc-
labelled human serum albumin and a small field-of-view
gamma camera (GE Starcam) ðn ¼ 24Þ: RVEF was
manually calculated by commercially available software
(eNTEGRA v. 1.5). FPRV does not allow direct
calculation of RVEDVI. GBPS was performed with a
dual headed, orbiting gamma camera (GE Millennium) at
equilibrium following injection of 99mTc-labelled human
serum albumin ðn ¼ 8Þ: RVEF and RVEDVI were
semiautomatically calculated using Blood Pool Gated
SPECT software (eNTEGRA).
Results: RVEF was 0:59 ^ 0:05 (mean ^ SD),
0:55 ^ 0:05 and 0:54 ^ 0:07 when measured by MR,
FPRV and GBPS, respectively. No significant differences
were found between any of the groups ðP . 0:05Þ:RVEDVI was 70 ^ 4 (range: 64–76) and 61 ^ 17 (range:
44–89) ml/m2 when measured by MR and GBPS,
respectively. Although no significant difference was
found in RVEDVI between the two methods, much larger
variability was observed with GBPS compared to MR.
Conclusions: Comparable normal values of RVEF
were found using MR, FPRV and GBPS. End-diastolic
volumes of the right ventricle were on average similar
using MR and GBPS. However, larger variability was
observed when using GBPS for measurement of right
ventricular end-diastolic volumes, which potentially
indicates that MR may be more accurate for this
purpose.
266. Early Contrast Enhanced Imaging Improves
the Detection of Intraventricular Thrombus
James C. C. Moon, Andrew G. Elkington, Mark
Westwood, Anna S. John, Dudley J. Pennell. Royal
Brompton Hospital, London, United Kingdom.
Introduction: TrueFISP cine imaging has excellent
blood: myocardial delineation and spatial resolution,
but the signal intensity of thrombus may be similar to
myocardium.
Purpose: To assess whether the use of combined
cine and early gadolinium-DTPA CMR offers improved
thrombus detection.
Method: Early imaging was performed after bolus
(0.1 mmol/Kg) gadolinium-DTPA using a Fixed Long
(TI ¼ 400–440 ms) Inversion Recovery Technique
(FLIRT) designed to null gadolinium negative tissue.
This technique leaves microvascular obstruction and
thrombus dark and myocardium/blood pool bright. This
technique was developed to demonstrate microvascular
obstruction (MVO), but MVO and thrombus share the
property of being functionally avascular, excluding
gadolinium in the early phase. 16 cases reported as
having thrombus were matched (for age, sex, LV
function and disease) with 16 cases without thrombus.
The patient diagnoses were: 1 failing systemic RV, 1
dilated cardiomyopathy, 2 hypertrophic cardiomyopathy
aneurysms, 1 endomyocardial fibrosis, 7 acute and 4
chronic myocardial infarcts. The 32 cases were analyzed
in a random order. The observer determined the presence
of thrombus initially on the basis of cine imaging alone,
and subsequently with both cine and FLIRT imaging.
Poster Abstracts: Clinical MRI—Non-ischemic Acquired Heart Disease122
©2002 Marcel Dekker, Inc. All rights reserved. This material may not be used or reproduced in any form without the express written permission of Marcel Dekker, Inc.
MARCEL DEKKER, INC. • 270 MADISON AVENUE • NEW YORK, NY 10016
The percentage signal difference of thrombus was
determined for both techniques.
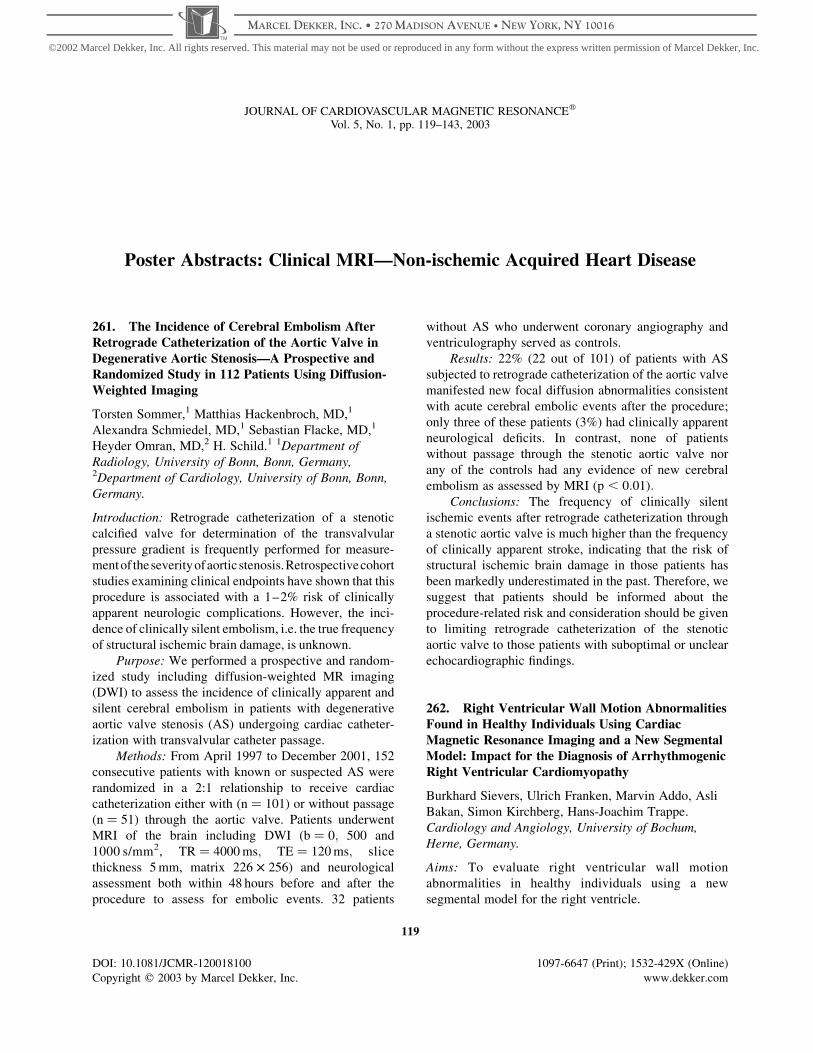
Results: Using cine imaging alone, 9 (56%) of
thrombi were detected with 1(6%) false positive. Using
cine and FLIRT, detection improved to 94% with no
false positives. Thus cine alone had a sensitivity/speci-
ficity of 56% and 93% respectively; cine plus FLIRT
94% and 100%. On cine imaging, where detected,
thrombus was 41% darker than blood and 60% brighter
than myocardium. Using FLIRT, these improved to
355% ðp ¼ 0:001Þ and 133% ðP ¼ NSÞ; respectively.
Conclusion: The combination of FISP cine imaging
with early gadolinium imaging improves the detection of
ventricular thrombus over cine imaging alone.
267. Mitral Stenosis Is Accurately Quantified with
Velocity-Encoded MRI by the “Pressure Half-Time”
Method: Comparison with Doppler Ultrasound
Shiow Jiuan Lin,1 Mary P. Watkins,1 Todd A. Williams,1
Peggy A. Brown,1 Katherine A. Lehr,1 Gregory M.
Lanza,1 Samuel A. Wickline,1 Shelton D. Caruthers.2
1Cardiovascular MR Laboratories at Washington
University, St Louis, MO, USA, 2Cardiovascular MR
Laboratories at Washington University & Philips
Medical Systems, Best, Netherlands.
Introduction: Mitral stenosis is a common condition in
adults as a consequence of either calcific or rheumatic
disease, and requires absolute quantification for appro-
priate medical and surgical management. Evaluation of
mitral valve area noninvasively with Doppler echocar-
diography provides rapid and accurate analysis of mitral
valve disease and serves as a gold standard for clinical
medicine. However, the reliability of velocity-encoded
Magnetic Resonance Imaging for quantification of mitral
valve stenosis has not been defined. Furthermore,
approaches that employ the pressure half-time (P1/2T)
method for estimating valve size have not been reported.
Accordingly, we implemented an MRI phase contrast
version of the P1/2T method to estimate the orifice area of
stenotic mitral valves and compared these values paired
Doppler ultrasound data.
Purpose: The purpose of this study is to define the
extent of concordance between mitral valve areas
determined by velocity-encoded MRI and Doppler-
derived results by analyzing flow velocity data with the
P1/2T method in both cases. Furthermore, MR and
ultrasound measurements of the maximum velocities
across the mitral valve during early and late diastole
(Emax and Amax, respectively) also were compared.
Methods: Twelve sequential patients with an
echocardiographic diagnosis of mitral stenosis were
recruited. Each patient was imaged using a whole-body
MRI unit operating at 1.5 T (Intera CV, Philips Medical
Systems, Best, Netherlands). With the use of the
velocity-encoded MR technique, quantitative flow
images (through-plane encoding) were acquired
(TE/TR/a ¼ 3.0 ms/6.1 ms/308, Matrix 128 £ 256,
FoV ¼ 350 mm, thk ¼ 8 mm, Temporal Resolu-
tion ¼ 30 phases/RR interval). The velocity-encoded
MRI series were performed in the left ventricular short
axis plane oriented parallel to the mitral valve plane,
positioned 1.5 cm from the valve plane toward the apex.
The maximum encoding velocity limit (VENC) was
chosen as ,2 m/s. If velocity aliasing occurred, the
images were re-acquired with a higher VENC. All MR
images were transferred to an offline workstation
(EasyVision R5.1, Philips Medical Systems) for
quantitative flow analysis. A region of interest was
drawn to include the stenotic mitral jet. The peak flow
Figure 1. FISP imaging (L) in a patient with an acute MI is
inconclusive, but the large thrombus (R) is revealed by early
contrast imagine (R).
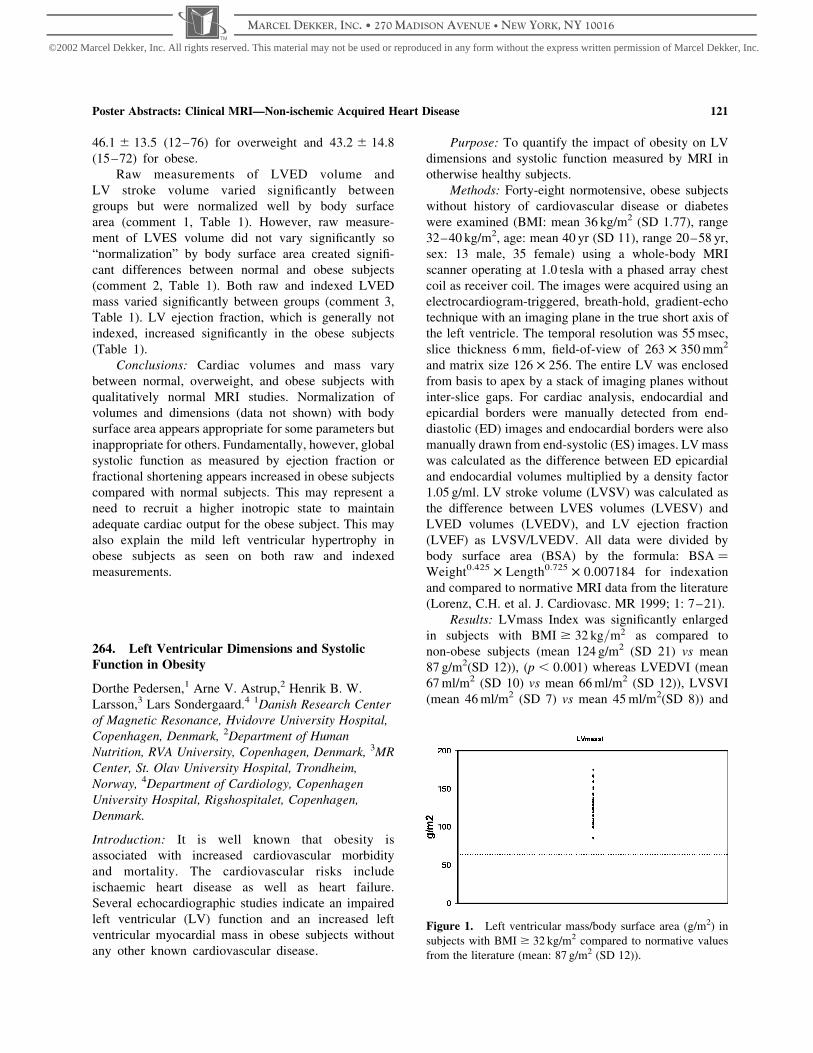
Figure 1. The mitral valve area estimated by the pressure
half-time method for both Ultrasound Doppler and velocity-
encoded MRI.
Poster Abstracts: Clinical MRI—Non-ischemic Acquired Heart Disease 123
©2002 Marcel Dekker, Inc. All rights reserved. This material may not be used or reproduced in any form without the express written permission of Marcel Dekker, Inc.
MARCEL DEKKER, INC. • 270 MADISON AVENUE • NEW YORK, NY 10016
velocity through the valve measured in each phase during
diastole was used as a starting point to determine the
P1/2T by a least squares fitting technique to the linear
portion of the flow velocity curves. E and A-wave
velocities were defined (Emax and Amax). All MRI values
were compared double-blinded with ultrasound measure-
ments, which were recorded by a skilled sonographer and
analyzed immediately with the patient remaining on the
MRI trolley table. For both MRI and Doppler ultrasound,
valve area was estimated as 220/(P1/2T).
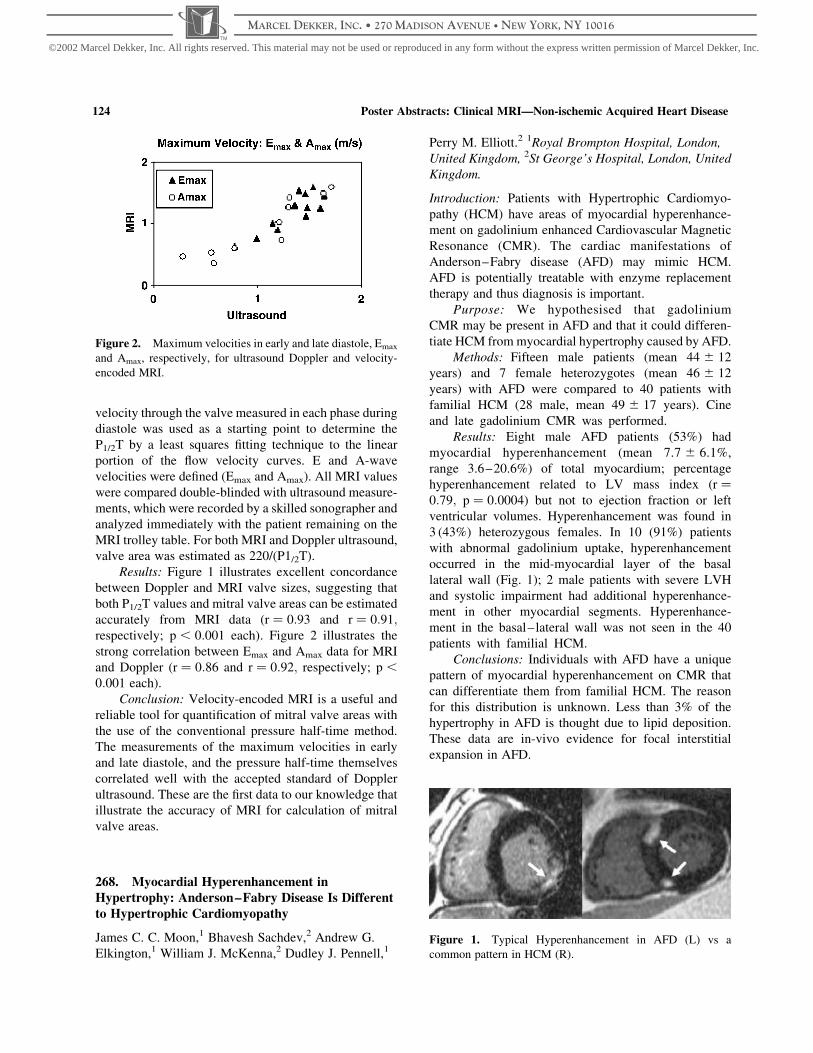
Results: Figure 1 illustrates excellent concordance
between Doppler and MRI valve sizes, suggesting that
both P1/2T values and mitral valve areas can be estimated
accurately from MRI data (r ¼ 0:93 and r ¼ 0:91;respectively; p , 0:001 each). Figure 2 illustrates the
strong correlation between Emax and Amax data for MRI
and Doppler (r ¼ 0:86 and r ¼ 0:92; respectively; p ,
0:001 each).
Conclusion: Velocity-encoded MRI is a useful and
reliable tool for quantification of mitral valve areas with
the use of the conventional pressure half-time method.
The measurements of the maximum velocities in early
and late diastole, and the pressure half-time themselves
correlated well with the accepted standard of Doppler
ultrasound. These are the first data to our knowledge that
illustrate the accuracy of MRI for calculation of mitral
valve areas.
268. Myocardial Hyperenhancement in
Hypertrophy: Anderson–Fabry Disease Is Different
to Hypertrophic Cardiomyopathy
James C. C. Moon,1 Bhavesh Sachdev,2 Andrew G.
Elkington,1 William J. McKenna,2 Dudley J. Pennell,1
Perry M. Elliott.2 1Royal Brompton Hospital, London,
United Kingdom, 2St George’s Hospital, London, United
Kingdom.
Introduction: Patients with Hypertrophic Cardiomyo-
pathy (HCM) have areas of myocardial hyperenhance-
ment on gadolinium enhanced Cardiovascular Magnetic
Resonance (CMR). The cardiac manifestations of
Anderson–Fabry disease (AFD) may mimic HCM.
AFD is potentially treatable with enzyme replacement
therapy and thus diagnosis is important.
Purpose: We hypothesised that gadolinium
CMR may be present in AFD and that it could differen-
tiate HCM from myocardial hypertrophy caused by AFD.
Methods: Fifteen male patients (mean 44 ^ 12
years) and 7 female heterozygotes (mean 46 ^ 12
years) with AFD were compared to 40 patients with
familial HCM (28 male, mean 49 ^ 17 years). Cine
and late gadolinium CMR was performed.
Results: Eight male AFD patients (53%) had
myocardial hyperenhancement (mean 7.7 ^ 6.1%,
range 3.6–20.6%) of total myocardium; percentage
hyperenhancement related to LV mass index ðr ¼
0:79; p ¼ 0:0004Þ but not to ejection fraction or left
ventricular volumes. Hyperenhancement was found in
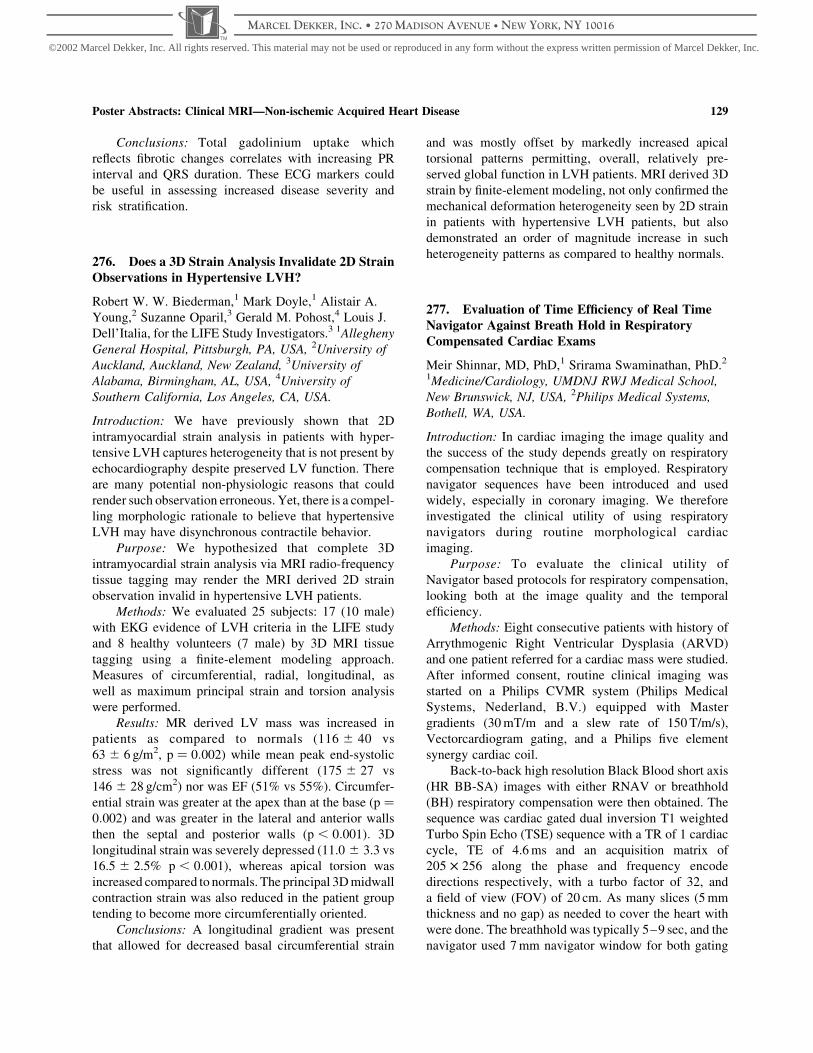
3 (43%) heterozygous females. In 10 (91%) patients
with abnormal gadolinium uptake, hyperenhancement
occurred in the mid-myocardial layer of the basal
lateral wall (Fig. 1); 2 male patients with severe LVH
and systolic impairment had additional hyperenhance-
ment in other myocardial segments. Hyperenhance-
ment in the basal–lateral wall was not seen in the 40
patients with familial HCM.
Conclusions: Individuals with AFD have a unique
pattern of myocardial hyperenhancement on CMR that
can differentiate them from familial HCM. The reason
for this distribution is unknown. Less than 3% of the
hypertrophy in AFD is thought due to lipid deposition.
These data are in-vivo evidence for focal interstitial
expansion in AFD.
Figure 2. Maximum velocities in early and late diastole, Emax
and Amax, respectively, for ultrasound Doppler and velocity-
encoded MRI.
Figure 1. Typical Hyperenhancement in AFD (L) vs a
common pattern in HCM (R).
Poster Abstracts: Clinical MRI—Non-ischemic Acquired Heart Disease124
©2002 Marcel Dekker, Inc. All rights reserved. This material may not be used or reproduced in any form without the express written permission of Marcel Dekker, Inc.
MARCEL DEKKER, INC. • 270 MADISON AVENUE • NEW YORK, NY 10016

269. Enrasentan Compared with Enalapril in
Patients with Asymptomatic Left Ventricular SystolicDysfunction
Sanjay K. Prasad,1 Gillian C. Smith, MSc,1 Henry J.
Dargie, MD,2 John C. C. Cleland, MD,3 Dudley J.
Pennell, MD.1 1CMR Unit, Royal Brompton Hospital,
London, United Kingdom, 2Cardiology, Western
Infirmary, London, United Kingdom, 3Cardiology,
University of Hull, Hull, United Kingdom.
Introduction: Endothelin (ET) is a potent neurohor-
monal vasoconstrictor. Plasma and myocardial and
levels of ET are associated with disease severity in
congestive heart-failure and are a powerful predictor
of adverse prognosis.
Purpose: In this study, we compared the effect of the
orally active dual ETA/B receptor antagonist enrasentan
with enalapril on left ventricular (LV) remodeling.
Methods: A multicenter, randomized, double-blind,
parallel group study was performed in asymptomatic
patients in NYHA 1 with left ventricular dysfunction
defined as an LV ejection fraction (EF) #40% measured
by echocardiography or #45% as measured by
cardiovascular magnetic resonance (CMR). Seventy-
two patients were randomized to receive either
enrasentan (60–90 mg/day, n ¼ 36) or enalapril (10–
20 mg/day, n ¼ 36). The primary end-point was the
change in LV end-diastolic volume index (LVEDVI)
after 6 months treatment as measured by CMR. The
secondary objectives were to compare the drug effects on
other remodeling and cardiac function parameters;
circulating neurohormones; the safety of enrasentan;
progression of heart failure; and patient symptoms.
Results: Enrasentan increased LVEDVI
(þ3.88 ^ 1.79 mL/m2) compared with enalapril
(23.35 ^ 1.39 mL/m2; P ¼ 0:001), and also LV mass
index (þ0.67 ^ 1.55 g/m2 vs 23.55 ^ 1.6 g/m2,
P ¼ 0:04). Enrasentan increased resting cardiac index
compared with enalapril (þ0.11 ^ 0.07 L/m2 vs
20.096 ^ 0.069 L/m2; P ¼ 0:05). Other remodeling
parameters were comparable between groups. Both
drugs lowered BNP levels but this was more marked with
enalapril (enrasentan 25.8 ^ 6.9 pg/mL, enalapril
219.3 ^ 9.4 pg/mL; P ¼ 0:005 for the difference).
There was no difference in the rate of progression of
HF or in the serious adverse event profile.
Conclusions: In asymptomatic patients with LV
dysfunction, enrasentan increased LVEDVI compared to
enalapril. This would suggest an adverse remodeling
effect of enrasentan at a dose of 60–90 mg/day over 6
months, and occurred despite an increase in the resting
cardiac index.
270. Right and Left Heart Overload Triggers of
Low T3 Syndrome in Patients with Cardiomyopathy:A Magnetic Resonance Study
Michele Emdin, AnnaMaria Sironi, Claudio Passino,
Massimo Lombardi. CNR Institute of Clinical
Physiology, Pisa, Italy.
Introduction: Biologically active thyroid hormone
(triiodothyronine, T3), recognizes an inotropic and
vasodilator effect, lost in chronic heart failure, when
low T3 serum concentrations are frequently observed
even in absence of thyroid disease (“euthyroid sick
syndrome”).
Purpose: We assessed the hypothesis that the
relative contribute of left and right atrial and ventricular
overload in heart failure to T3 plasma levels might be
different.
Methods: 26 patients (23 males, age 58 ^ 2 yrs,
body surface area (BSA) 1.92 ^ 0.02 m2, mean ^SEM)
with idiopathic (15) or postischemic (11) cardiomyo-
pathy underwent cardiac magnetic resonance imaging
(MRI) and resting plasma determination of ANP and
BNP (IRMA assay, Schering). Left and right atrial and
ventricular volumes and function were assessed by MRI
(1.5 T, Cvi, GEMS, Milwaukee, USA). A FIESTA
sequence was adopted to obtain parallel short axis of the
ventricles, and 3D reconstruction was obtained in post-
processing.
Results: Left ventricular ejection fraction (LVEF)
was 23.7 ^ 1.6, while right ventricular ejection fraction
was 29.5 ^ 1.9%. End diastolic volumes were 268 ^ 18
and 125 ^ 10 ml for the left and right ventricle,
respectively. In the same day blood was sampled at
8 a.m. for thyroid hormones (fT3 and fT4) and TSH in all
patients. Plasma fT3 values ranged from 1.33 to
3.17 pg/ml with a mean value of 2.3 ^ 0.49 (reference
values 2.1–4.2), fT4 was on average 13.2 ^ 2.8 pg/mL
(reference: 7.1–18.5) and TSH 1.63 ^ 0.2 mUI/ml
(reference: 0.3–3.8). Free T3 only (but not fT4 or
TSH) positively correlated with either end-diastolic or
end-systolic right ventricular volume, (r ¼ 0:55; p ¼
0:01 and r ¼ 0:53; P , 0:01; respectively), and with
end-diastolic or end-systolic left ventricular volume,
(r ¼ 0:58; p ¼ 0:003 and r ¼ 0:60; P ¼ 0:002; respect-
ively). Moreover, a significant negative correlation was
observed between fT3 and LVEF (r ¼ �0:57;p ¼ 0:004).
Conclusions: Decrement in fT3 plasma values is
associated with both left/right heart overload and left
ventricular dysfunction, possibly explaining the
emergent clinical role of low T3 syndrome in heart
failure.
Poster Abstracts: Clinical MRI—Non-ischemic Acquired Heart Disease 125
©2002 Marcel Dekker, Inc. All rights reserved. This material may not be used or reproduced in any form without the express written permission of Marcel Dekker, Inc.
MARCEL DEKKER, INC. • 270 MADISON AVENUE • NEW YORK, NY 10016

271. Contrast Enhanced CMR Does Not Show
Subendocardial Injury in Patients with Severe Aortic
Stenosis
Claudio Kupfahl, MD, Marcus Honold, MD, Udo
Sechtem, MD, FESC, FACC. Department of Cardiology,
Robert-Bosch-Medical Center, Stuttgart, Germany.
Introduction: Contrast enhanced magnetic resonance
imaging (CMR) using Gd-DPTA can be used for
detection of ischemic or inflammatory myocardial injury
in different heart diseases. Valvular aortic stenosis (AS)
is characterised by left ventricular pressure overload and
concentric hypertrophy. This may lead to fibrotic
myocardial changes. Furthermore, a previous contrast
enhanced CMR study suggested that diffuse ischemic
myocardial injury in the subendocardial region occurs
regularly in patients with severe AS.
Purpose: We investigated whether fibrotic myocar-
dial changes or ischemic myocardial necrosis and scarring
in patients with AS can be visualised using Gd-DTPA
contrast enhanced IR-2D FLASH CMR imaging.
Methods: Forty-three consecutive patients with
moderate (#1.5 cm2; n ¼ 4) or severe (#1.0 cm2;
n ¼ 39) valvular AS were included. Conditions known
or suspected to result in delayed Gd-DTPA enhancement
such as vascular ischemic events, myocarditis, cardio-
myopathies, storage diseases, sarcoidosis and tumours
were excluded. Patient characteristics are given in
Table 1, functional CMR measurements (True FISP
sequences) are shown in Table 2. IR-2D FLASH images
(TE 4.38 ms; FA 258; FoV 340 mm; resolution
1.7 £ 1.3 £ 10 mm; TI 250–350 ms, adjusted individu-
ally for optimal nulling of myocardium) were acquired 5
to 20 minutes after injection of 0.1 mmol/kg Gd-DTPA.
Data acquisition was performed in short axis views
covering the whole ventricle and in standardised long
axis views.
Results: Three patients had to be excluded because
image quality of IR-FLASH was not sufficient for
interpretation due to the fact that patients were not able to
hold their breath during measurement or due to
suboptimal triggering in cardiac arrhythmias. In 38
patients there was no delayed enhancement detectable.
Two patients showed hyperenhancement. The first
patient showed localised enhancement extending from
the subendocardial layer almost to the epicardium of the
midventricular anterior wall. The second patient had
focal nontransmural hyperenhancement in the midven-
tricular posterolateral region. Diffuse subendocardial
enhancement was not seen in any patient.
Conclusion:In contrast to previous findings, contrast
enhanced CMR using IR-2D FLASH does not show diffuse
subendocardial enhancement representing ischemic myo-
cardial injury in patients with AS. In addition, CMR using
IR-2D FLASH is not able to detect the diffuse fibrosis
frequently seen at autopsy in hearts with longstanding
pressure overload due to AS. These findings were
independent of the severity of AS, hemodynamic status
or clinical symptoms of the patients. Localisation and
extent of the delayed enhancement seen in the two patients
of this study are incompatible with the supposed
mechanism of diffuse subendocardial injury caused by
reduced myocardial blood flow. It is much more likely that
these lesions represent myocardial scar after clinically
inapparent myocarditis or coronary embolism.
272. Regional Heterogeneity in 3D Myocardial
Shortening in Hypertensive LV Hypertrophy: MR
Tagging Substudy to LIFE
Robert W. W. Biederman,1 Alistair A. Young,2 Mark
Doyle,1 Richard B. Devereux,3 Eduardo Kortright,4
Table 1. Patient characteristics.
Age (years sex) NYHA I–II NYHA III–IV CCS I–II CCS III–IV Vertigo/Syncope
Previous cardiac
decompensation
69 (^9) 27 male n ¼ 13 n ¼ 21 n ¼ 6 n ¼ 9 n ¼ 7 n ¼ 9
Table 2. Functional CMR measurements.
LVEF (%) LVEF , 50% Septal diameter (mm) AVA (cm2) AVA # 1.0 cm2 Bicuspide AV Concomitant AR
60 ^ 19 n ¼ 13 15 ^ 3 0.77 ^ 0.22 n ¼ 39 n ¼ 17 n ¼ 25
Poster Abstracts: Clinical MRI—Non-ischemic Acquired Heart Disease126
©2002 Marcel Dekker, Inc. All rights reserved. This material may not be used or reproduced in any form without the express written permission of Marcel Dekker, Inc.
MARCEL DEKKER, INC. • 270 MADISON AVENUE • NEW YORK, NY 10016

Gilbert Perry,5 Johnathan N. Bella,3 Suzanne Oparil,5
David Calhoun,5 Gerald M. Pohost,6 Louis J.
Dell’Italia, for the LIFE Study Investigators.5
1Allegheny General Hospital, Pittsburgh, PA, USA,2University of Auckland, Auckland, New Zealand,3The New York Hospital Cornell Medical Center, New
York, NY, USA, 4University of New Orleans, New
Orleans, LA, USA, 5University of Alabama,
Birmingham, AL, USA, 6University of Southern
California, Los Angeles, CA, USA.
Introduction: High relative wall thickness in hyper-
tensive left ventricular hypertrophy (LVH) has been
shown by echocardiography to allow preserved
shortening at the endocardium despite depressed LV
midwall circumferential shortening (MWCS). A
depressed MWCS is an adverse prognostic indicator,
but whether this finding is related to global or
regional depression of LV myocardial function is
unknown, particularly as it relates to 3D myocardial
strain patterns.
Methods: Magnetic resonance (MR) tissue tagging
permits direct evaluation of 3D intramyocardial strain on
a regional basis, independently of LV geometry. We
evaluated 21 patients with LVH ECG criteria in the LIFE
study and 8 normals, using 3D MR tagging and m-mode
echocardiography.
Results: In patients vs. normals, MR LV mass
was increased (116 ^ 40 vs 63 ^ 6 g/m2, p ¼ 0:002).
Neither m-mode fractional shortening (32 ^ 6 vs
33 ^ 3%) nor mean peak systolic stress were
significantly different (175 ^ 27 vs 146 ^ 28 g/cm2),
yet MWCS was decreased by both m-mode
(13.4.2 ^ 2.3 vs 18.2 ^ 1.4%, p , 0:001) and MR
(16.8 ^ 3.6 vs. 21.6 ^ 3.1%, p , 0:005). 3D MR
MWCS was lower at the base vs. apex ðp ¼ 0:002Þ in
LVH and greater in lateral and anterior regions vs.
septal and posterior regions ðp , 0:001Þ; contributing
to the greater global MWCS estimate by MR. MR
longitudinal strain was severely depressed in LVH pts
(11.0 ^ 3.3 vs 16.5 ^ 2.5%, p , 0:001) and apical
torsion was increased (17.5 ^ 4.3 vs 13.7 ^ 3.7%,
p , 0:05). Importantly, both circumferential and
longitudinal shortening correlated with the LV wall
thickness to radius ratio (h/r) (r . 0:60; p ¼ 0:001 for
both).
Conclusions: In patients with hypertensive LVH,
m-mode echocardiography and MRI tagging showed
similarly depressed MWCS. However, there was marked
intramyocardial heterogeneity in LV myocardial func-
tion, leading to an underestimation of global MWCS by
echocardiography.
273. The Left Ventricular Outflow Tract Area in
Hypertrophic Obstructive Cardiomyopathy Is notSusceptible to Preload Changes—As Assessed by
MRI
Jeanette Schulz-Menger, Nidal Al Saadi, Daniel
Messroghli, Bernhard Pilz, Rainer Dietz, Matthias G.
Friedrich. Cardiology, Franz-Volhard-Klinik, Charite,
Campus Buch, Helios-Klinikum, Berlin, Germany.
Introduction: In hypertrophic obstructive cardiomyo-
pathy (HOCM), the quantification of the obstruction is an
important clinical parameter. The pressure gradient,
however, is prone to strong interstudy variations, mainly
due to alterations of preload. A planimetry of the left
ventricular outflow tract (LVOT) area in images obtained
by magnetic resonance imaging (MRI) was shown to be
helpful.
Purpose: We hypothesized that the LVOT area itself
is less likely to change under different hemodynamic
situations than the related pressure gradient.
Methods: We investigated 17 patients with HOCM
applying MRI and echocardiography using a repeated
protocol for changing the hemodynamic conditions
within 2 hours. The LVOT-area was quantified in
gradient-echo images (slice thickness 4 mm, TE, TR)
acquired with a temporal resolution of less than
35 ms/image in a 1.5 T scanner (Signa CV/I, GE Medical
Systems). The pressure gradient was estimated in
standard views on a state-of-the-art sytem (Sequoia
256, Acuson). The protocol included baseline measure-
ments (“native”), measurements after increasing the
preload by a 458 elevation of the legs (“45”), and after
decreasing the preload by administration of sublingual
nitro-glycerin. The latter maneuver was followed by 5
measurements every minute (N1; N2; N3; N4; N5).
The absolute values were quantified and compared
to baseline.
Results: The LVOT area was not altered significantly
by a change of preload conditions (native: 2.11 ^ 0.2 cm2;
“45”: 2.2 ^ 0.2 cm2; N1 2.0 ^ 0.2 cm2; N2:
2.0 ^ 0.2 cm2; N3: 1.9 ^ 0.2 cm2; N4: 2.0 ^ 0.3 cm2;
N5: 1.9 ^ 0.2 cm2; p ¼ ns). While the Echo-derived
pressure gradient did not change significantly by the
increase of preload, the application of nitro-glycerin the
pressure gradient increased markedly (native:
66 ^ 10 mmHg; 45: 64 ^ 9mmHg, p ¼ n:s:; N1:
96 ^ 12 mmHg, p , 0:005; N2: 93 ^ 11, p , 0:0005;
N3: 93 ^ 12 p , 0:0001; N4: 93 ^ 14, p , 0:005; N5:
91 ^ 14, p , 0:0005).
Conclusions: In addition to its’ good correlation to
the clinical status, the MRI-derived planimetry of
the LVOT area in HOCM is only marginally susceptible
Poster Abstracts: Clinical MRI—Non-ischemic Acquired Heart Disease 127
©2002 Marcel Dekker, Inc. All rights reserved. This material may not be used or reproduced in any form without the express written permission of Marcel Dekker, Inc.
MARCEL DEKKER, INC. • 270 MADISON AVENUE • NEW YORK, NY 10016

to preload variations. Thus, MRI offers clear advantages
over the pressure gradient for the diagnosis and follow-
up in patients with HOCM.
274. Myocardial Iron Levels Measured by T2*
CMR in Sickle Cell Anaemia
Mark A. Westwood,1 Lisa J. Anderson,1 Farrukh T.
Shah,2 Julian W. Strange,1 John B. Porter,3 Malcolm J.
Walker,3 Dudley J. Pennell.1 1CMR Unit, Royal
Brompton Hospital, London, United Kingdom,2Department of Haematology, University College
Hosptial, London, United Kingdom, 3Department of
Haematology, University College Hospital, London,
United Kingdom.
Introduction: Severe sickle cell anemia requires repeated
blood transfusions, as does thalassemia major (TM). In
TM this leads to myocardial iron accumulation and a
dilated cardiomyopathy, causing death in 60%. Cardio-
myopathy also occurs in sickle cell anemia, but the
aetiology is uncertain. As myocardial iron loading could
be a factor in sickle cell cardiomyopathy, we compared
the myocardial iron distribution in patients with sickle
cell anemia matched for iron loading to those with TM.
Purpose: To assess myocardial iron loading in sickle
cell anemia.
Methods: 13 patients with transfusion dependent
sickle cell disease (mean age 35 ^ 12) were selected,
and matched to 13 patients with TM (mean age
22 ^ 15) for liver iron loading. Myocardial and liver
iron loading were assessed by T2* measurements
derived from a gradient echo magnetic resonance
sequence. TrueFISP cine images were obtained on all
patients for volumetric analysis. Cumulative iron load
(from blood bank records) in the sickle group ranged
between 0.5–116 g of iron and in the TM patients
between 45–275 g.
Results: There was a significant difference ðp ,
0:05Þ in the myocardial iron load between the sickle cell
group (37.0 ^ 10.1 ms) as compared to the matched TM
group (22.4 ^ 15.2 ms). Surprisingly, no patient with a
sickle disorder had significant myocardial iron loading,
whereas 5 of the TM patients had significant myocardial
iron loading ðT2* , 20 msÞ: The mean end diastolic
volume was significantly greater in the sickle cell group
(187 ^ 50 ml vs 143 ^ 28 ml, p , 0:05), however there
was no significant difference in any of the other
ventricular function parameters. The liver iron concen-
trations were well matched, with 5.4 ^ 4.9 mg/gdw in
the sickle cell group, and 6.2 ^ 5.9 mg/gdw ðp ¼ 0:84Þ
for the TM group.
Conclusion: Myocardial iron loading does not
appear to play a significant role in sickle cell anaemia.
The cause for a sickle cell cardiomyopathy remains
unclear, and the transfusional iron burden differs
significantly between these 2 conditions.
275. Relation Between Gadolinium
Hyperenhancement by CMR and Abnormalities on
the Surface Electrocardiogram in HypertrophicCardiomyopathy
Sanjay K. Prasad, MD,1 Asifa Quraishi, MBBS,1 James
C. C. Moon, MBBS,1 Alicia M. Maceira, MD,1 Perry
Elliott, MD,2 William J. McKenna, FRCP,2 Dudley
Pennell, MD.1 1CMR Unit, Royal Brompton Hospital,
London, United Kingdom, 2Cardiology, St George’s
Hospital, London, United Kingdom.
Introduction: Hypertrophic cardiomyopathy (HCM) is a
condition with significant morbidity and mortality. It is
characterised histologically by myocardial disarray and
fibrosis. It is thought that gadolinium hyperenhancement
by CMR identifies these fibrotic changes in-vivo, and
may be a useful marker for the risk of sudden death. It is
also known that ECG abnormalities occur in HCM,
including increased PR and QRS duration and abnormal
Q waves.
Purpose: We hypothesised that these ECG changes
correlatedwithfibrosisindicatedbylategadoliniumuptake.
Methods: 39 patients with HCM were studied. The
PR interval, QRS duration and the presence of
regional Q waves was determined. CMR was
performed using a 1.5T Siemens Sonata scanner.
Gadolinium hyperenhancement in the myocardium
was determined 10–15 minutes after a bolus dose of
0.1 mmol/kg using a standard inversion recovery
technique. The mass of hyperenhancement in the left
ventricle was assessed using planimetry and related as
a percentage of the total left ventricular mass.
Results: 28 (72%) patients demonstrated gadoli-
nium uptake, with the mean percentage of total uptake
being 13.9% (SD 10.6%, range 3 to 40%). There was
a significant linear correlation between the total
percentage of gadolinium uptake and the PR interval
ðr ¼ 0:449; p ¼ 0:006Þ; and the QRS duration ðr ¼
0:38; p ¼ 0:017Þ: However, there was no significant
relationship between gadolinium uptake and the
presence of Q waves.
Poster Abstracts: Clinical MRI—Non-ischemic Acquired Heart Disease128
©2002 Marcel Dekker, Inc. All rights reserved. This material may not be used or reproduced in any form without the express written permission of Marcel Dekker, Inc.
MARCEL DEKKER, INC. • 270 MADISON AVENUE • NEW YORK, NY 10016
Conclusions: Total gadolinium uptake which
reflects fibrotic changes correlates with increasing PR
interval and QRS duration. These ECG markers could
be useful in assessing increased disease severity and
risk stratification.
276. Does a 3D Strain Analysis Invalidate 2D Strain
Observations in Hypertensive LVH?
Robert W. W. Biederman,1 Mark Doyle,1 Alistair A.
Young,2 Suzanne Oparil,3 Gerald M. Pohost,4 Louis J.
Dell’Italia, for the LIFE Study Investigators.3 1Allegheny
General Hospital, Pittsburgh, PA, USA, 2University of
Auckland, Auckland, New Zealand, 3University of
Alabama, Birmingham, AL, USA, 4University of
Southern California, Los Angeles, CA, USA.
Introduction: We have previously shown that 2D
intramyocardial strain analysis in patients with hyper-
tensive LVH captures heterogeneity that is not present by
echocardiography despite preserved LV function. There
are many potential non-physiologic reasons that could
render such observation erroneous. Yet, there is a compel-
ling morphologic rationale to believe that hypertensive
LVH may have disynchronous contractile behavior.
Purpose: We hypothesized that complete 3D
intramyocardial strain analysis via MRI radio-frequency
tissue tagging may render the MRI derived 2D strain
observation invalid in hypertensive LVH patients.
Methods: We evaluated 25 subjects: 17 (10 male)
with EKG evidence of LVH criteria in the LIFE study
and 8 healthy volunteers (7 male) by 3D MRI tissue
tagging using a finite-element modeling approach.
Measures of circumferential, radial, longitudinal, as
well as maximum principal strain and torsion analysis
were performed.
Results: MR derived LV mass was increased in
patients as compared to normals (116 ^ 40 vs
63 ^ 6 g/m2, p ¼ 0:002) while mean peak end-systolic
stress was not significantly different (175 ^ 27 vs
146 ^ 28 g/cm2) nor was EF (51% vs 55%). Circumfer-
ential strain was greater at the apex than at the base ðp ¼
0:002Þ and was greater in the lateral and anterior walls
then the septal and posterior walls ðp , 0:001Þ: 3D
longitudinal strain was severely depressed (11.0 ^ 3.3 vs
16.5 ^ 2.5% p , 0:001), whereas apical torsion was
increased compared to normals. The principal 3D midwall
contraction strain was also reduced in the patient group
tending to become more circumferentially oriented.
Conclusions: A longitudinal gradient was present
that allowed for decreased basal circumferential strain
and was mostly offset by markedly increased apical
torsional patterns permitting, overall, relatively pre-
served global function in LVH patients. MRI derived 3D
strain by finite-element modeling, not only confirmed the
mechanical deformation heterogeneity seen by 2D strain
in patients with hypertensive LVH patients, but also
demonstrated an order of magnitude increase in such
heterogeneity patterns as compared to healthy normals.
277. Evaluation of Time Efficiency of Real Time
Navigator Against Breath Hold in Respiratory
Compensated Cardiac Exams
Meir Shinnar, MD, PhD,1 Srirama Swaminathan, PhD.2
1Medicine/Cardiology, UMDNJ RWJ Medical School,
New Brunswick, NJ, USA, 2Philips Medical Systems,
Bothell, WA, USA.
Introduction: In cardiac imaging the image quality and
the success of the study depends greatly on respiratory
compensation technique that is employed. Respiratory
navigator sequences have been introduced and used
widely, especially in coronary imaging. We therefore
investigated the clinical utility of using respiratory
navigators during routine morphological cardiac
imaging.
Purpose: To evaluate the clinical utility of
Navigator based protocols for respiratory compensation,
looking both at the image quality and the temporal
efficiency.
Methods: Eight consecutive patients with history of
Arrythmogenic Right Ventricular Dysplasia (ARVD)
and one patient referred for a cardiac mass were studied.
After informed consent, routine clinical imaging was
started on a Philips CVMR system (Philips Medical
Systems, Nederland, B.V.) equipped with Master
gradients (30 mT/m and a slew rate of 150 T/m/s),
Vectorcardiogram gating, and a Philips five element
synergy cardiac coil.
Back-to-back high resolution Black Blood short axis
(HR BB-SA) images with either RNAV or breathhold
(BH) respiratory compensation were then obtained. The
sequence was cardiac gated dual inversion T1 weighted
Turbo Spin Echo (TSE) sequence with a TR of 1 cardiac
cycle, TE of 4.6 ms and an acquisition matrix of
205 £ 256 along the phase and frequency encode
directions respectively, with a turbo factor of 32, and
a field of view (FOV) of 20 cm. As many slices (5 mm
thickness and no gap) as needed to cover the heart with
were done. The breathhold was typically 5–9 sec, and the
navigator used 7 mm navigator window for both gating
Poster Abstracts: Clinical MRI—Non-ischemic Acquired Heart Disease 129
©2002 Marcel Dekker, Inc. All rights reserved. This material may not be used or reproduced in any form without the express written permission of Marcel Dekker, Inc.
MARCEL DEKKER, INC. • 270 MADISON AVENUE • NEW YORK, NY 10016

and tracking. In some patients, to minimize patient
discomfort, the breathhold images were only obtained for
the center of the heart.
The images were read independently in a blinded
fashion by two physicians. The results were compared
with a paired t test.
Results: Representative images from the two
protocols are shown in Fig. 1.
Figure 2 shows that the images were judged
essentially equal, (two tailed t test p value of 0.6).
The average navigator efficiency was 53%. For
breathholding, the average patient required a rest
between breathholding at least as long as the breathhold,
resulting in a maximal efficiency of 50%, and frequently
much lower, especially for longer breathholds.
Conclusions: Navigator respiratory compensation
can beeasily integrated into routineclinicalmorphological
imaging, even when high resolution imaging (such as for
ARVD) is desired. The image quality is comparable to
breathholding. However, it is not limited by patient
compliance, and image resolution can be increased.
Furthermore, there is no increase in the imaging time
required.
278. Can Breathhold Flow Quantification Be Usedto Quantify Aortic Stenosis?
Michael Panoutsopoulos, MSc,1 John P. Ridgway, PhD,2
Scott A. Reid, PhD,1 Mohan U. Sivananthan, MD,2 Peter
G. Walker, PhD.1 1School of Mechanical Engineering,
University of Leeds, Leeds, United Kingdom, 2Cardiac
MR, Leeds General Infirmary, Leeds, United Kingdom.
Introduction: With the introduction of breath hold
velocity quantification there is the possibility to perform
fast quantification of cardiac function using relatively
short echo times. As short echo times are known to be
beneficial to the reduction of artefacts and errors in
disturbed or turbulent flow, it would seem that breath
hold imaging would be an potential candidate for the
quantification of valvular stenosis. In particular, aortic
stenosis, which is one of the commonest cardiac
conditions after coronary disease, is difficult to quantify
using current MRI techniques.
Purpose: The purpose of this study, therefore, was to
assess the potential for short echo time breath hold
imaging in quantifying aortic stenosis.
Methods: All measurements were performed in
vitro using a steady flow phantom of aortic stenosis.
A water glycerine solution was pumped through a
straight Perspex aorta using a steady flow pump. The
axi-symmetric aorta, incorporated a sinus section,
and allowed the insertion of two axi-symmetric
Figure 1. High resolution black blood images a) Breathhold b) Navigator.
Figure 2. The difference between BH and NAV (positive
means NAV was judged better) for the nine patients for the two
reviewers.
Poster Abstracts: Clinical MRI—Non-ischemic Acquired Heart Disease130
©2002 Marcel Dekker, Inc. All rights reserved. This material may not be used or reproduced in any form without the express written permission of Marcel Dekker, Inc.
MARCEL DEKKER, INC. • 270 MADISON AVENUE • NEW YORK, NY 10016

idealised plastic stenoses of diameters 6 and 10 mm.
Flow rates of 20, 15 and 5 l/min were driven through
the 10 mm stenosis and those of 6.7, 5 and 3.3 l/min
through the 6 mm stenosis. The fluid was doped with
gadolinium in order to simulate the T1 and T2 values
of blood. Bottles of static fluid were placed around the
model.
For the imaging, a Philips 1.5 T ACS-NT MR
scanner (Release 6 software) was used utilising their
Synergy Cardiac Coil. Using scout images as guides, 7
transverse breath hold flow encoding slices were placed
covering the aortic flow at 250, 0, 20, 40, 60, 80 and
130 mm from the stenosis (positive is downstream).
Through plane velocity was encoded. MR parameters
were: TR ¼ 4:9 ms; TE ¼ 2:8 ms; FOV ¼ 300 mm;Matrix ¼ 128 £ 128 (reconstructed 256), slice
thickness ¼ 6 mm. The imaging, although of steady
flow, was cardiac triggered such that 13 cardiac phases
were collected. A long axis image, centred on the lumen,
was also obtained to visualize the turbulent jet.
The date was transferred to a PC and analysed using
in-house software VENC ([email protected]). The
velocity images were background corrected by auto-
matically fitting a parabolic surface to the signal from the
static fluid bottles surrounding the phantom. A circle of
know size, corresponding to the size of the aortic flow
phantom lumen, was then placed around the lumen and
the flow rate quantified by integration of the velocity of
the lumen area. The mean and standard deviation of the
flow rate was calculated over the simulated heart cycle.
This flow rate was compared to the actual flow rate set
during the MR acquisition.
The MR estimation of pressure drop, P, was
calculated by using the formula, p ¼ 4*U*U. U, the
velocity was obtained by averaging the four central
(relative to the aortic lumen) pixels in the velocity
encoded images.
The same flow system was also used to quantify the
pressure loss due to the stenoses. Pressure taps, flush with
the side of the aortic wall, were drilled at a number of
positions downstream from the stenosis. One tap was
also located upstream. The pressure at each tap was
measured by connecting the pressure tap to a manometer.
The pressure drop across the stenosis was calculated by
subtracting the upstream pressure from the downstream
values.
Results: The long axis MR image showed that a
turbulent jet, as indicated by regions of signal reduction,
was present downstream of the orifices and that the MR
slices covered this region. However, there was a central
region protruding downstream from the orifice with little
or no signal reduction. From knowledge of turbulent jet
flows, this region can be assumed to be the laminar core
of the jet. This is a high velocity laminar region where the
fluid velocity is constant.
For flow rate, it was found that there was a good
agreement between the MR breath hold measurements
and the reference values. At the highest flow rate,
20 l/min, the maximum error was around 11%. This is
surprising given the probable level of turbulence within
the main body of the jet. The effects of turbulence could
be seen, however, when the standard deviations of the
measurements were examined. These indicated a
significant increase in measurement variation within
the body of the jet compared to the upstream and far
downstream measurements. Consequently, in pulsatile
flow, a cardiac output measured in disturbed flow using
breath hold imaging may be a reliable measurement but
the individual phases may be unreliable.
A good correlation between the direct measurement
with the MR calculated stenotic pressure drop was found
ðr ¼ 0:99Þ: However, the MR pressure was on average
1.5 times that of the direct measurement. This indicates a
consistent error in the pressure comparison rather than a
random, noise driven one. At present, it is unknown
whether this consistent error is due to failing in the MR
measurement, the direct pressure measurement, the
assumptions in the p ¼ 4*U*U formula or a combi-
nation of all three. The authors plan to perform LDV on
the model so that the MR central velocity values can be
compared with an independent gold standard velocity
quantification. This should clarify this error.
Conclusions: Breath hold MR can apparently
accurately quantify mean flow in highly turbulent
regions. However, individual phase measurements may
be less accurate. The standard stenosis quantification
formula, p ¼ 4*U*U; does not predict the actual
pressure drop in our experimental apparatus. The
strength of the correlation between MR and direct
pressure measurements, however, would indicate that
this problem may be tractable provided the underlying
hemodynamics are better understood.
279. Pericardial Effusion or Epicardial Fat?
Improved Discrimination with Phase-SensitiveInversion Recovery MRI
Christopher K. Dyke, MD, Peter Kellman, PhD, Anthony
H. Aletras, PhD, Andrew E. Arai, MD. NHLBI/National
Institutes of Health, Bethesda, MD, USA.
Introduction: Pericardial effusion is a common clinical
finding with potentially important implications but is
Poster Abstracts: Clinical MRI—Non-ischemic Acquired Heart Disease 131
©2002 Marcel Dekker, Inc. All rights reserved. This material may not be used or reproduced in any form without the express written permission of Marcel Dekker, Inc.
MARCEL DEKKER, INC. • 270 MADISON AVENUE • NEW YORK, NY 10016

easily missed using SSFP (FISP) cine and gadolinium
enhanced magnitude-reconstructed inversion recovery
(Mag-IR) images due to poor contrast vs. epicardial fat
despite markedly different T1. Phase-sensitive inversion
recovery (PS-IR) has been validated for infarct imaging
and has a number of benefits.
Purpose: We proposed that PS-IR would better
differentiate pericardial effusion from epicardial fat
because PS-IR maintains the polarity of short and long
T1 tissues.
Methods: From 392 consecutive patient reports,
53 patients had a pericardial effusion (trace ¼ 28,
mild ¼ 14, moderate ¼ 8, severe ¼ 3). The signal
intensity of epicardial fat and pericardial effusion
was measured in 14 patients imaged with all methods
(SSFP, Mag-IR, PS-IR) who had more than a trace
effusion.
Results: The signal intensity of fat and effusion were
similar using SSFP ðp ¼ NSÞ or Mag-IR ðp ¼ NSÞ:Using PS-IR, the fat is bright (positive) but the effusion is
dark (negative) ðp , 0:001Þ:
Figure 2 demonstrates the signal intensity
difference between Mag-IR (top row) and PS-IR
(bottom row) by varying effusion size. On the Mag-IR
images, blood, epicardial fat, and pericardial effusion
appear bright. The PS-IR images show a dark
pericardial effusion, bright epicardial fat, and dark
normal myocardium.
Conclusions: While the most commonly used
cardiac MRI parameters have poor contrast between
pericardial effusion and epicardial fat, PS-IR reconstruc-
tion provides high quality delayed hyperenhancement
images and detects effusion without lengthening the
typical exam.
280. The Benefit of Aortic Valve Replacement for
Aortic Stenosis Is Modulated by CAD
Robert W. W. Biederman,1 Mark Doyle,1 June
Yamrozik,1 Jane Ripple,1 Diane A. Vido,1 Sunil
Mankad,1 James Magovern,1 Nathaniel Reichek.2
1Allegheny General Hospital, Pittsburgh, PA, USA, 2St.
Francis Hospital, Roslyn, NY, USA.
Introduction: In patients with severe aortic stenosis (AS),
considerable effort has been expended to understand the
mechanism of improvement following aortic valve
replacement (AVR). While results following AVR have
been very encouraging, the actual effects relative to the
presence or absence of CAD (CAD þ , CAD 2 ) have
not been evaluated, yet are important as the population
eligible for benefit increases as surgical and medical
understanding develops.
Purpose: We hypothesized that the presence of CAD
will mitigate the otherwise advantageous effects of
reverse remodeling following AVR for AS.
Methods: Eight patients (69–87 yr, 4 female) with
severe AS underwent MRI pre AVR and 6.2 ^ 1.1 mo
post AVR. LV mass indexed to BSA (LVMI) and volume
(LVMI/vol) and EF were measured along with 1D
transmural circumferential intramyocardial strain (%S).
Results: EF was normal and similar in the two
groups at baseline and remained unchanged post AVR
(68 ^ 12 vs 67 ^ 11%, p ¼ NS). However, LVMI
(g/m2) and LVMI/vol (g/m2/ml) were decreased after
AVR, indicating that reverse remodeling occurred
(95 ^ 20 vs 78 ^ 19 g/m2, p , 0:001 and 0.98 ^ 0.30
vs 0.73 ^ 0.20 g/m2/ml, p , 0:05; respectively). On
sub-set analysis, the fall in LVMI and LVMI/vol were
found only in the CAD 2 patients ðp , 0:05Þ: Mean
%S was higher for the entire group after AVR (23 ^ 9
to 25 ^ 5, p , 0:05). Notably, however, all
Figure 1.
Figure 2.
Poster Abstracts: Clinical MRI—Non-ischemic Acquired Heart Disease132
©2002 Marcel Dekker, Inc. All rights reserved. This material may not be used or reproduced in any form without the express written permission of Marcel Dekker, Inc.
MARCEL DEKKER, INC. • 270 MADISON AVENUE • NEW YORK, NY 10016

the significance was driven by the marked improve-
ment of %S in the CAD- group (24 ^ 9 to 28 ^ 5%
following surgery, p , 0:001).
Conclusions: Following AVR for AS, there is
reverse remodeling, which parallels improvement in
intramyocardial function but is not reflected in the
calculation of EF. However, despite a perceived
population improvement, these benefits are confined to
those without CAD. This points towards an altered
manner in which the typically favorable post AVR
remodeling patterns evolve.
281. Magnetic Resonance Features of Cardiac
Carcinoid
Anna S. John, MD, James C. C. Moon, MD, Raad H.
Mohiaddin, MD. CMR Unit, Royal Brompton Hospital,
London, United Kingdom.
Introduction: Carcinoid is a rare tumour (incidence 3.2
per million per year) which produces vasoactive and
bronchoconstrictive molecules that can affect the heart if
not metabolised first pass by the liver.
Purpose: To characterise the features of cardiac
carcinoid by CMR.
Methods: Three patients with cardiac carcinoid
underwent CMR on a 1.5T Siemens Sonata scanner.
TrueFISP cines of left and right ventricle (LV and RV)
and in and outflow tracts were acquired as well as
transaxial and sagittal HASTE images to assess cardiac
anatomy and the presence of liver metastases. Late
enhancement imaging after gadolinium-DTPA
(0.1 mmol/kg) was performed using a standard flash
inversion recovery sequence. LV and RV volumes,
ejection fraction (EF), longitudinal function and right
atrial size were measured in 3 patients and 10 healthy
controls.
Results: The RV was dilated in all cases, mean EDV
281 ml (range 210–300 ml), ESV 150 ml (101–178 ml).
RV long axis function was abnormal in all three (mean
percentage change 8.5% versus 24.6%, p , 0:001).
LV long axis function was unaffected. Mean RV EF was
reduced at 46%, LV EF was well within the normal range
(mean 62%). Right atrial diameters were enlarged, mean
diameter 74 £ 63 mm. The tricuspid valve was severely
affected in all cases with thickening and destruction of
the leaflets and regurgitation fractions ranging from 45 to
Figure 1. Tricuspid regurgitation and dilated RV.
Figure 2. Pulmonary stenosis.
Figure 3. Ventricular model in diastole and systole.
Poster Abstracts: Clinical MRI—Non-ischemic Acquired Heart Disease 133
©2002 Marcel Dekker, Inc. All rights reserved. This material may not be used or reproduced in any form without the express written permission of Marcel Dekker, Inc.
MARCEL DEKKER, INC. • 270 MADISON AVENUE • NEW YORK, NY 10016

62% of RV stroke volumes. The pulmonary valve was
affected in all three, two had mixed pulmonary valve
disease and one had pulmonary regurgitation only along
with signs of pulmonary hypertension. In one patient,
right sided endomyocardial fibrosis was detected using
inversion recovery late gadolinium imaging. All three
showed metastatic infiltration of the liver.
Conclusions: Cardiac carcinoid causes lone right
sided disease. CMR is well suited to visualising the
pathological appearances which were similar in all cases.
282. A Breath Hold Quantitative Flow Technique
for Analyzing Aortic Valve Stenosis: Comparison
Between Standard and Segmented K-Space
Approaches
Shelton D. Caruthers, PhD,1 Shiow J. Lin, MSEE,2 Mary
P. Watkins, RT,2 Todd A. Williams, RT,2 Katherine A.
Lehr, BSN,2 Samuel A. Wickline, MD.2 1Cardiovascular
MR Labs, Washington Univ. and Philips Medical
Systems, St. Louis, MO, USA, 2Cardiovascular MR Labs,
Washington University, St. Louis, MO, USA.
Introduction: The analysis of heart valves can be easily,
quickly, and accurately performed using Doppler
ultrasound. Specifically, the velocity–time integral
(VTI) approach is robust and widely used clinically.
Recently, we have shown that velocity-encoded MRI
using this same VTI approach is equally robust (1).
However, the phase contrast MR technique employed in
this analysis was based on an established clinical
implementation requiring many minutes of scan time.
More current approaches, based on segmented k-space
filling, could enable quantitative flow MR imaging
within a single breath hold. (2)
Purpose: The purpose of this study was to
implement a segmented k-space approach of phase
contrast imaging such that all scans required for
quantitative flow analysis of the aortic valve could be
performed each within a single breath hold. Using the
VTI approach for estimating valve size, measurements
made with this breath hold technique are compared to the
same measurements made with the previously-estab-
lished non-breath hold technique.
Method: Four patients with aortic valve stenosis
were imaged using a 1.5T whole body MRI (Intera CV
R8.1.3, Philips Medical Systems, Best, The Nether-
lands). In addition to standard cine views for qualitative
assessment of function, multiple velocity-encoded cine
MR images were acquired using both a non-breath hold
and a breath hold technique. The non-breath hold
technique (TE=TR=a ¼ 2:9=5:9=30; FoV ¼ 350 mm;matrix ¼ 128 £ 256, thk ¼ 9 mm; 30 frames/heartbeat)
takes about 3.5 minutes (depending on heart rate) for
acquiring one imaging slice. The breath hold
technique (TE=TR=a ¼ 2:9=5:9=10; FoV ¼ 300 mm,
matrix ¼ 128 £ 256, with halfscan) is a multi-shot
turbo field echo (8 k-lines per segment) typically lasting
20–25 sec with 15–20 frames/heartbeat, depending on
heart rate. Both techniques were retrospectively triggered
to the vector electrocardiogram. The maximum encoding
velocity parameter was chosen such that no flow aliasing
occurred in the systolic flow jet (typically about 4 m/s in
the aorta, 3 m/s in the LVOT). For each technique, two
imaging planes parallel to the aortic valve plane were
interrogated—one placed in the ascending aorta 1.5 cm
distal to the aortic valve plane, and one in the LVOT at
1.5 cm proximal to the valve plane. Quantitative flow
data was analyzed offline (EasyVision R5.1, Philips
Medical Systems). To calculate VTI, the area under the
curve of the peak flow velocity versus time was summed
over systole. From the two imaging planes, Aortic VTI
and LVOT VTI were calculated and compared between
methods. Functional aortic valve dimension was
calculated (using the continuity equation) as the ratio
of VTI’s multiplied by LVOT cross sectional area. Using
the Pearson correlation test, similarity of values from the
non-breath hold and breath hold techniques were tested
for each of these parameters.
Results: The VTI measurements and functional
valve area estimates between breath hold and non-breath
hold techniques correlated well. Correlation coefficients
between the two methods for VTI’s were r ¼ 0:97 for the
LVOT VTI and r ¼ 0:99 for aortic VTI. For pooled
Figure 1. The velocity–time integrals calculated from
velocity encoded MR images correlate well between breath
hold and non-breath hold techniques.
Poster Abstracts: Clinical MRI—Non-ischemic Acquired Heart Disease134
©2002 Marcel Dekker, Inc. All rights reserved. This material may not be used or reproduced in any form without the express written permission of Marcel Dekker, Inc.
MARCEL DEKKER, INC. • 270 MADISON AVENUE • NEW YORK, NY 10016
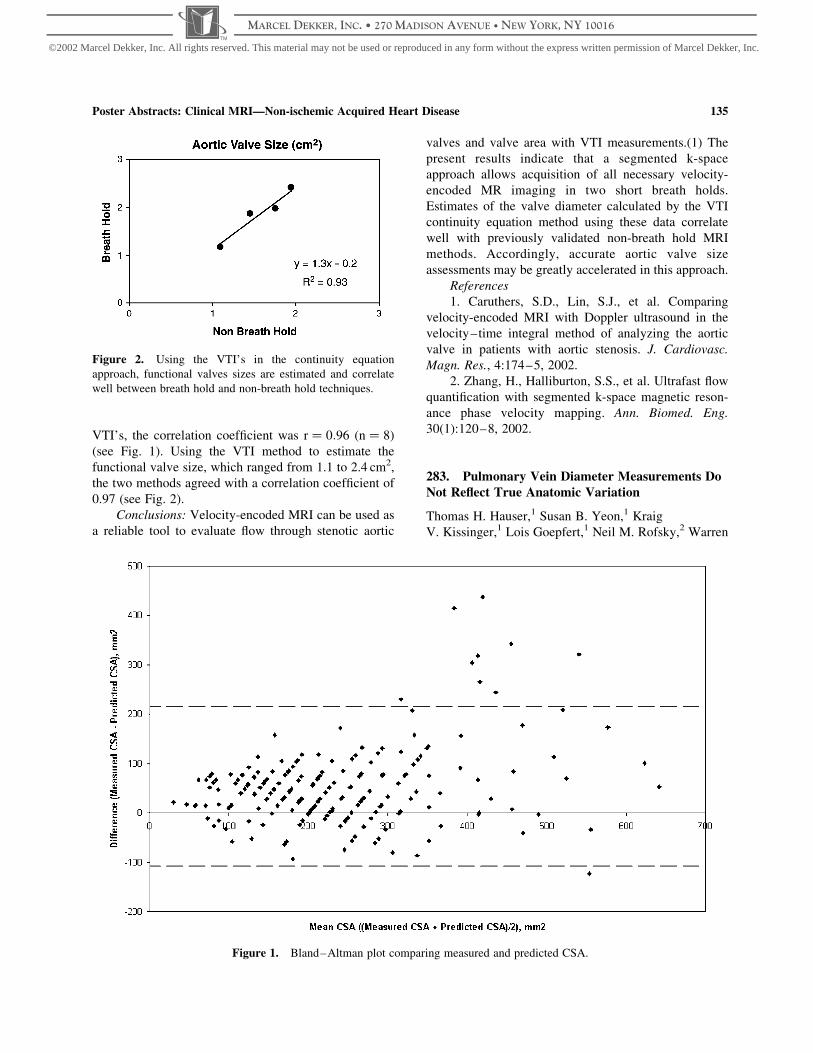
VTI’s, the correlation coefficient was r ¼ 0:96 ðn ¼ 8Þ
(see Fig. 1). Using the VTI method to estimate the
functional valve size, which ranged from 1.1 to 2.4 cm2,
the two methods agreed with a correlation coefficient of
0.97 (see Fig. 2).
Conclusions: Velocity-encoded MRI can be used as
a reliable tool to evaluate flow through stenotic aortic
valves and valve area with VTI measurements.(1) The
present results indicate that a segmented k-space
approach allows acquisition of all necessary velocity-
encoded MR imaging in two short breath holds.
Estimates of the valve diameter calculated by the VTI
continuity equation method using these data correlate
well with previously validated non-breath hold MRI
methods. Accordingly, accurate aortic valve size
assessments may be greatly accelerated in this approach.
References
1. Caruthers, S.D., Lin, S.J., et al. Comparing
velocity-encoded MRI with Doppler ultrasound in the
velocity–time integral method of analyzing the aortic
valve in patients with aortic stenosis. J. Cardiovasc.
Magn. Res., 4:174–5, 2002.
2. Zhang, H., Halliburton, S.S., et al. Ultrafast flow
quantification with segmented k-space magnetic reson-
ance phase velocity mapping. Ann. Biomed. Eng.
30(1):120–8, 2002.
283. Pulmonary Vein Diameter Measurements Do
Not Reflect True Anatomic Variation
Thomas H. Hauser,1 Susan B. Yeon,1 Kraig
V. Kissinger,1 Lois Goepfert,1 Neil M. Rofsky,2 Warren
Figure 2. Using the VTI’s in the continuity equation
approach, functional valves sizes are estimated and correlate
well between breath hold and non-breath hold techniques.
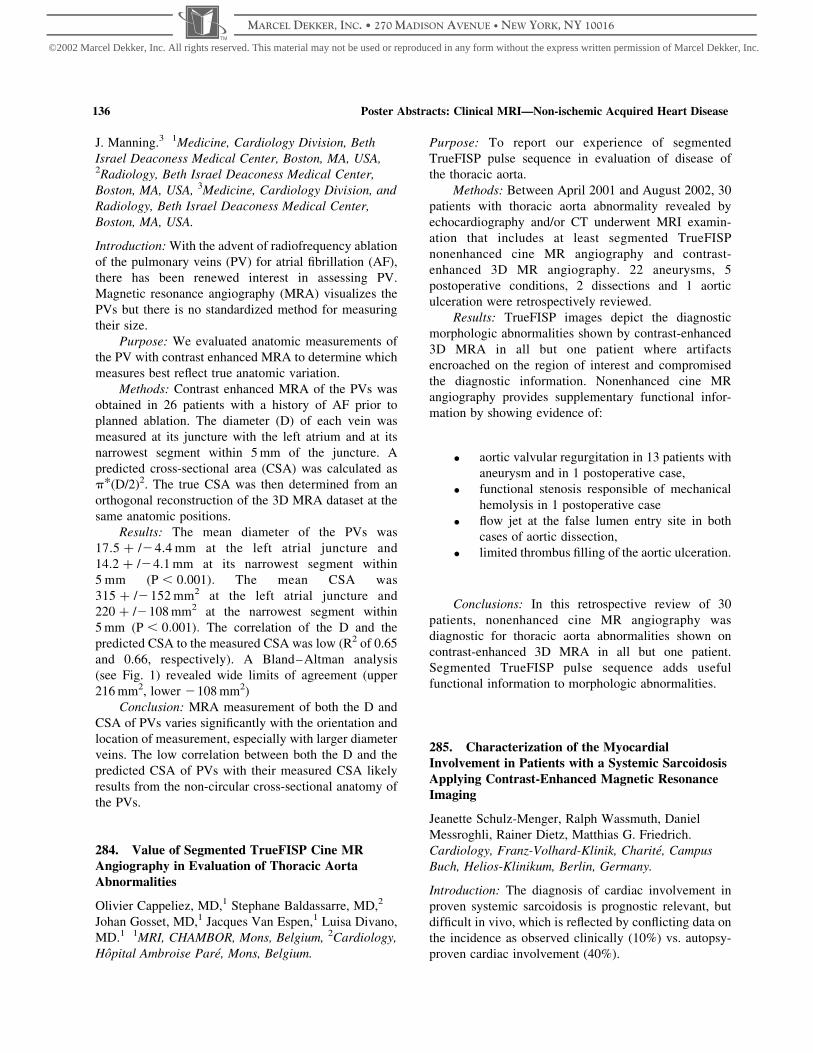
Figure 1. Bland–Altman plot comparing measured and predicted CSA.
Poster Abstracts: Clinical MRI—Non-ischemic Acquired Heart Disease 135
©2002 Marcel Dekker, Inc. All rights reserved. This material may not be used or reproduced in any form without the express written permission of Marcel Dekker, Inc.
MARCEL DEKKER, INC. • 270 MADISON AVENUE • NEW YORK, NY 10016
J. Manning.3 1Medicine, Cardiology Division, Beth
Israel Deaconess Medical Center, Boston, MA, USA,2Radiology, Beth Israel Deaconess Medical Center,
Boston, MA, USA, 3Medicine, Cardiology Division, and
Radiology, Beth Israel Deaconess Medical Center,
Boston, MA, USA.
Introduction: With the advent of radiofrequency ablation
of the pulmonary veins (PV) for atrial fibrillation (AF),
there has been renewed interest in assessing PV.
Magnetic resonance angiography (MRA) visualizes the
PVs but there is no standardized method for measuring
their size.
Purpose: We evaluated anatomic measurements of
the PV with contrast enhanced MRA to determine which
measures best reflect true anatomic variation.
Methods: Contrast enhanced MRA of the PVs was
obtained in 26 patients with a history of AF prior to
planned ablation. The diameter (D) of each vein was
measured at its juncture with the left atrium and at its
narrowest segment within 5 mm of the juncture. A
predicted cross-sectional area (CSA) was calculated as
p*(D/2)2. The true CSA was then determined from an
orthogonal reconstruction of the 3D MRA dataset at the
same anatomic positions.
Results: The mean diameter of the PVs was
17.5 þ /24.4 mm at the left atrial juncture and
14.2 þ /24.1 mm at its narrowest segment within
5 mm ðP , 0:001Þ: The mean CSA was
315 þ /2152 mm2 at the left atrial juncture and
220 þ /2108 mm2 at the narrowest segment within
5 mm ðP , 0:001Þ: The correlation of the D and the
predicted CSA to the measured CSA was low (R2 of 0.65
and 0.66, respectively). A Bland–Altman analysis
(see Fig. 1) revealed wide limits of agreement (upper
216 mm2, lower 2108 mm2)
Conclusion: MRA measurement of both the D and
CSA of PVs varies significantly with the orientation and
location of measurement, especially with larger diameter
veins. The low correlation between both the D and the
predicted CSA of PVs with their measured CSA likely
results from the non-circular cross-sectional anatomy of
the PVs.
284. Value of Segmented TrueFISP Cine MRAngiography in Evaluation of Thoracic Aorta
Abnormalities
Olivier Cappeliez, MD,1 Stephane Baldassarre, MD,2
Johan Gosset, MD,1 Jacques Van Espen,1 Luisa Divano,
MD.1 1MRI, CHAMBOR, Mons, Belgium, 2Cardiology,
Hopital Ambroise Pare, Mons, Belgium.
Purpose: To report our experience of segmented
TrueFISP pulse sequence in evaluation of disease of
the thoracic aorta.
Methods: Between April 2001 and August 2002, 30
patients with thoracic aorta abnormality revealed by
echocardiography and/or CT underwent MRI examin-
ation that includes at least segmented TrueFISP
nonenhanced cine MR angiography and contrast-
enhanced 3D MR angiography. 22 aneurysms, 5
postoperative conditions, 2 dissections and 1 aortic
ulceration were retrospectively reviewed.
Results: TrueFISP images depict the diagnostic
morphologic abnormalities shown by contrast-enhanced
3D MRA in all but one patient where artifacts
encroached on the region of interest and compromised
the diagnostic information. Nonenhanced cine MR
angiography provides supplementary functional infor-
mation by showing evidence of:
. aortic valvular regurgitation in 13 patients with
aneurysm and in 1 postoperative case,
. functional stenosis responsible of mechanical
hemolysis in 1 postoperative case
. flow jet at the false lumen entry site in both
cases of aortic dissection,
. limited thrombus filling of the aortic ulceration.
Conclusions: In this retrospective review of 30
patients, nonenhanced cine MR angiography was
diagnostic for thoracic aorta abnormalities shown on
contrast-enhanced 3D MRA in all but one patient.
Segmented TrueFISP pulse sequence adds useful
functional information to morphologic abnormalities.
285. Characterization of the Myocardial
Involvement in Patients with a Systemic Sarcoidosis
Applying Contrast-Enhanced Magnetic ResonanceImaging
Jeanette Schulz-Menger, Ralph Wassmuth, Daniel
Messroghli, Rainer Dietz, Matthias G. Friedrich.
Cardiology, Franz-Volhard-Klinik, Charite, Campus
Buch, Helios-Klinikum, Berlin, Germany.
Introduction: The diagnosis of cardiac involvement in
proven systemic sarcoidosis is prognostic relevant, but
difficult in vivo, which is reflected by conflicting data on
the incidence as observed clinically (10%) vs. autopsy-
proven cardiac involvement (40%).
Poster Abstracts: Clinical MRI—Non-ischemic Acquired Heart Disease136
©2002 Marcel Dekker, Inc. All rights reserved. This material may not be used or reproduced in any form without the express written permission of Marcel Dekker, Inc.
MARCEL DEKKER, INC. • 270 MADISON AVENUE • NEW YORK, NY 10016
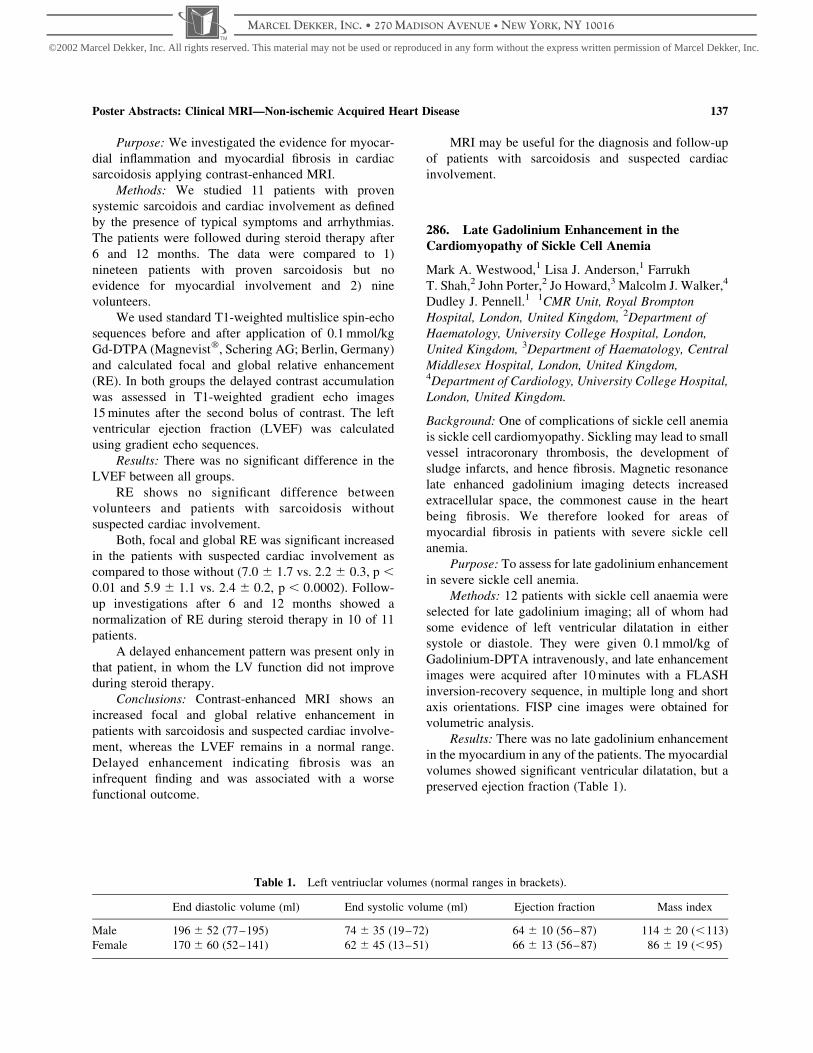
Purpose: We investigated the evidence for myocar-
dial inflammation and myocardial fibrosis in cardiac
sarcoidosis applying contrast-enhanced MRI.
Methods: We studied 11 patients with proven
systemic sarcoidois and cardiac involvement as defined
by the presence of typical symptoms and arrhythmias.
The patients were followed during steroid therapy after
6 and 12 months. The data were compared to 1)
nineteen patients with proven sarcoidosis but no
evidence for myocardial involvement and 2) nine
volunteers.
We used standard T1-weighted multislice spin-echo
sequences before and after application of 0.1 mmol/kg
Gd-DTPA (Magnevistw, Schering AG; Berlin, Germany)
and calculated focal and global relative enhancement
(RE). In both groups the delayed contrast accumulation
was assessed in T1-weighted gradient echo images
15 minutes after the second bolus of contrast. The left
ventricular ejection fraction (LVEF) was calculated
using gradient echo sequences.
Results: There was no significant difference in the
LVEF between all groups.
RE shows no significant difference between
volunteers and patients with sarcoidosis without
suspected cardiac involvement.
Both, focal and global RE was significant increased
in the patients with suspected cardiac involvement as
compared to those without (7.0 ^ 1.7 vs. 2.2 ^ 0.3, p ,
0:01 and 5.9 ^ 1.1 vs. 2.4 ^ 0.2, p , 0:0002). Follow-
up investigations after 6 and 12 months showed a
normalization of RE during steroid therapy in 10 of 11
patients.
A delayed enhancement pattern was present only in
that patient, in whom the LV function did not improve
during steroid therapy.
Conclusions: Contrast-enhanced MRI shows an
increased focal and global relative enhancement in
patients with sarcoidosis and suspected cardiac involve-
ment, whereas the LVEF remains in a normal range.
Delayed enhancement indicating fibrosis was an
infrequent finding and was associated with a worse
functional outcome.
MRI may be useful for the diagnosis and follow-up
of patients with sarcoidosis and suspected cardiac
involvement.
286. Late Gadolinium Enhancement in the
Cardiomyopathy of Sickle Cell Anemia
Mark A. Westwood,1 Lisa J. Anderson,1 Farrukh
T. Shah,2 John Porter,2 Jo Howard,3 Malcolm J. Walker,4
Dudley J. Pennell.1 1CMR Unit, Royal Brompton
Hospital, London, United Kingdom, 2Department of
Haematology, University College Hospital, London,
United Kingdom, 3Department of Haematology, Central
Middlesex Hospital, London, United Kingdom,4Department of Cardiology, University College Hospital,
London, United Kingdom.
Background: One of complications of sickle cell anemia
is sickle cell cardiomyopathy. Sickling may lead to small
vessel intracoronary thrombosis, the development of
sludge infarcts, and hence fibrosis. Magnetic resonance
late enhanced gadolinium imaging detects increased
extracellular space, the commonest cause in the heart
being fibrosis. We therefore looked for areas of
myocardial fibrosis in patients with severe sickle cell
anemia.
Purpose: To assess for late gadolinium enhancement
in severe sickle cell anemia.
Methods: 12 patients with sickle cell anaemia were
selected for late gadolinium imaging; all of whom had
some evidence of left ventricular dilatation in either
systole or diastole. They were given 0.1 mmol/kg of
Gadolinium-DPTA intravenously, and late enhancement
images were acquired after 10 minutes with a FLASH
inversion-recovery sequence, in multiple long and short
axis orientations. FISP cine images were obtained for
volumetric analysis.
Results: There was no late gadolinium enhancement
in the myocardium in any of the patients. The myocardial
volumes showed significant ventricular dilatation, but a
preserved ejection fraction (Table 1).
Table 1. Left ventriuclar volumes (normal ranges in brackets).
End diastolic volume (ml) End systolic volume (ml) Ejection fraction Mass index
Male 196 ^ 52 (77–195) 74 ^ 35 (19–72) 64 ^ 10 (56–87) 114 ^ 20 (,113)
Female 170 ^ 60 (52–141) 62 ^ 45 (13–51) 66 ^ 13 (56–87) 86 ^ 19 (,95)
Poster Abstracts: Clinical MRI—Non-ischemic Acquired Heart Disease 137
©2002 Marcel Dekker, Inc. All rights reserved. This material may not be used or reproduced in any form without the express written permission of Marcel Dekker, Inc.
MARCEL DEKKER, INC. • 270 MADISON AVENUE • NEW YORK, NY 10016
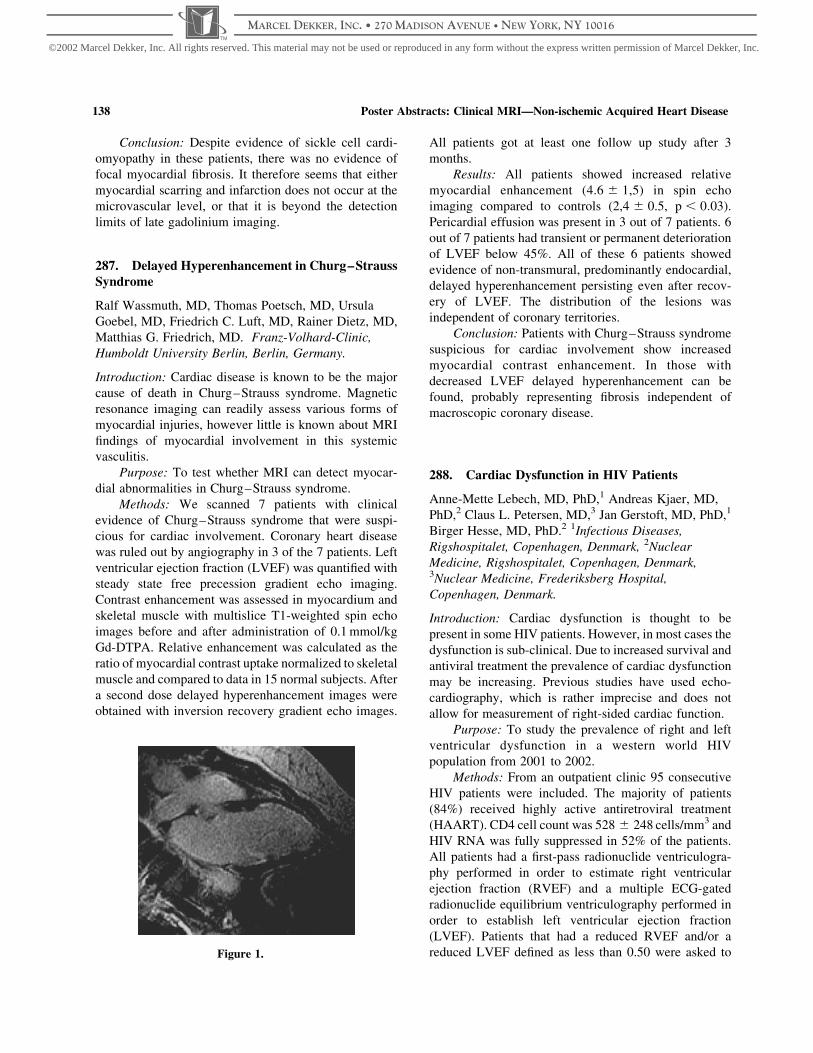
Conclusion: Despite evidence of sickle cell cardi-
omyopathy in these patients, there was no evidence of
focal myocardial fibrosis. It therefore seems that either
myocardial scarring and infarction does not occur at the
microvascular level, or that it is beyond the detection
limits of late gadolinium imaging.
287. Delayed Hyperenhancement in Churg–Strauss
Syndrome
Ralf Wassmuth, MD, Thomas Poetsch, MD, Ursula
Goebel, MD, Friedrich C. Luft, MD, Rainer Dietz, MD,
Matthias G. Friedrich, MD. Franz-Volhard-Clinic,
Humboldt University Berlin, Berlin, Germany.
Introduction: Cardiac disease is known to be the major
cause of death in Churg–Strauss syndrome. Magnetic
resonance imaging can readily assess various forms of
myocardial injuries, however little is known about MRI
findings of myocardial involvement in this systemic
vasculitis.
Purpose: To test whether MRI can detect myocar-
dial abnormalities in Churg–Strauss syndrome.
Methods: We scanned 7 patients with clinical
evidence of Churg–Strauss syndrome that were suspi-
cious for cardiac involvement. Coronary heart disease
was ruled out by angiography in 3 of the 7 patients. Left
ventricular ejection fraction (LVEF) was quantified with
steady state free precession gradient echo imaging.
Contrast enhancement was assessed in myocardium and
skeletal muscle with multislice T1-weighted spin echo
images before and after administration of 0.1 mmol/kg
Gd-DTPA. Relative enhancement was calculated as the
ratio of myocardial contrast uptake normalized to skeletal
muscle and compared to data in 15 normal subjects. After
a second dose delayed hyperenhancement images were
obtained with inversion recovery gradient echo images.
All patients got at least one follow up study after 3
months.
Results: All patients showed increased relative
myocardial enhancement (4.6 ^ 1,5) in spin echo
imaging compared to controls (2,4 ^ 0.5, p , 0:03).
Pericardial effusion was present in 3 out of 7 patients. 6
out of 7 patients had transient or permanent deterioration
of LVEF below 45%. All of these 6 patients showed
evidence of non-transmural, predominantly endocardial,
delayed hyperenhancement persisting even after recov-
ery of LVEF. The distribution of the lesions was
independent of coronary territories.
Conclusion: Patients with Churg–Strauss syndrome
suspicious for cardiac involvement show increased
myocardial contrast enhancement. In those with
decreased LVEF delayed hyperenhancement can be
found, probably representing fibrosis independent of
macroscopic coronary disease.
288. Cardiac Dysfunction in HIV Patients
Anne-Mette Lebech, MD, PhD,1 Andreas Kjaer, MD,
PhD,2 Claus L. Petersen, MD,3 Jan Gerstoft, MD, PhD,1
Birger Hesse, MD, PhD.2 1Infectious Diseases,
Rigshospitalet, Copenhagen, Denmark, 2Nuclear
Medicine, Rigshospitalet, Copenhagen, Denmark,3Nuclear Medicine, Frederiksberg Hospital,
Copenhagen, Denmark.
Introduction: Cardiac dysfunction is thought to be
present in some HIV patients. However, in most cases the
dysfunction is sub-clinical. Due to increased survival and
antiviral treatment the prevalence of cardiac dysfunction
may be increasing. Previous studies have used echo-
cardiography, which is rather imprecise and does not
allow for measurement of right-sided cardiac function.
Purpose: To study the prevalence of right and left
ventricular dysfunction in a western world HIV
population from 2001 to 2002.
Methods: From an outpatient clinic 95 consecutive
HIV patients were included. The majority of patients
(84%) received highly active antiretroviral treatment
(HAART). CD4 cell count was 528 ^ 248 cells/mm3 and
HIV RNA was fully suppressed in 52% of the patients.
All patients had a first-pass radionuclide ventriculogra-
phy performed in order to estimate right ventricular
ejection fraction (RVEF) and a multiple ECG-gated
radionuclide equilibrium ventriculography performed in
order to establish left ventricular ejection fraction
(LVEF). Patients that had a reduced RVEF and/or a
reduced LVEF defined as less than 0.50 were asked toFigure 1.
Poster Abstracts: Clinical MRI—Non-ischemic Acquired Heart Disease138
©2002 Marcel Dekker, Inc. All rights reserved. This material may not be used or reproduced in any form without the express written permission of Marcel Dekker, Inc.
MARCEL DEKKER, INC. • 270 MADISON AVENUE • NEW YORK, NY 10016

have an additional MR study performed in order to
confirm RVEF and LVEF values.
Results: RVEF measured by isotope technique was
0.57 ^ 0.07 (range: 0.35–0.74) in the HIV patients.
Thirteen (14%) had a RVEF below the normal lower
limit of 0.50. Among HIV patients CD4 cell count was
481 ^ 203 (range: 75–680) and 534 ^ 253 (range:
100–1,300) in the group with reduced RVEF and normal
RVEF, respectively ðp . 0:05Þ: HIV RNA was fully
suppressed in 9 of 13 (69%) patients with reduced RVEF
and in 36 of 78 (46%) patients with normal RVEF ðp .
0:05Þ: LVEF measured by isotope technique was
0.60 ^ 0.07 (range: 0.47–0.79) in the HIV patients.
Three (3%) had a slightly reduced LVEF below the
normal lower limit of 0.50. Cardiac MR studies of the
patients with reduced RVEF and LVEF are ongoing and
will be presented.
Conclusions: In a HIV population where the
majority were on HAART a significant part of the
patients had a reduced RVEF. However, the reductions in
RVEF were only modest.
289. Visualization of Myocardial Edema by
Magnetic Resonance Imaging After Septal ArteryEmbolization in Patients with Hypertrophic
Obstructive Cardiomyopathy—Cause for Delayed
Improvement
Jeanette Schulz-Menger, Daniel Messroghli, Michael
Gross, Rainer Dietz, Matthias G. Friedrich. Cardiology,
Franz-Volhard-Klinik, Charite, Campus Buch, Helios-
Klinikum, Berlin, Germany.
Introduction: Septal artery embolization (SAE) is a
therapeutical option in patients with hypertrophic
obstructive cardiomyopathy (HOCM). It has been
shown, that the desired effect on the obstruction is not
completed within the first weeks. However, the
underlying cause for this delay in unknown.
Purpose: Magnetic resonance imaging (MRI)
visualizes both, the morphological and tissue changes
after this intervention.
Methods: We followed 18 patients 44 ^ 4 months
after SAE with a total of 21 interventions by gradient-
echo, T2-weighted (STIR) and contrast-enhanced gra-
dient echo MRI on a dedicated 1.5 T system. The patients
were investigated before intervention, and after days 1–
3; 7; 14; 28; 90, 180; 360 and then annually. Using
gradient echo sequences the left ventricular function and
the planimetry of the LVOT-area was quantified. The
infarct-related tissue changes were visualized by STIR
for the edema and contrast-enhanced T1-weighted
images (delayed enhancement) for the necrosis/fibrosis.
Results: All patients except one (pacemaker
implantation 3 y after SAE) were available for follow-
up. The LVOT area increased significantly (from 1.3 ^ 2
to 2.6 ^ 0.2 cm2, p , 0:0001) during the first three
months and remained constant thereafter. In parallel,
septal remodeling was completed in the study 3 months
after SAE. Whereas the infarct area showed the typical
pattern of delayed enhancement throughout the whole
observational period, the infarct-related myocardial
edema was detectable only during the first four weeks
(and thus during remodeling), but not in the subsequent
follow-up studies.
Conclusions: Appling Magnetic Resonance Imaging
the time course of the infarct-related edema after septal
artery embolization can be detected. The changes match
that of the increase of LVOT area and thus is likely to be
the causative mechanism of the known post-interven-
tional delay of septal remodeling.
290. CMR Findings in Rheumatic Valvular Disease:
Initial Experience in Mexico
Aloha Meave, M.D.,1 Erick Alexanderson, M.D.,1 Nilda
Espinola, M.D.2 1Magnetic Resonance Unit, National
Cardiac Institute, Mexico, D.F., Mexico,2Echocardiography Unit, National Cardiac Institute,
Mexico, D.F., Mexico.
Introduction: Magnetic Resonance is an accurate,
reproducible, noninvasive method for optimal
assessment of structural and functional parameters in
patients with valvular heart disease. Velocity encoded
MR imaging can be used to quantify regurgitant blood
flow. The severity of valvular stenosis can be determined
by evaluating the flow jet and calculating the
transvalvular pressure gradient and valve area. Rheu-
matic fever is the principal cause of valvular heart
disease in Mexico.
Purpose: We present our initial experience in
patients with rheumatic valvular heart disease comparing
the results with those obtained by echocardiography.
Methods: We studied ten consecutive patients with
established diagnosis of valvular rheumatic heart disease
in a Sonata 1.5T magnet of Siemens with cine gradient-
echo MR imaging. We analyzed and quantified the
valvular regurgitation detecting the area of signal void jet
and calculating the regurgitant fraction. The valvular
stenosis was evaluated analyzing the flow jet and the
transvalvular pressure gradient and valve area. All
Poster Abstracts: Clinical MRI—Non-ischemic Acquired Heart Disease 139
©2002 Marcel Dekker, Inc. All rights reserved. This material may not be used or reproduced in any form without the express written permission of Marcel Dekker, Inc.
MARCEL DEKKER, INC. • 270 MADISON AVENUE • NEW YORK, NY 10016

the patients had a previous transthoracic echocardio-
graphy study performed few days before the CMR scan.
Results: We found 3 cases of mitral stenosis, 3 with
mitral regurgitation, 2 with aortic stenosis and 2 with
aortic regurgitation. We obtained ventricular volumetric
measurements, anatomic evaluation of the four cardiac
chambers and characterization of valve leaflets with
CMR technics. The severity degree of valvular stenosis
and regurgitation determined by CMR was similar to that
obtained by echocardiography. Nevertheless the ana-
tomic characterization of the cardiac structures and the
effects of valvular dysfunction with CMR were superior
to echocardiography images.
Conclusions: The CMR offers a noninvasive and
accurate method for a complete evaluation of patients
with rheumatic valvular heart disease. The correlation is
similar with echocardiography but offering a better
assessment of structural parameters and a more
comprehensive evaluation of pathophysiologic changes
in this disease.
291. Effect of Oral Sildenafil on Cardiac Function
and Remodelling in Patients with Pulmonary Arterial
Hypertension
Sanjay K. Prasad,1 Ghada Mikhail, MD,2 Paula Rogers,2
Philip Kilner, PhD,1 Michael Gatzoulis, MD, PhD,
FRCP3. 1CMR Unit, Royal Brompton Hospital, London,
United Kingdom, 2Cardiology Unit, Royal Brompton
Hospital, London, United Kingdom, 3Adult Congenital
Heart Unit, Royal Brompton Hospital, London, United
Kingdom.
Introduction: Pulmonary arterial hypertension (PAH) is a
progressive disease with a high morbidity and mortality
and is associated with right ventricular (RV) dysfunction.
Several therapeutic options are available including
prostacyclin but are hampered by the mode of
administration or expense. Sildenafil promotes vasodila-
tation in the pulmonary circulation through selective
inhibition of phophodiesterase-type 5 and increased
nitric oxide production.
Purpose: Our aim was to determine if oral sildenafil
can improve RV function and remodelling as measured
by ejection fraction (RVEF), stroke volume, mass and
change in RV end diastolic (RVEDV) and RV end
systolic volumes (RVESV). We employed cardiovascu-
lar magnetic resonance (CMR), to measure these
changes.
Methods: Four patients with PAH have been studied
thus far (mean age 37 ^ 14 yrs; 1 male and 3 females).
Patients underwent initial right heart cardiac catheterisa-
tion with vasodilator testing using intravenous sildenafil
to ensure no adverse haemodynamic disturbance. They
were then commenced on oral sildenafil at 50 mg tds for
3 months. CMR was performed at baseline and after 3
months using a Siemens Sonata 1.5T scanner. All
measurements were made by a single blinded experi-
enced operator. In addition, patients underwent a 6
minute walk test.
Results: At 3 months, there was a significant
improvement in RV ejection fraction (29.8 ^ 18.8% to
39.8 ^ 20.4%; P ¼ 0:02). RVEDV and RVESV both
showed a non-significant trend towards reduction.
(RVEDV 218.3 ^ 82.0 mL to 211.8 ^ 93.2 mL, P ¼
0:68; RVESV 158.5 ^ 95.9 mL to 146.3 ^ 85.1 mL,
P ¼ 0:27). Left ventricular dimensions and function
were unchanged. There was an increase in the 6 min walk
test by a mean of 109 metres. Overall, sildenafil was well
tolerated by patients but had to be discontinued in 1
patient due to visual disturbance.
Conclusions: Oral sildenafil appears to have a
beneficial effect on RV function and remodelling in PAH
as determined by CMR. This improvement was
associated with increased exercise capacity. Sildenafil
may have a role as an adjunct to transplantation.
292. Right Heart Overload Is the Main Trigger of
Cardiac Natriuretic Peptides Elevation in Patients
with Cardiomyopathy: A Magnetic Resonance Study
AnnaMaria Sironi, Claudio Passino, Concetta Prontera,
Massimo Lombardi, Michele Emdin. CNR Institute of
Clinical Physiology, Pisa, Italy.
Introduction: Cardiac natriuretic peptides (BNP and
ANP), secreted by ventricular and atrial myocytes,
respectively, play a key role in volume homeostasis. The
plasma concentration of BNP and ANP is raised in heart
failure
Purpose: We assessed the hypothesis that the
relative contribute of left and right atrial and ventricular
overload in heart failure to ANP and BNP plasma levels
might be different.
Methods: 26 patients (23 males, age 58 ^ 2 yrs,
body surface area (BSA) 1.92 ^ 0.02 m2, mean ^SEM)
with idiopathic (15) or postischemic (11) cardiomyo-
pathy underwent cardiac magnetic resonance imaging
(MRI) and resting plasma assay of ANP and BNP (IRMA
assay, Schering). Left and right atrial and ventricular
volumes and function were assessed by MRI (1.5 T, Cvi,
GEMS, Milwaukee, USA). A FIESTA sequence was
Poster Abstracts: Clinical MRI—Non-ischemic Acquired Heart Disease140
©2002 Marcel Dekker, Inc. All rights reserved. This material may not be used or reproduced in any form without the express written permission of Marcel Dekker, Inc.
MARCEL DEKKER, INC. • 270 MADISON AVENUE • NEW YORK, NY 10016

adopted to obtain parallel short axis of the ventricles, and
3D reconstruction was obtained in post-processing.
Results: Left ventricular ejection fraction (LVEF)
was 23.7 ^ 1.6%, while right ventricular ejection
fraction was 29.5 ^ 1.9%. End diastolic volumes were
268 ^ 18 and 125 ^ 10 ml for the left and right
ventricle, respectively. BNP plasma values ranged from
54 to 783 with a mean value of 241 ^ 42 pg/ml, ANP
from 36 to 534, mean 134 ^ 28 pg/ml. BNP positively
correlated with either end-diastolic or end-systolic right
ventricular volume, (r ¼ 0:61; p ¼ 0:004 and r ¼ 0:74;p , 0:001; respectively), but not with left ventricular
volume. Moreover, a significant negative correlation was
observed between BNP and either LVEF and RVEF
(r ¼ 20:52; p ¼ 0:013 and r ¼ 20:57; p ¼ 0:005;respectively). Conversely, ANP showed a significant
correlation only with right atrium longitudinal diameter
(r ¼ 0:48; p ¼ 0:033). Left ventricular ejection fraction
(LVEF) was 23.7 ^ 1.6%, while right ventricular
ejection fraction was 29.5 ^ 1.9%. End diastolic
volumes were 268 ^ 18 and 125 ^ 10 ml for the left
and right ventricle, respectively. BNP plasma values
ranged from 54 to 783 with a mean value of
241 ^ 42 pg/ml, ANP from 36 to 534, mean
134 ^ 28 pg/ml. BNP positively correlated with either
end-diastolic or end-systolic right ventricular volume,
(r ¼ 0:61; p ¼ 0:004 and r ¼ 0:74; p , 0:001; respect-
ively), but not with left ventricular volume. Moreover, a
significant negative correlation was observed between
BNP and either LVEF and RVEF (r ¼ 20:52; p ¼ 0:013
and r ¼ 20:57; p ¼ 0:005; respectively). Conversely,
ANP showed a significant correlation only with right
atrium longitudinal diameter (r ¼ 0:48; p ¼ 0:033). Left
ventricular ejection fraction (LVEF) was 23.7 ^ 1.6%,
while right ventricular ejection fraction was
29.5 ^ 1.9%. End diastolic volumes were 268 ^ 18
and 125 ^ 10 ml for the left and right ventricle,
respectively. BNP plasma values ranged from 54 to
783 with a mean value of 241 ^ 42 pg/ml, ANP from 36
to 534, mean 134 ^ 28 pg/ml. BNP positively correlated
with either end-diastolic or end-systolic right ventricular
volume, (r ¼ 0:61; p ¼ 0:004 and r ¼ 0:74; p , 0:001;respectively), but not with left ventricular volume.
Moreover, a significant negative correlation was
observed between BNP and either LVEF and RVEF
(r ¼ 20:52; p ¼ 0:013 and r ¼ 20:57; p ¼ 0:005;respectively). Conversely, ANP showed a significant
correlation only with right atrium longitudinal diameter
(r ¼ 0:48; p ¼ 0:033).
Conclusions: Right heart overload appears the most
critical mechanism in plasma elevation of ANP and BNP.
The role of right ventricular dysfunction, associated with
volume overload, which is known to independently
worsen prognosis, could contribute, inducing compensa-
tory elevation of plasma BNP, to its established
prognostic power in heart failure.
293. Protocol Development for Assessment ofCoronary Arteries, Valves, and Myocardial Function
in Under Thirty Minutes
Mary P. Watkins, RT(MR),1 Todd A. Williams, RT, BS,
(MR),1 Katherine A. Lehr, RN, BSN,1 Samuel
A. Wickline, MD,1 Shelton D. Caruthers, PhD.2
1Cardiovascular MR Laboratories, Washington
University School of Medicine, St. Louis, MO, USA,2Cardiovascular MR Laboratories, Washington
University and Philips Medical Systems, St. Louis,
MO, USA.
Introduction: Clinical acceptance of cardiac MR (CMR)
depends not only on technical performance, but also on
issues of patient comfort, cooperation, safety and
throughput. To assume a role as an efficient screening
tool, the development and implementation of a “Quick
CMR Screening” examination is mandatory. If the
standard diagnostic information can be acquired within
thirty minutes, CMR might offer an alternative to
echocardiography for primary screening of basic
myocardial function and anatomy, mitral and aortic
stenosis and regurgitation, and coronary artery disease.
Purpose: The purpose of this study is to define and
evaluate a “Quick CMR Screening” protocol that offers a
non-invasive assessment of the coronary arteries, valves,
and myocardial function to serve as an efficient screening
exam.
Methods: To produce a “Quick CMR Screening”
examination of diagnostic quality, multiple imaging
procedures must be combined. Development of this
screening tool was conducted on eight patients (average
age of 57 years) imaged on a clinical 1.5T scanner
(Philips NT Intera Release 8.1.3, Best, The Netherlands)
with a five-element cardiac synergy coil. Queued scan
geometry was input from real-time interactive scan
planning procedures. The imaging sequences comprised
a steady-state gradient echo (bFFE) technique with
sensitivity encoding (SENSE). In the first procedure
shown (A), real-time interactive bFFE was used for
image surveys. Next, breath hold SENSE bFFE was used
to acquire the functional cine images (B). The valve
images then were obtained with breath hold, velocity-
encoded imaging using SENSE TFE (C). The coronaries
Poster Abstracts: Clinical MRI—Non-ischemic Acquired Heart Disease 141
©2002 Marcel Dekker, Inc. All rights reserved. This material may not be used or reproduced in any form without the express written permission of Marcel Dekker, Inc.
MARCEL DEKKER, INC. • 270 MADISON AVENUE • NEW YORK, NY 10016

were completed with a 3D SENSE bFFE sequence
employing a respiratory navigator (D). (Fig. 1)
Procedure A: To begin, an initial one minute
SENSE reference scan must be acquired for
subsequent reconstruction of all SENSE cine images.
The study is initiated with interactive planning for
surveys and queuing of geometry for cine images. In
the scan queue, an interactive sequence using balanced
FFE is preloaded along with the SENSE bFFE cine
and valve sequences, with geometry inherit parameter
pre-set to HLA, LVOT, VLA, SA, AO Valve 1, AO
Valve 2, MV Valve (^15 mm from the valve) to be
defined interactively. The interactive sequence is
started and multiple transverse, coronal, and sagittal
scout views are acquired for later coronary imaging.
Next, a transverse image is selected that demonstrates
the left ventricle and atrium so that the VLA view can
be positioned. Two SA surveys are positioned from
the VLA, one at the midventricular level and one at
the basal level of the left ventricle. Next, the basal SA
survey is used for placing the LVOT view. From the
LVOT view, placement of slices for the Aortic Valve
views is made. Then the HLA view is positioned from
the midventricular SA survey. A true SA view and
Mitral Valve view can be angled from the HLA.
During the interactive sequence, each of the specified
views are obtained and the geometries are stored in
the respective geometry parameter.
Procedure B: In the next procedure, the cine
sequences for a functional exam begin as a series of
breath holds. Single slice cine images with at least 25
heart phases are obtained of the horizontal long axis
(HLA), left ventricular outflow tract (LVOT), and
vertical long axis (VLA). Multiple slice cine images
with at least 15 heart phases are obtained in the short axis
(SA) of both ventricles. Typically, nine 12 mm slices
(acquired 3 slices per breath hold) are enough to cover
the entire ventricle. The average breath holds, dependent
upon heart rate, averaged between 10–15 seconds.
Procedure C: Next, quantitative flow sequences for
the Aortic Valve and Mitral Valve are initiated. For
aortic valve flow data and valve sizing by the continuity
equation approach, two slices are placed 1.5 cm from
either side of the valve in the aortic and LV outflow tract
regions. For Mitral Valve flow data, one slice is placed in
the LV just distal to the valve leaflets. These images
require approximately 20-second breath holds with a
minimum of 18 phases, and are retrospectively gated to
the vector ECG. Encoding velocities (VENC) are pre-set
for 250 cm/sec on the aortic side, 200 cm/sec on the LV
outflow tract side, and 150 cm/sec for mitral inflow.
Adjustments in VENC are made as required if aliasing is
noted (primarily in the aortic regions for aortic stenosis),
and the affected images are re-acquired.
Procedure D: Finally, the coronary acquisition is
planned using the transverse, coronal, and sagittal views
with a 3D slab of 60 slices, 1.5 mm thickness,
overcontiguous, in the transverse plane. The respiratory
navigator is placed on the right diaphragm and a regional
shimming volume is placed over the heart. The slices
originate at the inferior wall of the LV and continue to
the middle of the pulmonary artery. The sequence time is
approximately 2–4 minutes dependent upon the patient’s
heart rate and respiratory navigator acceptance level.
This method ensures adequate screening imaging of the
right, left, and circumflex artery.
Results: The study was conducted without
difficulty and was tolerated well by all eight patients.
The shortest exam time was 19 minutes, the longest
exam time was 27 minutes, and average exam time
was 23 minutes. The planning of the exam with the
interactive tool requires some practice to develop the
skill necessary for a quick screening. Also, positioning
of the valve slices will necessitate additional time to
define accurate placement since it is necessary to have
the patient breath hold during the valve positioning,
but not during the functional positioning. A priorFigure 1. “Quick CMR Screening” protocol of myocardial
function, valves, and coronary arteries.
Poster Abstracts: Clinical MRI—Non-ischemic Acquired Heart Disease142
©2002 Marcel Dekker, Inc. All rights reserved. This material may not be used or reproduced in any form without the express written permission of Marcel Dekker, Inc.
MARCEL DEKKER, INC. • 270 MADISON AVENUE • NEW YORK, NY 10016

positioning of the coronary acquisition is not possible
during the interactive sequence because of navigator
and shim volume placement. In general, verbal
comments from the patients indicated surprise at
the speed of the exam.
Conclusions: The implementation of a compre-
hensive “Quick CMR Screening” protocol for
evaluation of cardiovascular patients is possible in
under 30 minutes. The technical advances in inter-
active scan planning, improved imaging sequences that
can be completed within a breath hold, and increased
reconstruction speed have further advanced the ability
for CMR imaging to serve as a high throughput
diagnostic screening exam. CMR now provides a fast
and non-invasive examination, conducive to patient
comfort and rapid interpretation.
Poster Abstracts: Clinical MRI—Non-ischemic Acquired Heart Disease 143
©2002 Marcel Dekker, Inc. All rights reserved. This material may not be used or reproduced in any form without the express written permission of Marcel Dekker, Inc.
MARCEL DEKKER, INC. • 270 MADISON AVENUE • NEW YORK, NY 10016