post-graduation migration - tn
TRANSCRIPT

Post-Graduation Migration Mobility Patterns and Labor Market Outcomes
of Tennessee Public College Graduates
2016

i
Abstract
This study examines migration patterns and select labor market outcomes and identifies the main graduate pathways of Tennessee public college graduates. It addresses the following questions: How many in-state students stay in Tennessee for employment or further studies after graduation? How many out-of-state students who graduate from Tennessee institutions stay in the state after graduation? What are the main pathways of public college graduates as part of the general Student Flow Model? What are their main labor market outcomes, such as employment status, continuity, and the median wage? How do the outcomes of interest vary by institutional and student characteristics? These questions required the use of data from several sources: the Student Information System managed by the Tennessee Higher Education Commission; the National Student Clearinghouse; and the Tennessee Department of Labor and Workforce Development via the Tennessee Longitudinal Data System. Individuals were tracked over time as they transitioned from in-state and out-of-state higher education institutions into the labor force in Tennessee. The study emphasizes the need for deeper integration of national and state data sources in addressing complex policy questions and responding to challenges facing American higher education.

ii
Table of Contents
Tables .................................................................................................................................................................. iv
Figures ................................................................................................................................................................. v
Acknowledgments ............................................................................................................................................. vi
Executive Summary ............................................................................................................................................ 1
Part I: Study Design ............................................................................................................................................ 4
A. Background and Motivation ................................................................................................................. 4
B. Goals and Research Questions ............................................................................................................ 6
C. Conceptual Framework ......................................................................................................................... 7
D. Main Outcomes of Interest ................................................................................................................. 10
E. Data Sources and Sample Description ............................................................................................. 11
F. Methodology ........................................................................................................................................ 15
Part II: Findings on Post-graduation Migration ............................................................................................ 19
A. Descriptive Analysis by Residency status and Degree Level .......................................................... 19
B. Findings on Post-graduation Migration ............................................................................................ 23
C. Findings on Labor Market Outcomes of College Graduates .......................................................... 34
1. Employment Status of Tennessee Public Graduates .................................................................. 34
2. Typical Wage of Tennessee Public Graduates ............................................................................. 40
Part III: Post-graduation Migration: Conclusion ........................................................................................... 48
Appendix A. Pathways of Graduates of Tennessee Public Universities, AY 2011 and AY 2012 ............. 51
Appendix B. Pathways of In-state Students Graduating from Tennessee Public Universities, AY 2011 and 2012 ............................................................................................................................................................ 52
Appendix C. Pathways of Out-of-state Students Graduating from Tennessee Public Universities, AY 2011 and 2012 .................................................................................................................................................. 53
Appendix D. Pathways of Graduates of Tennessee Community Colleges, AY 2011 and AY 2012 ........ 54
Appendix E. Pathways of In-state Students Graduating from Tennessee Community Colleges, AY 2011 and 2012 .................................................................................................................................................. 55
Appendix F. Pathways of Out-of-state Students Graduating from Tennessee Community Colleges, AY 2011 and 2012 .................................................................................................................................................. 56

iii
Appendix G. Pathways of Graduates Who Changed Their Resident Status from Out-of-State to In-state .................................................................................................................................................................... 57
Appendix H. Employment and Enrollment Statuses of In-State Students by Quarter after Graduation ............................................................................................................................................................................ 58
Appendix I. Employment and Enrollment Statuses of Out-of-State Students by Quarter after Graduation ....................................................................................................................................................... 59
Appendix J. Median Wage by Major, Degree, and Year: Approach I ......................................................... 60

iv
Tables
Table 1. Graduate Cohorts by Degree ........................................................................................................... 12
Table 2. Sample Description: Select Student Characteristics ..................................................................... 13
Table 3. Sample Description: Degree Production by Institution and Sector ............................................ 14
Table 4. Demographic and Academic Profiles of Graduates by Residency status .................................. 20
Table 5. Graduates by Degree Level, Institutional Sector, and Residency status .................................... 22
Table 6. Graduates by Migration Status and Year of Graduation .............................................................. 23
Table 7. Graduates by Migration Status and Residence at Enrollment .................................................... 24
Table 8. Demographic and Academic Profiles of Graduates by Migration Status................................... 25
Table 9. Post-graduation Migration Choices by Degree and Residence at Enrollment .......................... 27
Table 10. Employment Status of Graduates by Year after Graduation: Approach I ............................... 35
Table 11. Employment Status of Graduates by Year after Graduation: Approach II .............................. 35
Table 12. Employment and Enrollment Statuses of Public Graduates by Quarter after Graduation ... 37
Table 13. Median Wage of Public Graduates by Year: Approach I ............................................................ 40
Table 14. Median Wage of Public Graduates by Year: Approach II ........................................................... 40
Table 15. Median Wage of Public Graduates by Quarter ............................................................................ 41
Table 16. Median Wage of Public Graduates by Degree and Year ............................................................ 42
Table 17. Median Wage by Employment Status and Year .......................................................................... 42
Table 18. Median Wages by Demographic Group and Year ....................................................................... 43
Table 19. Median Wage by Major, Degree, and Year: Approach II ........................................................... 45
Table 20. Median Wage by Graduates’ Post-college Pathways: Approach I ............................................. 47

v
Figures
Figure 1. Student Flow Model: Pathways to Graduation and Employment / Further Studies ................. 8
Figure 2. Student Flow Model: Tennessee Graduate Pathways ................................................................... 9
Figure 3. Pathways of Graduates of Tennessee Public Universities and Community Colleges, AY 2011 and AY 2012 ...................................................................................................................................................... 29
Figure 4. Pathways of In-state Students Graduating from Tennessee Public Universities and Community Colleges, AY 2011 and AY 2012 ................................................................................................. 31
Figure 5. Pathways of Out-of-state Students Graduating from Tennessee Public Universities and Community Colleges, AY 2011 and AY 2012 ................................................................................................. 32
Figure 6. Employment and Enrollment Status of In-state Students as of Quarter 12 ........................... 38
Figure 7. Employment and Enrollment Status of Out-of-State Students as of Quarter 12 ................... 39

vi
Acknowledgments
This report was produced by Alexander Gorbunov, David L Wright, and Emily House at the Tennessee Higher Education Commission (THEC). The authors bear sole responsibility for the findings and conclusions.
We are grateful to Brian Douglas and Blake Walker at THEC and Tammy Lemon at the University of Tennessee’s Center for Business and Economic Research (CBER) for assistance obtaining data from the Tennessee Department of Labor and Workforce Development and the National Student Clearinghouse.
We are thankful to William F. Fox and Angela Thacker at CBER for their consultation related to wage data.
The preliminary results of the study were presented at the 2015 conference of the Tennessee Association for Institutional Research and the fall 2015 meeting of the Tennessee Higher Education Commission. We thank all attendees who asked questions and made recommendations for this research.
We would like to thank Taylor Odle and Matt Freeman for their thoughtful editorial comments on this report.
______________________________________________________________________________________________
The Tennessee Higher Education Commission was created in 1967 by the Tennessee General Assembly. The Commission coordinates two systems of higher education, the University of Tennessee institutions governed by the University of Tennessee Board of Trustees, and the state universities, community colleges, and technology centers governed by the Tennessee Board of Regents. There are nine public universities, two special purpose institutes, 13 community colleges, and 27 colleges of applied technology in Tennessee that educate nearly 250,000 students.
______________________________________________________________________________________________
Suggested citation: Tennessee Higher Education Commission. (2016). Post-graduation migration: Mobility patterns and labor market outcomes of Tennessee public college graduates. Nashville, TN: Author.

COLLEGE GRADUATES MIGRATION STUDY | 1
Executive Summary
Study Design
The goals of the study are to examine post-graduation migration patterns and labor market outcomes of graduates of Tennessee public institutions, and identify the main graduate pathways as part of the general Student Flow Model.
The study addresses the following questions:
- How many in-state and out-of-state students stay in Tennessee after graduation for employment or further studies and how many leave the state?
- What are the main pathways of public college graduates?
- What are the main labor market outcomes of public graduates?
- How do the outcomes vary by institutional and student characteristics?
The sample includes associate and bachelor’s graduates of Tennessee public higher education institutions in academic years 2010–11 and 2011–12.
The observation period covers 3 years (12 quarters, 9 semesters) after graduation.
Data were retrieved from the THEC’s Student Information System, Tennessee Longitudinal Data System, and National Student Clearinghouse.
Sample Characteristics
In AY 2011 and AY 2012, there were 56,325 graduates from Tennessee public institutions with an associate or bachelor’s degree.
- 31.1% - associate degrees and 68.9% - bachelor’s degrees.
- 41.3% - adult graduates; 53.6% - Pell-eligible; and 22.3% - non-White.
- 90.6% - in-state students and 9.2% out-of-state students (0.2% unknown).
39,440 students graduated from public universities (bachelor’s or associate degrees) and 16,885 students graduated from community colleges (associate degrees).
Out-of-state students earned 3.6% of all associate degrees and 11.7% of all bachelor’s degrees.
The most popular majors at graduation were Liberal Arts and Sciences (18.4%), Business Management and Administrative Services (15.3%), and Health Professions and Related Services (12%).

COLLEGE GRADUATES MIGRATION STUDY | 2
Findings on Graduate Migration
45,382 (80.6%) graduates stayed in Tennessee after graduation for work or subsequent study, while 10,841 (19.2%) left the state. The migration status of 102 graduates (0.2%) is unknown.
- About 88.8% of associate degree graduates and 76.8% of bachelor degree graduates remained in Tennessee after graduation.
- About 11.1% of associate degree graduates and 22.9% of bachelor degree graduates left Tennessee after graduation.
Among graduates staying in Tennessee:
- 38.2% worked in the state continuously after graduation.
- 18.3% worked in Tennessee partially (from 4 to 10 quarters out of 12 quarters after graduation).
- 34.8% combined work and further studies (nearly 45% of associate graduates).
- 8.7% continued higher education studies without simultaneous employment (nearly 44% of associate graduates).
Among graduates leaving for other states:
- 57.1% were not found working in Tennessee or studying anywhere.
- 16.5% continued higher education studies in other states.
- 26.4% worked in Tennessee temporarily (3 or fewer quarters out of 12 quarters after graduation).
For out-of-state students graduating in Tennessee, 47.1% stayed in the state for employment or subsequent studies, while 52.9% moved away.
In each quarter, the share of graduates staying in Tennessee for work or studies remained stable and varied between 67.2% and 71.9%.
The share of out-of-state students graduating and staying in Tennessee gradually decreased from 40.9% to 34.2% at the end of the third year after graduation.
By the end of Year 3:
- 67.2% of all graduates were in Tennessee and 32.8% had left the state.
- 70.7% of in-state and 34.2% of out-of-state students were in Tennessee, while 29.3% of in-state and 65.8% of out-of-state students had left the state.
Among public universities, the share of “stayers” was largest for TTU (81.3%) and smallest for APSU (69.2%)
For community colleges, the share of “stayers” was largest for Columbia State, Jackson State, and Northeast State (90.7% each) and smallest for Chattanooga State (85.2%).

COLLEGE GRADUATES MIGRATION STUDY | 3
Findings on Labor Market Outcomes
From Year 1 to Year 2 after graduation, the number of graduates working in Tennessee decreased from 42,593 to 39,254. During that time, the share of graduates employed part-time declined from 37.7 to 20.9 percent, while the proportion of graduates employed full-time increased from 62.3 to 79.1 percent.
If employed immediately after graduation, the median annual wage of graduates in the combined sample (associate and bachelor graduates) increased from $18,176 in Year 1 to $29,720 in Year 3.
In Year 3, the median wage for associate degree graduates was $26,508, and the median wage for bachelor’s degree graduates was $31,101.
In Year 3, graduates employed full-time earned, on average, $35,016, while individuals working part-time had a median wage of $6,046.
The following student groups had a higher median wage than their counterparts during the observation period: males, adults (25 or over at the time of graduation), White graduates (with the exception of Year 1), and individuals who were not Pell-eligible at any point in college.
The difference in the median wage between bachelor’s graduates and associate graduates was the largest for the following four majors: Liberal Arts and Sciences, Computer and Information Sciences, Education, and Engineering.
Graduates who joined the labor market without further studies earned more that students who combined employment with subsequent higher education enrollment. Students who were enrolled part-time had a higher median wage than individuals who were enrolled full-time.
- In Year 3, the median wage for graduates who were working full-time without continuing studies was $36,175.
- In Year 3, the median wage for graduates who worked full-time and enrolled part-time in a higher education institution was $32,233.
- In Year 3, the median wage for graduates who worked full-time and enrolled full-time in a higher education institution was $26,482.

COLLEGE GRADUATES MIGRATION STUDY | 4
Part I: Study Design
A. Background and Motivation
Because of the ever-increasing economic, political, and social pressures, the state of Tennessee finds itself in a constant and strenuous competition with other states for college students and graduates, and educated workforce. Being interwoven with a host of critical problems facing Tennessee, the topical issues of “brain drain” and “brain gain” are at the core of practically every policy reform and initiative related to education and socio-economic development. The importance of these issues necessitates thorough analyses of the current patterns and historical trends of college student and graduate migration, as well as examination of factors that explain in- and out-migration of educated workforce.
Acknowledging inter-state competition for educated citizenry, one realizes that Tennessee trails many rival states on the measures of both educational attainment and economic development. As of 2013, Tennessee had 33.1 percent of adult state residents (25-64) with an associate degree or higher, ranking 42nd in the nation.1 In the same year, Tennessee’s per capita income was $39,558, ranking 34th in the US.2 While showing a correlation between levels of educational attainment and economic development in the state, these data fail to show the role migration factors play in affecting these key outcomes. Educational attainment—and subsequently economic well-being—is affected by both degree production and migration of college students and graduates. The latter is a function of two processes: keeping high school graduates in state and attracting out-of-state students (and graduates) to Tennessee higher education and labor market. Therefore, understanding migration patterns and drivers is paramount to prevailing in inter-state competition for educated labor force and raising the state’s educational attainment rate.
A number of strategies have been recently adopted to raise the educational attainment level, keep Tennessee students in the state and attract students from other states. The new Master Plan for Tennessee Postsecondary Education lists the following key policies and initiatives that pursue these goals: Drive to 55, Tennessee Promise, Tennessee Reconnect, and Labor Education Alignment Program.3 These initiatives build on the success of the 2010 Complete College Tennessee Act and such long-standing programs as Tennessee Education Lottery Scholarship Program and Academic Common Market. In this context, we need to
1 American Community Survey, 2013. 2 U.S. Bureau of Economic Analysis, 2013. 3 Tennessee Higher Education Commission. (2015). Postsecondary attainment in the decade of decision: The master plan for Tennessee postsecondary education, 2015-2025. Nashville, TN: Author.

COLLEGE GRADUATES MIGRATION STUDY | 5
know how in- and out-migration affects the implementation and outcomes of these policies.
Although multiple policies have been adopted to keep Tennessee students and graduates in state and attract residents of other states, information about graduates who stay in state or move back to Tennessee after graduation is scant. This gap in knowledge may hinder attainment of key policy goals. To structure our glide path to the Drive 55 goals, the policymakers, researchers, and practitioners need to know —among other things—the following:
How many in-state students stay in Tennessee after graduation for employment or subsequent higher education studies?
How many out-of-state students stay in Tennessee after graduation?
How many Tennessee residents graduating from out-of-state colleges return to Tennessee?
What are the labor market outcomes of graduates of Tennessee institutions?
How do these outcomes differ by demographic and institutional characteristics?
How do migration and employment outcome change over time?
What factors could explain migration decisions of college students and graduates?
In general, how does migration affect the key policy goals of raising educational attainment and improving economic outcomes?
A major hurdle to answering the above questions is acquiring access to data from multiple agencies. The only way to overcome this barrier is to collaborate with a host of such agencies and datasets. Each pertinent dataset contains only a portion of the overall picture and restricts the number of research questions that can be posed and answered within its constraints. For example, the Student Information System, managed and housed by the Tennessee Higher Education Commission, includes data on enrollment history and graduation of public college students; however, subsequent enrollment in out-of-state or private institutions should be obtained from the National Student Clearinghouse. Some labor market outcomes are available from the Tennessee Department of Labor and Workforce Development via the Tennessee Longitudinal Data System. Only through matching individual records across these datasets can one successfully address a question of post-graduation migration, its patterns, and its effects. The current study illustrates how addressing such complex policy questions requires maximizing efficiencies when using multiple datasets.

COLLEGE GRADUATES MIGRATION STUDY | 6
B. Goals and Research Questions
This investigation stems from the need to understand how graduate migration affects educational attainment and economic and social development in the state. Due to data and space constraints, from the bevy of possible research questions mentioned above, this study focuses on the short- to medium-term migration patterns of graduates of Tennessee public colleges and their select labor market outcomes. More specifically, the overarching goal of the research project is to examine post-graduation outcomes of graduates of Tennessee public institutions regarding their in-state employment status and continuity. It also addresses, if applicable, subsequent studies at in-state or out-of-state higher education institutions, and the median wage earned by graduates in the labor market.
This study aims to answer the following research questions:
1. How many in-state students stay in Tennessee after graduation for employment or further studies and how many leave the state?
2. How many out-of-state students stay in Tennessee after graduation for employment or further studies and how many leave the state?
3. What are the labor market outcomes (employment status and continuity, median wage) of graduates who stayed in Tennessee?
4. How do these outcomes vary by degree, major, demographic group, and institutional characteristics?
5. How do these outcomes change over time?
6. How do these outcomes vary by student residency status?
In addition to the main research questions, the investigation also examines the following sets of accompanying issues:
What are the pathways of public college graduates?
What is the share of each pathway in the overall Student Flow Model?
What do these pathways’ shares look like in every quarter during the observation period?
What are the institutional shares across these pathways?
How do these pathways differ for in-state and out-of-state students graduating from Tennessee public institutions?
How prevalent is the scenario in which students change their residency status from the original enrollment to graduation?
Are the outcomes of interest different for students changing residency status?

COLLEGE GRADUATES MIGRATION STUDY | 7
C. Conceptual Framework
The current study is rooted in the general ongoing investigation of Tennessee students and residents’ pathways to graduation from higher education institutions and post-graduation employment and/or further studies. This large-scale research agenda aims to construct a Student Flow Model that will track high school graduates throughout their college careers and initial employment. The Student Flow Model will examine pathways of 1) in-state and out-of-state students graduating in Tennessee as well as 2) Tennessee residents graduating from postsecondary institutions in other states. Due to data availability limitations, the current study focuses on the former. This section, however, presents the Conceptual Framework for the overall investigation with the assumption that a subsequent study will address the remaining issues and populations of interest. Figure 1 and Figure 2 present the Conceptual Framework for the general Student Flow Model.
From a bird’s view, the Student Flow Model starts with graduation from high school—in Tennessee or, in case of out-of-state students, in other states or countries. Either group of high school graduates subsequently enroll as first-time freshmen (FTF in Figure 1) in Tennessee or out-of-state postsecondary institutions. Because of prevalent student transfer activity, higher education graduation often happens in a different institution or state from students’ original enrollment. Despite intense transfer activity, from the student migration perspective, the graduation event takes place either at in-state or out-of-state institutions. Figure 1 shows these multiple trajectories within higher education leading to either employment or further education.
This study focuses on in- and out-of-state students graduating from Tennessee public institutions and then proceeding to either higher education enrollment anywhere or employment in Tennessee within the first three years after graduation. In Figure 1, these groups are identified with green letters. Further studies will examine pathways and post-graduation outcomes of the remaining sub-populations of interest, such as: 1) Tennessee resident graduating from out-of-state institutions and 2) out-of-state students who originally enrolled in Tennessee institutions or transferred to Tennessee from their state, but ended up graduating out-of-state.
At the point of graduation, student pathways multiply: graduates may enter the labor force in any employment status, continue higher education studies, or combine both options. They may also employ full- or part-time and enroll in other institutions full- or part-time. To complicate matters, employment and enrollment statuses may be temporary and intermittent, and may change in intensity at different times. Some graduates may even combine in- and out-of-state employment and enrollment within a short period following graduation. Figure 2 presents various pathways of Tennessee college graduates.

COLL
EGE
GRA
DU
ATES
MIG
RATI
ON
STU
DY
| 8
Figu
re 1
. Stu
dent
Flo
w M
odel
: Pat
hway
s to
Gra
duat
ion
and
Empl
oym
ent
/ Fur
ther
Stu
dies

COLLEGE GRADUATES MIGRATION STUDY | 9
Figure 2. Student Flow Model: Tennessee Graduate Pathways
The graduate pathways depicted in Figure 2 are the basis of the analysis in this study. They demonstrate that graduates of Tennessee public higher education institutions fall under one of the two categories: 1) Graduates who stay in Tennessee for work or subsequent studies (aka “stayers”) and 2) Graduates who immediately or eventually leave Tennessee after their original graduation (aka “leavers”).
Among “stayers”, the following pathways are identified: (a) Joining the Tennessee labor force continuously (i.e., for the majority of the observation period); (b) Joining the workforce partially (i.e., with some gaps in employment); (c) Combining employment and further higher education studies; (d) Continuing higher education exclusively; and (e) Combining employment in Tennessee with enrollment in out-of-state colleges at some point during the observation period. For “leavers”, these pathways include: (a) Higher education enrollment out-of-state; (b) Short-term employment in Tennessee that was not resumed; and (c) Not found employed in Tennessee or enrolled in college anywhere else.
These post-graduation trajectories allow for classification of college graduates into distinct, and strictly defined, categories of “stayers” and “leavers” and subsequent comparison of their outcomes of interest. The next section identifies these outcomes in greater detail.
Continuous employment
Partial employment
Graduates
who stay Higher Ed. enrollment and employment
in Tennessee
Higher Ed. enrollment only
Tennessee graduates
with associate and Employment and enrollment out-of-state
bachelor's degrees
Higher Ed. enrollment in other states
Graduates
who move from Temporary employment in Tennessee
Tennessee
Not working in TN or studying anywhere

COLLEGE GRADUATES MIGRATION STUDY | 10
D. Main Outcomes of Interest
Driven by the above sets of research questions, this study addresses the following outcomes variables of interest:
1) Migration outcomes: a. Number and proportion of students who stay in Tennessee and leave the
state after graduation; b. Statistics on “leavers” and “stayers” for all graduates, and in-state and out-of-
state students; c. Difference in migration outcomes by demographic group, award level, major,
institutional type, and individual institution; d. Changes in the migration outcomes over time.
2) Labor market outcomes: a. Employment status: Full-time versus part-time work; b. Employment continuity: Continuous versus partial employment; c. Median wage by employment status and selected pathway; d. Difference in employment outcomes by demographic group, award level,
major, institutional type, and individual institution; e. Changes in the labor market outcomes over time.
3) Pathways of college graduates: a. Number and proportion of students in each post-graduation pathway; b. Number and proportion of students in each pathway at every quarter during
the observation period of the study; c. Difference in pathway selection between in-state and out-of-state students. d. Pathway selection by institution of graduation.
Although specifics terms are defined below in the respective sections of the report, some general definitions for the above terms are in order. First, this report defines “staying in Tennessee” and “leaving Tennessee” based on available data on employment and subsequent enrollment in the state. It is possible, however, that some graduates’ data are not available due to self-employment, joining the military, or enrolling in institutions not reporting to the National Student Clearinghouse. Second, classification of students into Tennessee and out-of-state residents reflects the residency status at the time of initial enrollment and not at the time of graduation. As subsequent analysis shows, some students may have changed their residency status by graduation. Finally, data on full-time and part-time employment are not directly available, and these definitions are constructed based on reported quarterly wage. These definitions bear on the outcomes of interest described above. The Methodology section delves into these and other terms with greater precision.

COLLEGE GRADUATES MIGRATION STUDY | 11
E. Data Sources and Sample Description
The complexity of the research questions and the need to track graduates over time and along various pathways required relying on data from multiple sources. A major advantage of this study is the ability to match individual-level records across several datasets to address this complicated policy issue.
The following agencies provided data to THEC for the purposes of this study:
1. Data on public college graduates (including demographic and institutional characteristics) came from the Student Information System (SIS) managed by THEC;
2. Data on subsequent enrollment in higher education institutions (including out-of-state and private colleges) were obtained from the National Student Clearinghouse (Clearinghouse).
3. Data on employment outcomes (wage and employment information) were from the Tennessee Department of Labor and Workforce Development and were made available via the Tennessee Longitudinal Data Systems (TLDS).
All data are student-level and allow for matching across datasets and tracking over time. The SIS data include demographic and institutional characteristics of 2011 and 2012 associate and bachelor’s degree graduates from Tennessee public universities and community colleges. The TLDS data contain the total quarterly wage for graduates who found employment in Tennessee after their graduation; these data cover the period of 12 quarters (3 years) after the original graduation with an associate or bachelor’s degree. The Clearinghouse data cover the post-graduation academic history of these graduates, including their subsequent enrollment in Tennessee and out-of-state institutions of postsecondary education. Although up to six years of academic history are available for some cohorts in the sample, only three years of data (nine semesters after graduation) are used to keep in sync with the data on wages. All student-level data were pulled from the above sources and combined into a unified dataset for further analysis.
The study sample includes 56,325 associate and bachelor’s degree graduates from Tennessee public universities and community colleges in academic years 2010-11 and 2011-12. There were 27,277 graduates in AY 2010-11 and 29,048 graduates in AY 2011-12. About 31 percent of the sample were associate degree graduates, and almost 69 percent were graduates with a bachelor’s degree. Table 1 presents counts and proportions of graduates in the sample by graduation year and degree.

COLLEGE GRADUATES MIGRATION STUDY | 12
Table 1. Graduate Cohorts by Degree
Graduation year Associate Bachelor Total
2010-11 Number 8,273 19,004 27,277
Share of total 30.3% 69.7%
2011-12 Number 9,266 19,782 29,048
Share of total 31.9% 68.1%
Total Number 17,539 38,786 56,325
Share of total 31.1% 68.9%
Table 2 shows select descriptive statistics for the sample that are based on data from the Student Information System. A more detailed presentation of graduate profiles and descriptive analysis of these and other variables are carried out in Part II of this report. The SIS provided data on the demographic and institutional characteristics of the sample under analysis. The main student-level descriptors include gender, age, race/ethnicity, Pell eligibility, and major at graduation.
While 59 percent of the graduates are female, their share differs by degree level: more females than males earn associate degrees (64 versus 36 percent), and the difference got smaller among baccalaureate graduates (56.6 percent of females versus 43.4 percent for male graduates). Over 41 percent of the sample are adult graduates, that is, they were 25 years old or older at the time of graduation. There were more adults among associate graduates (57.6 percent) than among bachelor’s degree graduates (33.8 percent). White students constitute the majority of all graduates (77.7 percent) and graduates with specific degrees. Black students were the second largest group of graduates among racial/ethnic groups—14.5 percent of all graduates. Pell-eligible graduates—defined as being eligible for Pell grant any time during their college career—made up 53.6 percent of the sample. Their share is larger for the associate graduates (67.2 percent) than for bachelor’s degree graduates (47.4 percent). Residency status in the SIS is determined by the student’s legal residence at the time of the first enrollment in Tennessee institutions. Most graduates in the sample (90.6 percent) were in-state students. The share of in-state students was higher for associate graduates (96.4 percent) than among bachelor’s graduates (88.1 percent). About 45.7 percent of the sample graduate with a major in one of the following three broad fields: Liberal Arts and Sciences (18.4 percent), Business Management and Administrative Services (15.3 percent), or Health Professions and Related Services (12 percent).

COLLEGE GRADUATES MIGRATION STUDY | 13
Table 2. Sample Description: Select Student Characteristics
Variables Associate degree Bachelor's degree Whole sample
Gender: Female 11,233 64.0% 21,937 56.6% 33,170 58.9% Gender: Male 6,306 36.0% 16,849 43.4% 23,155 41.1% Age: Adult (=> 25 at graduation) 10,107 57.6% 13,128 33.8% 23,235 41.3% Age: Non-adult (<25 at graduation) 7,432 42.4% 25,658 66.2% 33,090 58.7% Race/ethnicity: White 14,115 80.5% 29,644 76.4% 43,759 77.7% Race/ethnicity: Black 2,114 12.1% 6,060 15.6% 8,174 14.5% Race/ethnicity: Hispanic 348 2.0% 779 2.0% 1,127 2.0% Race/ethnicity: Asian 261 1.5% 1,068 2.8% 1,329 2.4% Race/ethnicity: Other 701 4.0% 1235 3.2% 1,936 3.4% Income category: Pell eligible 11,788 67.2% 18,391 47.4% 30,179 53.6% Income category: Not Pell eligible 5,751 32.8% 20,395 52.6% 26,146 46.4% Residency: In-state 16,900 96.4% 34,152 88.1% 51,052 90.6% Residency: Out-of-state 623 3.6% 4,549 11.7% 5,172 9.2% Residency: Unknown 16 0.1% 85 0.2% 101 0.2% Major: Agriculture 32 0.2% 753 1.9% 785 1.4% Major: Architecture and Related Programs 0 0.0% 83 0.2% 83 0.1% Major: Area, Ethnic and Cultural Studies 0 0.0% 118 0.3% 118 0.2% Major: Biological Sciences / Life Sciences 10 0.1% 1,626 4.2% 1,636 2.9% Major: Business Management and Adm. Services 1,741 9.9% 6,885 17.8% 8,626 15.3% Major: Communications 164 0.9% 1,815 4.7% 1,979 3.5% Major: Computer and Information Sciences 369 2.1% 422 1.1% 791 1.4% Major: Education 507 2.9% 2,308 6.0% 2,815 5.0% Major: Engineering 964 5.5% 1,874 4.8% 2,838 5.0% Major: English Language and Literature / Letters 0 0.0% 1,031 2.7% 1,031 1.8% Major: Foreign Languages and Literatures 15 0.1% 775 2.0% 790 1.4% Major: Health Professions and Related Services 3,755 21.4% 3,022 7.8% 6,777 12.0% Major: Home Economics 277 1.6% 929 2.4% 1,206 2.1% Major: Law and Legal Studies 221 1.3% 33 0.1% 254 0.5% Major: Liberal Arts and Sciences 8,519 48.6% 1,831 4.7% 10,350 18.4% Major: Mathematics 0 0.0% 279 0.7% 279 0.5% Major: Military Sciences 0 0.0% 56 0.1% 56 0.1% Major: Multi / Interdisciplinary Studies 0 0.0% 1,792 4.6% 1,792 3.2% Major: Unknown 0 0.0% 1,261 3.3% 1,261 2.2% Major: Parks, Recreation, Leisure and Fitness Studies 0 0.0% 1,702 4.4% 1,702 3.0% Major: Personal and Miscellaneous Services 19 0.1% 0 0.0% 19 0.0% Major: Personal Improvement and Leisure Programs 195 1.1% 0 0.0% 195 0.3% Major: Philosophy, Religion, and Theology 0 0.0% 157 0.4% 157 0.3% Major: Physical Sciences 0 0.0% 628 1.6% 628 1.1% Major: Protective Services and Public Affairs 322 1.8% 1,771 4.6% 2,093 3.7% Major: Psychology 0 0.0% 2,436 6.3% 2,436 4.3% Major: Social Sciences 8 0.0% 2,949 7.6% 2,957 5.2% Major: Technology Education / Industrial Arts 192 1.1% 0 0.0% 192 0.3% Major: Trades and Industrial 45 0.3% 243 0.6% 288 0.5% Major: Visual and Performing Arts 184 1.0% 2,007 5.2% 2,191 3.9%

COLLEGE GRADUATES MIGRATION STUDY | 14
Table 3 shows each institution’s share of graduate production in the sample by institutional sector. Two universities, UTK and MTSU, together graduated over 42 percent of the sector’s total. APSU and TSU award both associate and bachelor’s degrees, which explains the mismatch between the totals by sector and degree (see Table 1). Pellissippi State and Chattanooga State each produced 10 or more percent of the sector’s total.
Table 3. Sample Description: Degree Production by Institution and Sector
Institutions by Sector Associate Bachelor Total Share
Austin Peay State University 412 2,548 2,960 7.5%
East Tennessee State University 0 4,146 4,146 10.5%
Middle Tennessee State University 0 7,722 7,722 19.6%
Tennessee State University 242 1,917 2,159 5.5%
Tennessee Technological University 0 3,279 3,279 8.3%
University of Memphis 0 5,355 5,355 13.6%
University of Tennessee, Chattanooga 0 2,811 2,811 7.1%
University of Tennessee, Martin 0 2,118 2,118 5.4%
University of Tennessee, Knoxville 0 8,890 8,890 22.5%
Universities: Total 654 38,786 39,440 100%
Chattanooga State Community College 1,694 0 1,694 10.0%
Cleveland State Community College 710 0 710 4.2%
Columbia State Community College 1,121 0 1,121 6.6%
Dyersburg State Community College 531 0 531 3.1%
Jackson State Community College 1,098 0 1,098 6.5%
Motlow State Community College 1,116 0 1,116 6.6%
Nashville State Community College 1,224 0 1,224 7.2%
Northeast State Community College 1,413 0 1,413 8.4%
Pellissippi State Community College 1,963 0 1,963 11.6%
Roane State Community College 1,513 0 1,513 9.0%
Southwest Tennessee Community College 1,587 0 1,587 9.4%
Volunteer State Community College 1,452 0 1,452 8.6%
Walters State Community College 1,463 0 1,463 8.7%
Community colleges: Total 16,885 0 16,885 100%

COLLEGE GRADUATES MIGRATION STUDY | 15
F. Methodology
1. Sample
This study’s sample included 56,325 graduates from Tennessee public universities and community colleges in academic years 2010-11 and 2011-12. This total included only graduates with associate and bachelor’s degrees and did not count certificates. The count was also unduplicated: it removed duplicates on students that were caused by double-majoring or receiving two degrees from the same or different institutions during the same period (AY 2011 and AY 2012). In other words, only one—the highest—degree per individual and the year in which it was awarded were taken into account. As a result, the count of graduates in the sample, and specific subsamples, may differ from other sources that use different methodologies or approaches to reporting student and institutional performance.4
2. Observation period
The observation period for the study was defined as three years following graduation. A unique feature of the study is that this observation period is cohort-specific: The time counter started immediately after the semester of graduation. Because each academic year has three semesters in which students can graduate, there are six graduate cohorts (from summer of 2010 to spring of 2012) that are followed for three years after graduation but have different end-of-observation points. Consequently, students graduating in different semesters have their cohort-specific observation period, but each of these periods covers exactly three years. Another feature is that the three-year observation period translates into 12 quarters of wage data (retrieved from TLDS) and 9 semesters of subsequent higher education enrollment after the original graduation (from the Clearinghouse).
3. Definitions of “stayers” and “leavers”
Figure 2 previously identified pathways of college graduates in relation to their migration status. Two statuses were identified: 1) Graduates who were found working or studying in Tennessee in a three-year window after graduation (referred to as “stayers”) and 2) graduates who were not found in Tennessee at all or who found employment only for a short period of time (“leavers”). The following categories qualify as “stayers”: graduates working in Tennessee continuously (11-12 quarters in three years) or partially (4-10 quarters), graduates working in the state and studying in-state or out-of-state simultaneously, and graduates only continuing studies at Tennessee institutions. Graduates qualify as “leavers” if they enroll in out-of-state institutions, work in Tennessee
4 For example, the annual Tennessee Higher Education Factbook counts the number of awards, thus, potentially counting the same individual more than once.

COLLEGE GRADUATES MIGRATION STUDY | 16
for 3 or fewer quarters, or are not found employed in Tennessee or enrolled in college anywhere during the observation period.
To be sure, these definitions are valid for the duration of observation only, and the migration status may change after the end of the three-year window. For example, as the Clearinghouse data demonstrate, a small number of graduates re-enroll in Tennessee institutions after the end of the observation period. However, this study uses only three years of post-graduation enrollment data to be consistent with the wage data, which is available only for 12 quarters following graduation.
4. Employment data: wage and status
The original TLDS data contain only quarterly wage information for 12 quarters, starting with the quarter nearest to a student’s graduation. To report annual data, the total of all quarterly data was used. Because the distribution of wages is skewed to the right, the median wage is reported as the typical wage of college graduates. Reporting the average wage would be inappropriate because the mean is more sensitive to outliers, and a small number of high earners would pull up the average wage.
The wage information was also used to assign full-time and part-time employment status.5 First, the respective thresholds were estimated for quarterly and annual wage: the minimum hourly wage was multiplied by 35 hours a week and multiplied by the number of weeks in the period of interest (13 weeks in a quarter and 52 weeks in a year). Individuals earning more than the threshold were classified as employed full-time; individuals earning less than the threshold were considered employed part-time in a given period. To be sure, this technical definition does not necessarily match the real employment status: It is possible, for example, that part-time workers earning high salaries could clear the threshold and—for the purposes of this study—be classified as employed full-time. Thus, readers are cautioned to interpret the results with a clear understanding of the above definition.
5. Further postsecondary education
The data from the National Student Clearinghouse allow for retrieving the following variables for the study: enrollment status (part-time or full-time) in each semester, state where the institution of enrollment is located (marking in-state and out-of-state enrollment), and institutional sector and control. It should be noted that not all U.S. institutions report to the Clearinghouse; thus, a small number of Tennessee graduates
5 Since the real employment status is unknown, this study follows the approach used by UT’s Center for Business and Economic Research to assign employment status based on wage.

COLLEGE GRADUATES MIGRATION STUDY | 17
continuing their studies at non-reporting colleges may have been omitted from the analysis.
6. Residency status
This study employs a definition of in-state and out-of-state students that is based on legal residence reported to the Tennessee institution of original enrollment. A better approach may be to use students’ legal residence at the time of graduation; however, this data is not reported by institutions for their graduates. To account for possible changes in residency status between enrollment and graduation, the study also used fee-paying status at the time of graduation and classified graduates into in-state and out-of-state categories based on tuition status. When important for comparison, select separate analyses of students who may have changed their residency status by graduation are also presented below. The phrases “could have changed” and “may have changed” are used in this report to acknowledge the difference in defining residency at the time of initial enrollment (based on the legal residence reported to the institution) and at the time of graduation (based on fee-paying status in the semester prior to graduation). However, the main definition of residence used in this study is based on the residency status (in-state or out-of-state) reported at the time of first enrollment in Tennessee public institutions.
7. Assumptions and technical details
Graduates are classified into those who stayed in Tennessee and those who left the state based on their employment in Tennessee and subsequent enrollment in in-state or out-of-state institutions during three years following their graduation. The three-year window is determined by wage data availability. It is quite possible, however, that some graduates made their decisions to stay or leave Tennessee after the end of the observation period. Therefore, classification into “stayers” and “leavers” comes with the reservation that it is valid for middle-term, but not long-term, migration decisions.
The above classification is not totally complete because the following data are lacking: 1) employment of graduates who were self-employed or joined the military and 2) enrollment information on graduates subsequently attending institutions that do not report to the National Student Clearinghouse. The share of this missing data is not expected to be large.
Two approaches were used to report typical wages of graduates in this study. In the first approach, the data was reported for each year starting immediately after graduation. Three years of data were thus available for reporting and analysis. In the second approach, following the example of the CBER’s reports, the graduates were given two quarters to find employment and the counter started six months after graduation. Because of this delay, the typical wages increased (as more graduates were in the labor market at that point); however, in this case, the period of available wage data was limited to only two full years.

COLLEGE GRADUATES MIGRATION STUDY | 18
A reporting year includes four quarters of wage data and three semesters of enrollment, when applicable. The entire observation period for each graduate comprises 12 quarters of wage data and 9 semesters of potential enrollment; and the boundaries of these time periods do not match. Thus, when select data are reported by quarter, enrollment information is also presented by quarter; in such cases, enrollment information was repeated in two quarters each year.

COLLEGE GRADUATES MIGRATION STUDY | 19
Part II: Findings on Post-graduation Migration
The main outcomes of interest in this study concern the migration decisions of Tennessee graduates. These outcomes are expected to be different for in-state and out-of-state students. If observed, these differences will have critical consequences for evaluation of tuition and migration policies. Therefore, all outputs in this section are presented by residency status, as well as for the entire combined sample of 2011 and 2012 public Tennessee graduates. When appropriate, secondary analyses of students who may have changed their residency status from out-of-state to in-state are included. In addition, in order to compare outcomes of associate and bachelor’s graduates, the relevant results are also presented by degree level.
Section A offers a descriptive analysis of key variables in the study for the above subsamples of graduates (in-state versus out-of-state and associate versus bachelor’s graduates) and the entire study sample. Section B discusses findings on post-graduation migration. Section C presents findings on the labor market outcomes of college graduates of Tennessee public institutions.
A. Descriptive Analysis by Residency status and Degree Level
Tables 2 and 3 in Part I offer general sample description. The purpose of this section is to present demographic and academic profiles of graduates in the sample by their residency status and lay the foundation for the subsequent presentation of the study results. Table 4 below summarizes the key demographic and academic variables in the study for the following four groups of graduates: 1) In-state students; 2) Out-of-state students; 3) Students who may have changed their residency status from out-of-state (based on the place of legal residence at enrolment) to in-state (based on the tuition-paying status at graduation); and 4) All graduates in the study sample. The percentages represent shares of each variable’s values within the respective residency categories of graduates. In other words, percentages sum up to a 100 percent across rows (vertically).
Out of 56,325 graduates in the combined sample (AY 2011 and 2012), 51,052 were classified as in-state students and 5,172 were out-of-state students as of original enrollment in Tennessee public sector. The state of residence of the remaining 101 students is unknown. Among all out-of-state students, 1,969 (38 percent) could have changed their residency status in the period from the first enrollment and graduation; and the profile of this subsample is reported separately. As the analysis shows, this group of graduates is unique on several sample characteristics.

COLLEGE GRADUATES MIGRATION STUDY | 20
Table 4. Demographic and Academic Profiles of Graduates by Residency status 6
Variables
In-state Out-of-state Out-of-state
moving in-state
All graduates
Number 51,052 5,172 1,969 56,325
Cohort of 2011 48.3% 48.7% 50.1% 48.4%
graduates 2012 51.7% 51.4% 49.9% 51.6%
Sex Female 59.4% 55.1% 58.7% 58.9%
Male 40.6% 45.0% 41.3% 41.1%
Race/ethnicity Asian 2.1% 5.1% 4.0% 2.4%
Black 13.7% 22.9% 23.4% 14.5%
Hispanic 1.9% 3.3% 4.7% 2.0%
White 79.2% 64.1% 61.3% 77.7%
Other 3.2% 4.6% 6.7% 3.4%
Age Adult 41.8% 36.0% 60.2% 41.3%
Non-adult 58.2% 64.0% 39.8% 58.7%
Income Pell-eligible 57.2% 18.7% 43.2% 53.6%
Not Pell-eligible 42.8% 81.3% 56.8% 46.4%
Degree Associate 33.1% 12.1% 24.4% 31.1%
Bachelor 66.9% 87.9% 75.6% 68.9%
Sector Community college 32.0% 10.1% 19.6% 30.0%
Public university 68.0% 89.9% 80.5% 70.0%
Major at Liberal art 19.2% 10.1% 14.8% 18.4%
graduation Business Management 15.3% 17.1% 15.4% 15.3%
Health Professions 12.2% 10.3% 13.5% 12.0%
Other majors 53.2% 62.5% 56.3% 54.3%
6 Due to rounding, percentages may not sum exactly to 100 percent.

COLLEGE GRADUATES MIGRATION STUDY | 21
The cohorts of graduates in AY 2010-11 and AY 2011-12 are similar in terms of the residency categories of students. Slightly higher proportions for the 2012 graduates were due to a larger number of students graduating with associate and bachelor’s degrees in AY 2011-12: 29,048 in 2012 as compared to 27,277 graduates in 2011 (see Table 1 in Part I). The shares of out-of-state students changing their residency status to in-state were almost identical for both cohorts.
Women dominated every residency-based subsample; however, their share was much greater among in-state students than among out-of-state students (18.8 versus 10.1 percent difference). Regarding race/ethnicity, White non-Hispanic graduates made up the majority group in all residence categories; however, their share is much larger for in-state students (58.4 percentage point difference between White and non-White students) than for out-of-state students (a difference of 28.3 percentage points). Stated differently, the respective shares of Black, Hispanic, and Asian graduates were larger for out-of-state students than for in-state students; and this pattern was reverse for White students.
The share of non-adult students (less than 25 years of age) at the time of graduation was larger for out-of-state students than for in-state students: about 28 percentage points higher and 16.4 percentage points higher, respectively. In sharp contrast, there were many more adult students (60.2 percent) than non-adult students (39.8 percent) among students who may have changed their out-of-state residency status to in-state by the time of graduation. The median age for this subsample was 25 as compared to 23 for regular out-of-state students and 24 for in-state students (not reported in Table 4). Only 3.6 percent of this group were classified as military personnel (not reported in Table 4). Although it is impossible to fully explain this 20.4 percentage point difference based on available data, it is certainly worth noting that the group of students changing their residency status from out-of-state to in-state included more adults than any other group.
Although the difference between Pell-eligible and non-Pell-eligible students for the entire sample was just 7.2 percentage points (53.6 and 46.4 percent, respectively), it was strikingly different for in-state and out-of-state students. There were 14.4 percentage points more low-income students among in-state students; in sharp contrast, low-income students represented a much smaller portion of out-of-state students, 62.6 percentage points less than non-Pell-eligible students. This difference decreased to 13.6 percentage points for out-of-state students moving to Tennessee during their studies: 43.2 percent for Pell-eligible students and 56.8 percent for non-Pell-eligible students.
The share of bachelor’s degrees was approximately double the share of associate degrees for the entire sample (68.9 versus 31.1 percent) and for in-state students (66.9 versus 33.1 percent). The difference in degrees was much larger for out-of-state students: 87.9 percent

COLLEGE GRADUATES MIGRATION STUDY | 22
of bachelor’s graduates as compared to 12.1 percent of associate graduates. In a similar vein, 70 percent of the sample graduate from universities and 30 percent from community colleges; the difference between graduates from universities and community colleges was 79.8 versus 36 percentage points for out-of-state and in-state students, respectively.
The share of the three most popular major fields—Liberal Arts, Business Management and Administrative Services, and Health Professions and Related Services—was about 46 percent for the whole sample and for in-state students only. However, these majors made up a smaller proportion of the total for out-of-state students: 37.5 percent. For out-of-state students, the fourth most popular major was Visual and Performing Arts, with 8.6 percent—as opposed to just 3.4 percent for in-state students (not shown in Table 4).
Besides the residency status, another important distinction was degree type (i.e., award level). Recognizing that associate graduates and bachelor’s graduates differ in their outcomes of interest, this study presents the key findings by degree level in addition to discussing the results for the combined sample. Table 5 offers some basic descriptive statistics of the sample by cross-tabulating degree type with the institutional sector and residency status.
Table 5. Graduates by Degree Level, Institutional Sector, and Residency Status
Degree Community colleges Public universities Total
In-state Out-of-state Un-known In-state Out-of-state Un-
known
Associate Number 16,347 523 15 553 100 1 17,539
Share of total 93.2% 3.0% 0.1% 3.2% 0.6% 0.0%
Bachelor Number 0 0 0 34,152 4,549 85 38,786
Share of total 0% 0% 0% 88.1% 11.7% 0.2%
Total 16,347 523 15 34,705 4,649 86 56,325
Table 5 presents some key patterns in the sample. First, it shows that bachelor’s graduates made up the majority: 38,786 graduates or almost 69 percent of the combined sample. Second, over 93 percent of associate graduates were Tennessee residents attending state community colleges. In this group, out-of-state students made up 3.6 percent (the total of community colleges and universities). Third, at public universities—which account for all bachelor’s graduates—over 88 percent were Tennessee residents. Finally, out-of-state students mostly attend four-year schools in Tennessee: Their share at public universities was 11.8 percent as compared to 3.1 percent at community colleges.

COLLEGE GRADUATES MIGRATION STUDY | 23
B. Findings on Post-graduation Migration
Based on the employed definitions of “leavers” and “stayers” (see section Methodology), this section presents and discusses findings on graduate migration patterns. To reiterate, this study follows public college graduates for three year after graduation and determines their post-graduation residency status by employment in Tennessee and, if applicable, subsequent enrollment in higher education institutions in Tennessee or other states. In short, graduates working in the state for more than 25 percent of the observation period (more than three quarters) and/or continuing studies at Tennessee institutions are classified as “stayers”—graduates who choose to stay in Tennessee. All other graduates—not found working or studying in Tennessee or working only temporarily (less than 4 quarters), and enrolling in out-of-state higher education institutions—fall under the definition of “leavers” for migration purposes. The tables and figures in Section B dissect these two main categories of Tennessee public graduates.
Out of 56,325 graduates in the entire sample, 45,382 individuals (80.6 percent) stayed in Tennessee following their graduation from the Tennessee public sector and 10,841 graduates (19.2 percent) moved to other states (Table 6). The migration status of 102 graduates (0.2 percent of the sample) is unknown due to these students missing in the Tennessee Department of Labor’s data; more of these individuals come from the AY 2011 graduates. In other respects, the two cohorts of graduates (from academic years 2010-11 and 2011-12) were very similar in terms of their migration choices following graduation.
Table 6. Graduates by Migration Status and Year of Graduation
Graduates 2010-11 2011-12 Total Share
Moving from TN 5,277 5,564 10,841 19.2%
Staying in TN 21,911 23,471 45,382 80.6%
Unknown status 89 13 102 0.2%
Total 27,277 29,048 56,325
Table 7 presents “leavers” and “stayers” by their migration decisions and residency status at the time of their original enrollment in Tennessee public sector. The shares of graduates staying in Tennessee and moving to other states are shown within each residence-defined group: in-state and out-of-state residents.

COLLEGE GRADUATES MIGRATION STUDY | 24
Table 7. Graduates by Migration Status and Residence at Enrollment
Graduates Residence Total
In-state Out-of-state Unknown
Moving from TN 8,102 15.9% 2,734 52.9% 5 10,841
Staying in TN 42,936 84.1% 2,437 47.1% 9 45,382
Unknown status 14 - 1 - 87 102
Total 51,052
5,172
101 56,325
Table 7 shows that among in-state students, over 84 percent stay in Tennessee after graduation and almost 16 percent move away after their graduation. Thus, state residents are much more likely to stay in Tennessee for work or further studies than to find employment or enroll out of state. In contrast, out-of-state students were split in two almost equal parts in regard to their post-graduation migration patterns: Almost 53 percent of this group move to other states while over 47 percent stay in Tennessee for work or further studies, or both.
Table 8 presents demographic and academic profiles of graduates by their migration status. Unlike Table 4 (in which proportions were summed up across rows), in Table 8, the percentages represent shares of “leavers”, “stayers,” and “unknowns” within each category (variable) of interest. As a result, the percentages sum up to a 100 percent across the columns, and not across rows.
The distribution of graduates across the categories of “stayers” and “leavers” is very similar for both cohorts of graduates, AY 2011 and AY 2012, and mirrors shares for the whole sample reported in Table 6. In sum, slightly over 19 percent of graduates left Tennessee after graduation, and about 80.5 percent stay in the state for work or further postsecondary education.
Among female graduates, 82.4 percent stay in Tennessee and 17.6 percent left the state. For male graduates, a greater proportion left the state (21.7 percent) and a smaller proportion stay in Tennessee (77.9 percent) as compared to females. The shares of stayers and leavers across genders are not invertible; this is due to data predominantly missing for male students. As a result, the shares of stayers and leavers for males could be less accurate than for female graduates. Nonetheless, on a descriptive level, male graduates seem more likely than females to leave the state after earning an associate or bachelor’s degree.

COLLEGE GRADUATES MIGRATION STUDY | 25
Table 8. Demographic and Academic Profiles of Graduates by Migration Status
Variables
Stayers Leavers Unknown All
graduates
Number 45,382 10,841 102 56,325
Cohort of 2011 80.3% 19.4% 0.33% 27,277
graduates 2012 80.8% 19.2% 0.04% 29,048
Sex Female 82.4% 17.6% 0.02% 33,170
Male 77.9% 21.7% 0.41% 23,155
Race/ethnicity Asian 66.0% 34.0% 0% 1,329
Black 81.0% 19.0% 0.02% 8,174
Hispanic 73.5% 26.4% 0.09% 1,127
White 81.4% 18.6% 0.03% 43,759
Other 73.9% 21.6% 4.50% 1,936
Age Adult 80.8% 19.2% 0.05% 23,235
Non-adult 80.4% 19.3% 0.27% 33,090
Income Pell-eligible 84.7% 15.3% 0.03% 30,179
Not Pell-eligible 75.9% 23.8% 0.36% 26,146
Degree Associate 88.8% 11.1% 0.07% 17,539
Bachelor's 76.9% 22.9% 0.23% 38,786
Sector Community college 89.2% 10.8% 0.07% 16,885
Public university 76.9% 22.9% 0.23% 39,440
Major at Liberal art 86.6% 13.3% 0.09% 10,350 graduation Business Management 78.7% 21.1% 0.24% 8,626
Health Professions 88.9% 11.1% 0.06% 6,777 Other majors 77.2% 22.6% 0.22% 30,572

COLLEGE GRADUATES MIGRATION STUDY | 26
A greater proportion of every racial/ethnic group stayed in Tennessee compared to those who left the state. Black and White students demonstrate almost identical patterns: about 81 percent of the respective group found employment and/or continued studies in Tennessee while about 19 percent left the state. The difference between stayers and leavers was smallest for Hispanic graduates and constituted 47.1 percentage points. At the same time, “leavers” made up a higher percentage among Hispanics (26.4 percent) than of White (18.6 percent) and Black (19 percent) graduates. The proportion of leavers was highest for Asian graduates (34 percent); accordingly, this group had the smallest share of students staying in Tennessee (66 percent).
The proportions of adult and non-adult graduates staying in Tennessee and leaving the state were very similar: About 80.5 percent of both groups stayed in the state and over 19 percent left for other states. When broken down by age, data on the migration status did not appear to be missing at random: More non-adult graduates are in the Unknown category. Thus, similar to the Gender category above, the results for adults and non-adults should be interpreted with the missing data pattern in mind.
In the Income category, graduates who had ever been Pell-eligible were more likely to stay in Tennessee than leave the state after graduation. Almost 85 percent of this group stayed in Tennessee, compared to 15 percent who left. In contrast, a much greater proportion of non-Pell-eligible students left the state after graduation (23.8 percent) than stayed in Tennessee (75.9 percent). Importantly, the difference between stayers and leavers was greater for Pell-eligible students (69.4 percent) than among non-Pell-eligible students (52.1 percent). Once again, missing data affected non-Pell-eligible students more than their Pell-eligible counterparts.
Graduates with associate degree were more likely to stay in Tennessee that to leave it: Almost 89 percent were stayers versus over 11 percent moving away. As could be expected, a greater proportion of baccalaureate graduates left the state (22.9 percent) and a smaller proportion stay in Tennessee (76.9 percent), as compared to associate degree graduates. The difference between stayers and leavers was much greater for associate graduates (77.7 percent) than for bachelor’s degree graduates (54 percent). Very similar patterns were observed for institutional sectors, community colleges and public universities. A slight difference was due to two universities awarding a small number of associate degrees.
Migration choices differed by major field at graduation. For graduates in Liberal Arts and Sciences, 86.6 percent stay in Tennessee and about 13.3 percent move away. A larger share of graduates in Business Management and Administrative Services left the state: 21.1 percent. In contrast, Health Professions graduates mostly stayed in Tennessee: 88.9 percent.

COLLEGE GRADUATES MIGRATION STUDY | 27
The above breakdown of Tennessee public graduates into stayers and leavers is quite rough and hides some important migration choices within each group of graduates. The remainder of this sections looks at more refined pathways that associate and bachelor’s graduates take after graduation.
Table 9 presents counts and proportions of graduates staying in Tennessee and leaving the state by 1) their post-graduation migration choice (employment, further studies, and other choices), 2) degree type, and 3) residence at the original enrollment. Some of these post-college choices combine different pathways that will be addressed separately and more fully later in this section.
Table 9. Post-graduation Migration Choices by Degree and Residence at Enrollment
Graduates Degree Residence
Associate Bachelor In-state Out-of-state Unknown
Staying in TN for … 15,575 29,807 42,936 2,437 9
work (work and studies) 13,856 27,598 39,338 2,107 9
89.0% 92.6% 91.6% 86.5% 100.0%
further studies only 1,719 2,209 3,598 330 0
11.0% 7.4% 8.4% 13.5% 0.0%
Moving from TN for … 1,952 8,889 8,102 2,734 5
further studies 288 1,505 1,652 141 0
14.8% 16.9% 20.4% 5.2% 0.0%
other reasons 1,664 7,384 6,450 2,593 5
85.2% 83.1% 79.6% 94.8% 100.0%
Unknown migration choice 12 90 14 1 87
GRAND TOTAL 17,539 38,786 51,052 5,172 101
The majority of stayers found employment in Tennessee: 89 percent of associate graduates and 92.6 percent of bachelor’s graduates; and 91.6 percent of state residents and 86.5 percent of out-of-state residents. Importantly, this group also included graduates who combined employment with continued postsecondary enrollment in Tennessee. The share of graduates who stayed in Tennessee only for subsequent higher education studies was much smaller. Regarding degree type, the share of graduates continuing studies without work was larger for associate graduates (11 percent), compared to bachelor’s degree graduates (7.4 percent). By residency status, more out-of-state graduates (13.5 percent) continued their studies in Tennessee than did in-state graduates (8.4 percent).

COLLEGE GRADUATES MIGRATION STUDY | 28
Graduates who moved away from Tennessee fall under two broad categories: 1) Individuals who pursue further studies at a higher education institution in other states; and 2) Individuals who are not found working in Tennessee or studying anywhere (in Tennessee or elsewhere) during the three years after graduation (referred to as leavers “for other reasons”). The first group’s headcount was dominated by bachelor’s degree graduates and in-state students. In-state students held the greater share (20.4 percent versus 5.2 percent for out-of-state students), while the share of bachelor’s degree graduates (16.9 percent) was only slightly larger than that of associate degree graduates (14.8 percent).
The group of graduates who were not found working in Tennessee or studying anywhere was much larger than the group of leavers continuing their studies out of state. While bachelor’s graduates were more numerous, the relative shares of associate and bachelor’s graduates were similar: 85.2 and 83.1 percent, respectively. In contrast, the difference between out-of-state and in-state students in this category was much larger: 94.8 versus 79.6 percent, respectively. Thus, residents of other states were more likely than in-state residents to leave Tennessee for reasons other than further studies. To summarize, a larger proportion of in-state students than that of out-of-state residents choose to continue higher education in other states. Conversely, out-of-state students are more represented among leavers leaving Tennessee for reasons other than further higher education studies.
One of the key goals of this investigation is construction of the Student Flow Model, which identifies and estimates relative weights of student pathways to 1) college graduation and 2) post-graduation employment and further studies. As part of this broad effort, this study concerns itself with post-graduation pathways that Tennessee public graduates take after graduation with an associate or bachelor’s degree. Below are the headcount and shares of graduates for each pathway for the whole sample and specific subpopulations of interest. All graduate pathways discussed below are based on Figure 2 in the section Conceptual Framework.
Figure 3 presents pathways of Tennessee public graduates for the combined sample of 2011 and 2012 graduates. All graduates are classified into two groups: those who stayed in Tennessee and who left Tennessee for other states during the three-year observation period. Within each group, specific trajectories are estimated regarding the headcount and respective shares of the total.
For the combined sample of the 2011 and 2012 graduates, the migration status of 102 individuals (0.2 percent of the sample) is unknown due to data availability. Figure 3 shows these graduates in a separate box to account for the total number of graduates in the study sample. The omission of this group from subsequent analyses explains why the shares of leavers and stayers do not add up to 100 percent.

COLLEGE GRADUATES MIGRATION STUDY | 29
Figure 3. Pathways of Graduates of Tennessee Public Universities and Community Colleges, AY 2011 and AY 2012
Regarding migration status, 80.6 percent of all graduates stayed in Tennessee for employment and/or further studies and 19.2 percent left the state. Post-college migration choices differed by degree type. Graduates with associate degrees predominantly stayed in Tennessee: 88.8 percent found employment or continue studies in the state as compared to 11.1 percent that were not found in Tennessee. A significantly larger share of graduates with bachelor’s degrees left the state: 22.9 percent; nonetheless, the majority of this group (76.8 percent) stayed in Tennessee.
The distribution of stayers among the identified pathways is detailed below. The bulk of them stay in Tennessee for work, with two distinct trajectories: continuous employment (38.2 percent) and partial employment (18.3 percent). The first pathway requires working for 11-12 quarters during the three-year observation period; the second pathway implies working for 4-10 quarters. Continuous and partial work can be in any employment status (full-time or part-time); subsequent analyses will examine employment status by quarter.
Continuous work in TN17,342 (38.2%)
Partial work in TN (4-10 quarters)S T A Y E D 8,294 (18.3%)
in TN 45,382 (80.6%) Higher ed. enrollment and work in TN
14,180 (31.2%)Associate: 15,575 (88.8%)
Bachelor's: 29,807 (76.8%) Only higher ed. enrollment in TN
Graduates 3,928 (8.7%)
56,325Employed in TN / enrolled out-of-state
Associate: 17,539 (31.1%) 1,638 (3.6%)Bachelor: 38,786 (68.9%)
Higher ed. enrollment in other statesM O V E D 1,793 (16.5%)
from TN 10,841 (19.2%) Employed in TN for < 4 quarters
2,860 (26.4%)Associate: 1,952 (11.1%)Bachelor's: 8,889 (22.9%) Not working in TN or studying anywhere
6,188 (57.1%)
UNKNOWN102 (.2%)

COLLEGE GRADUATES MIGRATION STUDY | 30
A separate group of stayers opted for both work and further studies in Tennessee higher education institutions. This group was quite large: it represented 31.2 percent of all graduates staying in Tennessee, which is second only to the group of continuously employed graduates among the stayers’ pathways.
Graduates who continued their higher education studies in Tennessee without simultaneous employment made up a smaller group accounting for 8.7 percent of all stayers. This group of 3,928 students included 1,719 associate degree graduates (43.8 percent—not shown in Figure 3). A less populated pathway includes graduates who managed to combine in-state employment with out-of-state higher education enrollment at any time and in any enrollment status during the observation period; this group made up 3.6 percent of all graduates staying in Tennessee after their original graduation.
For leavers, three distinct pathways were identified. Figure 3 presents them in the ascending order of shares. First, some graduates of Tennessee public institutions continued their postsecondary studies in other states. Unlike the last pathway for the stayers, these individuals were never employed in Tennessee during the observation period. Due to data availability, their employment status in other states is unknown; so this group includes both working students and non-working students. In the study sample, this pathway accounted for 16.5 percent of all leavers.
The second trajectory of leavers was based on a pre-determined criterion of temporary employment in Tennessee, which does not qualify these graduates as stayers. This group comprises graduates who were employed in the state for 25 percent or less of the observation period; in other words, individuals working in Tennessee for three quarters or fewer (out of 12 quarters of available data) are classified as “eventual leavers” who were employed in Tennessee only temporarily. This pathway made up 26.4 percent of all graduates leaving for other states.
The final leavers’ pathway was the largest one (57.1 percent of all leavers) and included all graduates who were not found working in Tennessee, or studying in Tennessee or anywhere else during three years after graduation. As with any other pathway, this definition is only valid for the duration of the observation period. In other words, some portion of these graduates may return to Tennessee for work or studies after the three-year window following graduation. In fact, the National Student Clearinghouse data shows that about two percent of the whole sample are graduates who re-enroll in Tennessee higher education institutions after the end of the observation period. However, for consistency with the wage/employment data, these graduates were classified as leavers for the purposes of this study.
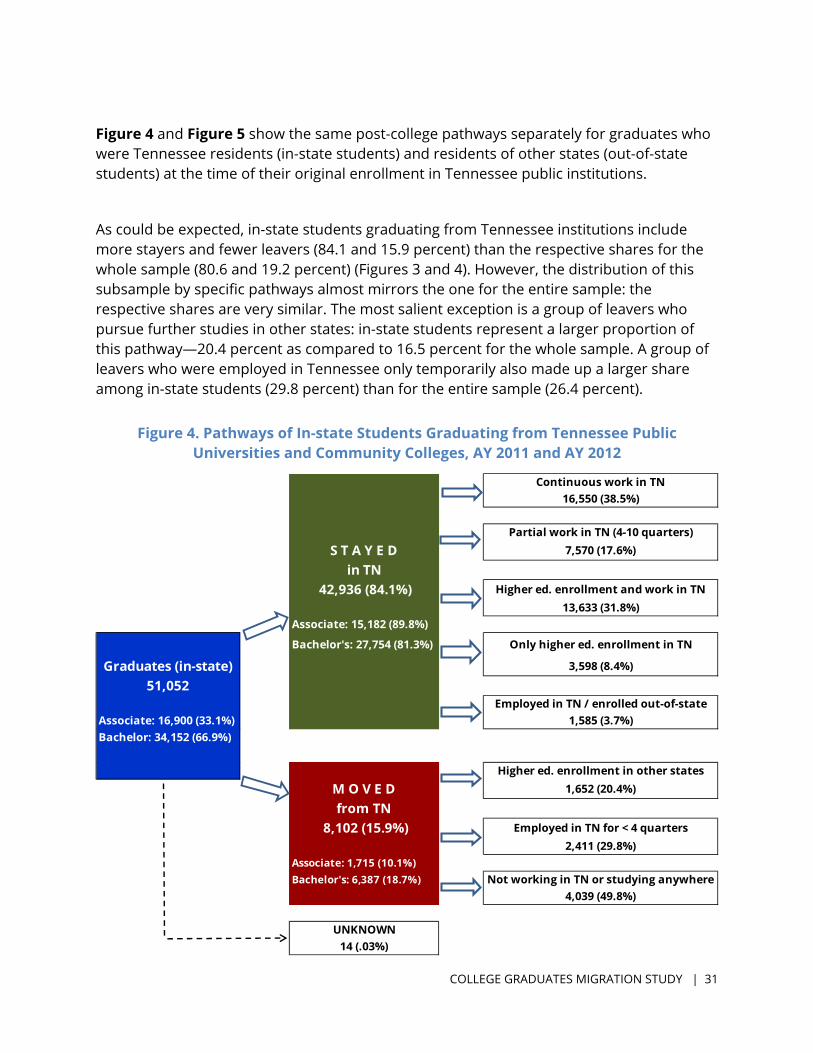
COLLEGE GRADUATES MIGRATION STUDY | 31
Figure 4 and Figure 5 show the same post-college pathways separately for graduates who were Tennessee residents (in-state students) and residents of other states (out-of-state students) at the time of their original enrollment in Tennessee public institutions.
As could be expected, in-state students graduating from Tennessee institutions include more stayers and fewer leavers (84.1 and 15.9 percent) than the respective shares for the whole sample (80.6 and 19.2 percent) (Figures 3 and 4). However, the distribution of this subsample by specific pathways almost mirrors the one for the entire sample: the respective shares are very similar. The most salient exception is a group of leavers who pursue further studies in other states: in-state students represent a larger proportion of this pathway—20.4 percent as compared to 16.5 percent for the whole sample. A group of leavers who were employed in Tennessee only temporarily also made up a larger share among in-state students (29.8 percent) than for the entire sample (26.4 percent).
Figure 4. Pathways of In-state Students Graduating from Tennessee Public
Universities and Community Colleges, AY 2011 and AY 2012
Continuous work in TN16,550 (38.5%)
Partial work in TN (4-10 quarters)S T A Y E D 7,570 (17.6%)
in TN 42,936 (84.1%) Higher ed. enrollment and work in TN
13,633 (31.8%)Associate: 15,182 (89.8%)
Bachelor's: 27,754 (81.3%) Only higher ed. enrollment in TN
Graduates (in-state) 3,598 (8.4%)
51,052Employed in TN / enrolled out-of-state
Associate: 16,900 (33.1%) 1,585 (3.7%)Bachelor: 34,152 (66.9%)
Higher ed. enrollment in other statesM O V E D 1,652 (20.4%)
from TN 8,102 (15.9%) Employed in TN for < 4 quarters
2,411 (29.8%)Associate: 1,715 (10.1%)Bachelor's: 6,387 (18.7%) Not working in TN or studying anywhere
4,039 (49.8%)
UNKNOWN14 (.03%)

COLLEGE GRADUATES MIGRATION STUDY | 32
Figure 5 focuses on out-of-state residents graduating from Tennessee public institutions. As presented earlier (Table 7), 5,172 graduates who were out-of-state students at enrollment divide into two almost equal groups regarding their migration choice. About 47 percent stay in Tennessee for work and/or further studies, and about 53 percent move to other states. Importantly, some pathways for out-of-state students had fewer students than state residents, and thus there is less accuracy in estimating their shares.
In comparison to in-state students (Figure 4), residents of other states made up a smaller proportion of graduates employed in Tennessee continuously (32.3 versus 38.5 percent) or combining employment and studies in the state (22.4 versus 31.8 percent), and a larger proportion of graduates employed partially (29.6 versus 17.6 percent). The pathway of continuing studies in Tennessee institutions without simultaneous work is more preferred by out-of-state students (13.5 percent) as compared to in-state students (8.4 percent).
Figure 5. Pathways of Out-of-state Students Graduating from Tennessee Public Universities and Community Colleges, AY 2011 and AY 2012
Continuous work in TN786 (32.3%)
Partial work in TN (4-10 quarters)S T A Y E D 721 (29.6%)
in TN2,437 (47.1%) Higher ed. enrollment and work in TN
547 (22.4%)Associate: 388 (62.3%)Bachelor's: 2,049 (45%) Only higher ed. enrollment in TN
Graduates (out-of-state) 330 (13.5%)
5,172Employed in TN / enrolled out-of-state
Associate: 623 (12.1%) 53 (2.2%)Bachelor: 4,549 (87.9%)
Higher ed. enrollment in other states
M O V E D 141 (5.2%)
from TN 2,734 (52.9%) Employed in TN for < 4 quarters
449 (16.4%)Associate: 235 (37.7%)Bachelor's: 2,499 (54.9%) Not working in TN or studying anywhere
2,144 (78.4%)
UNKNOWN1
COLLEGE GRADUATES MIGRATION STUDY | 33
It is important to keep in mind that the last group mentioned above—graduates who continued their higher education studies in Tennessee without simultaneous work—was not homogeneous and included both associate and bachelor’s degree graduates. As mentioned earlier, for the whole sample, 43.8 percent of this group (1,719 individuals) were graduates with associate degrees. This share was higher for the in-state students only: Associate graduates made up 45.4 percent of this pathway (1,634 graduates). In contrast, for out-of-state students continuing their studies in Tennessee without employment, associate degree holders represent only 25.8 percent (85 graduates). These proportions were estimated separately and are not shown in Figures 3, 4, or 5.
Because a much greater share of out-of-state students left Tennessee after graduation than state residents, the pathways for leavers demonstrate large proportional differences among these groups. Most notably, only 5.2 percent of leavers from out-of-state residents (141 students) continued their studies in other states as compared to 20.4 percent of in-state students. (The upper panel for stayers in Figure 5 shows that out-of-state residents mostly chose Tennessee institutions for further studies: A total of 877 out-of-state students went on with their studies in Tennessee whether simultaneously working or not.)
The pathway for temporary employment shows that out-of-state residents are less likely than in-state students to work in Tennessee for fewer than four quarters: 16.4 versus 29.8 percent, respectively. Finally, a much higher proportion of out-of-state students (78.4 percent) than state residents (49.8 percent) left Tennessee after graduation without continuing studies elsewhere or working temporary in the state.
It is important to explain the counts of graduates in the Unknown boxes in Figures 3, 4, and 5. The migration status of 102 graduates was unknown (Figure 3): Although they graduated from Tennessee public institutions, they were missing in the TLDS data and thus could not be matched to wage information. Out of this total, 14 graduates were in-state students, and one individual was an out-of-state resident. The state of residence for the remaining 87 graduates was unknown, and they were not included in the totals for in-state and out-of-state students.
Appendices A, B, and C present headcounts and shares of graduate pathways for all graduates in the sample, and for in-state and out-of-state students separately by Tennessee public university. Appendices D, E, and F do the same for graduates of Tennessee community colleges. Appendix G shows post-graduation pathways for graduates who could have changed their residency status from out-of-state to in-state by the time of graduation. The graduate pathways in the Appendices correspond to the ones identified in the Conceptual Framework and used in Figures 3, 4 and 5 in this section.

COLLEGE GRADUATES MIGRATION STUDY | 34
C. Findings on Labor Market Outcomes of College Graduates
In addition to the migration patterns of Tennessee public college graduates, this investigation examines the following key labor market outcomes: employment status and median wage. The study looks at these outcomes at specified periods after graduation and their changes over time. The Methodology section describes how both variables are operationalized and handled.
Two alternative approaches to reporting labor market outcomes are used in this section. In Approach I, employment data are reported for the respective period (year or quarter) starting immediately after graduation. Under this approach, three years of data were available for analysis. In Approach II, the graduates were given two quarters to find employment. Thus, employment status and typical wage were estimated with a six-month delay after the graduation, and only two full years of wage data were used for analysis.
1. Employment Status of Tennessee Public Graduates
As explained earlier (see Methodology), actual employment status (full-time versus part-time) is not available. The definition of employment status used in this study was derived from the minimum wage and the number of working hours in a respective period (quarter or year). In short, individuals whose reported wage exceeded an estimated “threshold” for a given period were considered employed full-time; those who earned below the threshold were considered employed part-time. Therefore, care should be taken to understand the true meaning of the derived variable and to not confuse it with actual employment status.
Table 10 shows employment status of Tennessee public college graduates by year after graduation under Approach I. These numbers are the counts of employed individuals regardless of their other pathways; in other words, this table does not differentiate between graduates who only work and graduates who combine employment with further studies. Data for 102 graduates were not available.
In Year 1 after graduation, 42,593 graduates were employed: 62.3 percent as full-time employees and 37.7 percent as part-time workers. In Year 2, the number of employed individuals decreased to 40,660, and the share of full-time employed graduates rose to 72.6 percent of the total. In Year 3, full-time employed graduates constituted 79.1 percent, as opposed to 20.9 percent working part-time. Almost 21,000 graduates worked full-time during the whole observation period, and about 3,200 graduates opted for part-time employment only during the same three-year period.

COLLEGE GRADUATES MIGRATION STUDY | 35
Table 10. Employment Status of Graduates by Year after Graduation: Approach I
Employment status Year 1 Year 2 Year 3
All three years
Full-time 26,527 62.3% 29,499 72.6% 31,043 79.1% 20,997
Part-time 16,066 37.7% 11,161 27.4% 8,211 20.9% 3,206
Total 42,593
40,660
39,254
In sum, the number and proportion of graduates who worked full-time increased over time. This trend was reversed for individuals who worked part-time. At the same time, the total number of graduates employed in Tennessee decreased each year. Between Year 1 and Year 3, the decline was 7.8 percent. These changes were due to both migration decisions of graduates and their pursuits after the original college graduation.
Table 11 presents similar data under Approach II—that is, with a six-month gap after graduation allowing graduates to secure employment. As a result, only two years of data are presented.
Table 11. Employment Status of Graduates by Year after Graduation: Approach II
Employment status Year 1 Year 2
Full-time 28,626 69.1% 30,511 75.8%
Part-time 12,817 30.9% 9,743 24.2%
Total 41,443
40,254
The trends observed under Approach II were similar to the ones in Table 10. The share of full-time employed individuals rose—and, antithetically, the proportion of graduates working part-time dropped—by 6.7 percentage point between Year 1 and Year 2. The total number of graduates employed in Tennessee declined by 2.9 percent.

COLLEGE GRADUATES MIGRATION STUDY | 36
The data presented in Tables 10 and 11 are reported for the whole year and may disguise other options that graduates could pursue in addition to employment. Table 12 below offers a more nuanced look at post-graduation employment and enrolment statuses of public college graduates by quarter after graduation. Approach I is used in this table so that twelve quarters of data (three full years) are available for comparison and analysis.
Table 12 shows counts of graduates by specific outcome and quarter: [I] In-state outcomes—1) full-time or part-time employment in Tennessee, 2) full-time or part-time enrollment in in a Tennessee higher education institution, or 3) combination of employment and enrollment in Tennessee; and [II] Out-of-state outcomes—1) enrollment in an out-of-state college, and 2) all other outcomes (not found employed in Tennessee or enrolled anywhere). The in-state and out-of-state totals and shares report the totals for the in-state and out-of-state pathways. In each quarter, the number of students found in Tennessee and not found in Tennessee add up to the grand total of 56,325; and the in-state and out-of-state shares made up 100 percent.
It should be noted that the employment and enrollment status—and their combination, if any—of an individual could change from quarter to quarter. Thus, the same graduate could belong to different sub-groups (post-college pathways) identified in Table 12 in different quarters. Therefore, quarters represent distinct snapshots of data, and care should be exercised when interpreting longitudinal trends.
Comparing the in-state and out-of-state shares, one can see that they remain quite stable over time: The share of students found working and/or studying in Tennessee fluctuated around 70 percent of the total, with students who moved away accounting for the rest. At the same time, there was a slight drop in the in-state share—and a simultaneous increase in the out-of-state share—in Year 3 (quarters 9-12).
There was an obvious increase in the number of graduates employed full-time and a rapid decline in the number of individuals working part-time across the three years. For students who continue their higher education studies without simultaneous employment, the number of students enrolled full-time increased with time, and the number of part-time enrollees decreased during the observation period. The number of students enrolled in higher education institutions in other states increased steadily over time. The number of students who did not work or study in Tennessee (All others) in each quarter gradually declined during the observation period.
Appendices H and I present the same information for in-state and out-of-state students separately.

COLL
EGE
GRA
DU
ATES
MIG
RATI
ON
STU
DY
| 3
7
Tabl
e 12
. Em
ploy
men
t an
d En
rollm
ent
Stat
uses
of P
ublic
Gra
duat
es b
y Q
uart
er a
fter
Gra
duat
ion
IN T
ENN
ESSE
E Q
1
Q 2
Q
3
Q 4
Q
5
Q 6
Q
7
Q 8
Q
9
Q 1
0 Q
11
Q 1
2
1.
Empl
oym
ent
full-
tim
e 21
,031
23
,697
24
,399
24
,877
25
,680
25
,887
25
,748
26
,372
27
,454
27
,834
27
,552
28
,390
part
-tim
e 11
,959
7,
554
6,85
3 5,
682
6,26
7 4,
765
4,75
7 4,
213
5,00
5 3,
946
4,34
3 3,
632
2.
Enro
llmen
t in
a c
olle
ge
full-
tim
e 1,
316
3,13
6 3,
026
3,08
2 1,
813
2,91
6 2,
813
2,63
4 1,
356
1,72
0 1,
549
1,70
9
part
-tim
e 1,
071
999
955
1,02
8 1,
144
955
936
952
914
778
733
593
3.
Empl
oym
ent
& e
nrol
lmen
t 3,
151
4,98
6 5,
140
5,82
8 4,
317
5,16
3 5,
285
5,39
5 3,
629
3,82
6 4,
042
3,52
3
IN-S
TATE
TO
TAL
38,5
28
40,3
72
40,3
73
40,4
97
39,2
21
39,6
86
39,5
39
39,5
66
38,3
58
38,1
04
38,2
19
37,8
47
IN-S
TATE
SH
ARE
68
.4%
71
.7%
71
.7%
71
.9%
69
.6%
70
.5%
70
.2%
70
.2%
68
.1%
67
.7%
67
.9%
67
.2%
OU
T-O
F-ST
ATE
1.
Enro
llmen
t in
a c
olle
ge
386
1,10
0 1,
119
1,27
5 1,
072
1,55
4 1,
553
1,60
9 1,
197
1,53
8 1,
498
1,58
6
2.
All
othe
r pa
thw
ays
17,4
11
14,8
53
14,8
33
14,5
53
16,0
32
15,0
85
15,2
33
15,1
50
16,7
70
16,6
83
16,6
08
16,8
92
OU
T-O
F-ST
ATE
TO
TAL
17,7
97
15,9
53
15,9
52
15,8
28
17,1
04
16,6
39
16,7
86
16,7
59
17,9
67
18,2
21
18,1
06
18,4
78
OU
T-O
F-ST
ATE
SH
ARE
31
.6%
28
.3%
28
.3%
28
.1%
30
.4%
29
.5%
29
.8%
29
.8%
31
.9%
32
.3%
32
.1%
32
.8%
GRA
ND
TO
TAL
56,3
25
56,3
25
56,3
25
56,3
25
56,3
25
56,3
25
56,3
25
56,3
25
56,3
25
56,3
25
56,3
25
56,3
25

COLLEGE GRADUATES MIGRATION STUDY | 38
Two things are important for the purposes of the current analysis: examining the status of graduates at the end of the observation period and contrasting outcomes by the students’ residency status. Figures 6 and 7 present the employment and enrollment statuses, and other outcomes, of public graduates for in-state and out-of-state students separately. The reported numbers do not match Table 12 for all graduates but match Appendices H and I.
Figure 6. Employment and Enrollment Status of In-state Students as of Quarter 12 7
Figure 6 shows that at the end of the observation period, in-state students graduating from Tennessee public institutions were predominantly employed full-time (53 percent of all state residents). The second biggest group for Tennessee residents included graduates who were not found working or studying in Tennessee in Quarter 12: 26.4 percent. A total of 13.4 percent of in-state students were either employed part-time or combine employment with further studies at the end of Year 3. Full-time enrollment in Tennessee institutions and enrollment out-of-state each accounted for about three percent of the in-state student distribution in Quarter 12. Based on the final quarter snapshot, in-state students graduating from Tennessee public institutions tended to eventually stay in Tennessee for full-time employment.
7 The residency status of 101 graduates was unknown.

COLLEGE GRADUATES MIGRATION STUDY | 39
Figure 7. Employment and Enrollment Status of Out-of-State Students as of Quarter 12 8
The patterns observed for out-of-state students at the end of the observation period were the reverse of the ones for in-state students (Figure 7). In Quarter 12, 63.8 percent of out-of-state students were not found working or studying in Tennessee. Only 25.6 percent of this group work full-time in the state at the end of Year 3, and the shares of other pathways were much smaller. Based on the snapshot of Quarter 12, out-of-state students were more likely to eventually leave Tennessee.
To be sure, the numbers and proportions received when using only the final quarter of the observation period do not match the annual estimates in other tables or figures. The reader is cautioned to remember that estimates are sensitive to the period under analysis and the definition employed, and that employment and enrollment statuses are prone to change throughout the entire period of observation. Nevertheless, contrasting annual and quarter-specific estimates allows for making more definitive conclusions about the post-college outcomes of Tennessee public graduates.
8 The residence status of 101 graduates is unknown.

COLLEGE GRADUATES MIGRATION STUDY | 40
2. Typical Wage of Tennessee Public Graduates
A key labor market outcome of interest is a typical wage of graduates of Tennessee public colleges and universities and its change over time. In this report, the median wage is used as the typical wage of graduates due to skewness of the wage distribution. (The average wage was higher for the right-skewed data because of the mean’s sensitivity to extreme values.) When appropriate, the 25th and 75th percentile of the wage distribution are also reported. To reiterate, two approaches to reporting wages are employed. In Approach I (three reporting years), the time counter started immediately after graduation, and all earnings made in a year were included in the annual wage total. In Approach II (two reporting years), the time counter started after a six-month gap: graduates were allowed two quarters to find employment.
Tables 13 and 14 show estimates of the median wage of public college graduates using Approach I and Approach II. These are annual wages for the combined sample.
Table 13. Median Wage of Public Graduates by Year: Approach I
Time after graduation Median wage 25% 75% N
Year 1 $18,176 $8,133 $31,244 42,695
Year 2 $25,026 $11,775 $38,021 40,762
Year 3 $29,720 $15,784 $42,488 39,356
The median wage of graduates increased over time. For the combined sample of associate and bachelor’s graduates, it rose by 63.5 percent from Year 1 to Year 3. The spread of data also increased with time, as evidenced by the difference in the 75th and 25th percentile.
Table 14. Median Wage of Public Graduates by Year: Approach II
Time after graduation Median wage 25% 75% N
Year 1 $22,145 $10,351 $35,538 41,545
Year 2 $27,179 $13,577 $40,184 40,356

COLLEGE GRADUATES MIGRATION STUDY | 41
Using Approach II, the annual wage estimates for the respective year predictably increased. In general, Approach II gives a more realistic picture of earnings because the downtime due to job searching does not influence the results.
Table 15 presents the median, and the 25th and 75th percentile of the wage distribution by quarter, starting with the first quarter following graduation (Approach I). In sync with the annual data, the quarterly median wage gradually increased from period to period, and the data spread also grew over time. When comparing annual and quarterly estimates, one should keep in mind that individuals do not necessarily work all quarters in a year, and the annual wage is a sum of everything earned in that year regardless of number of quarters worked and employment status.
Table 15. Median Wage of Public Graduates by Quarter
Quarter after graduation Median wage 25% 75% N
Quarter 1 $4,335 $2,237 $7,308 36,141
Quarter 2 $5,518 $2,990 $8,836 36,237
Quarter 3 $5,915 $3,169 $9,259 36,392
Quarter 4 $6,375 $3,454 $9,725 36,387
Quarter 5 $6,500 $3,588 $9,822 36,264
Quarter 6 $7,215 $4,049 $10,322 35,815
Quarter 7 $7,239 $4,074 $10,413 35,790
Quarter 8 $7,650 $4,359 $10,830 35,980
Quarter 9 $7,635 $4,488 $10,903 36,088
Quarter 10 $8,366 $5,075 $11,252 35,606
Quarter 11 $7,978 $4,804 $11,230 35,937
Quarter 12 $8,680 $5,448 $11,647 35,545
The combined estimates for all graduates in the sample presented in Tables 13, 14, and 15 disguise differences by degree, major, demographics, or employment status. The remainder of this section looks at the typical wage by category of graduates.

COLLEGE GRADUATES MIGRATION STUDY | 42
It is to be expected that wage will differ by degree level earned. Table 16 shows the median wage by degree and year after graduation under both Approach I and Approach II. The table demonstrates a large difference in salaries between associate and bachelor’s graduates and its tendency to increase with time. Using Approach II, one can see that the difference in the median earnings grew from 2,485 in Year 1 to 5,541 in Year 2.
Table 16. Median Wage of Public Graduates by Degree and Year
Degree Approach I Approach II
Year 1 Year 2 Year 3 Year 1 Year 2
Associate $17,991 $21,534 $26,508 $20,436 $23,450
Bachelor’s $18,268 $26,464 $31,101 $22,922 $28,991
Difference 277 4,930 4,593 2,485 5,541
The typical wage is a function of the employment status during the period of interest. Table 17 shows the median annual wage by employment status and year after graduation. Under both Approach I and Approach II, the median wage of full-time employed graduates was about 5-6 times larger than that of part-time employed individuals. To be sure, employment status is closely related to other post-graduation choices that graduates make, especially regarding further higher education studies. Therefore, later in this section, the employment status will be juxtaposed with the following three options: joining a labor market, continuing higher education studies full-time, and continuing higher education studies part-time.
Table 17. Median Wage by Employment Status and Year
Employment status Approach I
Approach II
Year 1 Year 2 Year 3
Year 1 Year 2
Full-time $27,511 $32,288 $35,016
$30,189 $33,685
Part-time $5,648 $5,606 $6,046
$5,874 $5,920
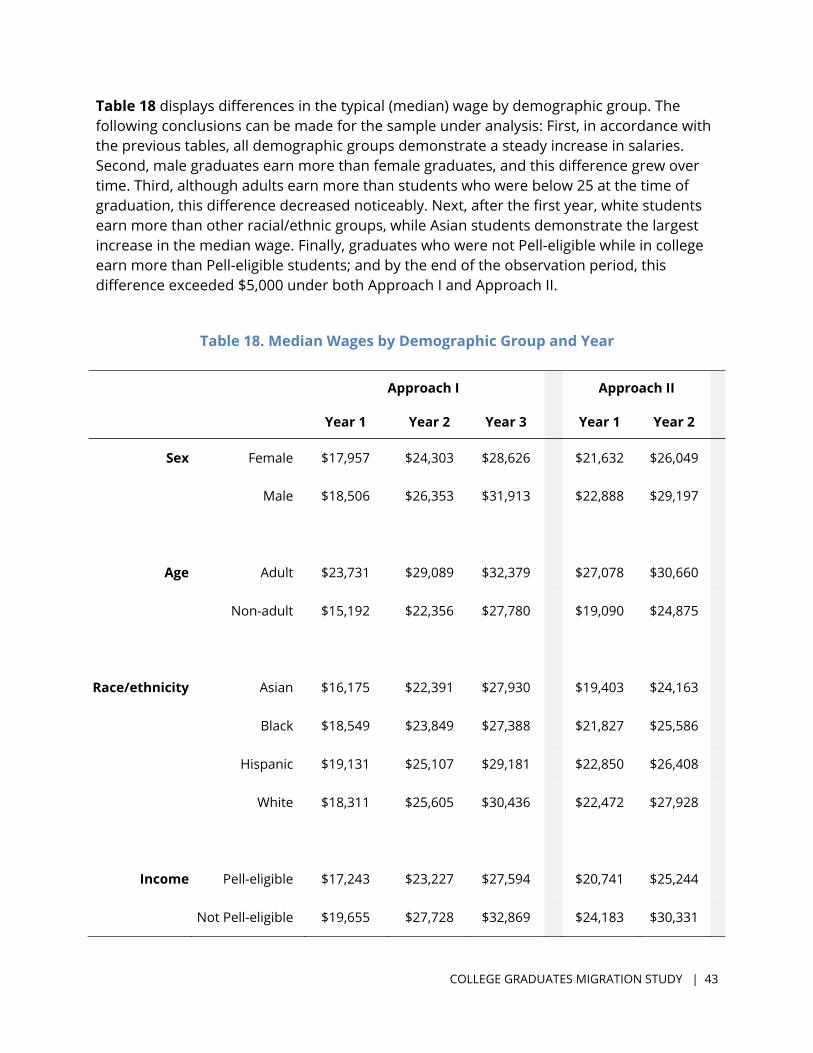
COLLEGE GRADUATES MIGRATION STUDY | 43
Table 18 displays differences in the typical (median) wage by demographic group. The following conclusions can be made for the sample under analysis: First, in accordance with the previous tables, all demographic groups demonstrate a steady increase in salaries. Second, male graduates earn more than female graduates, and this difference grew over time. Third, although adults earn more than students who were below 25 at the time of graduation, this difference decreased noticeably. Next, after the first year, white students earn more than other racial/ethnic groups, while Asian students demonstrate the largest increase in the median wage. Finally, graduates who were not Pell-eligible while in college earn more than Pell-eligible students; and by the end of the observation period, this difference exceeded $5,000 under both Approach I and Approach II.
Table 18. Median Wages by Demographic Group and Year
Approach I Approach II
Year 1 Year 2 Year 3 Year 1 Year 2
Sex Female $17,957 $24,303 $28,626 $21,632 $26,049
Male $18,506 $26,353 $31,913 $22,888 $29,197
Age Adult $23,731 $29,089 $32,379 $27,078 $30,660
Non-adult $15,192 $22,356 $27,780 $19,090 $24,875
Race/ethnicity Asian $16,175 $22,391 $27,930 $19,403 $24,163
Black $18,549 $23,849 $27,388 $21,827 $25,586
Hispanic $19,131 $25,107 $29,181 $22,850 $26,408
White $18,311 $25,605 $30,436 $22,472 $27,928
Income Pell-eligible $17,243 $23,227 $27,594 $20,741 $25,244
Not Pell-eligible $19,655 $27,728 $32,869 $24,183 $30,331

COLLEGE GRADUATES MIGRATION STUDY | 44
A critical outcome of interest is the graduates’ typical wage by major at graduation and its change over time. The median wage by major is expected to vary by degree earned and increase from period to period. Thus, major-specific wage should be examined further by degree and year after graduation.
Table 19 presents a breakdown of the wage data by major, degree, and year using Approach II (that is, allowing graduates two quarters to find employment). In addition to showing median wages by degree type, the table also displays a difference between wages by degree type, when appropriate and available.
The following patterns were observed in Table 19. First, within each degree type, the median wage increased in Year 2. Second, four broad major fields demonstrate much larger median wages for bachelor’s graduates when compared to associate degree graduates: Liberal Arts and Sciences, Computer and Information Sciences, Education, and Engineering. With the exception of Liberal Arts and Sciences, this difference grew larger in Year 2. Next, in Year 1, graduates with associate degrees in the following majors earn, on average, more than bachelor’s graduates: Trades and Industrial, Protective Services and Public Affairs, and Visual and Performing Arts. However, this trend only persisted into the second year for Trades and Industrial. It is also important that the sample size for this major was small: 40 associate graduates and 154 bachelor’s graduates in Year 1 and 42 associate graduates and 140 bachelor’s graduates in Year 2. Thus, some of the observed difference can be attributed to the lack of precision in estimates of the median wage.
Appendix J presents the median wage by major, degree, and year after graduation using Approach I, that is, estimating annual wages starting immediately after graduation. This approach allows for calculating annual wage for three years after graduation. In general, the trends and patterns in wage distribution in Appendix I (Approach I) are similar to the ones identified in Table 19 (Approach II).

COLLEGE GRADUATES MIGRATION STUDY | 45
Table 19. Median Wage by Major, Degree, and Year: Approach II 9
Major at graduation Year 1 Year 2
Associate Bachelor Difference Associate Bachelor Difference
Agriculture (small n) $19,931 NA (small n) $26,797 NA
Architecture & Related Programs - $25,480 NA - $29,791 NA
Area, Ethnic & Cultural Studies - $13,263 NA - $19,821 NA
Biological Sciences / Life Sciences (small n) $13,505 NA (small n) $16,681 NA
Business Management & Ad. Services $22,653 $27,592 4,939 $26,362 $34,454 8,092
Communications $15,767 $18,753 2,985 $19,689 $23,503 3,814
Computer & Information Sciences $29,373 $40,433 11,060 $32,661 $47,622 14,961
Education $7,718 $26,584 18,865 $12,870 $32,860 19,991
Engineering $29,639 $43,291 13,652 $34,121 $50,145 16,023
English Language & Literature - $14,650 NA - $20,134 NA
Foreign Languages & Literatures (small n) $17,001 NA (small n) $20,954 NA
Health Professions & Related Services $40,890 $43,822 2,932 $43,067 $45,568 2,501
Home Economics $16,800 $18,871 2,071 $18,294 $24,666 6,371
Law & Legal Studies $20,988 (small n) NA $24,773 (small n) NA
Liberal Arts & Sciences $12,167 $25,550 13,383 $15,247 $28,345 13,099
Mathematics - $23,393 NA - $34,741 NA
Military Sciences - $25,551 NA - $36,837 NA
Multi/Interdisciplinary Studies - $23,370 NA - $28,584 NA
Parks, Recreation, Leisure & Fitness - $15,224 NA - $20,671 NA
Personal Improvement & Leisure Pr. $24,536 - NA $24,774 - NA
Philosophy, Religion & Theology - $9,819 NA - $13,762 NA
Physical Sciences - $14,328 NA - $21,167 NA
Protective Services & Public Affairs $24,570 $22,566 -2,004 $26,996 $27,387 391
Psychology - $16,342 NA - $21,390 NA
Social Sciences (small n) $16,745 NA (small n) $22,770 NA
Technology Educ. / Industrial Arts $29,592 - NA $31,696 - NA
Trades and Industrial $26,677 $19,250 -7,427 $30,209 $21,349 -8,859
Visual & Performing Arts $16,554 $15,541 -1,013 $17,667 $20,482 2,815
9 The cut-off for a small sample size (small n) is 25 graduates in a cell.

COLLEGE GRADUATES MIGRATION STUDY | 46
Finally, as discussed previously, the typical wage is a function of specific post-graduation choices that graduates make. Typical values disguise differences among the medians for at times vastly different post-college pathways. Of primary analytical importance are the differences in the median wage for the following groups of graduates: those who went into the labor market without further studies, and those who combined employment with continued higher education studies. These options produce different combinations of full-time or part-time employment and full-time or part-time enrollment, if any.
Table 20 shows the median wage for various groups of graduates depending on whether they worked full-time or part-time and whether they enrolled in a higher education institution as full-time or part-time students in a given period. For each year after graduation, the part-time wage is contrasted with the full-time wage. The “overall median wage” for each pathway and year includes both part-time and full-time employed individuals. Approach I to wage reporting (that is, with no lag after graduation) was used so that the unlagged enrollment status would match the wage data.
The first pathway includes graduates who joined the labor force without simultaneous enrollment in higher education institutions. The overall median wage of these graduates grew over time. However, one can see that the median wage for part-time employed individuals was stagnant, and the overall growth is attributable to an increase in full-time employment wages. The median wage of full-time employed graduates in this category grew by about 27 percent (from $28,528 to $36,175) between Year 1 and Year 3 following graduation.
The second pathway includes graduates who continue their higher education studies full-time while also working. As expected, these graduates earn much less that the ones choosing the first pathway (going into the labor market without further studies), and those who manage to work full-time have a much higher median salary than their part-time employed counterparts. Once again, the growth in the overall median salary over time was due to an increase in the median wage of full-time employed individuals. Graduates who combine full-time studies with full-time enrollment increase their wage by 26 percent (from $21,025 to $26,482) between Year 1 and Year 3.
The third pathway—graduates who combine a part-time higher education enrollment with employment—provided for higher median salaries than the ones for the second pathway in every employment status. At the same time, graduates in this category earn less than individuals who went directly into the labor force (first pathway). In the third pathway, the median wage for part-time employed individuals grew by 9.7 percent (from $5,539 to $6,075) between Year 1 and Year 3; for graduates who were employed full-time, it grew by 26.5 percent (from $25,482 to $32,233).

COLLEGE GRADUATES MIGRATION STUDY | 47
Table 20. Median Wage by Graduates’ Post-college Pathways: Approach I
PATHWAY
YEAR 1 YEAR 2 YEAR 3
Employed Employed Employed
Part-time Full-time Overall Part-time Full-time Overall Part-time Full-time Overall
1. Working only $6,189 $28,528 $21,341 $6,158 $33,416 $28,755 $6,171 $36,175 $32,852
2. Enrolled full-time $4,423 $21,025 $7,268 $4,699 $24,105 $9,835 $5,387 $26,482 $13,081
3. Enrolled part-time $5,539 $25,482 $13,947 $5,511 $29,654 $17,738 $6,075 $32,233 $23,071
COLLEGE GRADUATES MIGRATION STUDY | 48
Part III: Post-graduation Migration: Conclusion
This report presents study findings on post-college migration and labor market outcomes of public higher education students in Tennessee. Additionally, it details the main pathways of Tennessee public college graduates as part of the Student Flow Model.
This investigation stemmed from the need to understand how post-graduation migration affects educational attainment and economic and social development in the state. Tennessee is in constant competition with other states for college graduates and educated workforce. Although many policies have been adopted to keep Tennessee students and graduates in state and attract residents of other states, information about graduates who stay in state or move back to Tennessee after graduation is still scant. A major barrier to getting these answers is the need for data from databases housed in multiple agencies.
The study examined migration patterns of Tennessee public college graduates, out-of-state students graduating from state institutions, and some Tennessee residents attending out-of-state institutions. Specifically, it addressed the following research questions: How many in-state students stay in Tennessee for employment or further studies after graduation? How many out-of-state students who graduate from Tennessee institutions stay in the state after graduation? What are the main pathways of public college graduates? What are their labor market outcomes? How do these outcomes vary by institutional and student characteristics? How do these outcomes change over time?
The study sample included associate and bachelor’s graduates of Tennessee public higher education institutions in academic years 2010–11 and 2011–12. The graduates were observed for three years after graduation. The data were obtained from three sources: 1) Data on public college graduates from the Student Information System managed by the Tennessee Higher Education Commission; 2) Data on subsequent postsecondary enrollment from the National Student Clearinghouse; and 3) Data on employment outcomes from the Tennessee Department of Labor and Workforce Development via the Tennessee Longitudinal Data System.
The study found that for all graduates in the sample:
- About 80 percent of graduates stayed in Tennessee for work or further postsecondary studies, while about 20 percent left the state.
- Graduates with bachelor’s degrees were more likely to leave the state (23 percent) than graduates with associate degrees (11 percent).

COLLEGE GRADUATES MIGRATION STUDY | 49
- Among graduates staying in Tennessee, the most popular pathways were: 1) Combining work with subsequent postsecondary studies (about 35 percent of all “stayers” and nearly 45 percent of associate degree graduates), and 2) Working in the state continuously after graduation (38 percent of “stayers”).
- Over 18 percent of “stayers” worked in Tennessee partially (i.e. between 4 and 10 quarters of the 12-quarter study period).
- Over time, the proportion of graduates staying in Tennessee remained stable, varying between 67 and 72 percent in each quarter.
- Among graduates leaving Tennessee, over 26 percent worked in state for 3 quarters or less during the study period; 16.5 percent continued higher education studies in other states.
- About 57 percent of “leavers” did not work in Tennessee even temporarily and did not pursue higher education studies anywhere.
Migration and employment outcomes differed by student, institutional, and employment characteristics, and changed over time.
- While 84 percent of in-state students stayed in Tennessee after graduation, only 47 percent of out-of-state students did.
- About 55 percent of out-of-state students graduating with a bachelor’s degree left Tennessee after graduation, while less than 19 percent of in-state bachelor’s degree graduates did.
- The share of out-of-state students graduating and staying in Tennessee gradually decreased over time.
- The share of graduates employed full-time increased, while the proportion of individuals working part-time decreased.
- Graduates who joined the labor market without further studies earned more that students who combined employment with further postsecondary enrollment.
- Students who were enrolled part-time had a higher median wage than individuals who were enrolled full-time.
- The following groups demonstrated a higher median wage than their counterparts: bachelor’s degree graduates; male, adult, White graduates; individuals who were not Pell-eligible; and individuals who worked full-time without further studies.
The findings of the current investigation may have consequences for several policy domains. The study results are important for design and implementation of state policies that aim to staunch brain drain and attract more out-of-state students and college graduates to Tennessee. Specifically, the following policy areas may benefit from this

COLLEGE GRADUATES MIGRATION STUDY | 50
research: setting in-state and out-of-state tuition fees for Tennessee postsecondary institutions; determining eligibility requirements for, providing, and allocating state student financial aid across student demographic groups; participation in the Academic Common Market and other interstate consortia; providing employment opportunities for students and graduates of higher education institutions in the state; elevating Tennessee’s status as a policy innovation leader; and others.
The nature and complexity of the study emphasize the need for deeper integration of national and state data sources in response to challenges facing higher education in the United States. This research demonstrates how addressing complex questions requires developing longitudinal student-level tracking systems; integration of state and national data sources; and collaboration across levels of the education system and government agencies. More complex policy issues facing higher education make this collaboration increasingly necessary. As this study illustrates, the main benefit of such collaboration will be the use of multiple databases to maximize efficiency.
The future research of post-college migration patterns will focus on two key areas: first, examination of post-graduation outcomes for Tennessee residents graduating from out-of-state institutions and, second, quantitative studies on factors that drive interstate migration decisions of college students and graduates. These investigations will require more intensive collaboration with other federal and state agencies and longitudinal data collection for several cohorts of Tennessee students and graduates. Their future findings will be critical for implementation of higher education policies in the state and attainment of goals set in the 2015-2025 Master Plan and Drive to 55 initiatives.

COLL
EGE
GRA
DU
ATES
MIG
RATI
ON
STU
DY
| 5
1
App
endi
x A
. Pat
hway
s of
Gra
duat
es o
f Ten
ness
ee P
ublic
Uni
vers
itie
s, A
Y 20
11 a
nd A
Y 20
12
Gra
duat
esSt
ayer
sLe
aver
sU
nkn
own
Cont
inuo
us
empl
oym
ent
in T
N
Part
ial
empl
oym
ent
in T
N
Empl
oym
ent
+ St
udie
s in
TN
HE
stud
ies
in T
N o
nly
Empl
oym
. in
TN +
Stu
dies
ou
t-of
-sta
te
HE
stud
ies
out-
of-
stat
e
Empl
oyed
in
TN
for
≤
3 qu
arte
rs
Not
foun
d in
TN
APS
U2,
960
2,04
891
02
816
407
478
242
105
167
176
567
69.2
%30
.7%
39.8
%19
.9%
23.3
%11
.8%
5.1%
18.4
%19
.3%
62.3
%
ETS
U4,
146
3,18
995
61
1,26
266
390
127
291
119
255
582
76.9
%23
.1%
39.6
%20
.8%
28.3
%8.
5%2.
9%12
.4%
26.7
%60
.9%
MTS
U7,
722
6,18
81,
533
13,
008
1,40
81,
295
289
188
231
500
802
80.1
%19
.9%
48.6
%22
.8%
20.9
%4.
7%3.
0%15
.1%
32.6
%52
.3%
TSU
2,15
91,
691
466
264
931
954
877
9879
122
265
78.3
%21
.6%
38.4
%18
.9%
32.4
%4.
6%5.
8%17
.0%
26.2
%56
.9%
TTU
3,27
92,
666
610
31,
299
561
603
147
5692
158
360
81.3
%18
.6%
48.7
%21
.0%
22.6
%5.
5%2.
1%15
.1%
25.9
%59
.0%
UoM
5,35
54,
214
1,14
11,
723
898
1,00
325
533
516
932
265
0
78.7
%21
.3%
40.9
%21
.3%
23.8
%6.
1%7.
9%14
.8%
28.2
%57
.0%
UTC
2,81
12,
240
544
2793
350
355
415
991
123
167
254
79.7
%19
.4%
41.7
%22
.5%
24.7
%7.
1%4.
1%22
.6%
30.7
%46
.7%
UTK
8,89
06,
390
2,46
139
2,17
01,
425
1,80
875
822
946
754
71,
447
71.9
%27
.7%
34.0
%22
.3%
28.3
%11
.9%
3.6%
19.0
%22
.2%
58.8
%
UTM
2,11
81,
701
401
1676
933
142
210
376
7494
233
80.3
%18
.9%
45.2
%19
.5%
24.8
%6.
1%4.
5%18
.5%
23.4
%58
.1%
TOTA
L39
,440
30,3
279,
022
9112
,629
6,51
57,
612
2,30
21,
269
1,52
12,
341
5,16
0
Stay
ers
Leav
ers
Gen
eral
cou
nts
Uni
vers
ity

COLL
EGE
GRA
DU
ATES
MIG
RATI
ON
STU
DY
| 5
2
App
endi
x B.
Pat
hway
s of
In-s
tate
Stu
dent
s G
radu
atin
g fr
om T
enne
ssee
Pub
lic U
nive
rsit
ies,
AY
2011
and
201
2
Gra
duat
esSt
ayer
sLe
aver
sU
nkn
own
Cont
inuo
us
empl
oym
ent
in T
N
Part
ial
empl
oym
ent
in T
N
Empl
oym
ent
+ St
udie
s in
TN
HE
stud
ies
in T
N o
nly
Empl
oym
. in
TN +
Stu
dies
ou
t-of
-sta
te
HE
stud
ies
out-
of-
stat
e
Empl
oyed
in
TN
for
≤
3 qu
arte
rs
Not
foun
d in
TN
APS
U2,
480
1,86
062
077
235
844
618
599
138
140
342
75.0
%25
.0%
41.5
%19
.2%
24.0
%9.
9%5.
3%22
.3%
22.6
%55
.2%
ETS
U3,
542
2,92
861
41,
185
590
841
225
8711
220
729
5
82.7
%17
.3%
40.5
%20
.2%
28.7
%7.
7%3.
0%18
.2%
33.7
%48
.0%
MTS
U7,
099
5,87
61,
223
2,87
61,
290
1,25
527
717
821
143
857
4
82.8
%17
.2%
48.9
%22
.0%
21.4
%4.
7%3.
0%17
.3%
35.8
%46
.9%
TSU
1,57
11,
375
196
552
229
460
5282
5460
82
87.5
%12
.5%
40.1
%16
.7%
33.5
%3.
8%6.
0%27
.6%
30.6
%41
.8%
TTU
3,12
22,
610
510
21,
281
543
592
139
5590
148
272
83.6
%16
.3%
49.1
%20
.8%
22.7
%5.
3%2.
1%17
.6%
29.0
%53
.3%
UoM
4,71
53,
875
840
1,60
479
594
120
832
715
625
742
7
82.2
%17
.8%
41.4
%20
.5%
24.3
%5.
4%8.
4%18
.6%
30.6
%50
.8%
UTC
2,53
22,
085
440
787
445
452
214
689
119
147
174
82.3
%17
.4%
41.9
%21
.8%
25.0
%7.
0%4.
3%27
.0%
33.4
%39
.5%
UTK
7,67
65,
946
1,72
91
2,02
81,
275
1,71
769
822
844
144
184
7
77.5
%22
.5%
34.1
%21
.4%
28.9
%11
.7%
3.8%
25.5
%25
.5%
49.0
%
UTM
1,96
81,
665
302
175
432
541
398
7571
8414
7
84.6
%15
.3%
45.3
%19
.5%
24.8
%5.
9%4.
5%23
.5%
27.8
%48
.7%
TOTA
L34
,705
28,2
206,
474
1111
,926
5,85
97,
187
2,02
81,
220
1,39
21,
922
3,16
0
Gen
eral
cou
nts
Stay
ers
Leav
ers
Uni
vers
ity

COLL
EGE
GRA
DU
ATES
MIG
RATI
ON
STU
DY
| 5
3 App
endi
x C.
Pat
hway
s of
Out
-of-
stat
e St
uden
ts G
radu
atin
g fr
om T
enne
ssee
Pub
lic U
nive
rsit
ies,
AY
2011
and
201
2
Gra
duat
esSt
ayer
sLe
aver
sU
nkn
own
Cont
inuo
us
empl
oym
ent
in T
N
Part
ial
empl
oym
ent
in T
N
Empl
oym
ent
+ St
udie
s in
TN
HE
stud
ies
in T
N o
nly
Empl
oym
. in
TN +
Stu
dies
ou
t-of
-sta
te
HE
stud
ies
out-
of-
stat
e
Empl
oyed
in
TN
for
≤
3 qu
arte
rs
Not
foun
d in
TN
APS
U47
918
829
01
4449
3257
629
3622
5
39.2
%60
.5%
23.4
%26
.1%
17.0
%30
.3%
3.2%
10.0
%12
.4%
77.6
%
ETS
U60
326
134
277
7360
474
748
287
43.3
%56
.7%
29.5
%28
.0%
23.0
%18
.0%
1.5%
2.0%
14.0
%83
.9%
MTS
U61
930
931
013
011
740
1210
2062
228
49.9
%50
.1%
42.1
%37
.9%
12.9
%3.
9%3.
2%6.
5%20
.0%
73.5
%
TSU
586
316
270
9790
8825
1625
6218
3
53.9
%46
.1%
30.7
%28
.5%
27.8
%7.
9%5.
1%9.
3%23
.0%
67.8
%
TTU
156
5610
018
1811
81
210
88
35.9
%64
.1%
32.1
%32
.1%
19.6
%14
.3%
1.8%
2.0%
10.0
%88
.0%
UoM
637
339
298
119
103
6247
813
6522
0
53.2
%46
.8%
35.1
%30
.4%
18.3
%13
.9%
2.4%
4.4%
21.8
%73
.8%
UTC
259
155
104
5949
3213
24
2080
59.8
%40
.2%
38.1
%31
.6%
20.6
%8.
4%1.
3%3.
8%19
.2%
76.9
%
UTK
1,17
544
373
214
214
991
601
2610
660
0
37.7
%62
.3%
32.1
%33
.6%
20.5
%13
.5%
0.2%
3.6%
14.5
%82
.0%
UTM
135
3699
156
95
13
1086
26.7
%73
.3%
41.7
%16
.7%
25.0
%13
.9%
2.8%
3.0%
10.1
%86
.9%
TOTA
L4,
649
2,10
32,
545
170
165
442
527
449
129
419
1,99
7
Gen
eral
cou
nts
Stay
ers
Leav
ers
Uni
vers
ity

COLL
EGE
GRA
DU
ATES
MIG
RATI
ON
STU
DY
| 5
4
App
endi
x D
. Pat
hway
s of
Gra
duat
es o
f Ten
ness
ee C
omm
unit
y Co
llege
s, A
Y 20
11 a
nd A
Y 20
12
Gra
duat
esSt
ayer
sLe
aver
sU
nkn
own
Cont
inuo
us
empl
oym
ent
in T
N
Part
ial
empl
oym
ent
in T
N
Empl
oym
ent
+ St
udie
s in
TN
HE
stud
ies
in T
N o
nly
Empl
oym
. in
TN +
Stu
dies
ou
t-of
-sta
te
HE
stud
ies
out-
of-
stat
e
Empl
oyed
in
TN
for
≤
3 qu
arte
rs
Not
fo
und
in
TN
CH
SCC
1,69
41,
443
249
242
721
560
916
131
2974
146
85.2
%14
.7%
29.6
%14
.9%
42.2
%11
.2%
2.1%
11.6
%29
.7%
58.6
%
CLS
CC71
063
377
203
7727
464
155
3438
89.2
%10
.8%
32.1
%12
.2%
43.3
%10
.1%
2.4%
6.5%
44.2
%49
.4%
CO
SCC
1,12
11,
017
104
348
130
409
9238
2429
51
90.7
%9.
3%34
.2%
12.8
%40
.2%
9.0%
3.7%
23.1
%27
.9%
49.0
%
DSC
C53
147
556
181
4917
066
920
828
89.5
%10
.5%
38.1
%10
.3%
35.8
%13
.9%
1.9%
35.7
%14
.3%
50.0
%
JSC
C1,
098
996
102
424
126
355
7516
1139
52
90.7
%9.
3%42
.6%
12.7
%35
.6%
7.5%
1.6%
10.8
%38
.2%
51.0
%
MSC
C1,
116
991
125
248
103
505
9837
2325
77
88.8
%11
.2%
25.0
%10
.4%
51.0
%9.
9%3.
7%18
.4%
20.0
%61
.6%
NAS
CC1,
224
1,07
914
535
212
447
511
414
2235
88
88.2
%11
.8%
32.6
%11
.5%
44.0
%10
.6%
1.3%
15.2
%24
.1%
60.7
%
NES
CC1,
413
1,28
213
137
014
259
416
79
1646
69
90.7
%9.
3%28
.9%
11.1
%46
.3%
13.0
%0.
7%12
.2%
35.1
%52
.7%
PSC
C1,
963
1,76
619
742
420
088
522
829
3255
110
90.0
%10
.0%
24.0
%11
.3%
50.1
%12
.9%
1.6%
16.2
%27
.9%
55.8
%
RSC
C1,
513
1,36
914
448
414
958
212
133
1345
86
90.5
%9.
5%35
.4%
10.9
%42
.5%
8.8%
2.4%
9.0%
31.3
%59
.7%
STC
C1,
587
1,39
018
98
432
165
550
186
5734
4710
8
87.6
%11
.9%
31.1
%11
.9%
39.6
%13
.4%
4.1%
18.0
%24
.9%
57.1
%
VSC
C1,
452
1,29
915
21
426
130
544
138
6126
4878
89.5
%10
.5%
32.8
%10
.0%
41.9
%10
.6%
4.7%
17.1
%31
.6%
51.3
%
WSC
C1,
463
1,31
514
839
416
961
611
620
1734
97
89.9
%10
.1%
30.0
%12
.9%
46.8
%8.
8%1.
5%11
.5%
23.0
%65
.5%
TOTA
L16
,885
15,0
551,
819
114,
713
1,77
96,
568
1,62
636
927
251
91,
028
Com
mun
ity
colle
ge
Gen
eral
cou
nts
Stay
ers
Leav
ers

COLL
EGE
GRA
DU
ATES
MIG
RATI
ON
STU
DY
| 5
5 App
endi
x E.
Pat
hway
s of
In-s
tate
Stu
dent
s G
radu
atin
g fr
om T
enne
ssee
Com
mun
ity
Colle
ges,
AY
2011
and
201
2
Gra
duat
esSt
ayer
sLe
aver
sU
nkn
own
Cont
inuo
us
empl
oym
ent
in T
N
Part
ial
empl
oym
ent
in T
N
Empl
oym
ent
+ St
udie
s in
TN
HE
stud
ies
in T
N o
nly
Empl
oym
. in
TN
+
Stud
ies
out-
HE
stud
ies
out-
of-
stat
e
Empl
oyed
in
TN
for
≤
3 qu
arte
rs
Not
fo
und
in
TN C
HSC
C1,
515
1,32
418
92
403
186
559
146
3026
6499
87.4
%12
.5%
30.4
%14
.0%
42.2
%11
.0%
2.3%
13.8
%33
.9%
52.4
%
CLS
CC69
262
171
201
7427
061
155
3333
89.7
%10
.3%
32.4
%11
.9%
43.5
%9.
8%2.
4%7.
0%46
.5%
46.5
%
CO
SCC
1,10
31,
007
9634
313
040
492
3824
2844
91.3
%8.
7%34
.1%
12.9
%40
.1%
9.1%
3.8%
25.0
%29
.2%
45.8
%
DSC
C52
447
054
180
4816
865
920
826
89.7
%10
.3%
38.3
%10
.2%
35.7
%13
.8%
1.9%
37.0
%14
.8%
48.1
%
JSC
C1,
092
992
100
424
124
354
7515
1139
50
90.8
%9.
2%42
.7%
12.5
%35
.7%
7.6%
1.5%
11.0
%39
.0%
50.0
%
MSC
C1,
093
986
107
247
102
504
9736
2223
62
90.2
%9.
8%25
.1%
10.3
%51
.1%
9.8%
3.7%
20.6
%21
.5%
57.9
%
NAS
CC1,
170
1,03
413
634
411
945
210
514
2035
81
88.4
%11
.6%
33.3
%11
.5%
43.7
%10
.2%
1.4%
14.7
%25
.7%
59.6
%
NES
CC1,
379
1,25
512
435
813
858
716
39
1644
64
91.0
%9.
0%28
.5%
11.0
%46
.8%
13.0
%0.
7%12
.9%
35.5
%51
.6%
PSC
C1,
907
1,72
418
341
719
486
721
729
2954
100
90.4
%9.
6%24
.2%
11.3
%50
.3%
12.6
%1.
7%15
.8%
29.5
%54
.6%
RSC
C1,
483
1,35
612
747
814
558
012
033
1342
72
91.4
%8.
6%35
.3%
10.7
%42
.8%
8.8%
2.4%
10.2
%33
.1%
56.7
%
STC
C1,
522
1,35
217
041
615
554
418
156
3240
98
88.8
%11
.2%
30.8
%11
.5%
40.2
%13
.4%
4.1%
18.8
%23
.5%
57.6
%
VSC
C1,
425
1,28
513
91
420
127
543
134
6125
4866
90.2
%9.
8%32
.7%
9.9%
42.3
%10
.4%
4.7%
18.0
%34
.5%
47.5
%
WSC
C1,
442
1,31
013
239
316
961
411
420
1731
84
90.8
%9.
2%30
.0%
12.9
%46
.9%
8.7%
1.5%
12.9
%23
.5%
63.6
%
TOTA
L16
,347
14,7
161,
628
34,
624
1,71
16,
446
1,57
036
526
048
987
9
Com
mun
ity
colle
ge
Gen
eral
cou
nts
Stay
ers
Leav
ers

COLL
EGE
GRA
DU
ATES
MIG
RATI
ON
STU
DY
| 5
6
App
endi
x F.
Pat
hway
s of
Out
-of-
stat
e St
uden
ts G
radu
atin
g fr
om T
enne
ssee
Com
mun
ity
Colle
ges,
AY
2011
& 2
012
Gra
duat
esSt
ayer
sLe
aver
sU
nkn
own
Cont
inuo
us
empl
oym
ent
in T
N
Part
ial
empl
oym
ent
in T
N
Empl
oym
ent
+ St
udie
s in
TN
HE
stud
ies
in
TN o
nly
Empl
oym
. in
TN +
Stu
dies
ou
t-of
-sta
te
HE
stud
ies
out-
of-
stat
e
Empl
oyed
in
TN
for
≤
3 qu
arte
rs
Not
fo
und
in T
N C
HSC
C17
911
960
2429
5015
13
1047
66.5
%33
.5%
20.2
%24
.4%
42.0
%12
.6%
0.8%
5.0%
16.7
%78
.3%
CLS
CC18
126
23
43
00
15
66.7
%33
.3%
16.7
%25
.0%
33.3
%25
.0%
0.0%
0.0%
16.7
%83
.3%
CO
SCC
179
84
05
00
01
7
52.9
%47
.1%
44.4
%0.
0%55
.6%
0.0%
0.0%
0.0%
12.5
%87
.5%
DSC
C7
52
11
21
00
02
71.4
%28
.6%
20.0
%20
.0%
40.0
%20
.0%
0.0%
0.0%
0.0%
100.
0%
JSC
C5
32
01
10
10
02
60.0
%40
.0%
0.0%
33.3
%33
.3%
0.0%
33.3
%0.
0%0.
0%10
0.0%
MSC
C23
518
11
11
11
215
21.7
%78
.3%
20.0
%20
.0%
20.0
%20
.0%
20.0
%5.
6%11
.1%
83.3
%
NAS
CC54
459
85
239
02
07
83.3
%16
.7%
17.8
%11
.1%
51.1
%20
.0%
0.0%
22.2
%0.
0%77
.8%
NES
CC34
277
124
74
00
25
79.4
%20
.6%
44.4
%14
.8%
25.9
%14
.8%
0.0%
0.0%
28.6
%71
.4%
PSC
C56
4214
76
1811
03
110
75.0
%25
.0%
16.7
%14
.3%
42.9
%26
.2%
0.0%
21.4
%7.
1%71
.4%
RSC
C27
1116
44
21
00
313
40.7
%59
.3%
36.4
%36
.4%
18.2
%9.
1%0.
0%0.
0%18
.8%
81.3
%
STC
C57
3819
1610
65
12
710
66.7
%33
.3%
42.1
%26
.3%
15.8
%13
.2%
2.6%
10.5
%36
.8%
52.6
%
VSC
C25
1312
53
14
01
011
52.0
%48
.0%
38.5
%23
.1%
7.7%
30.8
%0.
0%8.
3%0.
0%91
.7%
WSC
C21
516
10
22
00
313
23.8
%76
.2%
20.0
%0.
0%40
.0%
40.0
%0.
0%0.
0%18
.8%
81.3
%
TOTA
L52
333
418
90
8567
122
564
1230
147
Com
mun
ity
colle
ge
Gen
eral
cou
nts
Stay
ers
Leav
ers

COLL
EGE
GRA
DU
ATES
MIG
RATI
ON
STU
DY
| 5
7
App
endi
x G
. Pat
hway
s of
Gra
duat
es W
ho C
hang
ed T
heir
Res
iden
cy S
tatu
s fr
om O
ut-o
f-St
ate
to In
-sta
te
Con
tin
uou
s w
ork
in T
N38
7 (3
2.9%
)
Part
ial w
ork
in T
N (4
-10
quar
ters
)S
T A
Y E
D27
5 (2
3.4%
)
in T
N1,
176
(59.
7%)
Hig
her
ed.
en
rollm
ent
and
wor
k in
TN
317
(27.
0%)
Ass
ocia
te: 3
38 (7
0.4%
)B
ach
elor
's: 8
38 (5
6.3%
)O
nly
hig
her
ed.
en
rollm
ent
in T
N
Gra
duat
es15
5 (1
3.2%
)
1,96
9Em
ploy
ed in
TN
/ e
nro
lled
out-
of-s
tate
Ass
ocia
te: 4
80 (2
4.4%
)42
(3.4
%)
Bac
hel
or: 1
,489
(75.
6%)
Hig
her
ed.
en
rollm
ent
in o
ther
sta
tes
M O
V E
D11
0 (1
3.9%
)
from
TN
792
(40.
2%)
Empl
oyed
in T
N fo
r <
4 qu
arte
rs15
4 (1
9.4%
)As
soci
ate:
142
(29.
6%)
Bach
elor
's: 6
50 (4
3.7%
)N
ot w
orki
ng
in T
N o
r st
udy
ing
anyw
her
e52
8 (6
6.7%
)
UN
KN
OW
N1

COLL
EGE
GRA
DU
ATES
MIG
RATI
ON
STU
DY
| 5
8
App
endi
x H
. Em
ploy
men
t an
d En
rollm
ent
Stat
uses
of I
n-St
ate
Stud
ents
by
Qua
rter
aft
er G
radu
atio
n 10
IN T
ENN
ESSE
E Q
1
Q 2
Q
3
Q 4
Q
5
Q 6
Q
7
Q 8
Q
9
Q 1
0 Q
11
Q 1
2
1.
Empl
oym
ent
full-
tim
e 19
,889
22
,473
23
,121
23
,604
24
,395
24
,596
24
,482
25
,093
26
,132
26
,508
26
,242
27
,059
part
-tim
e 11
,252
7,
052
6,46
4 5,
381
5,93
7 4,
505
4,50
3 3,
993
4,77
3 3,
751
4,12
4 3,
450
2.
Enro
llmen
t in
HEI
full-
tim
e 1,
229
2,94
4 2,
832
2,87
3 1,
694
2,74
0 2,
641
2,46
1 1,
274
1,63
1 1,
470
1,62
6
part
-tim
e 1,
010
937
898
946
1,05
2 88
3 86
3 87
9 84
3 71
9 67
4 54
4
3.
Empl
oym
ent
& e
nrol
lmen
t 3,
028
4,78
9 4,
940
5,59
7 4,
137
4,96
1 5,
080
5,18
1 3,
478
3,68
0 3,
886
3,39
0
IN-S
TATE
TO
TAL
36,4
08
38,1
95
38,2
55
38,4
01
37,2
15
37,6
85
37,5
69
37,6
07
36,5
00
36,2
89
36,3
96
36,0
69
IN-S
TATE
SH
ARE
71
.3%
74
.8%
74
.9%
75
.2%
72
.9%
73
.8%
73
.6%
73
.7%
71
.5%
71
.1%
71
.3%
70
.7%
OU
T-O
F-ST
ATE
1.
Enro
llmen
t in
HEI
35
7 1,
036
1,05
4 1,
196
989
1,46
3 1,
459
1,51
2 1,
114
1,43
8 1,
398
1,48
2
2.
All
othe
rs
14,2
87
11,8
21
11,7
43
11,4
55
12,8
48
11,9
04
12,0
24
11,9
33
13,4
38
13,3
25
13,2
58
13,5
01
OU
T-O
F-ST
ATE
TO
TAL
14,6
44
12,8
57
12,7
97
12,6
51
13,8
37
13,3
67
13,4
83
13,4
45
14,5
52
14,7
63
14,6
56
14,9
83
OU
T-O
F-ST
ATE
SH
ARE
28
.7%
25
.2%
25
.1%
24
.8%
27
.1%
26
.2%
26
.4%
26
.3%
28
.5%
28
.9%
28
.7%
29
.3%
GRA
ND
TO
TAL
51,0
52
51,0
52
51,0
52
51,0
52
51,0
52
51,0
52
51,0
52
51,0
52
51,0
52
51,0
52
51,0
52
51,0
52
10
The
res
iden
cy s
tatu
s of
101
gra
duat
es is
unk
now
n.

COLL
EGE
GRA
DU
ATES
MIG
RATI
ON
STU
DY
| 5
9
App
endi
x I.
Empl
oym
ent
and
Enro
llmen
t St
atus
es o
f Out
-of-
Stat
e St
uden
ts b
y Q
uart
er a
fter
Gra
duat
ion
11
IN T
ENN
ESSE
E Q
1
Q 2
Q
3
Q 4
Q
5
Q 6
Q
7
Q 8
Q
9
Q 1
0 Q
11
Q 1
2
1.
Empl
oym
ent
full-
tim
e 1,
137
1,21
9 1,
272
1,26
7 1,
278
1,28
5 1,
259
1,27
2 1,
314
1,31
8 1,
302
1,32
4
part
-tim
e 70
7 50
1 38
8 30
0 33
0 25
9 25
4 21
9 23
1 19
4 21
9 18
1
2.
Enro
llmen
t in
HEI
full-
tim
e 87
19
2 19
4 20
9 11
9 17
6 17
2 17
3 82
89
79
83
part
-tim
e 61
62
57
82
92
72
73
73
71
59
59
49
3.
Empl
oym
ent
& e
nrol
lmen
t 12
3 19
7 20
0 23
1 18
0 20
2 20
5 21
4 15
1 14
6 15
6 13
3
IN-S
TATE
TO
TAL
2,11
5 2,
171
2,11
1 2,
089
1,99
9 1,
994
1,96
3 1,
951
1,84
9 1,
806
1,81
5 1,
770
IN-S
TATE
SH
ARE
40
.9%
42
.0%
40
.8%
40
.4%
38
.7%
38
.6%
38
.0%
37
.7%
35
.8%
34
.9%
35
.1%
34
.2%
OU
T-O
F-ST
ATE
1.
Enro
llmen
t in
HEI
29
64
65
79
83
91
94
97
83
10
0 10
0 10
4
2.
All
othe
rs
3,02
8 2,
937
2,99
6 3,
004
3,09
0 3,
087
3,11
5 3,
124
3,24
0 3,
266
3,25
7 3,
298
OU
T-O
F-ST
ATE
TO
TAL
3,05
7 3,
001
3,06
1 3,
083
3,17
3 3,
178
3,20
9 3,
221
3,32
3 3,
366
3,35
7 3,
402
OU
T-O
F-ST
ATE
SH
ARE
59
.1%
58
.0%
59
.2%
59
.6%
61
.3%
61
.4%
62
.0%
62
.3%
64
.2%
65
.1%
64
.9%
65
.8%
GRA
ND
TO
TAL
5,17
2 5,
172
5,17
2 5,
172
5,17
2 5,
172
5,17
2 5,
172
5,17
2 5,
172
5,17
2 5,
172
11
The
res
iden
cy s
tatu
s of
101
gra
duat
es is
unk
now
n.

COLL
EGE
GRA
DU
ATES
MIG
RATI
ON
STU
DY
| 6
0
App
endi
x J.
Med
ian
Wag
e by
Maj
or, D
egre
e, a
nd Y
ear:
App
roac
h I 12
Maj
or a
t gr
adua
tion
YE
AR
1 YE
AR
2 YE
AR
3
Ass
ocia
te B
ache
lor
Dif
fere
nce
Ass
ocia
te B
ache
lor
Dif
fere
nce
Ass
ocia
te B
ache
lor
Dif
fere
nce
Agric
ultu
re
(sm
all n
) $1
5,43
6 N
A (s
mal
l n)
$23,
924
-NA
(sm
all n
) $2
9,28
9 N
A Ar
chite
ctur
e an
d Re
late
d Pr
ogra
ms
- $2
0,01
8 N
A -
$30,
008
NA
- $3
7,97
3 N
A Ar
ea, E
thni
c an
d Cu
ltura
l Stu
dies
-
$10,
472
NA
- $1
8,77
9 N
A -
$23,
144
NA
Biol
ogic
al S
cien
ces
/ Life
Sci
ence
s (s
mal
l n)
$12,
030
NA
(sm
all n
) $1
4,50
9 N
A (s
mal
l n)
$18,
426
NA
Busi
ness
Man
agem
ent /
Adm
. Ser
vice
s $2
1,16
5 $2
2,65
0 1,
485
$24,
660
$31,
615
6,95
5 $2
7,70
9 $3
7,10
2 9,
392
Com
mun
icat
ions
$1
3,45
9 $1
4,67
7 1,
218
$17,
579
$22,
394
4,81
5 $2
2,32
4 $2
6,11
9 3,
795
Com
pute
r an
d In
form
atio
n Sc
ienc
es
$23,
994
$30,
644
6,65
0 $3
0,43
9 $4
3,43
4 12
,994
$3
4,82
5 $5
1,58
3 16
,758
Ed
ucat
ion
$7,7
95
$20,
889
13,0
95
$6,7
33
$31,
172
24,4
40
$21,
928
$30,
428
8,49
9 En
gine
erin
g $2
5,07
1 $3
4,38
9 9,
318
$32,
464
$46,
795
14,3
31
$37,
124
$53,
959
16,8
35
Engl
ish
Lang
uage
and
Lite
ratu
re
- $1
1,31
7 N
A -
$18,
951
NA
- $2
2,81
8 N
A Fo
reig
n La
ngua
ges
and
Lite
ratu
res
(sm
all n
) $1
4,09
4 N
A (s
mal
l n)
$19,
293
NA
(sm
all n
) $2
3,92
4 N
A H
ealth
Pro
fess
ions
& R
elat
ed S
ervi
ces
$36,
231
$38,
613
2,38
2 $4
2,07
5 $4
4,65
7 2,
582
$44,
347
$46,
862
2,51
5 H
ome
Econ
omic
s $1
5,89
6 $1
5,30
8 -5
88
$17,
185
$22,
069
4,88
4 $1
8,56
0 $2
7,28
9 8,
729
Law
and
Leg
al S
tudi
es
$18,
556
(sm
all n
) N
A $2
3,26
9 (s
mal
l n)
NA
$26,
500
(sm
all n
) N
A Li
bera
l Art
s an
d Sc
ienc
es
$11,
388
$21,
634
10,2
46
$12,
997
$27,
384
14,3
87
$18,
007
$30,
281
12,2
74
Mat
hem
atic
s -
$17,
975
NA
- $2
9,22
9 N
A -
$34,
587
NA
Mili
tary
Sci
ence
s -
$23,
226
NA
- $3
4,36
2 N
A -
$41,
514
NA
Mul
ti / I
nter
disc
iplin
ary
Stud
ies
- $1
9,04
0 N
A -
$26,
469
NA
- $3
0,14
9 N
A Pa
rks,
Rec
reat
ion,
Lei
sure
and
Fitn
ess
- $1
2,18
7 N
A -
$18,
411
NA
- $2
4,48
3 N
A Pe
rson
al Im
prov
emen
t and
Lei
sure
$2
0,38
0 -
NA
$24,
833
- N
A $2
7,35
6 -
NA
Philo
soph
y, R
elig
ion,
and
The
olog
y -
$9,5
45
NA
- $1
3,38
3 N
A -
$16,
091
NA
Phys
ical
Sci
ence
s -
$12,
197
NA
- $1
8,11
2 N
A -
$25,
274
NA
Prot
ectiv
e Se
rvic
es a
nd P
ublic
Aff
airs
$2
2,27
5 $1
8,45
6 -3
,818
$2
6,38
1 $2
4,79
5 -1
,586
$3
0,24
8 $2
9,75
4 -4
94
Psyc
holo
gy
- $1
3,48
1 N
A -
$18,
920
NA
- $2
4,36
0 N
A So
cial
Sci
ence
s (s
mal
l n)
$13,
064
NA
(sm
all n
) $2
0,59
2 N
A (s
mal
l n)
$25,
189
NA
Tech
nolo
gy E
duca
tion
/ Ind
ustr
ial A
rts
$27,
351
- N
A $2
9,10
5 -
NA
$33,
715
- N
A Tr
ades
and
Indu
stria
l $2
4,08
4 $1
5,20
3 -8
,881
$2
7,99
2 $2
1,63
1 -6
,361
$3
1,39
7 $2
5,18
4 -6
,213
Vi
sual
and
Per
form
ing
Arts
$1
3,95
1 $1
2,26
7 -1
,683
$1
6,96
6 $1
8,54
6 1,
580
$18,
331
$23,
279
4,94
8
12 T
he c
ut-o
ff fo
r a
smal
l sam
ple
size
(sm
all n
) is
25 g
radu
ates
in a
cel
l.