post-flight performance report
TRANSCRIPT

Post-Flight Performance
Report
High Power Rocketeers
University of Minnesota Duluth
Tessa Bakken, Jordan Gaytan, Cody Graupmann, Erik Klevar, Jade Lecocq, Curt Myers, Joel
Stomberg, Chase Warnecke
Advisor: Dr. Ryan Rosandich
5/29/2015

Table of Contents Executive Summary ...................................................................................................................................... 3
Introduction ................................................................................................................................................... 4
Rocket Operation .......................................................................................................................................... 4
Flight Performance ........................................................................................................................................ 6
Data Collection ............................................................................................................................................. 7
Conclusion .................................................................................................................................................... 9
Appendix ..................................................................................................................................................... 10
Executive Summary On May 20
th, 2015, we, the UMD High Power Rocketeers launched a boosted dart for the
2015 Space Grant Midwest High-Power Rocket Competition. The goal of this competition was
to design and build a boosted dart that reaches maximum altitude, has maximum separation
between booster and the dart, and is recovered safely and in flyable condition. The booster had
an overall length of 48 cm, outer diameter of 5.8 cm and weight of 1240 grams. The dart had
overall length of 88 cm, outer diameter of 3.2 cm and weight of 680 grams. We found that our
competition flight was very similar to the simulated data. Our dart reached on altitude of 1620
meters and booster reached 747 meters. The competition guidelines also required teams to have
onboard down-looking video footage as well as measure and record rotation about the x, y, and z
axis. We accomplished this requirement by housing a USB video camera in a custom designed
tail cone in the dart. We also designed a unit to record rotation by wiring an Arduino controller
to an inertial measurement unit. The booster and dart were designed and were shown to be stable
in all phases of the flight and were both recovered safely and in flyable condition. Overall, we
had a phenomenal competition launch.

Introduction On May 20, 2015 the UMD High Power Rocketeers team participated in the Midwest
High-Power Rocketry Competition hosted by the Minnesota Space Grant Consortium and Tripoli
Minnesota. The competition was one of the requirements of the mechanical engineering elective
course ME-4495 Special Topics: High Power Rocketry. This report presents an analysis of the
performance of the team’s rocket in that competition.
Rocket Operation At the competition the rocket was launched twice. After the first
competition launch the booster was not recovered in flyable condition.
We believe this is due to the parachute ejecting too late (12 second delay)
resulting in the body tube and transition section fracturing, as shown in
Figure 1. Over the course of the day the rocket was repaired using a piece
of spare coupler tube and epoxy. The repaired rocket is shown in Figure
2. For the second competition flight the booster ejection delay was
reduced to 10 seconds. The second flight went better than the first,
achieving higher apogees with the same separation, and both the booster
and the dart were recovered in flyable condition. This report is focused on
the second flight. The characteristics of the flight are shown in Table 1.
Operation (Determined by RSO or
equivalent)
Booster Dart
Launch (pass/fail) pass pass
Parachute deployment (pass/fail) pass pass
Recovery (pass/fail) pass pass
Flyable condition (pass/fail) pass pass
Performance Booster Dart
Maximum altitude predicted (meters) 830 1451
Maximum altitude actual (meters) 747 1620
Separation predicted (meters) 621
Separation actual (meters 873
Figure 1: First Launch booster Recovery
Figure 2: Repaired Booster Table 1: Flight Characteristics

Figure 3: Launch and recovery locations
Parameter Expected Actual
Burn time (sec.) 1.1 1.4
Max. acceleration (G) 27.7 23.2
Max velocity (meters/sec.) 235 241
Table 2: Propulsion system performance.
As shown inTtable 2 above, our propulsion using the Cesaroni 475-I445 went as planned.
At burnout the rocket was at an altitude of 186 meters. The maximim acceleration during burn
was 23 Gs and the maximim velocity was 241 m/s. We used motor ejection for the booster
recovery system; there was a 10 second delay set after burnout. Table 3 below shows the flight
path assessment of the rocket. Due to a wind coming from the south, our rocket weather cocked
slightly and ended up south of the launch pad. We ended up with the dart’s maximum altitude
being 1620 meters with a separation of 873 meters.
Parameter Expected Actual
Max velocity (meters/sec.) 235 241
Booster max. altitude (m) 839 747
Dart max. altitude (m) 1453 1620
Booster time to apogee (sec.) 11.1 11
Dart time to apogee (sec.) 15.9 18.2
Table 3: Flight path assessment
Parameter Expected Actual
Time to booster parachute deployment
(sec.)
12.1 14
Time to dart parachute deployment (sec.) 16.0 17.2
Booster descent rate (meters/sec.) 5.9 6.5
Dart descent rate (meters/sec.) 6.7 10
Table 4: Recovery system assessment
The recovery system assessment is shown in
Table 4. Both the booster and dart were recovered
safely and in flyable condition. The motor ejection
for the booster was set to deploy 10 seconds after
motor burnout and the decent rate was 6.5 m/s. The
dart’s recovery system was deployed by a
Stratologger altimeter at apogee and the decent rate
of the dart was 10 m/s. The booster landed about
300 meters from the launch pad and the dart landed
nearly a kilometer away. This is shown in Figure 3.
The booster was close and easy to find, and the dart
used a radio tracking device as recommended by
the competition organizers.
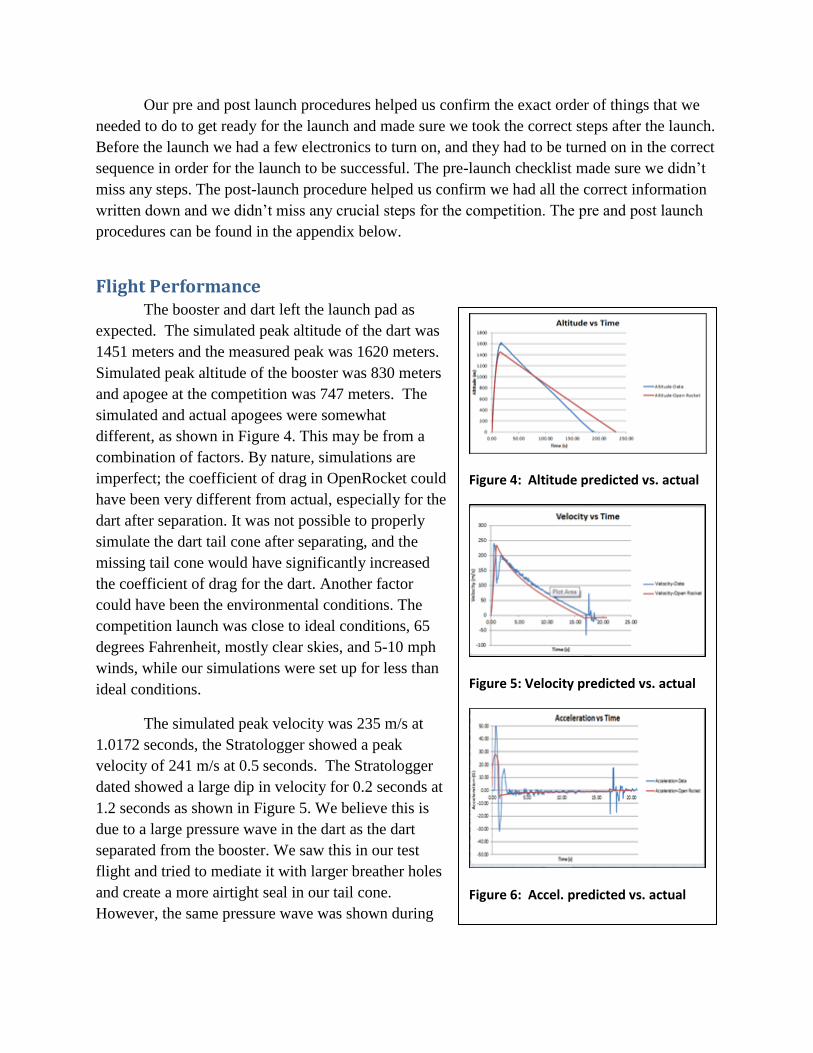
Figure 4: Altitude predicted vs. actual
Figure 5: Velocity predicted vs. actual
Figure 6: Accel. predicted vs. actual
Our pre and post launch procedures helped us confirm the exact order of things that we
needed to do to get ready for the launch and made sure we took the correct steps after the launch.
Before the launch we had a few electronics to turn on, and they had to be turned on in the correct
sequence in order for the launch to be successful. The pre-launch checklist made sure we didn’t
miss any steps. The post-launch procedure helped us confirm we had all the correct information
written down and we didn’t miss any crucial steps for the competition. The pre and post launch
procedures can be found in the appendix below.
Flight Performance The booster and dart left the launch pad as
expected. The simulated peak altitude of the dart was
1451 meters and the measured peak was 1620 meters.
Simulated peak altitude of the booster was 830 meters
and apogee at the competition was 747 meters. The
simulated and actual apogees were somewhat
different, as shown in Figure 4. This may be from a
combination of factors. By nature, simulations are
imperfect; the coefficient of drag in OpenRocket could
have been very different from actual, especially for the
dart after separation. It was not possible to properly
simulate the dart tail cone after separating, and the
missing tail cone would have significantly increased
the coefficient of drag for the dart. Another factor
could have been the environmental conditions. The
competition launch was close to ideal conditions, 65
degrees Fahrenheit, mostly clear skies, and 5-10 mph
winds, while our simulations were set up for less than
ideal conditions.
The simulated peak velocity was 235 m/s at
1.0172 seconds, the Stratologger showed a peak
velocity of 241 m/s at 0.5 seconds. The Stratologger
dated showed a large dip in velocity for 0.2 seconds at
1.2 seconds as shown in Figure 5. We believe this is
due to a large pressure wave in the dart as the dart
separated from the booster. We saw this in our test
flight and tried to mediate it with larger breather holes
and create a more airtight seal in our tail cone.
However, the same pressure wave was shown during
our competition flight. The decent rate of our booster was 6.5 m/s and the dart’s was 10 m/s.
The acceleration is where our data begins to differ. The peak acceleration according to
the simulation is 27.5 Gs, where the Stratologger recorded a max acceleration of 48 Gs as shown
in Figure 6. The Altimeter Two recorded a maximum acceleration reading of 23 Gs. We believe
these accelerations are so different because of the large pressure wave that rolls through the dart
as it separates from the booster. During separation, where the Stratologger data shows a large
negative acceleration, air would have been pushed up into the hole in the tail cone of the dart
creating a large pressure wave. This is also shown in the Stratologger’s velocity data; during
separation there is a large dip in velocity. We know that the dart couldn’t have slowed way down
and then sped up, so we must assume this is erroneous data. The Altimeter Two showed a
maximum reading of 23 Gs because this is where the Altimeter Two maxes out.
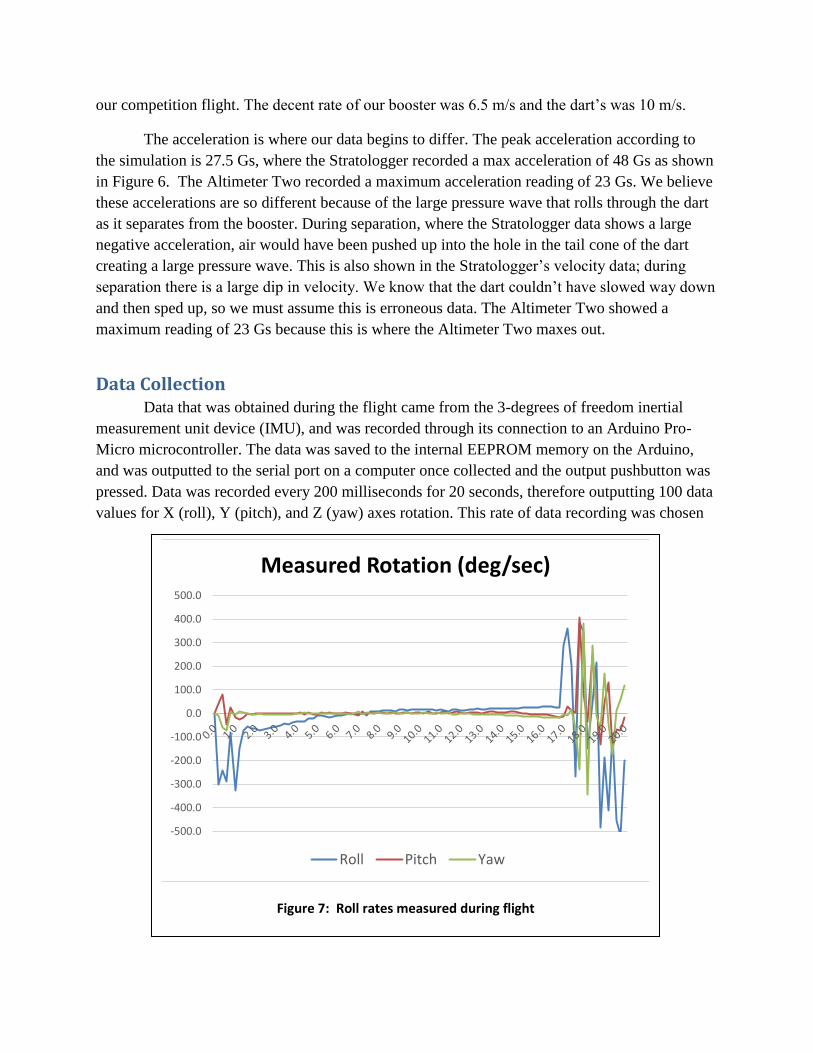
Data Collection Data that was obtained during the flight came from the 3-degrees of freedom inertial
measurement unit device (IMU), and was recorded through its connection to an Arduino Pro-
Micro microcontroller. The data was saved to the internal EEPROM memory on the Arduino,
and was outputted to the serial port on a computer once collected and the output pushbutton was
pressed. Data was recorded every 200 milliseconds for 20 seconds, therefore outputting 100 data
values for X (roll), Y (pitch), and Z (yaw) axes rotation. This rate of data recording was chosen
Figure 7: Roll rates measured during flight
-500.0
-400.0
-300.0
-200.0
-100.0
0.0
100.0
200.0
300.0
400.0
500.0
Measured Rotation (deg/sec)
Roll Pitch Yaw

because of the limited amount of memory space on the Arduino Pro-Micro, and also because it
was felt that 100 data points were more than enough to accurately represent the rotation of the
rocket. It was known beforehand that the rocket would reach apogee around 16-18 seconds, and
so it was desired to record data for a minimum of 20 seconds so that the entire flight of the rocket
would be gathered. A graph of the rotational data versus time is shown in Figure 7.
The pitch and yaw rates were minimal during the coast phase of the flight since the dart flew in a
very straight and stable manner. The accuracy of the roll rate measurements, however, was
investigated further. Estimates of the roll rate of the rocket were made by analyzing the video
frame-by-frame. No good information was available for the first second or so due to the smoke
from the rocket motor obscuring the view of the background, so analysis was begun at 1.2
seconds after ignition. Times were recorded from the video in 90-degree increments of dart
rotation, and at 45 degree increments when the rotation rate slowed. The analysis was stopped
17 seconds after ignition when apogee was reached and the parachute was deployed. The
average roll rate in each interval was then calculated and compared to the average rate measured
by the on-board inertial measurement unit (IMU). The results of that comparison are shown in
Figure 8. The roll rates from the video analysis and the IMU compare exceptionally well, and
both show a reversal of direction between 7 and 8 seconds after ignition.
The quality of the on-board video gathered during the flight is also exceptional. Video
was gathered for the whole duration of the rocket flight, booster/dart ascent and then dart ascent,
and the mirror housing device allowed for video to be gathered centrally with the launch pad
sitting directly in the middle of the view. During the initial boost phase the booster is shown in
Figure 8: Roll rate comparison
-100.0
-80.0
-60.0
-40.0
-20.0
0.0
20.0
40.0
0 1 2 3 4 5 6 7 8 9 10 11 12 13 14 15 16 17 18
End of Time Period
Average Roll Rate (deg/sec)
Video
IMU

the bottom third portion of the view. This allowed the viewing of the entire rocket boost phase,
and separation is clearly seen due to the location of the video camera in the dart. The coast phase
is shown beautifully and the roll rate is clear to the viewer, with apogee clear to see as well since
the point of zero vertical velocity can be determined. Recovery is not shown directly as there is
no view of the parachute during deployment; however the viewer can clearly determine when
parachute deployment occurs and can also determine just how much the rocket twists and turns
during recovery. The camera gives a clear view all the way to touchdown, as well. Figure 9
shows sample video frames from different phase of the flight.
Figure 9: Sample frames taken from on-board video.
Ignition
Separation
Coasting
Apogee
Touchdown
Conclusion Our boosted dart flew as we expected it to, and based on the results from competition day
we had an excellent design philosophy. Our philosophy was to minimize the size and weight of
the booster and to minimize the drag and optimize the weight of the dart. Compared to the other
rockets at the competition, we had the smallest rocket by far. By having the smallest body
diameter possible we minimized the drag on both the booster and the dart. We then used
OpenRocket simulation software to optimize the weight of the dart and we ended up adding 400
extra grams to it in order to optimize momentum after burnout. Another part of our design
philosophy was simplicity, we didn’t want the added weight or potential mechanical
complications from an airbrake or dart releasing mechanism. We found that these philosophies
held true and allowed us to have the winning flight at the competition. Our suggestions to future
rocketeers is to start small and simple, this can only help you on the road to achieving your goals.
We would like to send out a special thanks to all the competition organizers and judges,
especially Gary Stroik and Dr. Ryan Rosandich for all your guidance and support.

Appendix
Pre-Launch Procedure
Name: __________________ Date: _______________ Time: ___________ Launch #: ____
Temperature Relative Humidity Barometric Pressure Wind Speed
Initial Inspection
❏ 1. Inspect all four shock cord connection points.
❏ 2. Inspect all wiring connections and velcro attachments in dart lower payload.
❏ 3. Check all battery levels (some require voltmeter).
❏ Altimeter Two (1 - Booster):_____%
❏ Altimeter Two (2 - dart):_____%
❏ Stratologger:_____V (9V)
❏ Arduino:_____V (9V)
❏ 4. Ensure the Camera, Altimeters, Stratologger, and Arduino are OFF.
Dart Inspection
❏ 5. Inspect and fold dart parachute
❏ 6.Install shock cord, parachute, and nose cone into the parachute bay
❏ 7. MAKE SURE POWER IS OFF! Install dart chute blast cap filled with 6g black
powder and wadding MAKE SURE TO DOUBLE CHECK WIRING
CONNECTIONS AS THEY EASILY COME LOOSE!
❏ 8. secure parachute bay to coupler
❏ 9. Connect the Statologger and Arduino 9V batteries.
❏ 10. Inspect & install electronics strip.
❏ a. Turn on and arm Altimeter Two (3), will display READY
❏ 11. Secure electronics bay to coupler
❏ 12. Arm arduino and IMU
❏ 13. Place radio transmitter in electronics bay
❏ 14. Turn on camera

❏ 15. Install and secure tail cone into dart
Booster Inspection
❏ 16. Arm Altimeter Two, will display READY
❏ 17. Secure altimeter bay in booster
❏ 18. Check that mirrors are clean
❏ 19. Install transition section
❏ 20. Inspect and fold booster parachute
❏ 21. Install shock cord, and parachute into booster parachute bay
❏ 22. Install dart into booster
Launch Pad Inspection
❏ 23. Record motor type and full mass.
❏ Mass:________g
❏ 24. Install motor.
❏ 25. Place rocket on launch rail.
❏ 26. Arm Stratologger altimeter.
❏ 27. Listen for correct beep sequence as follows:
❏ 2 short beeps (Preset 2)
❏ Long Pause
❏ 5 short beeps (Describing an altitude of 500 ft. for dart deployment)
❏ Short Pause
❏ 10 short beeps
❏ Short Pause
❏ 10 short beeps
❏ Long Pause
❏ A sequence of beeps and short pauses (Describing altitude of last flight)
❏ Altitude:___________ft
❏ A sequence of beeps and a short pause followed by another sequence of beeps
(Describing battery voltage as X.X Volts)
❏ Voltage:_______V
❏ Long Pause
❏ A non-stop pulse of 3 beeps (This indicates that the chute is are connected
properly. IF A PULSE OF 1 OR 2 BEEPS, THEN THE CHUTE IS NOT
CONNECTED. DO NOT LAUNCH!!!)
❏ 28. One last visual inspection
❏ 29. Photograph(s) of rocket on pad
❏ 30. Launch

Post-Launch Procedure
Name: ____________ Date: _______________ Time: ___________ Launch #: ____
Temperature Relative Humidity Barometric Pressure Wind Speed
❏ 1. Approach the booster and dart with caution, and inspect from afar to verify all
separation has occurred
❏ 2. Take a picture of all components on the ground
Dart Inspection
❏ 3. Stratologger Altitude and Voltage:
❏ Remove electronics strip
❏ Download IMU matrix
❏ record Altimeter Two data
❏ 4. Turn off electronics:
❏ Stratologger
❏ Altimeter Two
❏ Arduino & IMU
❏ 5. Turn off Camera
❏ 6. Collect all components of dart
❏ 7. Return to Judges booth and wait for booster recovery team
Booster Inspection
❏ 8. Record data and Turn off booster electronics:
❏ Altimeter Two
❏ 9. Collect all components of booster
❏ 10. Return to judges booth and wait for dart recovery team
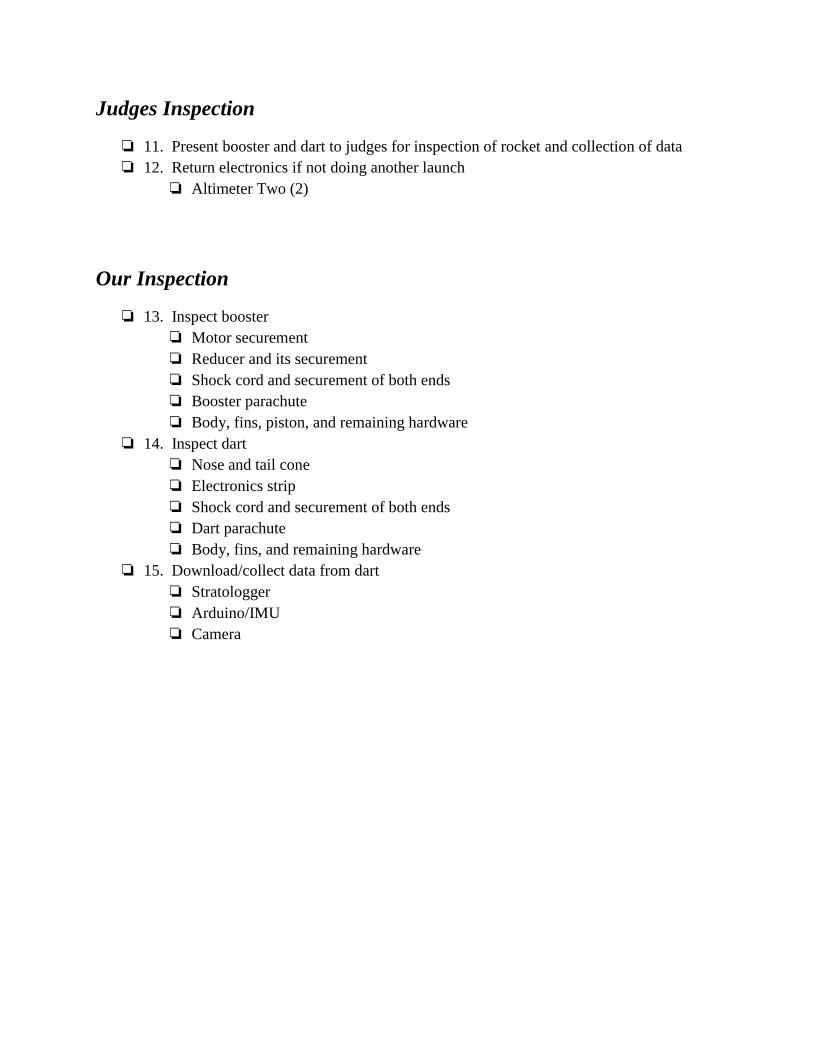
Judges Inspection
❏ 11. Present booster and dart to judges for inspection of rocket and collection of data
❏ 12. Return electronics if not doing another launch
❏ Altimeter Two (2)
Our Inspection
❏ 13. Inspect booster
❏ Motor securement
❏ Reducer and its securement
❏ Shock cord and securement of both ends
❏ Booster parachute
❏ Body, fins, piston, and remaining hardware
❏ 14. Inspect dart
❏ Nose and tail cone
❏ Electronics strip
❏ Shock cord and securement of both ends
❏ Dart parachute
❏ Body, fins, and remaining hardware
❏ 15. Download/collect data from dart
❏ Stratologger
❏ Arduino/IMU
❏ Camera