post-doctoral scholar
TRANSCRIPT

Evaluating the Influence of Information Provision (When and How) on Route Choice
Preferences of Road Users in Greater Orlando: Application of a Regret Minimization
Approach
Naveen Chandra Iraganaboina*
Graduate Student
Department of Civil, Environmental & Construction Engineering, University of Central Florida
Tel: 321-295-2134; Email: [email protected]
ORCiD number: 0000-0002-1425-6897
Tanmoy Bhowmik
Post-Doctoral Scholar Department of Civil, Environmental & Construction Engineering, University of Central Florida
Tel: 407-927-6574; Fax: 1-407-823-3315; Email: [email protected]
ORCiD number: 0000-0002-0258-1692
Shamsunnahar Yasmin
Research Fellow, Centre for Accident Research and Road Safety – Queensland
Queensland University of Technology, Australia
Tel: +61731384677; Fax: +61731387532; Email: [email protected]
ORCiD number: 0000-0001-7856-5376
Naveen Eluru
Professor
Department of Civil, Environmental & Construction Engineering, University of Central Florida
Tel: 407-823-4815; Fax: 407-823-3315; Email: [email protected]
ORCiD number: 0000-0003-1221-4113
Mohamed A. Abdel-Aty
Professor
Department of Civil, Environmental & Construction Engineering, University of Central Florida
Tel: 407-823-4535; Fax: 407-823-3315; Email: [email protected]
ORCiD number: 0000-0002-4838-1573
Declarations of Interest: None
*Corresponding author

2
ABSTRACT
With the advancement in traffic management systems and improving accessibility to traffic
information through various sources such as mobile apps, radio, variable message sign; road users
tend to choose their route based on a complex interaction of various attributes including travel
time, delay, travel cost and information provision mechanisms. While earlier research has
examined route choice preferences in relation to travel time and travel cost (or toll), there is little
guidance on the influence of information provision mechanisms. By accommodating for
information provision attributes, the proposed research contributes to our understanding of the
design of an active traffic management (ATM) system by quantitatively estimating the inherent
trade-offs across the various attributes affecting route choice. Specifically, the research designs
and elicits data using a web-based stated preference (SP) survey to understand road users’
preferencesin the Greater Orlando Region, USA. In the empirical analysis, the data compiled is
utilized to develop random utility maximization and random regret minimization based panel
mixed multinomial logit models. Route choice behavior is modeled using a comprehensive set of
exogenous variables including trip characteristics, roadway characteristics and traffic information
characteristics. The model results are utilized to conduct a comprehensive trade-off analysis across
various attributes for the two model frameworks. In this research effort, we also customize the
trade-off computation for regret minimization model for accommodating variable interactions. The
trade-offs results provide useful insights on travel information provision (when and how).
KEYWORDS: Route choice; Integrated active traffic management; Stated Preference; Regret
Minimization;
HIGHLIGHTS:
• Stated preference (SP) survey to understand route choice preferences in Greater Orlando
Region
• Random utility maximization and random regret minimization based mixed multinomial
logit models are compared
• Regret frameworks offered improved fit
• Trade-offs associated with travel information provision (when and how) are estimated

3
1 INTRODUCTION
In developed countries such as the United States, a significant number of individuals depend on
the automobile as the main mode of transportation. The high auto dependency, in turn, results in
high auto travel demand on the roadways. At the same time, the ability to build additional
infrastructure is limited by high capital costs, real-estate constraints and environmental
considerations. The net result has been that traffic congestion levels in metropolitan areas have
risen substantially over the past decade. Specifically, the economic costs of traffic congestion –
direct costs (time and fuel wastage) and indirect costs (increase in transportation costs) – amount
to nearly 305 billion dollars in 2017 (INRIX, 2018). The annual economic costs add up to nearly
$3000 per resident in large urban regions such as Los Angeles and New York City. While the scale
of the congestion impact across urban and rural regions is different, congestion does affect all
regions significantly. The impact of congestion is also not restricted to the peak hour. An analysis
of temporal profile of the delays across the nation has found that 41 percent of these events occur
outside the peak hours (in midday and overnight times) (Schrank et al., 2015).
Traffic congestion can generally be attributed to either recurring or non-recurring events.
Congestion arising from recurring events is generally a result of mismatched transportation
demand and supply (or capacity). Non-recurring congestion, on the other hand, is a result of
unexpected (or irregular) events such as abandoned vehicles, adverse weather, spilled loads,
highway debris, and traffic crashes. The potential solutions for recurring and non-recurring
congestion are typically distinct. Traditional approaches for alleviating recurring congestion focus
on the longer horizon solutions that employ travel demand strategies to reduce transportation
demand by altering dimensions such as transportation mode and departure time. On the other hand,
to alleviate non-recurring congestion solution approaches focus on shorter time horizons and rely
on active traffic management systems that provide information on the event and potential
alternative routes to the road users. For example, there is evidence to indicate that provision of real
time traffic information such as incident reporting and peak hour congestion encourages road users
to choose alternate routes (Zhang et al., 2014, Khoo and Asitha, 2016, Gan and Ye, 2014).
In recent years, a bridge between solutions for recurring and non-recurring congestion has
been established through advances in technology for real-time data collection and advent of real-
time congestion pricing within an integrated active traffic management system. In these systems,
road users are provided information on travel time and cost information associated with various
route alternatives. A requisite component of such a system is the evaluation of the influence of
user preferences for selecting alternative routes. These preferences include facility preferences
(such as arterial versus freeway), pricing trade-off (toll versus no-toll), travel time (mean and
potential delay), travel time reliability, time of information provision (prior to trip start, on route)
and mechanism for information provision (online, mobile app or social media). While earlier
research has examined route choice preferences in relation to travel time and travel cost (or toll)
there is little guidance on when and how information provision is undertaken. By accommodating
for information provision attributes, the proposed research contributes to our understanding of the
design of an active traffic management (ATM) system by quantitatively estimating the inherent
trade-offs across the various attributes affecting route choice. The research designed and elicited
data using a stated preference (SP) survey to understand road users’ preferences. The data from
the SP survey is analyzed to understand how various attributes affect individual route choice
behavior.
The proposed research augments earlier work by incorporating alternative decision rules
for analyzing route choice behavior. In modeling route choice, the prevalent decision rule for

4
developing discrete choice models is the random utility maximization (RUM) approach. RUM
based approaches assume that decision makers prefer routes that provide the highest utility or
satisfaction (Ben-Akiva et al., 1985, Train, 2009, McFadden, 1974). The approach allows for the
consideration of trade-offs across various attributes affecting the choice process. This implicit
compensatory nature of the formulation allows for a poor performance on an attribute to be
compensated by a positive performance on another attribute (Chorus et al., 2008). Several
researchers, motivated by research in behavioral economics, have considered alternative decision
rules for developing discrete choice models such as relative advantage maximization (Leong and
Hensher, 2015), contextual concavity (Kivetz et al., 2004), fully-compensatory decision making
(Arentze and Timmermans, 2007, Swait, 2001), prospect theory (PT) (Kahneman and Tversky,
2013, Tversky and Kahneman, 1992), and random regret minimization (RRM) (Chorus et al.,
2008, Chorus, 2010). Among these approaches, we select the regret minimization approach for our
route choice analysis due to its mathematical simplicity within a semi-compensatory decision
framework. We compare the performance of RUM based multinomial logit (MNL) and random
regret minimization (RRM) based MNL models. The reader would note that the SP data elicitation
exercise involves multiple responses from each individual. Hence, the research employs a panel
mixed modeling approach that accommodates for the influence of common unobserved factors on
respondent choice process. Furthermore, we also conduct a comprehensive trade-off analysis to
highlight the differences across the two model approaches. The trade-off analysis will provide
useful insights for ATM system operators.
The remaining document is organized as follows: Section 2 focuses on earlier research and
positions the current work. Section 3 presents the materials and methods used in the research,
including details of the route choice survey conducted in the Greater Orlando region and the
mathematical modeling framework. Section 4 discusses model results that provides insights on
route choice decision process. Trade-off analysis is presented in Section 5. Lastly, Section 6
summarizes the work and provides concluding comments.
2 EARLIER RESEARCH AND CURRENT STUDY IN CONTEXT
Given the prevalence of traffic management strategies to enhance transportation systems, it is not
surprising that the several research efforts have studied route choice decision processes. Studies
examined decision processes across road users (motorists, non-motorists, and public
transportation), travel purpose (commute versus discretionary trips), pricing, message content,
message dissemination platforms (such as message signs, online or mobile) and message delivery
time (such as before the trip and on route). An exhaustive review of earlier research on the topic
is beyond the scope of our paper. Hence, we narrow our literature review based on the following
parameters relevant to our research: (1) studies focused on motorist travel behavior, (2) studies
developing quantitative models for understanding route choice processes using survey data (3)
studies conducted recently (2005 and after) and (4) studies focused on route choice behavior based
on route attribute summary1. Based on these parameters, the relevant literature is summarized in
Table 1.
1 The reader would note that several research studies have examined link level route choice decisions of users on real
or simulated networks. For such studies, the reader is referred to Van Cranburgh et al., 2015; Prato, 2014 and Prato,
2009. In these link level studies, accommodating for the influence of information provision will be quite challenging
and can be a potential avenue for future research.

5
Table 1 Literature Review Matrix
Study Survey
type Area Target Type of users
Type of
facility Attributes considered
Methodological
approach
(Chorus et al.,
2007)
SP
(Likert
Scale)
Netherland
Examine travelers’
need for traffic
information
General
population Any road
• Socio-economic
characteristics
• Current travel behavior
• Traffic information
• Service of travel information
• Mode of traffic information
Structural equation
modeling (SEM)
(Zhang et al., 2014) SP Central
Texas
Effect of traffic
information on toll
road usage
Commuters Freeway
(toll road)
• Traffic information
• Current travel behavior
• Socio-economic
characteristics
Nested and
multinomial logit
model
(Khoo and Asitha,
2016) SP
Klang Valley
region of
Malaysia
Evaluate effect of
traffic app on
driver’s route choice
behavior
General
population
Arterial and
Freeway
• Perceived traffic information
accuracy
• Traffic information
• Real time rerouting advice
• Incident and delay estimation
• Navigation & service
subscription
Bivariate probit
models
(Gan and Ye,
2014) SP
Shanghai
Pudong
international
airport.
Examine motorist’s
diversion decision
behavior under
VMS**
General
population Freeway
• Socio-economic
Characteristics
• Diversion decision under
VMS
Cross sectional logit
model and Mixed
logit model
(Petrella et al.,
2014) SP
US-75
corridor in
Dallas,
Texas; I-15
corridor in
San Diego,
California
Explore travelers’
response to real time
traffic and traveler
information
Commuters Freeway
• Socio-economic
characteristics
• Level of satisfaction with trip
• Level of traffic congestion
• Predicted trip time
• Overall driving time
• Traffic information
Descriptive analysis
(Tseng et al., 2013) RP
Dutch A12
motorway
corridor
Effect of traffic
information on
traveler behavior
Commuters Freeway
• Expected travel time
• Time difference
• Delay
• Weather
Mixed logit model
(Javid et al., 2013) RP Lahore,
Pakistan
Effect of radio on
traveler route choice
behavior
Commuters Any road
• Socio-economic
characteristics
• Trip characteristics
• Tendency to listen radio
• Performance service attribute
of radio
Structural equation
modeling (SEM)

6
Study Survey
type Area Target Type of users
Type of
facility Attributes considered
Methodological
approach
(Bagloee et al.,
2014) RP Tehran, Iran
Examine drivers’
response to radio
(traffic information)
Commuters Any road
• Socio-economic
characteristics
• Work-related information
• Driver behavior information
• Traffic information (radio)
Neural network
model, Ordered probit
and Binary logit
model
(Choocharukul,
2008) SP and RP
Bangkok,
Thailand
Explore the
contributing factors
for drivers’ route
diversion
General
population Intersection
• Traffic delay
• Socio-economic
Characteristics
• Trip characteristics
• VMS
Structural equation
modeling (SEM)
(Meng et al., 2017) SP and RP
Northern and
Eastern side
of Singapore
Examine the travel
behavior of
commuter motorists
Commuters Any road
• Socio-economic
characteristics
• Trip characteristics
• Traffic delay and cost
Binary logit model
(Al-Deek et al.,
2009) SP and RP Orlando
Analyze the effect of
VMS on route choice Commuters
Freeway and
Expressways
(Toll roads)
• Socio-economic
characteristics
• Trip Characteristics
• Traffic Information
Binary Logit Model
(Ardeshiri et al.,
2015)
SP and
Driving
simulator
Baltimore
metro area
Analyze driver
response behavior
under real-time route
guidance through
VMS
General
population
Expressways
and local
arterial
• Socio-economic
characteristics
• VMS & Traffic information
Ordinal logistic
regression
(Ben-Elia et al.,
2008) SP
Hypothetical
routes
Analyze the effect of
traffic information
on route choice
General
population
Not
specified • Traffic information Linear mixed model
(Lee et al., 2010) Likert
Scale (SP) Wisconsin
Analyze the effect of
VMS on route choice
General
population
Interstate
Highway
network
• Prior knowledge of the
routes (Likert scale)
Logistic regression
trees with unbiased
selection (LOTUS)
(Gan and Ye,
2012) SP Shanghai,
China
Study route diversion
response to VMS
General
population
Freeway and
Local roads
• Socio-economic
characteristics
• Trip characteristics
Binary probit model
(Gan and Ye,
2014) SP
Shanghai,
China
Study route diversion
response to VMS
General
population
Freeway and
Local roads
• Socio-economic
characteristics
• Trip characteristics
Multinomial logit
(MNL) and Mixed
MNL
(Gan et al., 2013) SP Shanghai,
China
Study route diversion
response to travel
time
General
population
Freeway and
Local roads
• Socio-economic
characteristics
• Trip characteristics
Generalized
estimation equations
(GEEs) with logit link
function

7
Study Survey
type Area Target Type of users
Type of
facility Attributes considered
Methodological
approach
(Gan and Chen,
2013) SP
Shanghai,
China
Study route choice to
Graphical Route
Information Panel
(GRIP)
General
population
Freeway and
Local roads
• Socio-economic
characteristics
• Trip characteristics
Binary logit model
(Kusakabe et al.,
2012) SP Japan
Study route diversion
response to incident
information VMS
General
population
Expressway
and Arterial • Traffic information
Multinomial logit
(MNL)
(Majumder et al.,
2013) SP
Calgary,
Canada
Study driver
response to VMS Commuter
Expressway
and Arterials
• Socio-economic
characteristics
• Network familiarity
• Information access
• Trip characteristics
Generalized ordered
logit (GOL)
(Moghaddam et al.,
2019)
SP and
Driving
simulator
Maryland
Role of travel time
reliability on route
choice
General
population
Expressway
and Arterials
• Socio-economic
characteristics
• Trip characteristics
Binary probit, Binary
logistic regression
and Multinomial
logistic regression
(Peeta and Ramos,
2006) SP Indiana
Driver response to
traffic information
through VMS
General
population Expressway
• Socio-economic
characteristics
• Trip characteristics
Binary logit model
(Poulopoulou et al.,
2015) SP Athens
Driver response to
incident information
through VMS
Taxis and Trucks Expressway
• Socio-economic
characteristics
• Trip characteristics
Ordered probit model
with random effects
(Song et al., 2017) Driving
simulator Indiana
Effect of real time
information on route
choice
General
population
Expressway
and arterials
• Socio-economic
characteristics
• Trip characteristics
Binary logit model
and Hybrid choice
model with latent
variables
(Wang et al., 2017) SP China Driver route choice
behavior
General
population All roads
• Socio-economic
characteristics
• Trip characteristics
Binary probit model
(Zhao et al., 2019) RP and SP China
Driver response to
incident information
through VMS
General
population
Expressway
and arterials
• Socio-economic
characteristics
• Trip characteristics
• Road information
Multinomial logit
model
* Note: ATIS (Advanced Traveler Information System)
** Note: VMS (Variable Message Sign)

8
The table provides information on the study, type of survey conducted, study location,
objective of the study, type of roadway facilities, independent attributes considered, and the
modeling framework employed. Several observations can be made from Table 1. First, three
approaches of survey data collection are observed including (a) SP Survey - a choice set with the
exhaustive choices, attributes and combinations are provided to the respondent mimicking a real
world scenario (b) Revealed Preference (RP) Survey -- the respondent reveals the choice along
with the attributes associated with the chosen alternative (non-chosen alternatives and their
attributes are usually inferred by analysts) and (c) a joint RP and SP survey – a survey approach
that elicits both revealed and stated preferences of respondents. Second, the geographical extent of
the research covers various countries including Netherlands, Malaysia, China, USA, Ireland,
Pakistan, Iran, Switzerland, Thailand, Singapore, Canada and Japan. Third, the attributes
considered cover the following categories: trip characteristics, individual and household socio-
demographics, roadway type, and traffic information (media and accessibility). Fourth,
methodologies considered in these studies vary from simple analysis of variance (ANOVA)
approaches to modeling approaches such as multinomial logit, ordered logit and structural equation
modeling techniques. Among advanced econometric approaches, researches have employed
nested logit and panel mixed multinomial logit models. More recently, studies have also employed
machine learning models including Artificial Neural Networks (ANNs). From literature search, it
is observed that only few studies emphasized on importance of accessibility of traffic information,
most importantly on the stage of availability of traffic information (like pre-trip and en-route)
(Zhang et al., 2014, Khoo and Asitha, 2016). Some studies have exclusively studied traffic
information provision through one media mode such as radio (Javid et al., 2013, Bagloee et al.,
2014), variable message sign (VMS) (Gan and Ye, 2014, Al-Deek et al., 2009, Ardeshiri et al.,
2015, Lee et al., 2010, Gan and Ye, 2012), mobile apps (Skelley et al., 2013, Khoo and Asitha,
2016, Song et al., 2017) and other sources (Gan and Chen, 2013).
It is evident from the literature review that substantial research has been conducted to
examine the relationship between various attributes and route choice decision processes. However,
several questions about route choice decision processes remain unanswered. First, while multiple
studies have conducted route choice analysis, the trade-off between travel attributes (such as travel
time and delay) and information provision strategies (such as how and when to provide
information) are not well understood. Second, while these studies stressed the role of information
provision media to be adopted, the interactions for information provision (when and how) with
other attributes is not well explored (Zhang et al., 2014). Specifically, important attributes such as
availability of traffic information (available or not and the stage of availability like pre-trip or en-
route) and media to access traffic information (mobile apps, radio and VMS) and their interaction
with other attributes are not considered in the analysis process. Third, among commonly employed
quantitative route choice models, there is an inherent preference for adopting the RUM based MNL
model for analysis. While the traditional MNL model provides useful insights, the emergence of
semi-compensatory modeling approaches such as RRM based MNL model might offer improved
insights on route choice decision processes. Finally, earlier research on regret minimization
approaches developed trade-off measures with only main effects. In our route choice model,
several interaction effects are considered along with the main effects. Hence, we customized the
trade-off computation for regret minimization models to accommodate for these interactions. The
proposed research conducted a SP survey-based data elicitation of route choice preferences in the
Greater Orlando Region.

9
3 MATERIALS AND METHODS
The city of Orlando, also known as “The City Beautiful” and “The Theme Park Capital of the
World” has a metropolitan population of 2 million according to 2018 census (US-DOC, 2018).
Orlando city, ranks 23rd in traffic congestion within the US with the annual monetary cost of
congestion amounting to nearly a thousand dollars per road user (INRIX, 2018). Greater Orlando
region has a roadway system with a number of tolled expressways (SR 408, SR 414, SR417, SR
429 and SR 528), arterials and the interstate freeway (I-4).
3.1 Route Choice Survey
In order to study the factors effecting the route choice in Greater Orlando Region, a survey is
designed and disseminated to potential drivers in the Greater Orlando region. Our survey focuses
on obtaining responses from road users along three different dimensions. These are:
1. Demographic information (including gender, age, education level, employment type, years
of driving experience and car availability),
2. Trip level information (including use of expressway, smartphone owner, current mode of
accessing traffic information and preferred mode of accessing traffic information), and
3. Hypothetical route choice scenarios (series of route scenarios for respondents).
Among the aforementioned dimensions, first two sections record direct responses to the
questions related to the respondent demographics and trip characteristics. The major focus of the
survey design was on implementing an appropriate experimental design for generating the
hypothetical route choice scenarios. In an effort to develop a customized survey experience for
respondents, we developed route choice scenarios for the respondent’s home location and their
most commonly used destination (possibly work or other). To reduce the privacy burden on
respondents, the location information was compiled at the zip code level. Based on the information
provided, customized Google Maps based route alternatives were generated with detailed
information on the various route alternatives provided pictorially. The customized images were
only generated for a sample of origin-destination zip code pairs. For respondents outside these zip
code pairs, a non-pictorial version of the survey was designed. Prior to the experimental design
exercise, an important step in SP survey design includes identifying and defining, clearly and
adequately, the attributes that characterize the available alternatives of the choice context
(Hensher, 1994, de Dios Ortuzar and Rodrıguez, 2002, Anowar et al., 2017). The attributes that
are adopted in our study are roadway type, travel time, added delay, availability of traffic
information, media for accessing traffic information and toll cost. A detailed description of these
attributes along with the various levels considered for the SP design are presented in Table 2. The
reader would note that there are differences in the attributes used in the pictorial and non-pictorial
scenario. In the pictorial version, the route was not labelled as predominantly arterial or
expressway as the respondent is likely to decipher this information from the figure. Second, the
travel time information in the pictorial choice scenario is based on the actual travel times2 for each
route with additions/subtractions as defined. For the non-pictorial version, we have two defined
travel time attribute levels shown in the table determined randomly for each respondent.
2 The times accessed from Google Map are for expected (or realistic) travel times for an origin destination pair.

10
Table 2 Attribute Levels for Route Choice Scenarios
Attribute Definition Attribute levels for identified ZIP codes Attribute levels for unidentified ZIP codes
Roadway types Roadway types refers to the class
of roadway.
These are not provided in the attributes list, but a
graphical representation of the route is provided
2 attribute levels defined as
1. Arterial (25 to 55 mph)
2. Expressway (>55mph)
Travel time
(minutes)
Travel time refers to the time that
you are likely to observe while
travelling from your trip origin to
trip destination.
6 attribute levels defined as 6 attribute levels defined as
(Expressway/Arterial)
1. Travel time extracted from Google map – 6 1. 15/20
2. Travel time extracted from Google map – 3 2. 20/25
3. Travel time extracted from Google map 3. 25/30
4. Travel time extracted from Google map + 3 4. 30/35
5. Travel time extracted from Google map + 6 5. 35/40
Added delay
(minutes)
Added delay refers to the
additional time required to travel
from your trip origin to trip
destination if there were
congestion due to heavy traffic or
some other incidents (such as a
crash).
4 attribute levels defined as 4 attribute levels defined as
1. 0 1. 0
2. 3 2. 3
3. 6 3. 6
4. 10 4. 10
Availability of
traffic
information
Availability of traffic
information refers to the stage of
traffic information.
3 attribute levels defined as 3 attribute levels defined as
1. None 1. None
2. Pre-trip 2. Pre-trip
3. En-route 3. En-route
Media for
accessing
traffic
information
Media for accessing traffic
information refers to the media
sources available for traffic
information.
4 attribute levels defined as 4 attribute levels defined as
1. None 1. None
2. Mobile app 2. Mobile app
3. Twitter 3. Twitter
4. Radio 4. Radio
Toll cost ($)
Toll cost refers to the charge
payable for permission to use a
road.
4 attribute levels defined as 4 attribute levels defined as
1. 0 1. 0
2. 1.5 2. 1.5
3. 3 3. 3
4. 4 4. 4

11
(a) For OD pairs in selected zip codes (b) For OD pairs outside selected zip codes
Figure 1 Sample Scenario for SP section

12
Within each choice question, three alternative routes (with different levels of the five (identified
ZIP codes)/six (unidentified ZIP codes) route attributes selected) were presented, and the
respondent was asked to make a choice among the alternatives presented. The consideration of 3
scenarios in the SP design is very common in transportation and SP route choice analysis (see
Anowar et al., 2017, Sener et al., 2009). We used the experimental design routines in SAS
(fractional factorial design) to develop the route choice alternatives in each scenario presented to
the respondents. The design was checked to ensure that the attribute levels of the alternatives did
not create dominating alternatives. The survey experiments for the pictorial and non-pictorial cases
are presented in Figure 1. As the pictorial version of the survey provides route alternatives familiar
to the respondent, it is expected to be less burdensome. Hence, these respondents were provided 6
choice scenarios while the non-pictorial version respondents were provided 5 choice experiments.
The survey was designed online using a combination of JavaScript and Java programs. It
was then coded on the University of Central Florida (UCF) Qualtrics platform with compatibility
tested for computers and mobile phones. Before disseminating the survey, a pilot survey was
conducted to debug and find any inconsistencies. After multiple iterations based on feedback
gathered from pilot surveys, the survey was finalized. The SP scenarios were preceded by clear
definitions of the attributes. We adopted several survey dissemination, distribution, and
advertisement schemes for collecting responses. For instance, web-links to the surveys were
emailed to individuals, university electronic mailing lists, organizations, and groups; posts related
to the survey were uploaded in different social media platforms including Facebook, LinkedIn,
Instagram and Twitter. Individuals who learnt about our survey from these sources were
encouraged to distribute it to their peers, colleagues, family, and friends. Owing to the sampling
technique, it is likely that most of the respondents had access to computers and/or smart phones.
The survey design was approved by UCF Institutional Review Board (IRB) before disseminating
the survey.
3.2 Empirical Results
In the preliminary pilot testing of the survey, it has been observed that the minimum time to fill
the survey is about five minutes. So, to make sure that the survey is filled with adequate
consideration of the questions, the responses with a minimum completion time of 4 minutes were
only considered for further analysis. Of the 1602 responses obtained, 567 responses do not meet
the minimum time criteria and 106 responses do not have complete information. Therefore, these
records were removed. Among the remaining 929 survey responses, 165 responses are with
identified ZIP codes (6 scenarios in response) and 764 responses are with unidentified ZIP codes
(5 scenarios in each response). Thus, the final dataset has 4810 choice scenarios from 929
respondents. Descriptive statistics for the sample used in this study are presented in Figure 2(a)
and Figure 2(b).

13
(a) (b)
Figure 2 Characteristics of Survey Respondents [(a) Demographic, (b) Travel

14
3.3 Demographic Profile
From Figure 2(a) and Figure 2(b), we can see that out of 929 respondents, 42.4% are male and
57.6% are female. In terms of age categories, almost half of the respondents belong to younger age
group category (18-34 years). Only 3.7% of the respondents are aged above 65 years. Majority of
respondents are highly educated (71%) amongst which almost 44% held at least graduate degree
while around 27% had completed a bachelor’s degree. One fourth of the respondents are students
and more than half are fully employed. Around one tenth are employed part-time and less than 1%
are either unemployed or self-employed. Among the full-time employees, around 85% have a
graduate degree.
Out of 929 respondents, about 62% of them have driving experience of more than 10 years
while only around 2% did not drive at all. In case of use of expressway, around 30% of the
respondents use expressway on a daily basis. However, more than one-third of the respondents do
not use expressway very frequently. From Table 3 we can see that, almost 96% of the respondents
have a car available to them always and just 1.4% do not have a car available. In the survey, we
also asked the participants about their current mode of receiving traffic information and we allow
them to select multiple options. Result shows that more than 80% people used mobile app as their
source of traffic information, followed by radio (40%) and variable message signs (31%). From
the table, it is evident that respondents often use multiple modes for accessing traffic information.
Moreover, we asked the respondents about their preferred mode for accessing traffic information
and from the sample, we found that, around 69% of the people preferred mobile app as their source
for traffic information.
3.4 Methods
In the current research effort, we compare random utility-based panel mixed multinomial logit
(Panel MRUM) and regret-based panel mixed multinomial logit (Panel MRRM) model
formulation for our responses. In this section, we explain the econometric frameworks of these
models employed in the current study.
Let 𝑡 (𝑡 = 1,2, … , 𝑇) be the index for respondents, 𝑟 (1, 2, … , 𝑅) be the index for route
alternative, and 𝑘 (1, 2, … , 𝐾) be the index for choice occasions for each respondent. In our case,
𝑅 = 3 and 𝐾 = 5 𝑜𝑟 6 for all 𝑡. With this notation, the random utility formulation takes the
following familiar form:
𝑈𝑡𝑟𝑘 = (𝛼′ + 𝜂𝑡′)𝑧𝑡𝑟𝑘 + 𝜉𝑡𝑟𝑘 (1)
𝑧𝑡𝑟𝑘 is a vector of route attributes influencing the utility of respondent 𝑡 for route alternative 𝑟 at
the 𝑘𝑡ℎ choice occasion. 𝛼′ is a corresponding vector of coefficients (representing mean effects),
𝜂𝑡′ is another vector representing unobserved factors specific to respondent 𝑡 – the elements of 𝜂𝑡
′
are considered to be independent realizations from a normal population distribution
(𝜂𝑡′~𝑁(0, 𝜎2)), and 𝜉𝑡𝑟𝑘 is a random error term assumed to be identically and independently Type
1 Extreme Value distributed. Then, in case of Panel MRUM approach, the probability that any
road user 𝑡 will select route 𝑟 for a given value of 𝜂𝑡′ can be expressed as:
𝑃𝑡𝑟𝑘|𝜂𝑡′ =
𝑒[(𝛼′+𝜂𝑡′)𝑧𝑡𝑟𝑘]
∑ 𝑒[(𝛼′+𝜂𝑡′)𝑧𝑡𝑟𝑘]𝑅
𝑟=1
(2)
In case of Panel MRRM approach, the random regret associated with the route choice is
given as
𝑅𝑅𝑡𝑟𝑘 = ∑ ∑ 𝑙𝑛 {1 + 𝑒𝑥𝑝 [(𝛽′ + 𝜓𝑡′)(𝑧𝑡𝑠𝑛𝑘 − 𝑧𝑡𝑟𝑛𝑘)]}𝜀𝑡𝑟𝑘
𝑛=1,2,…,𝑁𝑠≠𝑟
(3)

15
where 𝑠 and 𝑟 are routes and each route is characterized by 𝑁 attributes. 𝑧𝑡𝑟𝑛 and 𝑧𝑡𝑠𝑛 are route
attributes including all interactions influencing the regret associated to the route choice. 𝛽′ is a
corresponding vector of coefficients (representing mean effects), 𝜓𝑡′ is another vector representing
unobserved factors specific to respondent 𝑡 – the elements of 𝜓𝑡′ are usually considered to be
independent realizations from a normal population distribution (𝜓𝑡′~𝑁(0, 𝜔2)), and 𝜀𝑡𝑟𝑘 is a
random error term assumed to be identically and independently Type 1 Extreme Value distributed.
Then, in case of Panel MRRM approach, the probability that any road user 𝑡 will select route 𝑟 at
the 𝑘𝑡ℎ choice occasion can be expressed as:
𝑃𝑡𝑟𝑘|𝜓𝑡′ =
𝑒−𝑅𝑅𝑡𝑟𝑘
∑ 𝑒−𝑅𝑅𝑡𝑟𝑘𝑅𝑟=1
(4)
The unconditional probability, for both Panel MRUM and Panel MRRM can be written as:
𝑃𝑅𝑈𝑀 = ∫ (𝑃𝑡𝑟𝑘|𝜂𝑡′)
𝜂𝑡′
𝑑𝑭(𝜂𝑡′|𝜎) (5)
𝑃𝑅𝑅𝑀 = ∫ (𝑃𝑡𝑟𝑘|𝜓𝑡′)
𝜓𝑡′
𝑑𝑭(𝜓𝑡′|𝜔) (6)
where 𝑭 is the multivariate cumulative normal distribution. The log-likelihood (LL) function is
estimated using maximum simulated likelihood (MSL) estimation. For this study, we use a quasi-
Monte Carlo (QMC) approach with 500 draws for the MSL estimation (see (Bhat, 2001) for more
details). It should be noted that we do not have any alternative specific variables since the
alternatives are “unlabeled” and characterized by route attributes. The reader would note that it is
possible to consider alternative error distributions for estimating unobserved effects. For example,
for travel time and travel cost variables a log-normal error distributional assumption is suggested
to avoid any positive density distribution. However, in our empirical exercises the normal
distributional assumption yielded very small proportion of positive population density. Further,
considering log-normal distributional assumption resulted in poorer data fit across several
empirical datasets in our experience.
4 MODEL RESULTS
Several models were estimated with the attributes presented in Table 3. The models developed and
their corresponding log-likelihood (LL) values are (a) random utility based multinomial logit
(RUM-MNL): -4057.7, (b) random regret based multinomial logit (RRM-MNL): -4011.1, (c)
panel mixed RUM-MNL: -3661.52 and (d) panel mixed RRM-MNL: -3647.64. From the LL
values, it is evident that models recognizing the influence of common unobserved factors specific
to repeated measures for each individual offered improve data fit compared to simpler models
which did not account for the influence of unobserved factors. Across the RUM and RRM models,
for our data, the RRM models outperform the RUM counterparts.
The final specification of the model development was based on removing the statistically
insignificant variables in a systematic process based on 90% confidence level. Table 3Table 3
presents the estimation results of the route choice models for panel mixed RUM-MNL and panel
mixed RRM-MNL models. In the panel mixed RUM-MNL model, a positive (negative) coefficient
corresponds to increased (decreased) likelihood of selecting the route alternative. Similarly, in the
panel mixed RRM-MNL model, the positive (negative) coefficient indicates that potential regret

16
increases (decreases) when the non-chosen alternative performs better than the chosen alternative.
In the ensuing discussion, the model estimates from the two models are discussed by variable
groups: (a) Trip characteristics (travel time, travel cost and delay), (b) Roadway type (Arterial or
expressway) and (c) availability of traffic information (with no trip information being the base).
The model specification process considered multiple interactions of variables across the three
categories.
Trip Characteristics
Trip characteristics such as travel time, delay and travel cost are expected to have a significant
impact on route choice decision process. In addition to their main effects, several variables were
generated that incorporate the interactions between trip characteristics and roadway type and user
travel habits.
The coefficient for travel time, as expected, has a negative impact on route choice
preference indicating a lower regret of people towards longer routes. Our results are in line with
the results reported in earlier studies (Abdel-Aty et al., 1997, Khattak et al., 1996, Abdel-Aty et
al., 1995). At the same time, the model estimates also indicate a statistically significant random
parameter for travel time indicating that the impact of travel time varies across the sample
population. The parameter estimate is intuitive with the travel time coefficient being negative for
98.8% of the respondents. The interaction with roadway type (arterial) offers interesting results.
Specifically, individuals are willing to lower their sensitivity towards travel time on arterial roads
i.e. users are willing to travel slightly longer on arterials relative to expressways. In terms of road
user travel habits, frequency of expressway use moderates the impact of travel time. Specifically,
the model estimates indicate that individuals who use expressway regularly are likely to be more
sensitive to travel time relative to other road users. The delay variable refers to the additional travel
time required to travel from trip origin to trip destination due to heavy traffic or some other
incidents (bad weather or crashes). The coefficient for delay, as expected, has negative impact on
route choice preference indicating a lower regret for people towards longer routes (see Peeta and
Ramos, 2006, Poulopoulou et al., 2015, Zhao et al., 2019 for similar results). Some of the results
in earlier research also has drawn similar conclusions based on travel time savings (a variable that
is the opposite of delay) (Khoo and Asitha, 2016, Gan and Ye, 2014, Gan and Ye, 2012). The
interaction of delay variable with daily expressway users provides a valuable insight. Specifically,
daily expressway users are more sensitive to delay i.e. these individuals prefer low delay routes
with higher propensity. Also, the model results indicate a statistically significant random parameter
on delay. The parameter estimate is intuitive with the delay coefficient being negative for 98% of
the respondents. This indicates that there is a very small subset of respondents that are not affected
if delay is very small.
Travel cost in our study is defined as the toll cost of expressways. The arterial alternative
has been assigned a zero toll cost. The coefficient of the variable indicates a lower preference
among respondents towards the routes with tolls (similar findings can be seen in Khoo and Asitha,
2016). The interaction with daily expressway users indicates that daily expressway users are less
sensitive to travel cost. Also, from the interaction of travel cost with pre-trip information
availability, we observe that sensitivity towards travel cost reduces in the presence of such
information i.e. individuals that receive trip information are less sensitive to travel cost
highlighting a willingness to pay for this information. Finally, the model estimates also indicate a
statistically significant random parameter for travel cost. The parameter estimate is intuitive with
the coefficient of cost being negative for approximately 90% of the respondents.

17
Roadway Type
In the model estimation, the coefficient for arterials is estimated with expressways as base. The
coefficient for arterial roadway type has a positive impact on route choice, indicating that arterials
are preferred over expressways by the road users. At the same time, the model estimates also
indicate a statistically significant random parameter for arterial roadway type, indicating that
nearly 33% of respondents prefer expressways to arterials and 67% of respondents prefer arterials.
The result highlights the presence of heterogeneity for road user preferences.
Availability of Traffic Information
This information is provided to the road users as two attributes: (a) timing of information provision
and (b) mechanism of information provision. The reader would note that if the attribute level of
timing of information is never, then the mechanism of information provision will automatically be
none. This attribute combination is considered as the base level for the parameter estimation. In
terms of model estimates, the coefficient for pre-trip traffic information has a positive impact on
route choice indicating that the road users prefer traffic information before starting the trip. The
model estimates also indicate a statistically significant variation due to unobserved effects in the
sensitivity to pre-trip information. There are nearly 60% of respondents who are sensitive to the
pre-trip information. Secondly, importance of en-route information is studied along with the media
to access that information. The coefficients for en-route traffic information through mobile app
and radio have a positive impact on respondent preferences for these routes (see Zhang et al., 2014,
Song et al., 2017 for similar findings). Finally, the estimate for en-route information through
mobile app has statistically significant random parameter due to unobserved heterogeneity. The
parameter estimate is intuitive with the en-route traffic information through mobile app coefficient
being positive for three-fourths of the respondents.
Table 3 Model Estimation Results
Attribute
Category Attribute Attribute Levels
Panel mixed
RUM-MNL
Panel mixed
RRM-MNL
Estimate (t-stat) Estimate (t-stat)
Trip
characteristics
Travel time
Travel time -0.209 (-27.554) -0.150 (-21.363)
Standard deviation 0.095 (10.249) 0.072 (10.599)
Roadway type: Arterial -- 0.021 (2.296)
Expressway frequency: every day -- -0.015 (-1.759)
Delay
Delay -0.167 (-17.307) -0.113 (-17.8)
Standard deviation 0.097 (6.807) 0.056 (5.413)
Expressway frequency: every day -0.032 (-1.869) -0.025 (-2.233)
Travel cost
Travel cost -1.063 (-7.583) -0.653 (-7.132)
Standard deviation 0.802 (5.054) 0.548 (4.543)
Expressway frequency: every day 0.432 (2.332) 0.177 (1.657)
Traffic information: pre-trip 0.331 (4.759) 0.173 (3.533)
Roadway
Type Arterial
Arterial 1.896 (15.758) 0.826 (3.392)
Standard deviation 2.546 (19.103) 1.851 (17.891)

18
Attribute
Category Attribute Attribute Levels
Panel mixed
RUM-MNL
Panel mixed
RRM-MNL
Estimate (t-stat) Estimate (t-stat)
Availability of
Traffic
Information
(Base: No
information
available)
Pre-trip Pre-trip 0.193 (3.225) 0.087 (2.093)
Standard deviation 0.426 (3.823) 0.345 (4.96)
En-route
Mobile
En-route
Mobile 0.410 (4.287) 0.277 (4.316)
Standard deviation 0.692 (2.996) 0.412 (2.56)
En-route
Radio
En-route
Radio 0.600 (7.085) 0.205 (3.481)
Log-likelihood at convergence (N = 929) -3661.52 -3647.64
Akaike information criterion (AIC) 7355.04 7331.28
Bayesian Information Criterion (BIC) 7458.70 7418.29
5 TRADE-OFF ANALYSIS
In this section, we present the methodology employed to conduct our trade-off analysis and discuss
the findings3. In our trade-off analysis, we estimate the following trade-offs: (a) trade-off between
travel time and travel cost (often referred to as Willingness to Pay (WTP) or Value of Time (VoT)
measure), (b) trade-off between travel delay and travel cost and (c) trade-off between information
provision attributes and travel cost.
This section provides details of the trade-off analysis between travel time and delay with
travel cost. These trade-offs are valuation of route attributes in terms of cost, is also termed as
willingness to pay (WTP) for improvements in route attributes. In other words, it explains how
much the road users are willing to pay to improve the considered route attributes.
Trade-off between travel time and travel cost defined as ratio of marginal effects of travel
time and travel cost, can be expressed as:
𝑉𝑜𝑇 = (𝜕𝑈/𝜕𝑡𝑡)
(𝜕𝑈/𝜕𝑡𝑐) (7)
where 𝑈 is utility derived for the alternative, 𝑡𝑡 is travel time and 𝑡𝑐 is the travel cost variable.
In random utility framework, trade-off is independent of levels of attributes. So, VoT takes
the following form:
𝑉𝑜𝑇𝑅𝑈𝑀 = 𝛽𝑡𝑡 + ∑ 𝛽𝑡𝑘 𝑋𝑘𝑘
𝛽𝑡𝑐 + ∑ 𝛽𝐶𝑙 𝑌𝑙𝑙 (8)
where 𝛽𝑡𝑡 and 𝛽𝑡𝑐 are estimates of travel time and travel cost respectively. 𝑋𝑘 and 𝑌𝑙 are interaction
variables to travel time and travel cost respectively. 𝛽𝑡𝑘 and 𝛽𝑐𝑙 are estimates of interactions to
travel time and travel cost respectively.
In random regret framework, the trade-offs are dependent on levels of attributes. The
computation for utility without interaction terms is simple (Chorus, 2012). However, the
interaction terms in the model estimation increase the complexity of VoT expressionas follows:
𝑉𝑜𝑇𝑅𝑅𝑀 = ∑ −𝛽𝑡𝑡(1+
1
exp[𝛽𝑡𝑡(𝑡𝑗−𝑡𝑖)])𝑗 ≠𝑖 +∑ (∑ −𝛽𝑡𝑘 𝑋𝑘(1+
1
exp[𝛽𝑡𝑘𝑋𝑘(𝑋𝑘𝑗𝑡𝑗−𝑋𝑘𝑖𝑡𝑖)])𝑗 ≠𝑖 )𝑘
∑ −𝛽𝑡𝑐(1+1
exp[𝛽𝑡𝑐(𝑐𝑗−𝑐𝑖)])𝑗 ≠𝑖 +∑ (∑ −𝛽𝑐𝑙 𝑌𝑙(1+
1
exp[𝛽𝑐𝑙𝑌𝑙(𝑌𝑙𝑗 𝑐𝑗−𝑌𝑙𝑖𝑐𝑖)])𝑗 ≠𝑖 )𝑙
(9)
3 In addition to the trade-off computation, we also computed marginal effects for the different variables. Due to space
and readability considerations, these results are presented in the Appendix A.
19
Where 𝑡𝑖 and 𝑡𝑗 are represent the travel time attribute for the chosen route 𝑖 and considered route
𝑗, respectively. 𝑐𝑖 and 𝑐𝑗 are represent the travel time attribute for the chosen route 𝑖 and considered
route 𝑗, respectively. Trade-off for delay and other information provision attributes can also be
computed by using the same formulations as presented in Equations 8 and 9 by appropriately
replacing travel time parameters with delay and information provision attributes.
The aforementioned discussion represents the coefficients of the various attributes as fixed
parameters. However, as discussed earlier, in our analysis, we estimated random parameters for
travel cost and travel time. Hence, across various trade-off computations, one or both the
coefficients are normally distributed. The evaluation of the complete distribution of these trade-
offs can be computationally quite involved (see for example Bliemer and Rose, 2013) and is
beyond the scope of our paper. In our analysis, we focus on presenting the results at the following
three points: (1) mean value of the parameters, (2) at the 10th percentile value based on the normal
distribution and (3) at the 90th percentile value. The formulation from equation 8 and 9 can be
applied by replacing the coefficient with the corresponding realization for that attribute. For the
ease of presentation, we only present the results for the mean values in the paper. The results for
the other two realizations are presented in the Appendix B. While the computation at these three
realizations does not represent the full distribution, it provides a range of trade-off values.
(a)

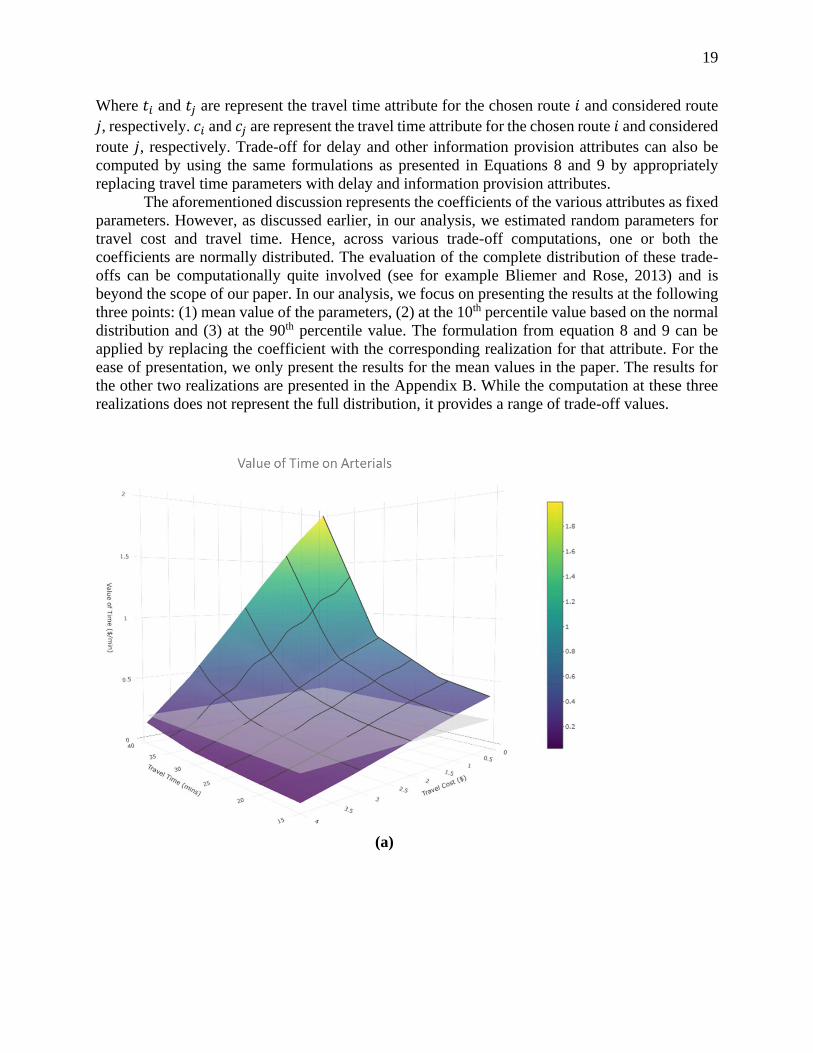
20
(b)
Figure 3 Value of Time [(a) Arterial; (b) Expressway]
The reader would note that there are differences in VoT representation across RUM and
RRM models due to the inherent differences in how they are computed. In RUM models, a constant
trade-off value i.e. is attribute invariant is generated. However, for RRM models, the VoT value
generated varies based on the attribute level. Hence, in a single plot for VoT for RUM and RRM
systems, the RUM plot would take the form of a horizontal plane while the RRM plot would be a
surface across different levels of travel time and cost. The same relationship holds for other trade-
offs as well. The results for VoT and trade-off for delay are presented in Figure 3 and Figure 4,
respectively.
(b)
Figure 3 Value of Time [(a) Arterial; (b) Expressway]
(a) and (b)
Figure 3 Value of Time [(a) Arterial; (b) Expressway]
(b) represent VoT on arterial and expressway, respectively. For the RRM approach, VoT
on arterial roads varies from 0.025 to 2 $/min, whereas on expressways it ranges from 0.06 to 2.14
$/min. From RUM approach, the VoT is 0.18$/min for arterials and 0.20$/min for expressways.
The VoT estimates are conformable with the VoT for Orlando (17.67$/hr or 0.295 $/min for 2014)
(Schrank et al., 2015). From the result, it is evident that VoT on expressways are slightly higher
than that of arterials. Further, the surface plot of VoT using RRM approach, explains that road
users with high travel time and low travel cost are willing to pay more to reduce their travel time
than the users with low travel time and high travel cost.

21
Figure 4 Trade-off for Delay
The trade-off for delay is presented in Figure 4. For the RRM approach, the trade-off varies
from 0.07 to 0.77 $/min while the RUM approach provides a constant trade-off of 0.16$/min. The
reader would note that the trade-off for delay is not affected by roadway type. The surface plot of
trade-off for delay using RRM approach indicates that road users with more delay and lower travel
cost are willing to pay more to reduce the delay incurred on the route than the users with less delay
and more travel cost.

22
(a)
(b)
Figure 5 Trade-off for Travel Information [(a) RRM-MNL, (b) RUM-MNL]
The trade-off for travel information is estimated for three levels of information provision;
(a) pre trip, (b) en-route through radio, and (c) en-route through mobile app. The trade-off for

23
travel information is presented in Figure 5. In the figure, the surface plot of trade-off for travel
information is varying from 0 to 1.61$ is estimated using regret-based approach and 0 to 3.59 $ is
estimated using utility-based approach. The surface plot of trade-off for travel information using
RRM approach, explains that road user’s willingness to pay to receive the information decreases
with travel cost, whereas the trade-off from RUM shows constant trade-off within each mode of
travel information. From both the plots it can be observed that the road users are willing to pay
more for en-route information (mobile applications followed by radio) than pre trip4.
6 SUMMARY AND CONCLUSIONS
Traffic congestion can generally be attributed to either recurring or non-recurring events. The
potential solutions for recurring and non-recurring congestion are typically distinct. However, in
recent years, a bridge between solutions for recurring and non-recurring congestion has been
established through advances in technology for real-time data collection and advent of real-time
congestion pricing within an active traffic management (ATM) system. In these systems, road
users are provided information on travel time and cost information associated with various route
alternatives. While earlier research has examined route choice preferences in relation to travel time
and travel cost (or toll), there is little guidance on the influence of information provision
mechanisms. By accommodating for information provision attributes, the proposed research
contributes to our understanding of the design of an ATM system by quantitatively estimating the
inherent trade-offs across the various attributes affecting route choice. Specifically, the research
designed and elicited data using a stated preference (SP) survey to understand road users’
preferences in the context of an ATM system in the Greater Orlando region, USA. The data from
the SP survey was utilized to develop random utility maximization (RUM) and random regret
minimization (RRM) based panel mixed multinomial logit models. Across the RUM and RRM
models, for our data, the RRM models outperformed the RUM counterparts. Overall, the route
choice decisions are influenced by travel time, travel cost and delay indicating lower preference
for routes with higher values specific to these variables. In terms of availability of traffic
information, the results indicated that road users preferred pre trip and en-route information, while
en-route traffic information through mobile app and radio found to influence route choice decision
positively. Earlier studies on regret minimization approaches developed trade-off measures with
only main effects. In our route choice model, several interaction effects offered significant
parameters. Hence, we customized the trade-off computation for regret minimization models to
accommodate for these interactions. The estimated VoT from RRM-MNL vary between 0.025 to
2 $/min for arterials whereas it varies from 0.06 to 2.14 $/min for expressways. The trade-off for
delay is 0.07 to 0.77 $/min. The estimated trade offs for travel information reveals that the road
users are willing to pay more for en-route than pre trip information. Also, the road user’s
willingness to pay to receive travel information decreases with travel cost.
To be sure, the study is not without limitations. The findings are based on data compiled
through a web-based survey that can be affected by respondent selection bias. The web survey
design only considered a fixed set of attributes for our hypothetical scenarios. However, increasing
the number of attributes included by focusing on the different components of congestion, travel
cost might be considered in studies conducted with emphasis on these attributes. The modeling
approaches in the paper can be improved by considering novel variants of random regret
minimization approaches developed for accommodating additional observed and unobserved
4 The reader would note that marginal effects for different explanatory variables are also generated and presented in
the Appendix for the sake of brevity.

24
heterogeneity through latent segmentation based model systems (for example see Charoniti et al.,
2020; Dey et al., 2018). Further, the data is from the Greater Orlando region and the model findings
such as VoT measures are not directly transferable to other regions.
ACKNOWLEDGEMENT
The authors acknowledge the critical comments from UCF graduate students during the pilot
survey which helped in fine tuning the survey. We also thank UCF for their support and help for
providing the mailing lists of staff and students of UCF to distribute the survey link. The authors
also acknowledge the financial support provided by Florida Department of Transportation
(FDOT).
REFERENCES
Abdel-Aty, M. A., Kitamura, R. & Jovanis, P. P. 1995. Exploring route choice behavior using
geographic information system-based alternative routes and hypothetical travel time
information input. Transportation Research Record.
Abdel-Aty, M. A., Kitamura, R. & Jovanis, P. P. 1997. Using stated preference data for studying
the effect of advanced traffic information on drivers' route choice. Transportation Research
Part C: Emerging Technologies, 5, 39-50.
Al-Deek, H., Venkata, S. R. C. C., Flick, J. & Khattak, A. 2009. Dynamic message sign
deployment and diversion behavior of travelers on Central Florida toll roads.
Transportation Research Record, 2129, 24-34.
Anowar, S., Eluru, N. & Hatzopoulou, M. 2017. Quantifying the value of a clean ride: How far
would you bicycle to avoid exposure to traffic-related air pollution? Transportation
research part A: policy and practice, 105, 66-78.
Ardeshiri, A., Jeihani, M. & Peeta, S. 2015. Driving simulator-based study of compliance
behaviour with dynamic message sign route guidance. IET intelligent transport systems, 9,
765-772.
Arentze, T. & Timmermans, H. 2007. Parametric action decision trees: Incorporating continuous
attribute variables into rule-based models of discrete choice. Transportation Research Part
B: Methodological, 41, 772-783.
Bagloee, S. A., Ceder, A. & Bozic, C. 2014. Effectiveness of en route traffic information in
developing countries using conventional discrete choice and neuralnetwork models.
Journal of Advanced Transportation, 48, 486-506.
Ben-Akiva, M. E., Lerman, S. R. & Lerman, S. R. 1985. Discrete choice analysis: theory and
application to travel demand, MIT press.
Ben-Elia, E., Erev, I. & Shiftan, Y. 2008. The combined effect of information and experience on
drivers’ route-choice behavior. Transportation, 35, 165-177.
Bhat, C. R. 2001. Quasi-random maximum simulated likelihood estimation of the mixed
multinomial logit model. Transportation Research Part B: Methodological, 35, 677-693.
Bhat, C. R. & Sardesai, R. 2006. The impact of stop-making and travel time reliability on commute
mode choice. Transportation Research Part B: Methodological, 40, 709-730.
Bliemer, M. C. & Rose, J. M. 2013. Confidence intervals of willingness-to-pay for random
coefficient logit models. Transportation Research Part B: Methodological, 58, 199-214.
Charoniti, E., Kim, J., Rasouli, S. and Timmermans, H.J., 2020. Intrapersonal heterogeneity in car-
sharing decision-making processes by activity-travel contexts: A context-dependent latent

25
class random utility–random regret model. International Journal of Sustainable
Transportation, pp.1-11.
Choocharukul, K. 2008. Effects of attitudes and socioeconomic and travel characteristics on stated
route diversion: Structural equation modeling approach of road users in Bangkok,
Thailand. Transportation Research Record: Journal of the Transportation Research
Board, 35-42.
Chorus, C. 2012. Random regret minimization: an overview of model properties and empirical
evidence. Transport Reviews, 32, 75-92.
Chorus, C. G. 2010. A new model of random regret minimization. European Journal of Transport
and Infrastructure Research, 10.
Chorus, C. G., Arentze, T. A. & Timmermans, H. J. 2008. A random regret-minimization model
of travel choice. Transportation Research Part B: Methodological, 42, 1-18.
Chorus, C. G., Arentze, T. A., Timmermans, H. J., Molin, E. J. & Van Wee, B. 2007. Travelers'
need for information in traffic and transit: Results from a web survey. Journal of Intelligent
Transportation Systems, 11, 57-67.
De Dios Ortuzar, J. & Rodrıguez, G. 2002. Valuing reductions in environmental pollution in a
residential location context. Transportation Research Part D: Transport and Environment,
7, 407-427.
Dey B. K., S. Anowar, N. Eluru, and M. Hatzopoulou (2018), "Accommodating Exogenous
Variable and Decision Rule Heterogeneity in Discrete Choice Models: Application to
Bicyclist Route Choice", PLoS ONE 13(11): e0208309.
Gan, H.-C., Bai, Y. & Wei, J. 2013. Why do people change routes? Impact of information services.
Industrial Management & Data Systems, 113, 403-422.
Gan, H. & Chen, S. 2013. Why Do Drivers Change Routes? Impact of Graphical Route
Information Panels. Institute of Transportation Engineers. ITE Journal, 83, 38.
Gan, H. & Ye, X. 2012. Urban freeway users' diversion response to variable message sign
displaying the travel time of both freeway and local street. IET Intelligent Transport
Systems, 6, 78-86.
Gan, H. & Ye, X. 2014. Leave the expressway or not? Impact of dynamic information. Journal of
Modern Transportation, 22, 96-103.
Hensher, D. A. 1994. Stated preference analysis of travel choices: the state of practice.
Transportation, 21, 107-133.
Inrix. 2018. Interactive Traffic Congestion Ranking & City Dashboards [Online]. Available:
http://inrix.com/scorecard/ [Accessed 01 June 2019].
Javid, M. A., Okamura, T., Nakamura, F. & Rui, W. 2013. Analysis and Modeling of Commuters’
Perception to Radio Traffic Information in Lahore, Pakistan. 20th ITS World Congress
Tokyo.
Kahneman, D. & Tversky, A. 2013. Prospect theory: An analysis of decision under risk. Handbook
of the fundamentals of financial decision making: Part I. World Scientific.
Khattak, A., Polydoropoulou, A. & Ben-Akiva, M. 1996. Modeling revealed and stated pretrip
travel response to advanced traveler information systems. Transportation Research
Record: Journal of the Transportation Research Board, 46-54.
Khoo, H. L. & Asitha, K. 2016. User requirements and route choice response to smart phone traffic
applications (apps). Travel Behaviour and society, 3, 59-70.
Kivetz, R., Netzer, O. & Srinivasan, V. 2004. Alternative models for capturing the compromise
effect. Journal of marketing research, 41, 237-257.

26
Kusakabe, T., Sharyo, T. & Asakura, Y. 2012. Effects of traffic incident information on drivers’
route choice behaviour in urban expressway network. Procedia-Social and Behavioral
Sciences, 54, 179-188.
Lee, C., Ran, B., Yang, F. & Loh, W.Y. 2010. A hybrid tree approach to modeling alternate route
choice behavior with online information. Journal of Intelligent Transportation Systems,
14, 209-219.
Leong, W. & Hensher, D. A. 2015. Contrasts of relative advantage maximisation with random
utility maximisation and regret minimisation. Journal of Transport Economics and Policy
(JTEP), 49, 167-186.
Majumder, J., Kattan, L., Habib, K. N. & Fung, T. S. 2013. Modelling traveller response to variable
message sign. International Journal of Urban Sciences, 17, 259-280.
Mcfadden, D. 1974. The measurement of urban travel demand. Journal of public economics, 3,
303-328.
Meng, M., Memon, A. A., Wong, Y. D. & Lam, S.H. Impact of traveller information on mode
choice behaviour. Proceedings of the Institution of Civil Engineers-Transport, 2017.
Thomas Telford (ICE Publishing), 11-19.
Moghaddam, Z. R., Jeihani, M., Peeta, S. & Banerjee, S. 2019. Comprehending the roles of traveler
perception of travel time reliability on route choice behavior. Travel Behaviour and
Society, 16, 13-22.
Peeta, S. & Ramos, J. L. Driver response to variable message signs-based traffic information. IEE
Proceedings-Intelligent Transport Systems, 2006. IET, 2-10.
Petrella, M., Minnice, P. & Lappin, J. 2014. Traveler Use of and Response to Real-Time Traffic
and Traveler Information: Evidence from Integrated Corridor Management Traveler
Surveys in Dallas, Texas, and San Diego, California. Transportation Research Record:
Journal of the Transportation Research Board, 44-51.
Poulopoulou, M., Spyropoulou, I. & Antoniou, C. Parameters affecting professional driver
response to VMS messages. 2015 IEEE 18th International Conference on Intelligent
Transportation Systems, 2015. IEEE, 1563-1568. Prato, C. G. 2009. Route choice modeling: past, present and future research directions. Journal of choice
modelling, 2, 65-100. Prato, C. G. 2014. Expanding the applicability of random regret minimization for route choice analysis.
Transportation, 41, 351-375.
Schrank, D., Eisele, B., Lomax, T. & Bak, J. 2015. Urban mobility scorecard. The Texas A&M
Transportation Institute & INRIX.
Sener, I. N., Eluru, N. & Bhat, C. R. 2009. An analysis of bicycle route choice preferences in
Texas, US. Transportation, 36, 511-539.
Skelley, T., Namoun, A. & Mehandjiev, N. The impact of a mobile information system on
changing travel behaviour and improving travel experience. International Conference on
Mobile Web and Information Systems, 2013. Springer, 233-247.
Song, D., Peeta, S., Hsu, Y.-T. & Agrawal, S. 2017. Role of Psychological Effects of Real-Time
Travel Information Provision on En Route Traveler Route Choice Decisions. International
Driving Symposium on Human Factors in Driver Assessment, Training and Vehicle
Design, 277-283.
Swait, J. 2001. A non-compensatory choice model incorporating attribute cutoffs. Transportation
Research Part B: Methodological, 35, 903-928.
Train, K. E. 2009. Discrete choice methods with simulation, Cambridge university press.

27
Tseng, Y.-Y., Knockaert, J. & Verhoef, E. T. 2013. A revealed-preference study of behavioural
impacts of real-time traffic information. Transportation Research Part C: Emerging
Technologies, 30, 196-209.
Tversky, A. & Kahneman, D. 1992. Advances in prospect theory: Cumulative representation of
uncertainty. Journal of Risk and uncertainty, 5, 297-323.
US-DOC. 2018. United states census bureau; QuickFacts - Orlando city, Florida [Online].
Available: https://www.census.gov/quickfacts/fact/table/orlandocityflorida/PST045218
[Accessed 03 June 2019]. Van Cranenburgh, S., Prato, C. G. & Chorus, C. 2015. Accounting for variation in choice set size in Random
Regret Minimization models. working paper.
Wang, J., Chang, A. & Gao, L. 2017. Binary Probit Model on Drivers Route Choice Behaviors
Based on Multiple Factors Analysis. Information Technology and Intelligent
Transportation Systems. Springer.
Zhang, G., Wang, Z., Persad, K. R. & Walton, C. M. 2014. Enhanced traffic information
dissemination to facilitate toll road utilization: a nested logit model of a stated preference
survey in Texas. Transportation, 41, 231-249.
Zhao, W., Quddus, M., Huang, H., Lee, J. & Ma, Z. 2019. Analyzing drivers’ preferences and
choices for the content and format of variable message signs (VMS). Transportation
research part C: emerging technologies, 100, 1-14.