post and telecommunications industry, 2016 - statssa.gov.za · post and telecommunications...
TRANSCRIPT

Post and telecommunications industry, 2016
Embargoed until:
27 September 2018
13:00
Statistics South Africa Risenga Maluleke Report No. 75-01-01 (2016) Statistician-General

ii
Post and telecommunications, 2016 / Statistics South Africa
Published by Statistics South Africa, Private Bag X44, Pretoria, 0001 © Statistics South Africa, 2018 Users may apply or process this data, provided Statistics South Africa (Stats SA) is acknowledged as the original source of the data; that it is specified that the application and/or analysis is the result of the user's independent processing of the data; and that neither the basic data nor any reprocessed version or application thereof may be sold or offered for sale in any form whatsoever without prior permission from Stats SA. Stats SA Library Cataloguing-in-Publication (CIP) Data Post and telecommunications, 2016 / Statistics South Africa. Pretoria: Statistics South Africa, 2018
Report 75-01-01 (2016) 31 pages
ISBN 978-0-621-46497-9
A complete set of Stats SA publications is available at Stats SA Library and the following libraries:
National Library of South Africa, Pretoria Division Eastern Cape Library Services, King William’s Town National Library of South Africa, Cape Town Division Central Regional Library, Polokwane Library of Parliament, Cape Town Central Reference Library, Mbombela Bloemfontein Public Library Central Reference Collection, Kimberley Natal Society Library, Pietermaritzburg Central Reference Library, Mmabatho Johannesburg Public Library
This report is available on the Stats SA website: www.statssa.gov.za For technical enquiries, please contact: Tshepo Pekane / Karabo Sebolai / Khathutshelo Sivhugwana
Tel.: 012 310 8191 / 012 339 2660 / 012 316 9333 Email: [email protected] / [email protected] / [email protected]

iii
Table of contents 1. Introduction ........................................................................................................................................................................................................................................................................1 1.1 Scope and coverage ............................................................................................................................................................................................................................................................1 1.2 Data items ...........................................................................................................................................................................................................................................................................1 1.3 Reference period .................................................................................................................................................................................................................................................................2 1.4 Current prices ......................................................................................................................................................................................................................................................................2 1.5 Reliability of data .................................................................................................................................................................................................................................................................2 1.6 Reporting unit ......................................................................................................................................................................................................................................................................2 2. Summary of findings for the year 2016............................................................................................................................................................................................................................3 2.1 Income ................................................................................................................................................................................................................................................................................3 Table A – Income in the post and telecommunications industry, 2010–2016 ............................................................................................................................................................................3 Table B – Concentration ratio for total income in the post and telecommunications industry, 2010–2016 ................................................................................................................................3 Table C – Profit margin in the post and telecommunications industry, 2010–2016 ...................................................................................................................................................................4 2.2 Employment .......................................................................................................................................................................................................................................................................4 Table D – Employment in the post and telecommunications industry for the last pay period ended on or before 30 June, 2010–2016 ...................................................................................4 Figure 1 – Income and employment by type of service (% contribution) in the post and telecommunications industry, 2016 ...................................................................................................5 Table E – Average salaries and wages in the post and telecommunications industry, 2010 – 2016 .........................................................................................................................................6 2.3 Post and telecommunications industry value added .....................................................................................................................................................................................................7 Figure 2 – Post and telecommunications value added, annual percentage change (constant 2010 prices), 2007–2016 ........................................................................................................7 Figure 3 – Percentage contribution of post and telecommunications to total value added (current prices), 2007–2016 ..........................................................................................................7 3. Tables .................................................................................................................................................................................................................................................................................8 Table 1 − Principal statistics in the post and telecommunications industry, 2013 and 2016 .....................................................................................................................................................8 Table 2 − Principal statistics in the post and telecommunications industry, 2016 .....................................................................................................................................................................8 Table 3 − Profit margin in the post and telecommunications industry, 2013 and 2016..............................................................................................................................................................9 Table 4 − Income in the post and telecommunications industry, 2013 and 2016 ......................................................................................................................................................................9 Table 5 − Income in the post and telecommunications industry, 2016 .................................................................................................................................................................................... 10 Table 6 – Expenditure in the post and telecommunications industry, 2013 and 2016 ............................................................................................................................................................. 10 Table 7 − Expenditure in the post and telecommunications industry, 2016 ............................................................................................................................................................................. 11 Table 8 − Concentration ratios (relative contribution of large enterprises) in the post and telecommunications industry, 2016 .............................................................................................. 12 Table 9 − Employment in the post and telecommunications industry, 2013 and 2016 ............................................................................................................................................................ 13 Table 10 – Employment in the post and telecommunications industry, 2013 and 2016 .......................................................................................................................................................... 14 Table 11 – Capital expenditure on assets in the post and telecommunications industry, 2016 ............................................................................................................................................... 15 Table 12 − Details of income from services of post and associated courier activities, 2013 and 2016 ................................................................................................................................... 15

iv
Table 13 − Details of income from services in telecommunications, 2013 and 2016 .............................................................................................................................................................. 16 Table 14 − Details of purchases in the post and telecommunications industry, 2013 and 2016 ............................................................................................................................................. 17 Table 15 − Income from sales of goods and services by client base in the post and telecommunications industry, 2013 and 2016 ...................................................................................... 17 Table 16 − Income from sales of goods and services by client base in the post and telecommunications industry, 2016 ...................................................................................................... 18 Table 17 − Information and communication technology usage in the post and telecommunications industry as at the end of June 2016 ............................................................................. 19 Table 18 − Information and communication technology usage in the post and telecommunications industry as at the end of June 2016 ............................................................................. 20 Explanatory notes ................................................................................................................................................................................................................................................................. 21 Table 19 – Size groups for the post and telecommunications industry, 2016.......................................................................................................................................................................... 22 Glossary ............................................................................................................................................................................................................................................................................... 24 General information .............................................................................................................................................................................................................................................................. 27

1
Post and telecommunications industry, 2016
1. Introduction
This publication presents estimates in respect of the 2016 post and telecommunications industry large sample survey (LSS). The data for the number of employees were provided for working proprietors and employees who received salaries and wages for the last pay period ended on or before 30 June 2016.
The last post and telecommunications LSS was conducted for 2013 (Report No. 75-01-01 [2013]).
1.1 Scope and coverage
The 2016 post and telecommunications industry LSS covers enterprises registered for value-added tax (VAT) that are mainly engaged in the following activities classified according to the
January 1993 edition of the Standard Industrial Classification of All Economic Activities (SIC), Fifth edition, Report No. 09-09-02:
National postal activities (SIC 7511) and courier activities other than national postal activities (SIC 7512).
Telecommunications (SIC 7520). The following activities are excluded:
Retail traders selling airtime cards, sim cards and cellular phones and accessories (SIC 62399).
Dissemination of information through websites (SIC 86400).
Television and internet public-pay management services (SIC 88140).
Satellite car tracking services for security purposes (SIC 88920).
Production of radio and television programmes whether or not combined with broadcasting (SIC 96130). 1.2 Data items
The following categories of data items were collected: industrial classification, details of employment, trading income, expenditure, profit or loss, inventories, capital expenditure on new
assets, details of sales of goods, details of purchases, information and communication technology usage, client base and method of payment.

2
1.3 Reference period
The questionnaires were completed for the financial year of the enterprise which ended on any date between 1 July 2015 and 30 June 2016, according to the usual reporting schedule of
the enterprise.
Examples
1 October 2014–30 September 2015
1 January 2015–31 December 2015
1 February 2015–31 January 2016
1 March 2015–28 February 2016
1 April 2015–31 March 2016
1.4 Current prices
The rand values are at current prices.
1.5 Reliability of data
All estimates compiled for this industry are subject to non-sampling errors only because a census of the industry was conducted. The following are some of the likely sources of non-sampling errors: sampling frame not up to date, wrong definitions and classification, phrasing of questions, non-response, processing and estimation. Every effort is made to minimise non-sampling errors by the careful design of questionnaires, testing them in pilot studies, editing reported data and implementing efficient operating procedures. Non-sampling errors occur in both sample surveys and censuses Confidentiality
According to section 17 of the Statistics Act, 1999 (Act No. 6 of 1999), completed questionnaires remain confidential to Statistics South Africa (Stats SA). Individual business information is
never disclosed. Results are presented in aggregated form only.
1.6 Reporting unit
The statistical unit for the collection of information is an enterprise. An enterprise is a legal unit (or a combination of legal units) that includes and directly controls all functions necessary to
carry out its activities. Each industry is classified to an industry that reflects its predominant activity.

3
2. Summary of findings for the year 2016
2.1 Income
Table A – Income in the post and telecommunications industry, 2010–2016
Type of service
2006 2010 2013 2016
R million %
contribution R million
% contribution
R million %
contribution R million
% contribution
Post and associated courier activities 7 273 5,3 10 037 3,4 12 208 4,6 13 882 4,4
Telecommunications 130 076 94,7 285 894 96,6 252 819 95,4 301 005 95,6
Total 137 349 100,0 295 931 100,0 265 027 100,0 314 887 100,0
Source: Report No. 75-01-01
The total income for the post and telecommunications industry in 2016 was R314,9 billion. The total income represents an increase of 5,9% per annum over the income reported in the
corresponding survey of 2013 (R265,0 billion). Comparing 2013 and 2016, ‘telecommunications’ increased by R48,2 billion and ‘post and associated courier activities’ increased by
R1,7 billion.
Table B – Concentration ratio for total income in the post and telecommunications industry, 2010–2016
Concentration ratio 2006 2010 2013 2016
%
CR5 70,5 73,5 59,5 57,2
CR10 85,2 84,6 74,2 73,1
CR20 94,4 92,2 86,6 85,9
CR50 98,0 97,4 94,8 93,3
CR100 99,2 99,4 97,9 96,3
Source: Report No. 75-01-01
In 2016, the top 100 enterprises in the post and telecommunications industry contributed 96,3% to the total income. The concentration ratios of the top 5 and 100 enterprises were the highest in 2010 at 73,5% and 99,4%, respectively, while the concentration ratios of the top 10, 20 and 50 enterprises were the highest in 2006 at 84,6%, 92,2%, 97,4%, respectively.

STATISTICS SOUTH AFRICA 4
Post and telecommunications industry, 2016
Table C – Profit margin in the post and telecommunications industry, 2010–2016
Type of service
Net profit/loss after tax Turnover Profit margin
2006 2010 2013 2016 2006 2010 2013 2016 2006 2010 2013 2016
R million R million %
Post and associated courier activities 585 495 -543 -1 037 6 563 9 286 11 039 12 525 6,3 5,3 -4,9 -8,3
Telecommunications 18 409 63 841 11 511 17 025 124 736 218 486 242 499 292 111 14,8 29,2 4,7 5,8
Total 18 994 64 336 10 967 15 988 131 299 227 772 253 538 304 636 14,5 28,2 4,3 5,2
Source: Report No. 75-01-01
The profit margin in the post and telecommunications industry fell from 14,5% in 2006 to 5,2% in 2016. In ‘telecommunications’ net profit after tax fell by 7,5% between 2006 and 2016,
but turnover rose by 134,2% over the same period, resulting in a sharp decline in profit margin from 14,8% to 5,8%. In ‘post and associated courier activities’ there were net losses
after tax in both 2013 and 2014.
2.2 Employment
Table D – Employment in the post and telecommunications industry for the last pay period ended on or before 30 June, 2010–2016
Type of service
2006 2010 2013 2016
Number %
contribution Number
% contribution
Number %
contribution Number
% contribution
Post and associated courier activities 25 573 33,5 26 343 30,1 37 047 35,8 36 337 38,4
Telecommunications 50 722 66,5 61 146 69,9 66 408 64,2 58 407 61,6
Total 76 295 100,0 87 489 100,0 103 455 100,0 94 744 100,0
Source: Report No. 75-01-01
The total number of persons employed in the post and telecommunications industry as at the end of June 2016 was 94 744. ‘Telecommunications’ employed the largest number of
persons (58 407 or 61,6%).
Formal employment increased from 76 295 in 2006 to 94 744 in 2016 (a gain of 18 449 jobs between 2006 and 2016). The growth in employment since 2006 was 10 764 jobs for ‘post
and associated courier activities’ and 7 685 jobs for ‘telecommunications’. But the highest number of persons employed in the industry was recorded for 2013 (103 455).
STATISTICS SOUTH AFRICA 5
Post and telecommunications industry, 2016
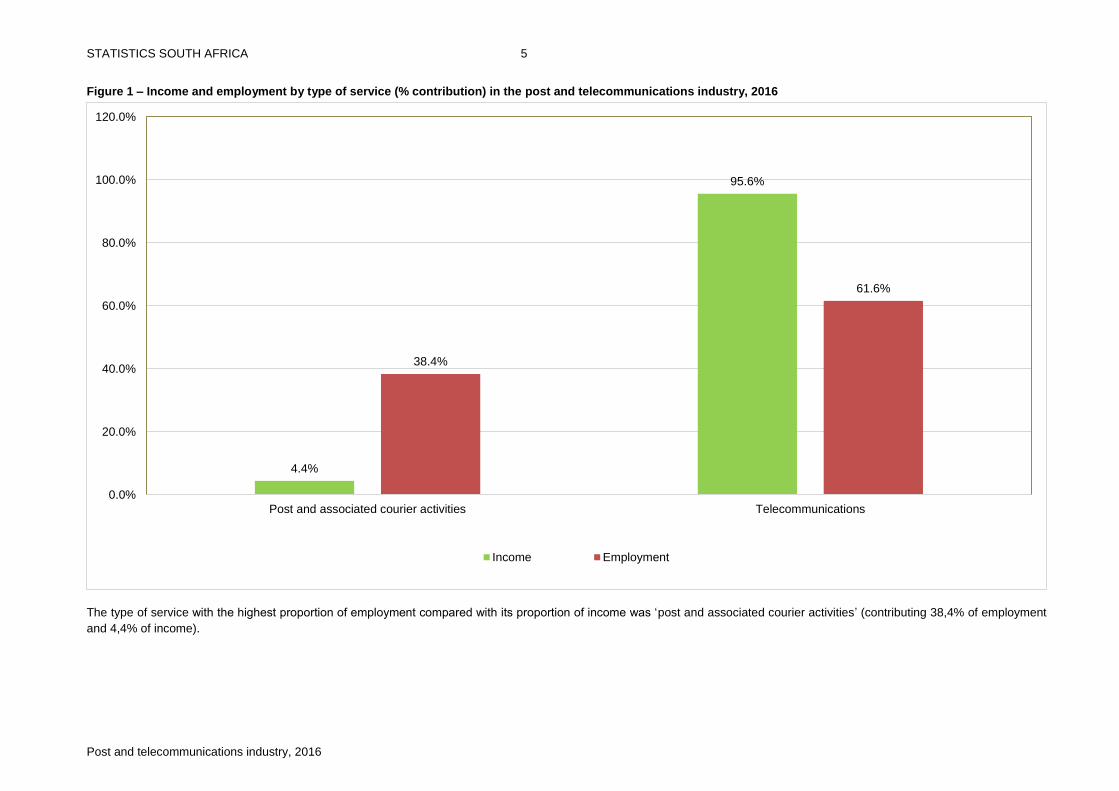
Figure 1 – Income and employment by type of service (% contribution) in the post and telecommunications industry, 2016
The type of service with the highest proportion of employment compared with its proportion of income was ‘post and associated courier activities’ (contributing 38,4% of employment
and 4,4% of income).
4.4%
95.6%
38.4%
61.6%
0.0%
20.0%
40.0%
60.0%
80.0%
100.0%
120.0%
Post and associated courier activities Telecommunications
Income Employment

STATISTICS SOUTH AFRICA 6
Post and telecommunications industry, 2016
Table E – Average salaries and wages in the post and telecommunications industry, 2010 – 2016
Type of service
2006 2010 2013 2016
Salaries and
wages
Total employ-
ment
Average salaries
and wages
Salaries and
wages
Total employ-
ment
Average salaries
and wages
Salaries and
wages
Total employ-
ment
Average salaries
and wages
Salaries and
wages
Total employ-
ment
Average salaries
and wages
R million
Number Rand R
million Number Rand
R million
Number Rand R
million Number Rand
Post and associated courier activities
2 775 25 573 108 513 4 348 26 343 165 053 5 670 37 047 153 036 6 115 36 337 168 274
Telecommunications 12 748 50 722 251 331 20 298 61 146 331 960 25 284 66 408 380 742 29 224 58 407 500 346
Total 15 523 76 295 203 460 24 646 87 489 281 704 30 954 103 455 299 201 35 338 94 744 372 986
Source: Report No. 75-01-01
The average value of salaries and wages in the post and telecommunications industry in 2016 was R372 986. The type of service with the highest average salaries and wages in 2016
was ‘telecommunications’ (R500 346), while average salaries and wages for ‘post and associated courier activities’ was R168 274 in the same year.
Total average salaries and wages increased from R203 460 in 2006 to R372 986 in 2016, an annualised growth rate of 6,2%. The highest annualised growth rate for average salaries
and wages between 2006 and 2016 was from ‘telecommunications’ at 7,1%.

STATISTICS SOUTH AFRICA 7
Post and telecommunications industry, 2016
2.3 Post and telecommunications industry value added
Figure 2 – Post and telecommunications value added, annual percentage change (constant 2010 prices), 2007–2016
Figure 3 – Percentage contribution of post and telecommunications to total value added (current prices), 2007–2016
Source: P0441, GDP annual and regional tables, 2017
Source: P0441, GDP annual and regional tables, 2017
Figure 2 shows the annual growth rate of value added in post and telecommunications,
based on constant 2010 prices. Growth remained positive throughout 2007–2016, but
slowed from 10,7% in 2007 to 2,8% in 2012. Thereafter it picked up, reaching 5,1% in
2015. In 2016 the growth rate was 3,8%.
In the period 2007-2016, the average contribution of post and telecommunications to
total value added was 2,5%. The contribution ranged from 3,4% in 2007 to 1,9% in
2016.
Risenga Maluleke
Statistician-General
10.7%
7.6%
5.6%
4.7%4.0%
2.8%
4.0% 4.3%
5.1%
3.8%
0.0%
2.0%
4.0%
6.0%
8.0%
10.0%
12.0%
2007 2008 2009 2010 2011 2012 2013 2014 2015 2016
3.4%
2.9% 2.8%2.7%
2.4%2.3% 2.3%
2.0%1.9% 1.9%
0.0%
0.5%
1.0%
1.5%
2.0%
2.5%
3.0%
3.5%
4.0%
2007 2008 2009 2010 2011 2012 2013 2014 2015 2016
STATISTICS SOUTH AFRICA 8
Post and telecommunications industry, 2016
3. Tables
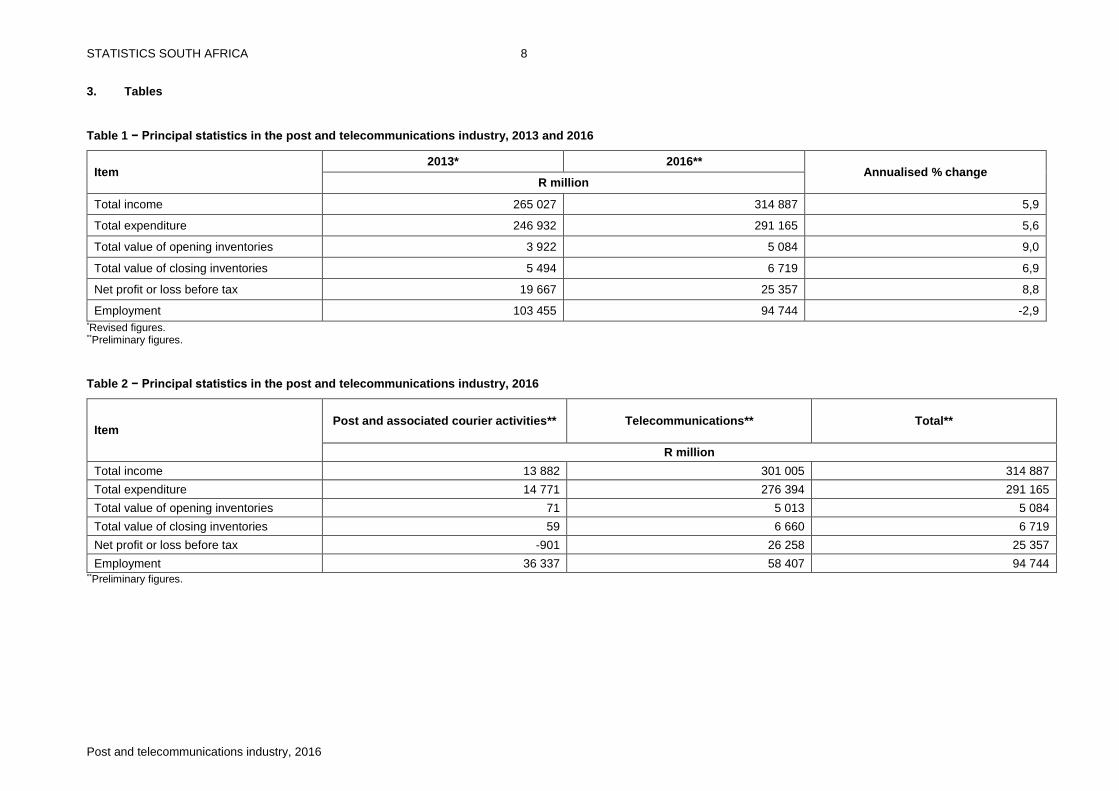
Table 1 − Principal statistics in the post and telecommunications industry, 2013 and 2016
Item 2013* 2016**
Annualised % change R million
Total income 265 027 314 887 5,9
Total expenditure 246 932 291 165 5,6
Total value of opening inventories 3 922 5 084 9,0
Total value of closing inventories 5 494 6 719 6,9
Net profit or loss before tax 19 667 25 357 8,8
Employment 103 455 94 744 -2,9 *Revised figures. **Preliminary figures.
Table 2 − Principal statistics in the post and telecommunications industry, 2016
Item Post and associated courier activities** Telecommunications** Total**
R million
Total income 13 882 301 005 314 887
Total expenditure 14 771 276 394 291 165
Total value of opening inventories 71 5 013 5 084
Total value of closing inventories 59 6 660 6 719
Net profit or loss before tax -901 26 258 25 357
Employment 36 337 58 407 94 744 **Preliminary figures.

STATISTICS SOUTH AFRICA 9
Post and telecommunications industry, 2016
Table 3 − Profit margin in the post and telecommunications industry, 2013 and 2016
Type of service Post and associated courier activities Telecommunications Total
2013* 2016** 2013* 2016** 2013* 2016**
Net profit/loss after tax (R million) -543 -1 037 11 510 17 025 10 967 15 988
Turnover (R million) 11 039 12 525 242 499 292 111 253 538 304 636
Profit margin % -4,9 -8,3 4,7 5,8 4,3 5,2 *Revised figures. **Preliminary figures.
Table 4 − Income in the post and telecommunications industry, 2013 and 2016
Item
2013* 2016** 2013* 2016**
Annualised % change
R million % contribution
Services 223 338 266 202 84,3 84,5 6,0
Sales of goods 30 813 37 158 11,6 11,8 6,4
Other income 10 876 11 527 4,1 3,7 2,0
Total 265 027 314 887 100,0 100,0 5,9
*Revised figures. **Preliminary figures.

STATISTICS SOUTH AFRICA 10
Post and telecommunications industry, 2016
Table 5 − Income in the post and telecommunications industry, 2016
Item Post and associated courier activities** Telecommunications** Total**
R million
Services rendered 12 464 253 738 266 202
Sales of goods 0 37 158 37 158
Other income 1 418 10 109 11 527
Total 13 882 301 005 314 887 **Preliminary figures.
Table 6 – Expenditure in the post and telecommunications industry, 2013 and 2016
Item 2013* 2016** 2013* 2016**
Annualised % change R million % contribution
Purchases 81 354 108 274 32,9 37,2 10,0
Sub-contractors’ payments 4 465 4 584 1,8 1,6 0,9
Salaries and wages 30 954 35 338 12,5 12,1 4,5
Motor vehicle expenditure 783 711 0,3 0,2 -3,2
Telecommunications services 39 557 31 004 16,0 10,6 -7,8
Other expenditure 89 819 111 254 36,4 38,2 7,4
Total expenditure 246 932 291 165 100,0 100,0 5,6 *Revised figures. **Preliminary figures.

STATISTICS SOUTH AFRICA 11
Post and telecommunications industry, 2016
Table 7 − Expenditure in the post and telecommunications industry, 2016
Item Post and associated courier activities** Telecommunications** Total**
R million
Purchases 2 071 106 203 108 274
Sub-contractors’ payments 948 3 636 4 584
Salaries and wages 6 115 29 223 35 338
Leasing and hiring of plant, equipment and vehicles under operating leases
186 3 607 3 793
Rental and leasing of land, buildings and other structures under operating leases
651 2 390 3 041
Motor vehicle running expenditure 571 140 711
Interest 748 7 970 8 718
Insurance 149 449 598
Custom duties 776 7 783
Advertising, marketing, promotions 71 4 590 4 661
Cross-border costs 0 5 992 5 992
Printing and stationery 43 926 969
Telecommunication 231 30 773 31 004
Security services (for both property and tracking services)
80 1 619 1 699
Depreciation 388 20 294 20 682
Other expenditure 1 743 58 575 60 318
Total expenditure 14 771 276 394 291 165 **Preliminary figures.

STATISTICS SOUTH AFRICA 12
Post and telecommunications industry, 2016
Table 8 − Concentration ratios (relative contribution of large enterprises) in the post and telecommunications industry, 2016
Item Post and associated courier
activities** Telecommunications** Total1
Total income R million 13 882 301 005 314 887
Income of the 5 largest enterprises R million 8 997 180 080 180 080
Relative contribution of the 5 largest enterprises2 % 64,8 59,8 57,2
Income of the 10 largest enterprises R million 10 796 230 324 230 324
Relative contribution of the 10 largest enterprises2 % 77,8 76,5 73,1
Income of the 20 largest enterprises R million 12 146 266 446 270 518
Relative contribution of the 20 largest enterprises2 % 87,5 88,5 85,9
**Preliminary figures. 1 The rand values in the total column for the 5, 10 and 20 largest enterprises are not row totals (they are the income of the top 5, 10 and 20 for the whole industry). 2 Relative contribution = income of the largest enterprises divided by total income multiplied by 100.

STATISTICS SOUTH AFRICA 13
Post and telecommunications industry, 2016
Table 9 − Employment in the post and telecommunications industry, 2013 and 2016
Item 2013* 2016**
Annualised % change Number
Working proprietors
Male 127 246 24,7
Female 24 103 62,5
Total 151 349 32,2
Permanent
Male 49 817 47 815 -1,4
Female 30 387 35 785 5,6
Total 80 204 83 600 1,4
Temporary
Male 8 020 1 342 -44,9
Female 6 574 1 780 -35,3
Total 14 594 3 122 -40,2
Casual
Male 5 353 4 743 -4,0
Female 3 153 2 930 -2,4
Total 8 506 7 673 -3,4
Total
Male 63 317 54 146 -5,1
Female 40 138 40 598 0,4
Total 103 455 94 744 -2,9 *Revised figures. **Preliminary figures.

STATISTICS SOUTH AFRICA 14
Post and telecommunications industry, 2016
Table 10 – Employment in the post and telecommunications industry, 2013 and 2016
Item
Post and associated courier activities Telecommunications Total
Number of employees
2013* 2016** 2013* 2016** 2013* 2016**
Working proprietors
Male 42 38 85 208 127 246
Female 9 6 15 97 24 103
Total 51 44 100 305 151 349
Permanent
Male 16 344 18 531 33 473 29 284 49 817 47 815
Female 10 269 10 676 20 118 25 109 30 387 35 785
Total 26 613 29 207 53 591 54 393 80 204 83 600
Temporary
Male 1 476 291 6 544 1 051 8 020 1 342
Female 720 258 5 854 1 522 6 574 1 780
Total 2 196 549 12 398 2 573 14 594 3 122
Casual
Male 5 168 3 898 185 845 5 353 4 743
Female 3 019 2 639 134 291 3 153 2 930
Total 8 187 6 537 319 1 136 8 506 7 673
Total
Male 23 030 22 758 40 287 31 388 63 317 54 146
Female 14 017 13 579 26 121 27 019 40 138 40 598
Total 37 047 36 337 66 408 58 407 103 455 94 744 *Revised figures. **Preliminary figures.

STATISTICS SOUTH AFRICA 15
Post and telecommunications industry, 2016
Table 11 – Capital expenditure on assets in the post and telecommunications industry, 2016
Item
Post and associated courier activities**
Telecommunications** Total**
R million
Land, buildings, construction works and leasehold improvements 15 6 281 6 296
Plant and machinery 39 22 089 22 128
Computers and other equipment 45 906 951
Motor vehicles, fleet and other transport equipment 99 47 146
Other assets 53 4 660 4 713
Total 251 33 983 34 234 **Preliminary figures.
Table 12 − Details of income from services of post and associated courier activities, 2013 and 2016
Type of services 2013* 2016** 2013* 2016** Annualised %
change R million % contribution
Bulk mail, stamps, franking and re-mailing and courier activities 8 128 9 183 70,9 73,7 4,2
Box rental 339 47 3,0 0,4 -48,2
Banking 277 217 2,4 1,7 -7,8
Agency services 388 452 3,4 3,6 5,2
Other postal and courier sales and services 2 329 2 565 20,3 20,6 3,3
Total 11 461 12 464 100,0 100,0 2,8 *Revised figures. **Preliminary figures.

STATISTICS SOUTH AFRICA 16
Post and telecommunications industry, 2016
Table 13 − Details of income from services in telecommunications, 2013 and 2016
Type of service 2013* 2016** 2013* 2016** Annualised %
change
R million % contribution
Fixed lines and cell phones 158 226 178 579 74,7 70,4 4,1
Fixed-line calls (national and international) 11 649 8 025 5,5 3,2 -11,7
Airtime and data bundles 92 140 105 213 43,5 41,5 4,5
Subscriptions (contracts) 44 816 55 109 21,2 21,7 7,1
Interconnection income 9 406 10 140 4,4 4,0 2,5
Public phones 215 92 0,1 0,0 -24,6
Internet 21 824 26 457 10,3 10,4 6,6
Narrowband 111 86 0,1 0,0 -8,2
Broadband 5 650 5 941 2,7 2,3 1,7
Data revenue – fixed 8 245 9 447 3,9 3,7 4,6
Data revenue – wireless 7 818 10 983 3,7 4,3 12,0
Broadcasting 16 613 24 635 7,8 9,7 14,0
Television subscription and television licence 4 861 9 025 2,3 3,6 22,9
Advertising 9 671 12 624 4,6 5,0 9,3
Sponsorship 2 081 2 986 1,0 1,2 12,8
Other services in telecommunications 15 208 24 099 7,2 9,5 16,6
Total 211 871 253 770 100,0 100,0 6,2 *Revised figures. **Preliminary figures.

STATISTICS SOUTH AFRICA 17
Post and telecommunications industry, 2016
Table 14 − Details of purchases in the post and telecommunications industry, 2013 and 2016
Type of purchase 2013* 2016** 2013* 2016** Annualised %
change
R million % contribution
Fuel 1 418 1 243 1,7 1,1 -4,3
Fixed-line phones 724 1 994 0,9 1,8 40,2
Cell-phones 21 555 23 797 26,5 22,0 3,4
Air time cards and starter packs 39 123 52 977 48,1 48,9 10,6
Decoders 2 093 2 966 2,6 2,7 12,3
Other purchases 16 440 25 297 20,2 23,4 15,4
Total 81 353 108 274 100,0 100,0 10,0 *Revised figures. **Preliminary figures.
Table 15 − Income from sales of goods and services by client base in the post and telecommunications industry, 2013 and 2016
Type of client
2013* 2016** 2013* 2016**
Annualised % change
R million % contribution
Individuals and households 126 143 174 436 49,6 57,5 11,4
Businesses (including parastatals) 104 937 110 643 41,3 36,5 1,8
Government 23 079 18 284 9,1 6,0 -7,5
Total 254 159 303 363 100,0 100,0 6,1
*Revised figures. **Preliminary figures.

STATISTICS SOUTH AFRICA 18
Post and telecommunications industry, 2016
Table 16 − Income from sales of goods and services by client base in the post and telecommunications industry, 2016
Type of client
Post and associated courier activities**
Telecommunications** Total**
R million
Business 9 692 164 744 174 436
Individual 2 264 108 379 110 643
Government 508 17 776 18 284
Total 12 464 290 899 303 363 **Preliminary figures.

STATISTICS SOUTH AFRICA 19
Post and telecommunications industry, 2016
Table 17 − Information and communication technology usage in the post and telecommunications industry as at the end of June 2016
ICT usage
Post and associated courier activities
Telecommunications Total
%
Use computers for business purposes 100,0 99,5 99,6
Use a fixed line for business purposes 93,2 96,7 96,1
Use a corporate cell phone for business purposes 81,8 82,6 82,5
Use a fax machine for business purposes 88,6 80,4 82,0
Use the internet for business purposes 100,0 97,8 98,2
Use the internet for banking or any other financial services (e.g. insurance, pensions)
97,7 89,7 91,2
Use e-government services to access information from government departments
40,9 40,8 40,8
Use e-government services for electronic procurement 36,4 30,4 31,6
Use the internet for e-learning 27,3 45,1 41,7
Use social networks (e.g. Facebook, Twitter, LinkedIn) to conduct business
36,4 51,6 48,7
Use ICT-based supply chains (e.g. tracking systems) to conduct business
86,4 47,8 55,3
Have web page 84,1 84,2 84,2
Receive orders over the internet 68,2 62,5 63,6
Place orders over the internet 84,1 60,3 64,9
IT outsourced 38,6 35,9 35,9

STATISTICS SOUTH AFRICA 20
Post and telecommunications industry, 2016
Table 18 − Information and communication technology usage in the post and telecommunications industry as at the end of June 2016
ICT usage Large enterprises
Medium enterprises
Small enterprises Micro enterprises Total
%
Use computers for business purposes 98,9 100,0 100,0 100,0 99,6
Use a fixed line for business purposes 95,8 97,0 96,1 95,8 96,1
Use a corporate cell phone for business purposes 77,9 87,9 84,2 87,5 82,5
Use a fax machine for business purposes 77,9 93,9 81,6 83,3 82,0
Use the internet for business purposes 96,8 97,0 100,0 100,0 98,2
Use the internet for banking or any other financial services (e.g. insurance, pensions)
88,4 90,9 92,1 100,0 91,2
Use e-government services to access information from government departments
43,2 30,3 47,4 25,0 40,8
Use e-government services for electronic procurement 36,8 18,2 32,9 25,0 31,6
Use the internet for e-learning 44,2 48,5 39,5 29,2 41,7
Use social networks (e.g. Facebook, Twitter, LinkedIn) to conduct business
54,7 45,5 46,1 37,5 48,7
Use ICT-based supply chains (e.g. tracking systems) to conduct business
54,7 48,5 57,9 58,3 55,3
Have web page 87,4 75,8 84,2 83,3 84,2
Receive orders over the internet 65,3 63,6 64,5 54,2 63,6
Place orders over the internet 58,9 66,7 67,1 79,2 64,9
IT outsourced 37,9 42,4 38,2 16,7 36,4

STATISTICS SOUTH AFRICA 21
Post and telecommunications industry, 2016
Explanatory notes
Background
The results presented in this publication have been derived from the 2016 post and telecommunications large sample survey (LSS). This is a periodic
survey which measures economic activity in the post and telecommunications industry of the South African economy. This survey is based on a
census of private and public enterprises operating in the post and telecommunications industry.
The sample was drawn from Stats SA’s business register. The business register is based mainly on the value-added tax (VAT) database of the South
African Revenue Service (SARS). Enterprises are legally bound to register for VAT.
Value added tax (VAT) All figures exclude value added tax (VAT).
Reference period The information was collected from enterprises for their financial year, which ended on any date between 1 July 2015 and 30 June 2016.
Purpose of the survey Results of the survey are used within Stats SA for benchmarking the gross domestic product (GDP) and its components. These statistics are also
used by government policy advisors in monitoring the performance and contribution of individual industries to the South African economy and the effectiveness of industry policies, and by private sector users in analyses of comparative business and industry performance.
Classification by industry The 1993 edition of the Standard Industrial Classification of All Economic Activities (SIC), Fifth Edition, Report No. 09-09-02, was used to classify the
statistical units in the survey. The SIC is based on the 1990 International Standard Industrial Classification of All Economic Activities (ISIC) with
suitable adaptations for local conditions. Statistics in this publication are presented at SIC group (4-digit) level. Each enterprise is classified to an
industry, which reflects its predominant activity.
Statistical unit The statistical unit for the collection of the information is an enterprise. An enterprise is a legal unit (or a combination of legal units) that includes and
directly controls all functions necessary to carry out its production activities.
STATISTICS SOUTH AFRICA 22
Post and telecommunications industry, 2016
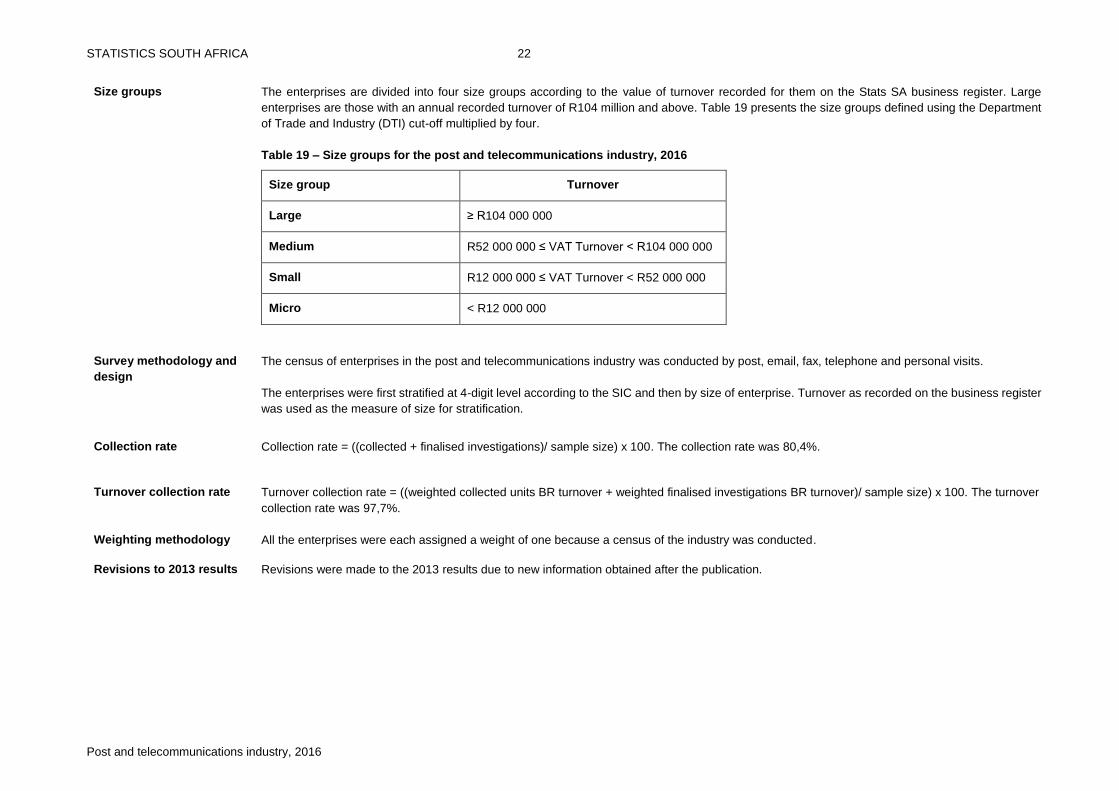
Size groups The enterprises are divided into four size groups according to the value of turnover recorded for them on the Stats SA business register. Large
enterprises are those with an annual recorded turnover of R104 million and above. Table 19 presents the size groups defined using the Department
of Trade and Industry (DTI) cut-off multiplied by four.
Table 19 – Size groups for the post and telecommunications industry, 2016
Size group Turnover
Large ≥ R104 000 000
Medium R52 000 000 ≤ VAT Turnover < R104 000 000
Small R12 000 000 ≤ VAT Turnover < R52 000 000
Micro < R12 000 000
Survey methodology and
design
The census of enterprises in the post and telecommunications industry was conducted by post, email, fax, telephone and personal visits.
The enterprises were first stratified at 4-digit level according to the SIC and then by size of enterprise. Turnover as recorded on the business register
was used as the measure of size for stratification.
Collection rate Collection rate = ((collected + finalised investigations)/ sample size) x 100. The collection rate was 80,4%.
Turnover collection rate Turnover collection rate = ((weighted collected units BR turnover + weighted finalised investigations BR turnover)/ sample size) x 100. The turnover
collection rate was 97,7%.
Weighting methodology All the enterprises were each assigned a weight of one because a census of the industry was conducted.
Revisions to 2013 results Revisions were made to the 2013 results due to new information obtained after the publication.

STATISTICS SOUTH AFRICA 23
Post and telecommunications industry, 2016
Non-sampling errors Inaccuracies may occur because of imperfections in reporting by enterprises and errors made in the collection and processing of the data.
Inaccuracies of this kind are referred to as non-sampling errors. Every effort is made to minimise non-sampling errors by careful design of
questionnaires, testing them in pilot studies, editing reported data and implementing efficient operating procedures. Non-sampling errors occur in
both sample surveys and censuses.
Rounding of figures The figures in the tables have, where necessary, been rounded to the nearest final digit shown. There may therefore be slight discrepancies between
the sums of the constituent items of the totals shown.
Abbreviations BR Business Register
DTI Department of Trade and Industry
GDP Gross domestic product
ISIC International Standard Industrial Classification of All Economic Activities
IT Income tax
RSE Relative standard error
SARS South African Revenue Service
SE Standard error
SIC Standard Industrial Classification of All Economic Activities
SNA System of National Accounts
Stats SA Statistics South Africa
VAT Value added tax

STATISTICS SOUTH AFRICA 24
Post and telecommunications industry, 2016
Glossary
Casual employees Employees who fall neither within the ‘permanent employees’ category nor the ‘temporary employees’ category. Such employees are typically working daily or hourly.
Concentration ratio
The ratio of the income of the n largest enterprises to the total income.
Employees Employment costs
Persons employed by a business or organisation and who received payment (in salaries, wages, commission, piece rates or payments in kind) for the last pay period ended on or before 30 June 2016. The total cost of employment, including salaries, wages, service and other bonuses, allowances (including car allowances), overtime payments, retirement benefits, contributions to medical, pension and provident funds, unemployment insurance and accident funds, and housing subsidies.
Enterprise The enterprise is a legal entity or a combination of legal units that includes and directly controls all functions necessary to carry out its activities.
Industry An industry consists of a group of enterprises engaged in the same or similar kinds of economic activity. Industries are defined in the System of National
Accounts (SNA) in the same way as in the Standard Industrial Classification of all Economic Activities (SIC), Fifth Edition, Report No. 09-90-02 of January
1993.
Labour brokers Motor vehicles
Labour/employment brokers are agents who recruit and administer workers on behalf of the enterprise. They do not provide any other service.
Motor vehicles include cars, trucks, aircraft, boats, trailers, locomotives and other transport equipment.
Net profit or loss after tax
Total income
plus closing value of inventories
minus total expenditure
minus opening value of inventories
minus company tax
Net profit or loss before tax
Total income
plus closing value of inventories
minus total expenditure
minus opening value of inventories

STATISTICS SOUTH AFRICA 25
Post and telecommunications industry, 2016
Other expenditure Other expenditure includes: leasing and hiring of plant, machinery, equipment and vehicles under operating leases; rental and leasing of land, buildings
and other structures under operating leases; interest; insurance; custom duties; excise duties; advertising, marketing and promotions; cross-border costs;
printing and stationery; security services; depreciation and other expenditure.
Other income Other income includes: interest; custom duties; excise duties; government subsidies and incentives; rental, leasing and hiring and other income.
Other postal and courier sales and services
Other postal and courier sales and services include: fast mail (letter services); parcel services; money transfers; registered mail services including
secure email; foreign postal services; e-postal services; photocopying services; faxing services; agency services and other postal services.
Other services in telecommunications
Other services include: other telecommunication through fixed lines; other telecommunication services; connectivity services for customers; other radio
and television broadcasting services and other services rendered.
Other purchases Other purchases include: other telecommunication equipment; tablets (e.g. iPads, e-readers); set-top boxes; optical cables and switches; modems and
routers; chargers and power banks; cell phone batteries and accessories.
Permanent employees
Permanent employees are employees appointed on an open-ended contract with no stipulated termination date or a fixed-term contract for periods of more than one year.
Profit margin Profit margin is derived as:
Net profit after tax
divided by turnover
multiplied by 100.
Statistical unit A statistical unit is a unit of observation or measurement for which statistical data are collected or derived.
Stratum A stratum is constructed by concatenating the SIC classification and size group variables.
Temporary employees
Temporary employees are employees appointed on a short-term contract basis with a stipulated termination date for periods not exceeding one year.
Turnover Turnover includes:
value of sales of goods;
amount received for services rendered;
rent and lease payments received for land and buildings; and
rent, leasing and hiring received for machinery, vehicles and other equipment.

STATISTICS SOUTH AFRICA 26
Post and telecommunications industry, 2016
Working proprietors
Zero values
Working proprietors include all individual proprietors and partners, whether they earn a salary or not, actively engaged in the work of the enterprise,
excluding silent or inactive partners whose principal activity is outside of the enterprise.
All rand values less than R500 000.
STATISTICS SOUTH AFRICA 27
Post and telecommunications industry, 2016
General information
Stats SA publishes approximately 300 different statistical releases each year. It is not economically viable to produce them in more than one of South Africa's 11 official languages. Since the releases are used extensively, not only locally but also by international economic and social-scientific communities, Stats SA releases are published in English only. Stats SA has copyright on this publication. Users may apply the information as they wish, provided that they acknowledge Stats SA as the source of the basic data wherever they process, apply, utilise, publish or distribute the data; and also that they specify that the relevant application and analysis (where applicable) result from their own processing of the data. Advance release calendar
An advance release calendar is disseminated on www.statssa.gov.za.
Stats SA products
A complete set of Stats SA publications is available at the Stats SA Library and the following libraries: National Library of South Africa, Pretoria Division National Library of South Africa, Cape Town Division Natal Society Library, Pietermaritzburg Library of Parliament, Cape Town Bloemfontein Public Library Johannesburg Public Library Eastern Cape Library Services, King William’s Town Central Regional Library, Polokwane Central Reference Library, Mbombela Central Reference Collection, Kimberley Central Reference Library, Mmabatho Stats SA also provides a subscription service. Electronic services
A large range of data are available via online services, diskette and computer printouts. For more details about our electronic data services, contact 012 310 8600. User Information Services Telephone number: 012 310 8600
Email address: [email protected] Postal address Private Bag X44, Pretoria, 0001
Produced by Stats SA