post-acute care preferred networks: how to succeed and … post-acute care... · 1/9/2015 ·...
TRANSCRIPT

Post-Acute Care Networks: How to Succeed and Why Many Fail to Deliver
HEALTH FORUM AND AHA LEADERSHIP SUMMITJULY 18, 2016SAN DIEGO, CALIFORNIA

2
Please note that the views expressed are those of the conference speakers and do not necessarily reflect the views of the American Hospital Association and Health Forum.

Panel Presentation
3
Why Post Acute Networks NowJade Gong, MBA, RNJade Gong & Associates LLC
Advocate Critical Success
Factors
William A. Adair, MD
Advocate
Jim Newbrough
OhioHealth Home ReachOhioHealth Critical Success
Factors
Successful PAC-CCN CreationKathleen Griffin, Ph.D.Valley Consultants LLC
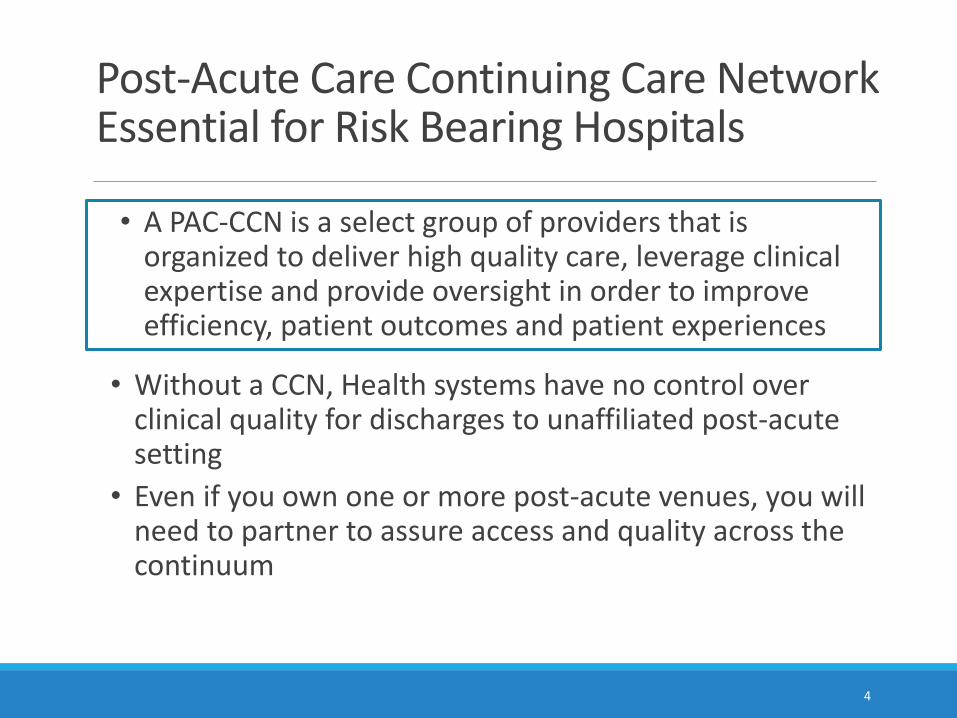
Post-Acute Care Continuing Care Network Essential for Risk Bearing Hospitals
4
• Without a CCN, Health systems have no control over clinical quality for discharges to unaffiliated post-acute setting
• Even if you own one or more post-acute venues, you will need to partner to assure access and quality across the continuum
• A PAC-CCN is a select group of providers that is organized to deliver high quality care, leverage clinical expertise and provide oversight in order to improve efficiency, patient outcomes and patient experiences
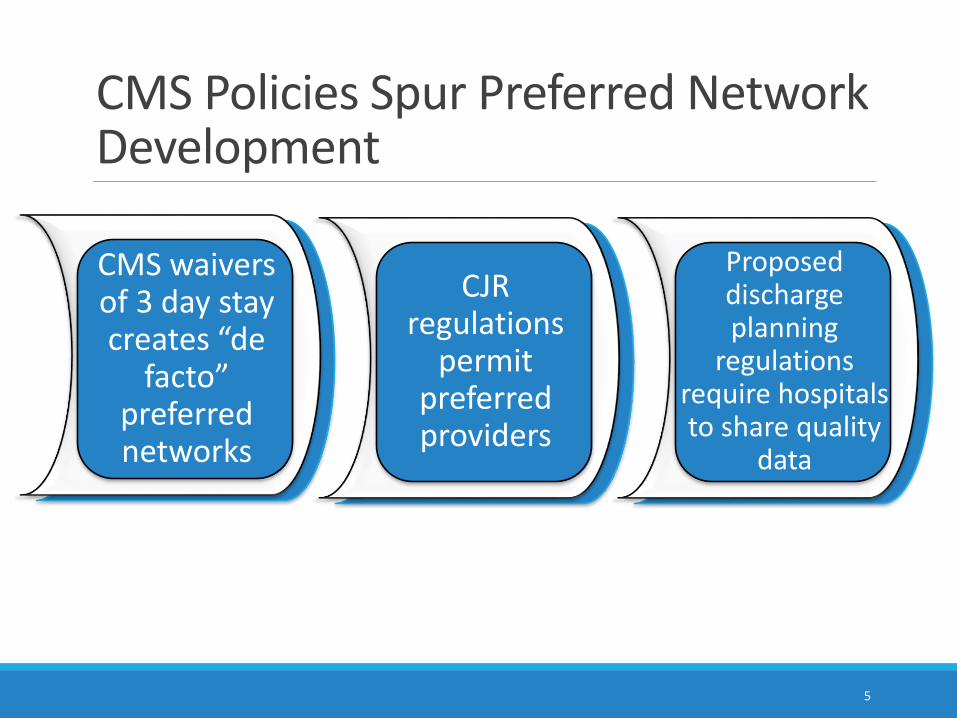
CMS Policies Spur Preferred Network Development
5
CMS waivers of 3 day stay creates “de
facto” preferred networks
CJR regulations
permit preferred providers
Proposed discharge planning
regulations require hospitals to share quality
data

Medicare Patients Use Multiple Post-Acute Settings of Care
6
SNF
19.5%
Home Health
16.8%
Acute Rehab
3.2%
LTACH
1.1%
42.9%
4.2%
64.3%
60.2%
1st DischargeSetting
2nd DischargeSetting
Medicare FFS Hospital Discharges
41.4 % to PAC
Sources: MedPAC, Medicare Payment Advisory Commission. (2015). March Report to the Congress: Medicare Payment Policy. Washington, DC. and Watson Policy Analysis. Medicare 5% Standard Analytical File for 2012 and 2013. June 2015
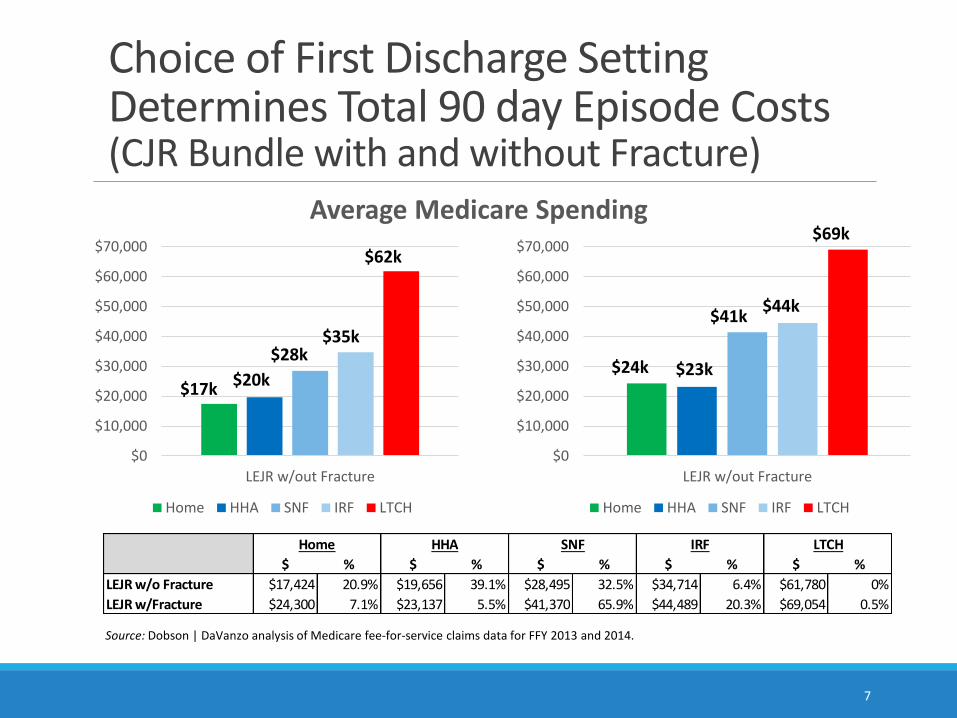
Choice of First Discharge Setting Determines Total 90 day Episode Costs (CJR Bundle with and without Fracture)
7
Source: Dobson | DaVanzo analysis of Medicare fee-for-service claims data for FFY 2013 and 2014.
$0
$10,000
$20,000
$30,000
$40,000
$50,000
$60,000
$70,000
LEJR w/out Fracture
Home HHA SNF IRF LTCH
$0
$10,000
$20,000
$30,000
$40,000
$50,000
$60,000
$70,000
LEJR w/out Fracture
Home HHA SNF IRF LTCH
Average Medicare Spending
$ % $ % $ % $ % $ %
LEJR w/o Fracture $17,424 20.9% $19,656 39.1% $28,495 32.5% $34,714 6.4% $61,780 0%
LEJR w/Fracture $24,300 7.1% $23,137 5.5% $41,370 65.9% $44,489 20.3% $69,054 0.5%
Home HHA SNF IRF LTCH
$17k $20k
$28k$35k
$62k
$24k $23k
$41k$44k
$69k

8
Variation in SNF costs almost 3 fold
15.4%
18.4%
22.4%
15.4%
7.9%
15.3%
10.4%16.1%
16.1%
US:14.9%
CJR Bundles (No FX): Variation in SNF Costs for Medicare Discharges
Source: Dobson | DaVanzoanalysis of Medicare fee-for-service claims data for FFY 2013 and 2014.

9
29.0%
32.8%
33.0%26.0%
26.3%
28.3%
26.8%
24.2%
15.3%
CJR Bundles (With FX): Variation in SNF Costs for Medicare Discharges
US:28.0%
Variation in SNF costs 1.5 fold
Source: Dobson | DaVanzoanalysis of Medicare fee-for-service claims data for FFY 2013 and 2014.
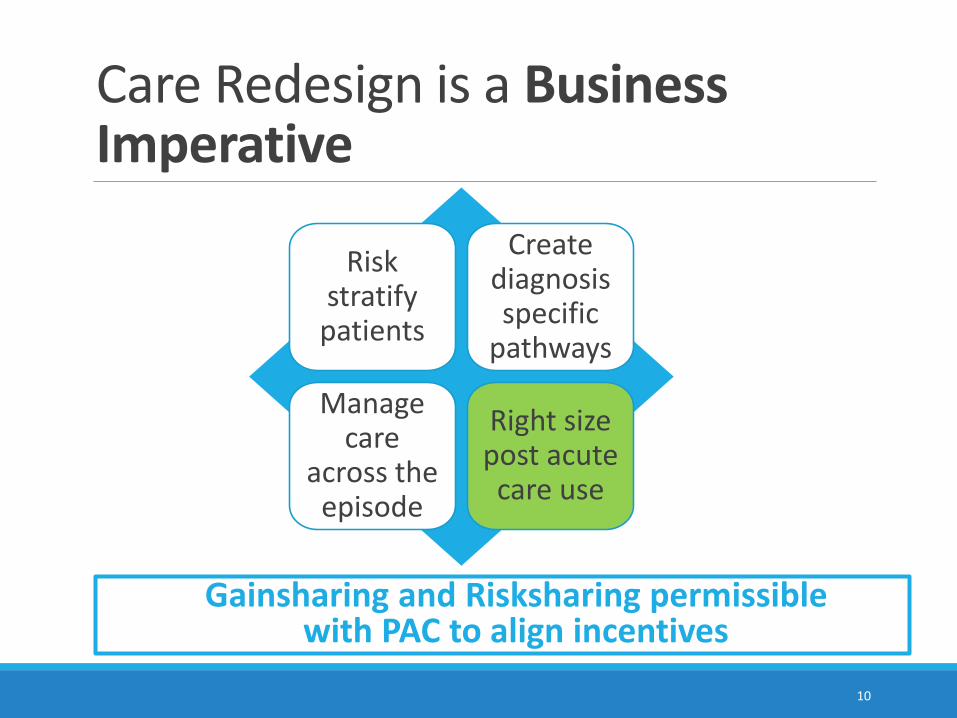
Care Redesign is a Business Imperative
10
Risk stratify
patients
Create diagnosis specific
pathways
Manage care
across the episode
Right size post acute care use
Gainsharing and Risksharing permissible with PAC to align incentives

ACOs that Achieved Shared Savings Reduced PAC Expenditures
11
-21.7-19.7
-13.5-10.9
-8.5-6.4
-2.710.3
15
10
5
-10
-15
-20
-25
-5
0
Source: CMS Medicare Shared Savings Program Webinar, September 1, 2015
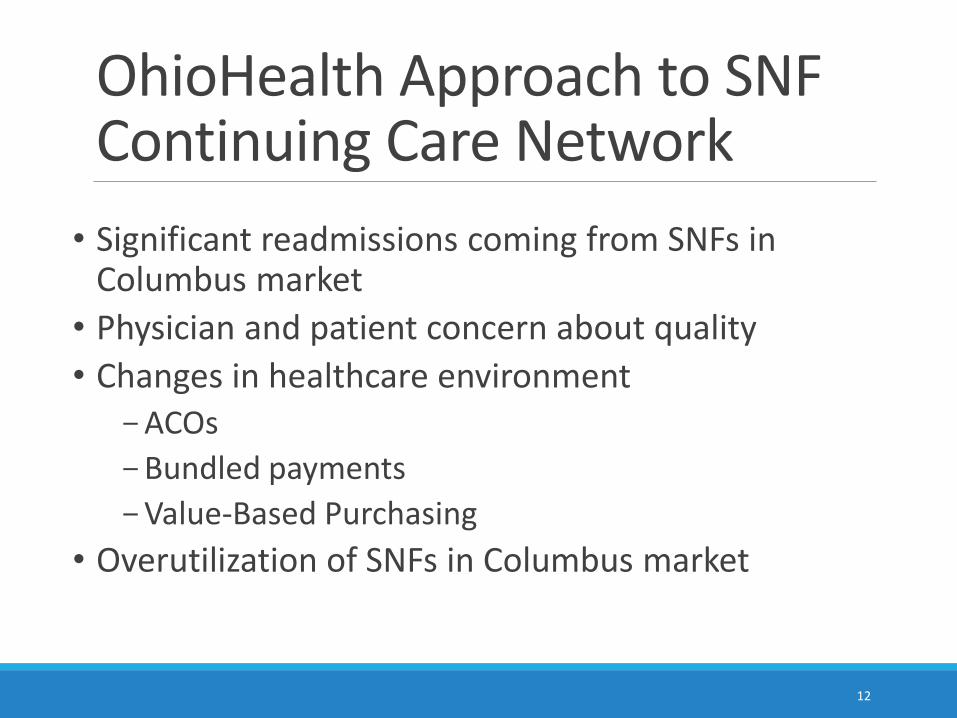
OhioHealth Approach to SNF Continuing Care Network
12
• Significant readmissions coming from SNFs in Columbus market
• Physician and patient concern about quality
• Changes in healthcare environment-ACOs
-Bundled payments
-Value-Based Purchasing
• Overutilization of SNFs in Columbus market
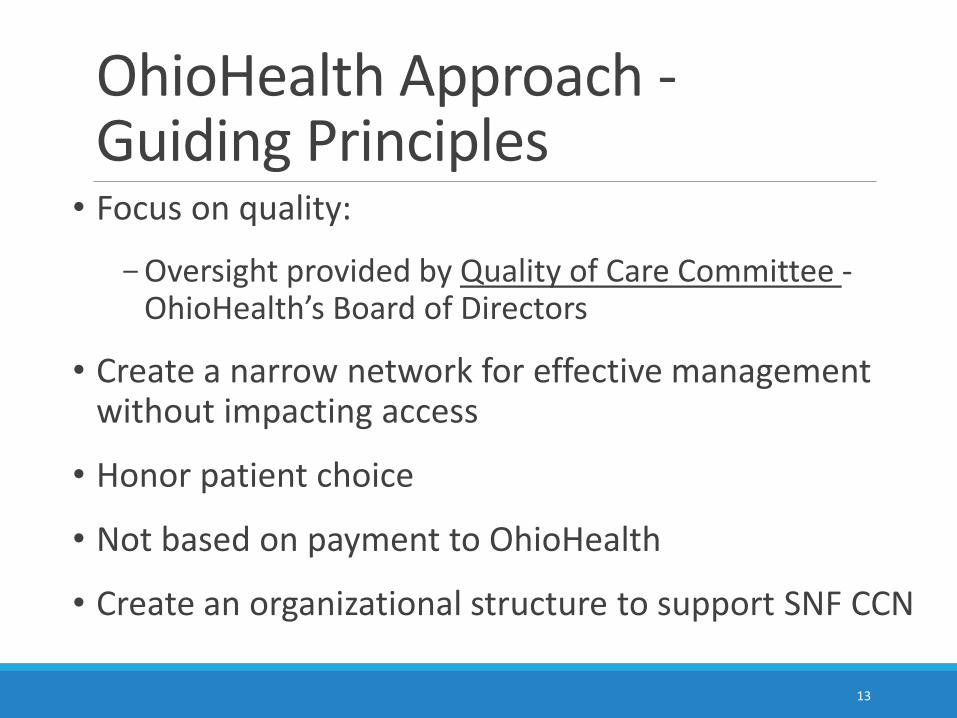
OhioHealth Approach -Guiding Principles
• Focus on quality:
-Oversight provided by Quality of Care Committee -OhioHealth’s Board of Directors
• Create a narrow network for effective management without impacting access
• Honor patient choice
• Not based on payment to OhioHealth
• Create an organizational structure to support SNF CCN
13
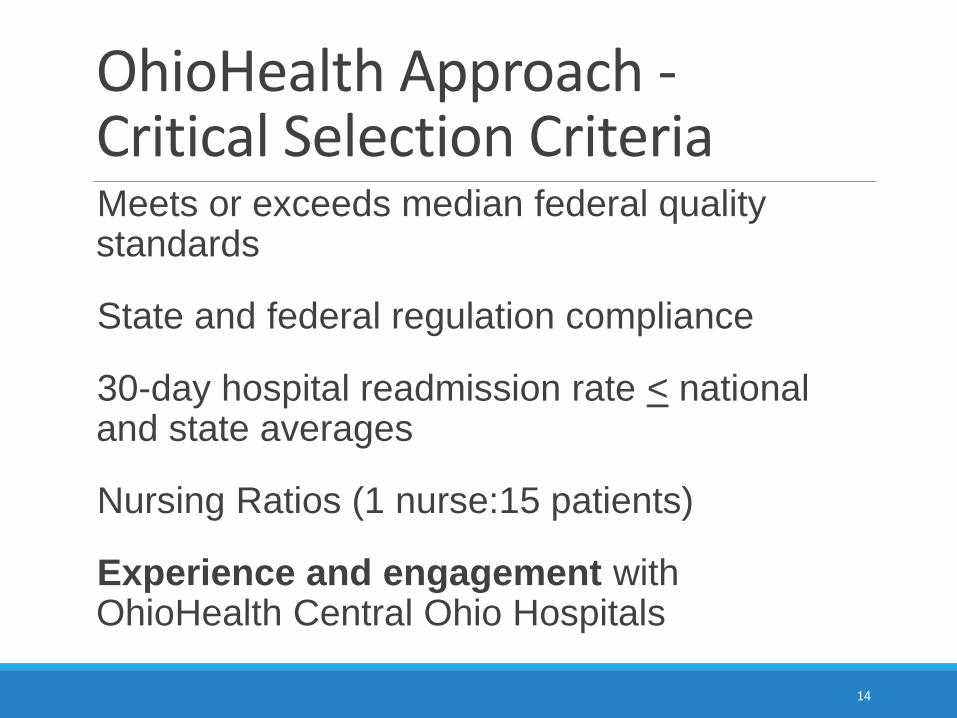
OhioHealth Approach -Critical Selection Criteria
14
Meets or exceeds median federal quality standards
State and federal regulation compliance
30-day hospital readmission rate < national and state averages
Nursing Ratios (1 nurse:15 patients)
Experience and engagement with OhioHealth Central Ohio Hospitals
14
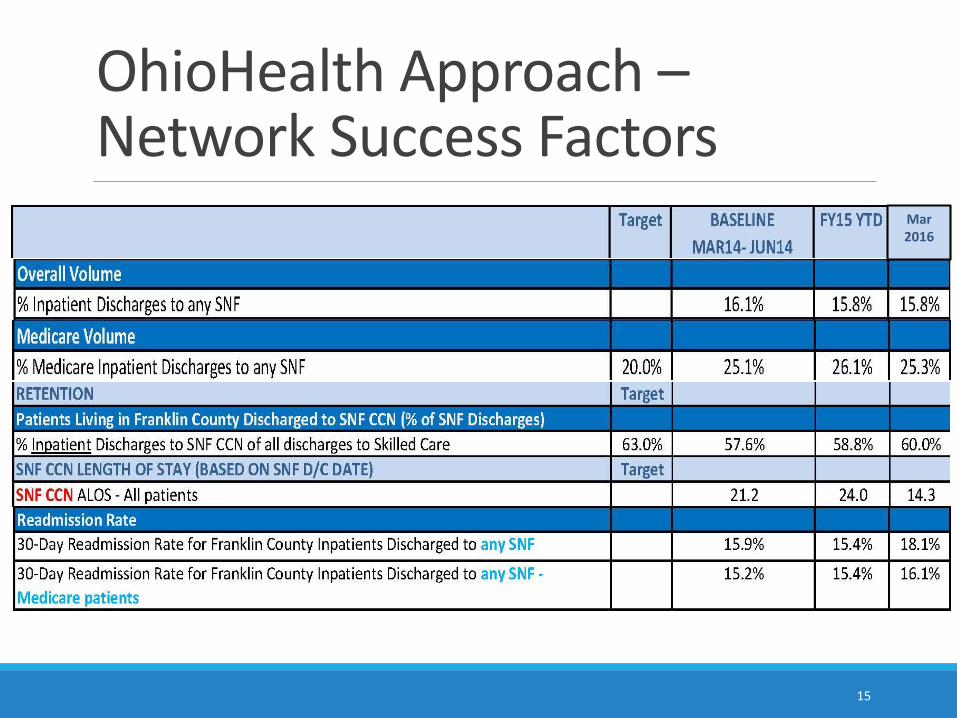
OhioHealth Approach –Network Success Factors
Mar 2016
15

OhioHealth Approach -Facility Scorecard
Measure Target *January-15 February-15
Count % Count %
Data Integrity
Chart Audit Discrepancies (# out of 40) 0 - -
SNF CCN Discharges
Total OH patients discharged from SNF N/A 13 - 4 -
Total OH Medicare FFS patients discharged from SNF N/A 6 - 0 -
Length of Stay
# Medicare FFS patients w/ LOS < 21 days > 90% 0 0% 0 0%
Length of Stay - Medicare FFS joint replacement patients (MS-DRG - 469 & 470)
# Medicare FFS joint replacement patients (MS-DRGs - 469 & 470) w/ LOS < 14 days > 90% 0 0% 0 0%
Readmissions of patients discharged from OH acute setting ***
All payer 30-day, all cause readmissions to OH hospital only < 19% 1 17% 0 0%
Medicare 30-day, all cause readmissions to OH hospital only < 19% 0 0% 0 0%
Patients seen by physician or APN w/in 48 hours of admission
Yes > 80% 8 62% 1 25%
Patients scheduled to be seen by physician relevant to SNF stay within 7 days of SNF Discharge
Yes > 80% 2 40% 1 25%
Hospice care of less than 3 days for patients who expired
# pts hospice svc < 3 days < 20% 0 0% 0 0%
Medication reconciliation completed for all patients at admission
Yes > 80% 13 100% 4 100%
Medication reconciliation completed for all patients at discharge
Yes > 80% 5 83% 2 50%
# of patients referred to ED within 72 hours of admission
# Patients referred to ED < 72 hours < 10% 0 0% 0 0%
16

CCN vs Non-CCN Readmission RatesMarch 2015 – March 2016 Residents of all counties
17
0.0%
5.0%
10.0%
15.0%
20.0%
25.0%
Mar-15 Apr-15 May-15 Jun-15 Jul-15 Aug-15 Sep-15 Oct-15 Nov-15 Dec-15 Jan-16 Feb-16 Mar-16
Readmission Rates
SNF CCN NON CCN
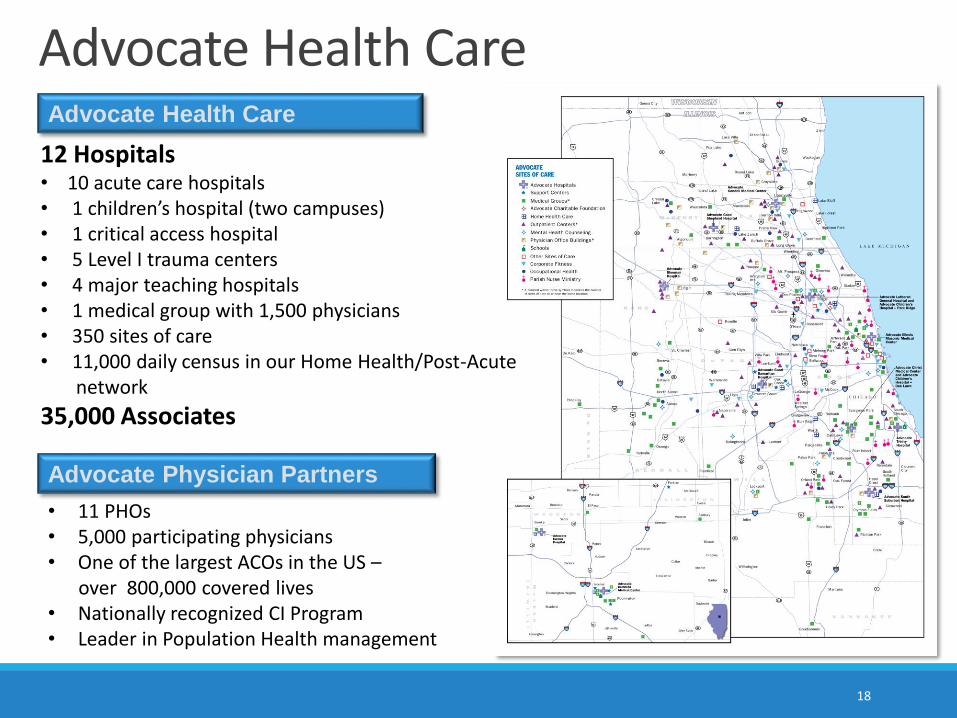
Advocate Health CareAdvocate Health Care
Advocate Physician Partners
• 11 PHOs• 5,000 participating physicians• One of the largest ACOs in the US –
over 800,000 covered lives• Nationally recognized CI Program• Leader in Population Health management
12 Hospitals• 10 acute care hospitals• 1 children’s hospital (two campuses)• 1 critical access hospital• 5 Level I trauma centers• 4 major teaching hospitals• 1 medical group with 1,500 physicians• 350 sites of care• 11,000 daily census in our Home Health/Post-Acute
network
35,000 Associates
18

Advocate Continuum of Care
Provider ADC
Advocate Hospitals 2,126
Advocate at Home (Home Health,
Hospice, RT/DME, Home Infusion)9,925
Advocate Post Acute Network (SNF, LTACH, Physician at Home, Home base
Palliative )
1,245
Advocate Rehab Network 93
TOTAL 13,389
Advocate Post Acute represents an ADC of
11,254
or
84.1% of Total ADC
YE 2015
19

Medicare Spending per BeneficiaryNational
Period Highest (NJ) Average (US) Lowest (OR)
1–3 Days Before Admission $239 $252 $224
During Index Hospitalization $10,017 $10,122 $10,945
1–30 Days After Discharge $9,508 $7,984 $5,844
Complete Episode $19,764 $18,358 $17,013
Percent Post Acute Spend 48.1% 43.5% 34.4%
20

Advocate Payment per Episode Phase (percent of total spend)
During Admission
30 Days Post-Discharge
3 Days Prior
Jan 1, 2014 – Dec 31, 2014 (FY 2016 Performance Period)
Advocate hospital post acute spend proportion
ranges from 39% to 51%(2014 data)
vs. national mean of 43%.
21

Post-Acute Strategy
Skilled Nursing Facility
• Cares for medically complex and
rehabilitation patients
• Short term care facility or a unit
with in a residential facility
Inpatient Rehab Facility
• Provides comprehensive
rehabilitation services
• 60% rule has shifted patient
population from orthopedic to
neurological patients
Home Health Agency
• Provides short term clinical
support and education to rehab
and chronically ill patients
• Goal is to teach patients to be
independent and manage their
own care
Long-Term Acute Care Hospital
• Serves patients needing ongoing
acute care level services, LOS
typically exceeds 25 days
• Ventilator, wound care are
primary services but patient
population is diverse
Focus for today
22

From 2011 to 2015 …
• PAN facilities increased from 12 to 39 (now 41 in 2016)
• Readmission rate from 20% to 13.5%
• SNF ALOS decreased from 30 days to 16 days
Resulting in …
• $45M in savings
Post-Acute Network Results
23
YearNumber of
SNFsPatient Volume
30 Day Readmission
RateSNF ALOS
Home Care Capture Rate
at DC
2011 --- --- 20% 30+ ---
2012 12 1,918 13.7% 19.6 65.4%
2013 29 6,180 14.8% 18.3 75.4%
2014 37 9,290 14.6% 17.1 80.5%
2015 39 8,669* 13.5% 15.7 82.4%
*Annualized
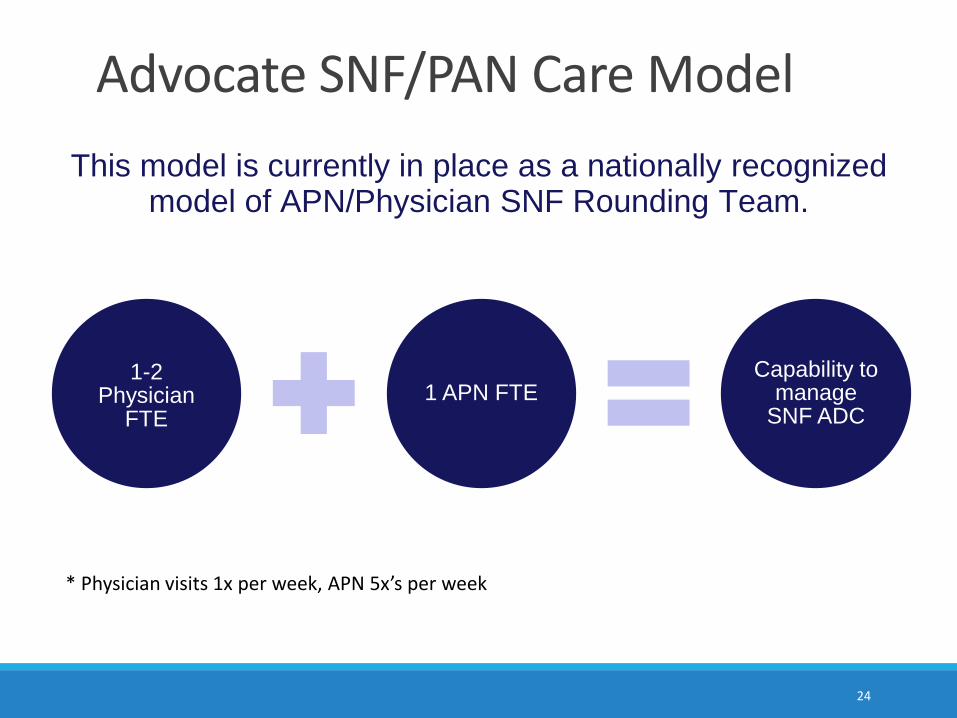
1-2 Physician
FTE1 APN FTE
Capability to manage
SNF ADC
Advocate SNF/PAN Care Model
24
This model is currently in place as a nationally recognized model of APN/Physician SNF Rounding Team.
* Physician visits 1x per week, APN 5x’s per week

ACO/Health System Infrastructure and Data
25
Select & Partner with Post-Acute Provider
Members
Metrics and ReportingAcute/Post-Acute Care
Redesign
Proven Steps to a Successful Post-Acute Continuing Care Network
25

• PAC-CCN Coordinator (SW, Case Manager)
• Administrative Champion (Whole Hospital Buy-in)
• Physician Champion (Attendings, Specialists, SNFist Program)
• APN (Care Redesign)
Create A Real Partnership
Affiliation AgreementsClinical Coordinating Council- Health System
Operating Committee- PACs + Health System, transparent
reporting, solutions
Ad Hoc Care Redesign Task Forces- Acute/Post-Acute Continuum
PAC Partners Want Shared Risk-Shared Savings
26
Your Clinical-Administrative Leadership and Communications

Geographic access for all patients
History of good working relationship with hospital/physicians
SNFs - 24/7 admissions, 3+ stars, lower than average deficiencies, ACO/Health System physicians as SNFists
HHAs – No cherry picking, start within 24 hours of hospital discharge, HHCAHPS scores
Interoperability for EHR and metrics collection/reporting
27
Partner Selection: Credentialing Criteria
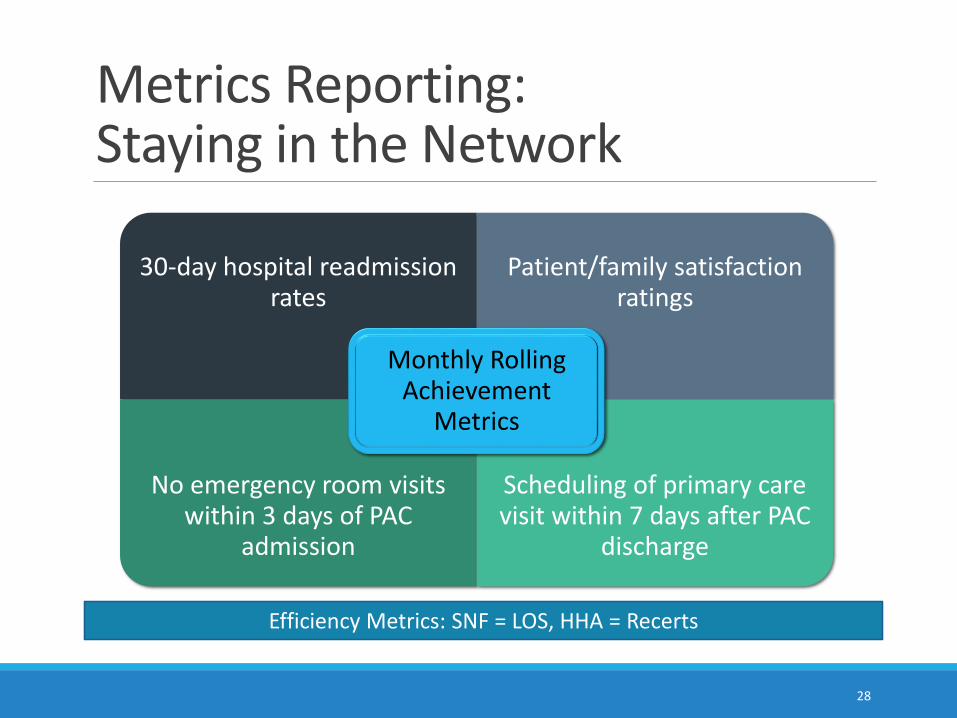
30-day hospital readmission rates
Patient/family satisfaction ratings
No emergency room visits within 3 days of PAC
admission
Scheduling of primary care visit within 7 days after PAC
discharge
Monthly Rolling Achievement
Metrics
Efficiency Metrics: SNF = LOS, HHA = Recerts
28
Metrics Reporting: Staying in the Network

• Process redesign examples- Early identification of, and SNF CCN information to, post-acute
discharges - Standardized advance care planning; palliative care consults in SNFs- Warm hand-offs – all settings (doctor to doctor, nurse to nurse, PCP
integration in process)- Integration with risk stratified, medically complex care management
program
• Ad-hoc subcommittees for cross continuum clinical practice; improved evidence-based practices across the continuum
• IT subgroup for interconnectivity among between hospitals, PCP offices, SNFs and your home health and hospice 29
Redesign Care for Acute/Post-Acute Continuum
29

Hospitals can be Successful in Managing Post-Acute Care
3030
Questions & Dialogue
Jade GongJade Gong [email protected]
703-243-7391
James NewbroughOhioHealth Home Reach
William A. Adair, MDAdvocate Health
Kathleen M Griffin, PhDCare Management Innovations
31

Resources
32
By Jade Gong and Kathleen Griffinhttp://www.aha.org/research/reports/tw/15dec-tw-
postacute.pdf
Resources (cont’d)
33
By Jade Gong and Kathleen Griffin http://www.hhnmag.com/articles/7194-hospitals-
building-a-successful-care-continuum