positron emission tomography - ksuper · 2 ? for situations like the one above, when do the carts...
TRANSCRIPT

© 2010 Kansas State University Physics Education Research Modern Miracle Medical machines is supported by the National Science Foundation under a Director's Award for Distinguished Teaching Scholars, Grant DUE 04-27645 . Opinions expressed are those of the authors and not necessarily of the Foundation.
Modern Miracle Medical Machines
POSITRON EMISSION TOMOGRAPHY Bijaya Aryal & Dyan McBride
Obtaining information from something or some event that we cannot see is a
common practice in physics. For example, some of the information that we have about
very small objects, such as atoms, comes from a process of „working backwards‟ –
collected data is used to infer knowledge about the event or object that gave rise to that
data. Similar techniques are very popular in modern medical technologies where making
a direct measurement might cause harm. For example, we can learn about what is going
on inside a person‟s body without surgery through the use of modern medical imaging
techniques.
One example of such imaging is positron emission tomography (PET), which
allows physicians to investigate the functions of the brain and other organs without doing
surgery. In this lesson you will learn about some of the physics which forms the
foundation for PET. But how does PET work? And what is involved in this process of
„working backwards‟? This set of activities will help you understand the PET process.
Learning to Work Backwards On your table you have two low friction carts on the track. In this activity you
will be exploring the behavior of the motion of the carts.
♦? Bring the carts close to each other and release them. Describe the motion and
compare the approximate speeds of the two carts just by looking at them.
♦? Repeat the activity, but this time use two stopwatches to calculate the time it takes
each cart to reach the end of the rail.
? Using the time you measured, calculate and record the speed of each cart.
2
? For situations like the one above, when do the carts have equal speeds? When do
the carts have different speeds? (Hint: in our trials above, the carts were the same mass.
But what if they weren‟t?) Discuss the physics laws that explain the behavior of the
carts.
Now, we will try to learn something about an event involving the carts without
being able to see the event.
♦ Have your partner place a barrier in front of the track such that you can see only
the two ends of the track. Now have your partner release the two carts somewhere from
the hidden part of the track. Your job is to determine the location from which the carts
were released. On the drawing below indicate the reaction of the first event with (1),
second with (2), etc.
♦? Do three trials, and fill in the table below. Then, switch roles so that your partner
gets to determine the location of the release. Be as accurate as possible when describing
the location of the release, and make sure to explain your reasoning for each trial.
Location Reasoning
1
2
3
4
5
6

3
? What assumptions did you make to determine the location where the carts were
released?
? What measurements would you need to make to find the location more
accurately?
? What are the major factors that cause uncertainty in your prediction of location?
As you saw in the cart activity above, it is possible to work backwards to obtain
information about the location of an event. By observing what happened after the carts
were released, you could determine where they started from.
The fundamental physics idea involved in this process is momentum
conservation. The carts were at rest initially before they were released, which means that
the initial momentum of the cart-system was zero. Once you released the carts, they
moved in opposite directions and kept the total momentum of the system zero. Thus, if
the carts are of equal mass they should have equal speed but in opposite directions. By
looking at the difference in arrival times at the ends of the track, you were able to
estimate the starting location. Because the critical variable in this estimation is time, the
method is called time of flight.
Time of Flight Calculations Though we did not calculate the details of the location of the release, we could
have done so with just a couple physics ideas and a little algebra. Below is a derivation
for carts of different mass, which is a more-general case.
4
Conservation of momentum for this situation states:
𝑝𝑖 = 𝑝𝑓
0 = 𝑚1𝒗1 + 𝑚2𝒗2
𝑚1𝒗1 = −𝑚2𝒗2
Because the carts have equal mass, they will travel with equal speeds in opposite
directions. Now that we know the speed (𝒗), we can find the distance that each car
travels:
𝑑1 = 𝑣𝑡1 𝑑2 = 𝑣𝑡2
Then
𝑑2 − 𝑑1 = 𝑣(𝑡2 − 𝑡1)
Where (t 2- t 1) is the difference in time of when the two carts reached the ends of the
track. We can measure this difference even if we do not know when the carts were
released.
And the total length of the track must be the sum of these two distances:
𝐿 = 𝑑1 + 𝑑2
By combining these equations, we can determine where the release occurred.
𝑑2 − 𝐿 − 𝑑2 = 𝒗 (𝑡2 − 𝑡1)
𝑑2 =L + 𝒗 (t2 − t1)
2
♦ For four locations mark the release point with masking tape, while your partner
measures (t 2- t 1). Then use the equation to determine the release point. Record the data
and results below.

5
Extending to More Dimensions
Open the “PET Visualization” program. When you hit the small switch, an
“explosion” is simulated. Hitting the larger switch will trigger a series of such
“explosions.”
Each of these “explosion” results in only two objects which move outward. When
these object hit the wall of the cylinder, you see lights at the locations where they strike
the wall. Most of the explosions occur in one general region inside the cylinder. Your
main goal is to find this location.
♦? First, hit the large switch and observe the lights on the wall of the cylinder. What
did you observe? Explain any trends in the light positions.
♦? Now concentrate on only one explosion event by using the small switch. Drawn
below is a circle that represents the enclosure – locate where on the wall of the cylinder
you saw the lights. Then, draw the path that the explosion bits must have followed to get
to the location where you saw them. Describe the reasons for your drawing.
? What information does your drawing provide about the location of the explosion?
? Are there any measurements that would help you to more precisely locate this
particular explosion event?
6
As you saw above, by knowing where the two objects produced by the explosion
are detected, it is possible to determine some information about where the explosion must
have occurred. In the case of one event, two objects are produced; if we draw a straight
line between those two objects, we know that the explosion event must have happened at
some point along that line. However, in order to determine the location more precisely,
we need to have more information.
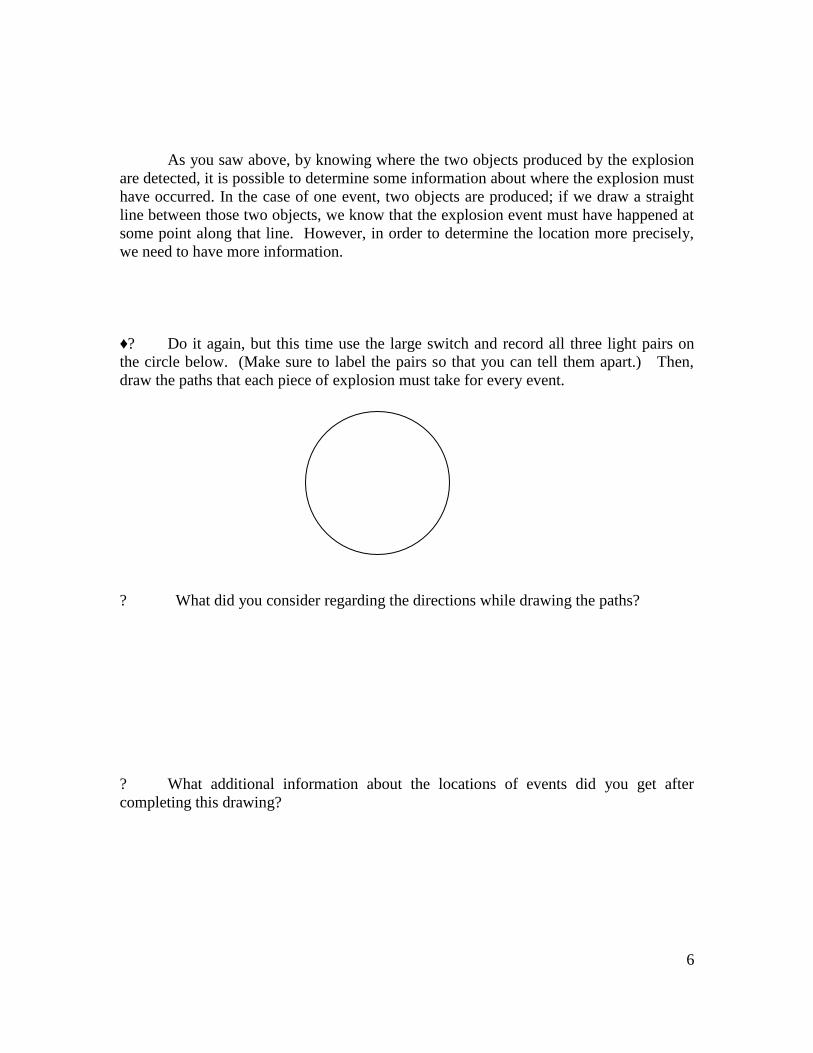
♦? Do it again, but this time use the large switch and record all three light pairs on
the circle below. (Make sure to label the pairs so that you can tell them apart.) Then,
draw the paths that each piece of explosion must take for every event.
? What did you consider regarding the directions while drawing the paths?
? What additional information about the locations of events did you get after
completing this drawing?
7
As you saw, by considering many pairs of light, we were able to determine the
precise location of the explosion. To do this, we draw a line between all the pairs of light
and then look for the place where all of the lines intersect – this place is the only one that
could have produced those pairs of light, and therefore must be location of the explosion.
Unlike in the cart activity where we could see them move, the light moves too fast
for us to be able to measure the time differences. Because of this, you may have found it
difficult at first to predict where the „explosion‟ happened. However, when you plotted
them a series of explosions, you likely saw that it was possible to find a common region
where the explosion events occurred.
With more precise equipment, we could have measured the time difference as
well – this would have provided us with both the location and time differences, and
allowed for the most accurate calculation.
Positron Emission Tomography (PET)
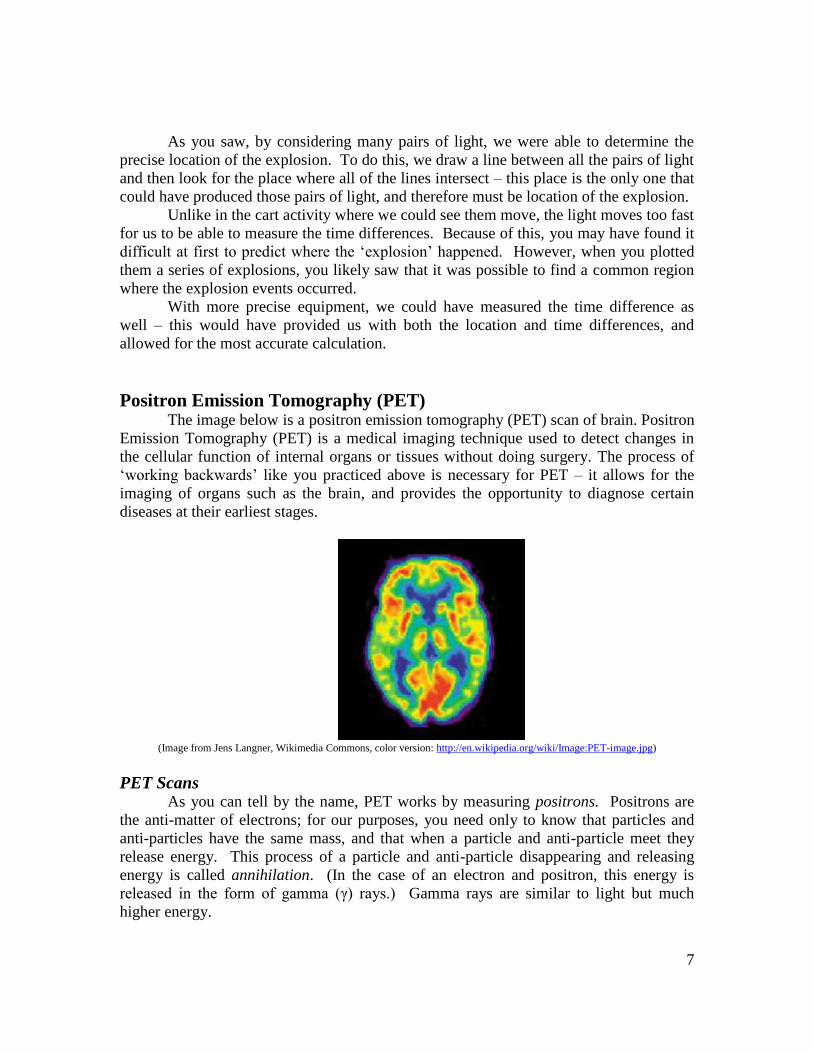
The image below is a positron emission tomography (PET) scan of brain. Positron
Emission Tomography (PET) is a medical imaging technique used to detect changes in
the cellular function of internal organs or tissues without doing surgery. The process of
„working backwards‟ like you practiced above is necessary for PET – it allows for the
imaging of organs such as the brain, and provides the opportunity to diagnose certain
diseases at their earliest stages.
(Image from Jens Langner, Wikimedia Commons, color version: http://en.wikipedia.org/wiki/Image:PET-image.jpg)
PET Scans As you can tell by the name, PET works by measuring positrons. Positrons are
the anti-matter of electrons; for our purposes, you need only to know that particles and
anti-particles have the same mass, and that when a particle and anti-particle meet they
release energy. This process of a particle and anti-particle disappearing and releasing
energy is called annihilation. (In the case of an electron and positron, this energy is
released in the form of gamma (γ) rays.) Gamma rays are similar to light but much
higher energy.
8
Approximately 30 minutes before the PET scan, the patient is administered a drug
that contains a special kind of atom – one that releases positrons through random
radioactive decays. When the positron is released, it travels a short distance and finds an
electron in the tissue. After they meet and annihilate, two gamma rays are normally
released and travel outside the body into the PET scanner.
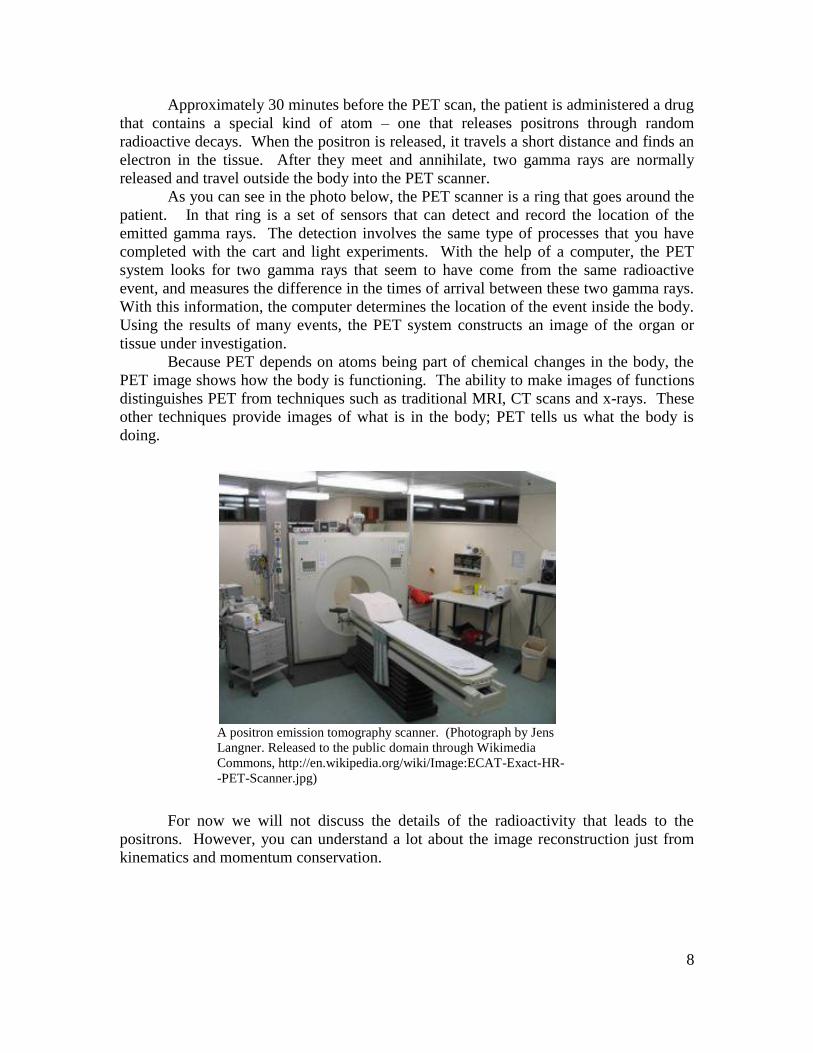
As you can see in the photo below, the PET scanner is a ring that goes around the
patient. In that ring is a set of sensors that can detect and record the location of the
emitted gamma rays. The detection involves the same type of processes that you have
completed with the cart and light experiments. With the help of a computer, the PET
system looks for two gamma rays that seem to have come from the same radioactive
event, and measures the difference in the times of arrival between these two gamma rays.
With this information, the computer determines the location of the event inside the body.
Using the results of many events, the PET system constructs an image of the organ or
tissue under investigation.
Because PET depends on atoms being part of chemical changes in the body, the
PET image shows how the body is functioning. The ability to make images of functions
distinguishes PET from techniques such as traditional MRI, CT scans and x-rays. These
other techniques provide images of what is in the body; PET tells us what the body is
doing.
For now we will not discuss the details of the radioactivity that leads to the
positrons. However, you can understand a lot about the image reconstruction just from
kinematics and momentum conservation.
A positron emission tomography scanner. (Photograph by Jens
Langner. Released to the public domain through Wikimedia
Commons, http://en.wikipedia.org/wiki/Image:ECAT-Exact-HR-
-PET-Scanner.jpg)
9
Momentum’s Role in PET As you read above, a positron and electron combine (annihilate) and form a
gamma ray. Just before they combine, the momentum of the positron-electron system is
zero. We also know that each of the gamma rays in the annihilation process carries
momentum.
? Considering momentum conservation, state the least number of gamma rays that
could be produced by an event of electron-positron annihilation, and explain your
reasoning.
? Now sketch the path of the gamma ray or rays you described above.
? Can you have more gamma rays than you stated above? If so, how? If not –
why? (Hint: discuss the conservation laws involved in the electron-positron
annihilation.)
10
Constructing the Image
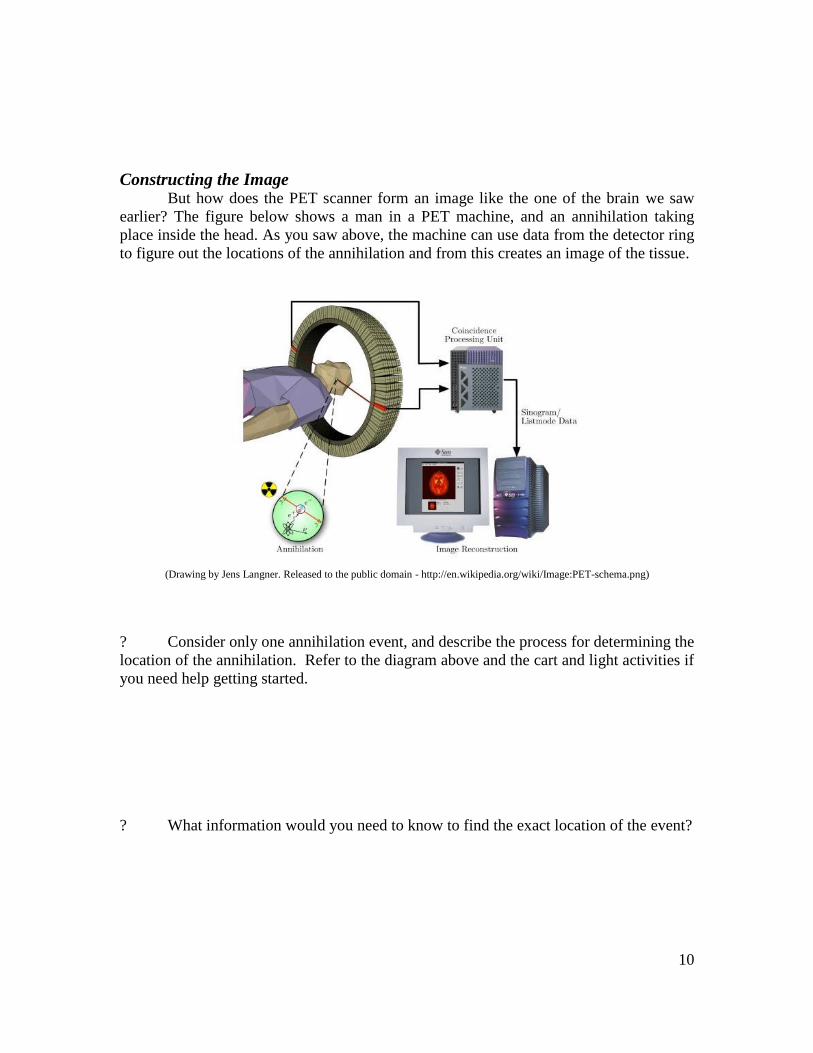
But how does the PET scanner form an image like the one of the brain we saw
earlier? The figure below shows a man in a PET machine, and an annihilation taking
place inside the head. As you saw above, the machine can use data from the detector ring
to figure out the locations of the annihilation and from this creates an image of the tissue.
(Drawing by Jens Langner. Released to the public domain - http://en.wikipedia.org/wiki/Image:PET-schema.png)
? Consider only one annihilation event, and describe the process for determining the
location of the annihilation. Refer to the diagram above and the cart and light activities if
you need help getting started.
? What information would you need to know to find the exact location of the event?
11
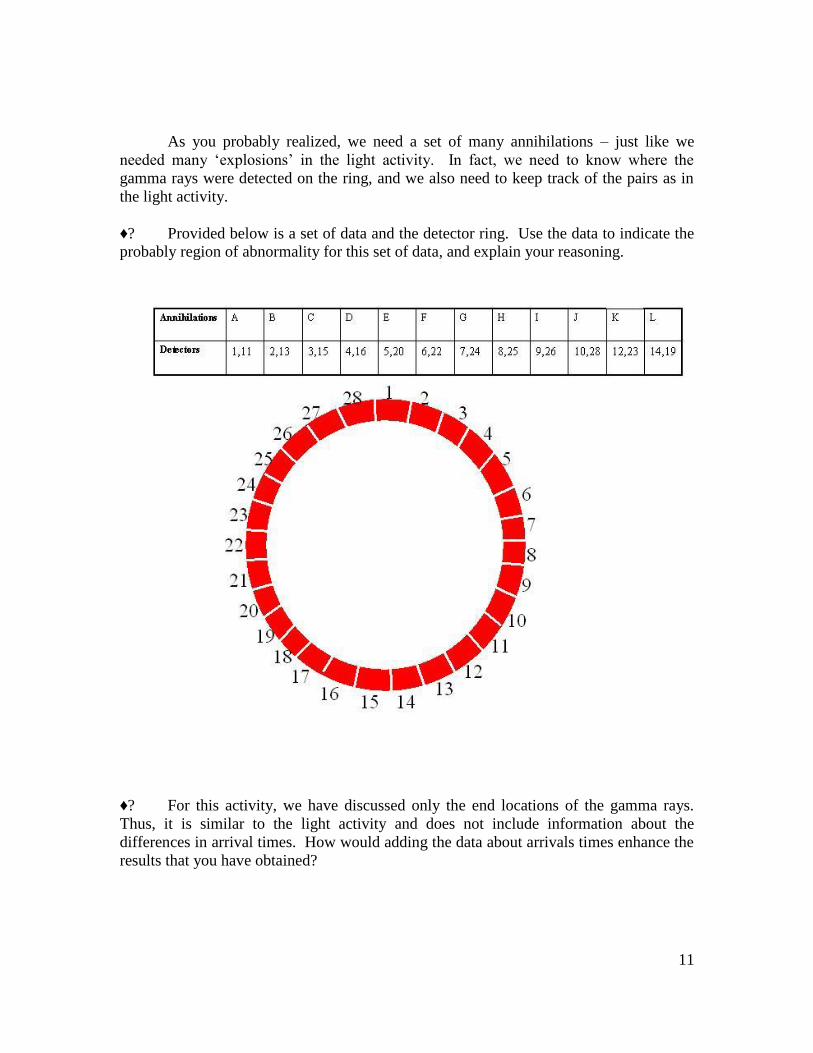
As you probably realized, we need a set of many annihilations – just like we
needed many „explosions‟ in the light activity. In fact, we need to know where the
gamma rays were detected on the ring, and we also need to keep track of the pairs as in
the light activity.
♦? Provided below is a set of data and the detector ring. Use the data to indicate the
probably region of abnormality for this set of data, and explain your reasoning.
♦? For this activity, we have discussed only the end locations of the gamma rays.
Thus, it is similar to the light activity and does not include information about the
differences in arrival times. How would adding the data about arrivals times enhance the
results that you have obtained?
12
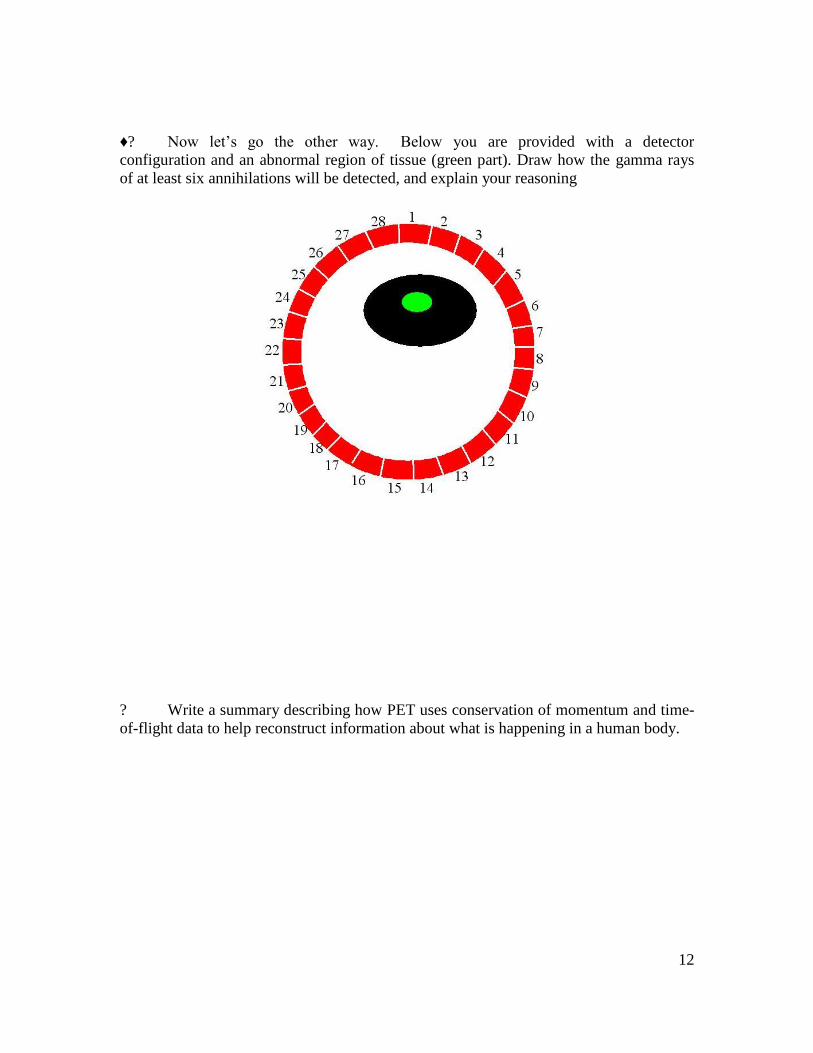
♦? Now let‟s go the other way. Below you are provided with a detector
configuration and an abnormal region of tissue (green part). Draw how the gamma rays
of at least six annihilations will be detected, and explain your reasoning
? Write a summary describing how PET uses conservation of momentum and time-
of-flight data to help reconstruct information about what is happening in a human body.

13
How PET is used: Finding a Tumor Now that you know the basics of PET, it‟s time to put this tool to use. Along with
your partner, you will be responsible for finding a tumor.
♦ Open the “PET Simulation” and choose one person to hide the tumor. To do this,
click on the “Set Sources” button of the Main program. In this screen you can adjust the
number of sources along with their sizes and locations. When you are finished, hit “Ok”
to return to the main program. Then, click “Hide Sources.” It will now be the other
person‟s job to find the tumor that has been hidden.
♦? First, set the step size to 10 and scan to 90. Then hit “Start Scan”. Explain what
is happening and what you saw.
♦? Can you think of a way to more clearly image the tumor?
♦? This time, set the scan to 180. Do you notice any differences n the image?
♦? Now talk with your partner and discuss how the image you found compares to the
original (hidden) image.
♦? Finally, write a quick summary of how PET works and how it is used.

14
Conclusions
As we discussed above, imaging techniques like PET are important because they
allow us to obtain valuable information about organs and tissues without performing
invasive surgery.
PET is based on the principle of conservation of momentum – by knowing that
the total momentum of the positron-electron system is zero just before they annihilate, we
can determine the momentum of the resultant gamma rays. This is similar to what you
did in the cart activity.
Distance and time data can help us to correlate the gamma rays into pairs or
groups and allow us to ascertain which gamma rays came from which annihilation events.
As you saw with the light activity, having these pairs of data allow us to determine the
regions where the annihilations are occurring – the location of the damaged organ/tissue.