positively green: measuring climate change risks to
TRANSCRIPT

Positively green: Measuring climate change risks to financial stability June 2020

Positively green: measuring climate change risks to financial stability / June 2020 Contents 1
Introduction 2
1 What are the shocks? Reviewing climate risks relevant for financial (in)stability 6
2 Are financial markets pricing such shocks or building capacity to do so in the future?14
3 What can currently available disclosures tell us about the exposures of banks and insurers to climate-related risk? 23
4 What can we learn from forward-looking scenario analysis based on existing information and methods? 33
5 Conclusions, open issues and proposed way forward 45
References 47
Imprint and acknowledgements 54
Contents
Positively green: measuring climate change risks to financial stability / June 2020 Introduction 2
Positive measurement of the impacts of climate change is needed to underpin an increasingly heated normative debate. In the sphere of financial stability, there is currently a dearth of sufficiently encompassing and reliable information on risks resulting from climate change. This report evaluates how this information gap can be filled for European Union (EU) Member States, leveraging existing data and methodologies. In particular, the report draws insights from granular supervisory datasets based on available carbon emissions reporting and makes use of existing economic and financial models to gauge potential near-term risks. While climate change reporting by banks and firms alike remains patchy, available datasets and methodologies nonetheless already shed considerable light on financial stability risk exposures. In this context, this report tackles four questions: (i) what magnitude of climate-related shocks can be expected?, (ii) are financial markets pricing the prospect of such shocks (or building capacity to do so in the future)?, (iii) what are the exposures of banks and insurers (based on available disclosures) to potential repricing of climate-related risk?, and (iv) what can we learn from forward-looking scenario analysis to determine where further investment is needed? The main findings are as follows:
1. What magnitude of climate-related shocks can be expected from climate change? Climate shocks appear inevitable. That said, the nature and severity of associated disruptions to the economy and financial markets depend on the timing and stringency of mitigating actions. The costs associated with climate change – even in the nearer term – appear inevitable either in the form of direct physical impacts of climate-related shocks, or transition costs associated with mitigation and adaptation. On the one hand, available estimates suggest that physical damage from climate change could reach one-tenth, or even one-fifth, of global GDP by the end of this century, with considerable uncertainties around amplifying dynamics. In terms of current global output, this would amount to USD 8-17 trillion. Clearly, constructing a long-dated, forward-looking path of climate change impacts involves quite a large degree of uncertainty. Long-dated predictions are not, however, needed to obtain a sense of the growing costs associated with physical risks. The economic costs of climate change events have already been growing steadily in recent years for insurers in the EU, which are already facing the highest-ever levels of weather-related costs. These losses represent over 80% of catastrophe-related losses (mainly resulting from meteorological and hydrological events). Weather-related losses in the EU amounted to €537 billion between 1980 and 2018, and only 35% of these were insured, leaving a large insurance protection gap. While the related loss magnitudes are still manageable, a continuation (or exacerbation) of this upward trend could place greater collective strain on (re-)insurers. On the other hand, available estimates suggest the transition to a low-carbon economy will require investment of between USD 1 trillion and USD 4 trillion in constant terms when considering the energy sector alone, or up to USD 20 trillion when looking at the economy more broadly. While such investments entail upfront costs, they may also embed many positive benefits associated with the employment or output multipliers of such investments, as well as productivity gains associated with new technologies. Moreover, the timing of intervention matters. Early action can avoid a situation in which physical and transition risks interact in a malign self-reinforcing way, whereby delayed mitigating action may yield physical disruptions, prompting abrupt additional tightening to keep temperature rises in check.
Introduction

Positively green: measuring climate change risks to financial stability / June 2020 Introduction 3
2. Are financial markets pricing the prospect of such shocks or building capacity to do so in the future? Climate risk does not appear to be fully reflected in asset prices so far. Capacity is building rapidly, but from a limited starting point. One factor inhibiting a more meaningful response is that financial markets appear to suffer from informational inefficiencies that compound any climate-related capital misallocations. A lack of carbon pricing that adequately captures climate-related externalities means that financial markets – while seemingly willing to price climate-related risk – are unable to fully reflect this risk in prices owing to disclosures that are incomplete (selection bias in firm reporting), inconsistent (lack of accepted methodology for defining green and brown assets) and insufficient (virtually no reporting on downstream emission intensity of products of portfolios). Against this background, the performance of greener firms does not seem to outperform that of other firms. Even if there is limited pricing differential, values-based or green investments might nonetheless be less subject to volatility or sharp price drops. Most importantly, trends in past performance cannot be seen as representative of developments going forward. Green bond markets – while remaining small at only 5% of the global bond market – are expanding rapidly and becoming increasingly liquid. Firms and governments alike are announcing plans for greater green bond issuance, while asset managers and credit rating agencies are working towards an expansion of the environmental social and corporate governance (ESG) asset universe more generally, suggesting that capacity is building rapidly, particularly for asset classes such as equities offering excess returns from climate-related opportunities. But, until capacity is reached, demand for green assets may well outstrip supply, thereby creating scope for market overshooting and possible pricing dislocations.
3. How large are the exposures of banks and insurers (based on available disclosures) to potential repricing of climate-related risk? Exposures of euro area banks to high-emitting firms appear limited on average, but are concentrated in a few large exposures for some banks. Transition risk mitigation appears to be gradually taking place, with a decline of nearly 20% in the CO2 intensity of exposures over the past three years as captured by available data, and is concentrated in exposures to firms with high-intensity climate emissions. This decline, however, follows expanding exposures over a long time frame, which is captured by syndicated loans having higher levels of exposure to carbon emissions over the last decade. Concentration remains an issue – a few banks hold the bulk of exposures to the most energy-intensive borrowers, whereby the CO2 emissions of the 20 most polluting firms amount to half of euro area banks’ exposures to emitting firms captured by currently available granular datasets. A simulation analysis measuring the impacts of a credit rating downgrade of one notch for banks’ exposures to the highest polluting firms within economic sectors suggests credit losses that could reach up to 10% of total assets. As for exposures to physical risk, more data, notably geospatial data, are needed to properly assess the parts of the EU economy subject to climate-related impacts.
4. What can we learn from forward-looking scenario analysis and where is further investment needed? Exploratory scenario analysis, involving the re-tooling of existing macro stress test models, focuses on the short-run impacts of transition risk emanating from either a sharp policy tightening or strong technological adjustments. This analysis, initially constructed with the maximum horizon suitable for associated off-the-shelf dynamic models (five years), suggests that transition costs in the form of both economic output and bank capital would be

Positively green: measuring climate change risks to financial stability / June 2020 Introduction 4
manageable and temporary for banks and insurers. Transitory GDP losses reach a trough of 2.5% for banks and insurers, concentrated in the sectors most exposed to financial repricing risks. But even in a scenario of sharp carbon policy tightening, negative impacts on aggregate GDP appear limited. However, technology-related shocks, in the form of an increased share of renewable energy across sectors, would lead to GDP-neutral or enhancing effects after frictions associated with sectoral reallocations have dissipated. In reality, such transition shocks are likely to interact. And, indeed, with bank capital losses limited to a range between 0% and -0.8%, the magnitude of these shocks on the economy and banks alike pales in significance compared with stress tests to more standard recessionary economic and financial scenarios, where output losses can easily be four times higher (and permanent). Moreover, these transitory losses are paltry compared with the potential economic losses associated with the manifestation of potentially broad geographical and sectoral physical risk over the medium term, particularly if systemic amplifications are taken into account. This suggests that early action to tackle climate risk, including adaptation and mitigation measures should have net benefits.
Notwithstanding the foundations that this report provides for better understanding financial stability risks from climate change, further work is needed for more accurate and encompassing measurement of the risks to financial stability. First and foremost, data gaps constrain a fully representative analysis. On the one hand, disclosures remain incomplete, inconsistent and insufficient. Incompleteness relates to the voluntary nature of current disclosures, meaning that firm disclosures of climate metrics remain partial and incomplete amid likely selection bias, and therefore not representative of the broader industrial sample of polluting firms. Inconsistency relates to the potential for so-called “greenwashing”, with an inadequate accreditation for green labelled products absent a widely accepted benchmark taxonomy. Insufficiency relates mainly to the downstream emission intensity of the products of portfolios, which are rarely reported in a consistent manner. On the other hand, the disclosures of financial institutions – notably banks – fail to encompass the climate risk inherent in their asset portfolios. Newly available credit register information might help to fill gaps. Beyond data deficiencies, efforts need to be made to meaningfully expand currently available financial modelling for the purpose of climate analysis. In order to better capture physical risk, geolocational data are needed to evaluate susceptibility to physical risk – both acute (e.g. extreme events) and chronic (e.g. rising sea levels). The frameworks that are currently adept at analysing the links between economic and financial interactions need to better incorporate links to environmental science to allow for a full cost-benefit analysis to inform timely and tailored policy action. Such advances are crucial for underpinning evidence-based policy reflections associated with climate change adaptation and mitigation.
More generally, the ongoing health pandemic has brought the prospect of large shocks to our collective attention. The scale and nature of the transmission channels through which this arguably foreseeable – but not specifically predictable – shock has affected the global economy has been illustrative. It has laid bare a need for timely information as the shock evolves, leading to large financial market swings in sentiment as financial markets revisit both expected cashflows and returns of companies in a “new normal” equilibrium. It has involved a series of local policy actions aimed at addressing the shared public health challenges experienced around the globe. On the economic and financial side, this global challenge has created both risks and opportunities in line with the ability of economic sectors, firms and governments alike to cope with the shock. There are

Positively green: measuring climate change risks to financial stability / June 2020 Introduction 5
numerous economic and financial parallels to the risks posed by climate change.1 Most importantly, global climate change may also be foreseeable, but involves many uncertainties, and a need for accurate information to underpin allocative decisions. As a corollary, both risks and opportunities also follow from the capacity of economies, financial markets and financial intermediaries to collectively weather climate-related shocks.
The remainder of this report is structured as follows. Section 1 outlines evidence on the costs of climate change. Section 2 provides an overview of financial markets – from pricing of climate risk to market developments. Section 3 outlines financial sector exposures. Section 4 contains details of forward-looking scenario analysis and the foundations of an exploratory pilot risk assessment framework. Section 5 concludes and sets out avenues for further work.
1 As argued by Normand (2020), both pandemics and climate-related catastrophes are global and existential threats that are
sometimes neglected by policymakers and ignored by investors because they seem intangible or remote until they actually strike. Indeed, Alok et al (2020) find evidence of a “salience bias” that decreases over time and distance from disasters.

Positively green: measuring climate change risks to financial stability / June 2020 What are the shocks? Reviewing climate risks relevant for financial (in)stability 6
There has been a striking rise in temperatures over the last decade as the level of CO2 in the atmosphere has skyrocketed. Global temperatures have been far higher in the past decade compared with their 100-year average, in tandem with an unprecedented rise in CO2 in the atmosphere (see Figures 1a and b).
Figure 1a Changing trends: Global mean temperatures, 1850-2018
(deviation of temperature from annual average temperatures between 1901 and 2000; +/- 2.6 standard deviations)
Source: ShowYourStripes.info based on data from UK Met Office. Note: The average temperature is set as the boundary between blue and red colours, and the colour scale varies by +/- 2.6 standard deviations from the annual average temperatures between 1901-2000.
Figure 1b Changing trends: Current CO2 concentration in the atmosphere
(CO2 in parts per million by volume; thousands of years)
Source: National Oceanic and Atmospheric Administration.
1 What are the shocks? Reviewing climate risks relevant for financial (in)stability

Positively green: measuring climate change risks to financial stability / June 2020 What are the shocks? Reviewing climate risks relevant for financial (in)stability 7
At the same time, scientific advances that allow long-dated horizons suggest that irrevocable temperature increases have already been locked in (see Figure 2a).2 At least four different global warming pathways can be considered, with most yielding a warming outcome of 2°C or more above pre-industrial levels by 2100.3 The first is a baseline scenario with a complete absence of mitigation policies, which according to the IPCC would imply global warming of 4.1-4.8°C. A second pathway represents existing policies that only reduce baseline warming to 3.2°C. A third pathway considers optimistic policies that are planned, but not yet implemented, resulting in a median global warming path of 2.8°C. A fourth pathway considers additional policies to meet pledges and targets, which results in a level of global warming that is still above the 2°C “tipping point.” All four pathways suggest that current policies are incompatible with the pathway that limits global warming to 1.5°C in line with the Paris Agreement. Moving to such a pathway requires implementation of a sharp policy tightening not decades in the future, but in the next few years. All of the scenarios have system-wide impacts on financial stability in the form of either physical or transition risks in the coming decades. Perhaps the most damaging scenario is one of a double hit to economic output as a result of physical risk manifesting itself at the same time as a belated, but sharp, policy tightening (see Gros et al., 2016).
Figure 2a Climate risk scenarios: Projections of carbon emissions and global warming
(emissions of CO2 in gigatonnes per year)
Sources: Climate Action Tracker, Warming Projections Global Update. Note: December 2019 projections.
2 See Gillingham and Stock (2018). 3 There is some debate over the impact of bypassing this 2°C global warming threshold, whereby many suggest that non-
linear dynamics set in and cause increased climate-related disasters. See Jaeger and Jaeger (2011) for a discussion of several views on the appropriateness of the 2°C target.
Phys
ical
risk
sTr
ansi
tion
risks

Positively green: measuring climate change risks to financial stability / June 2020 What are the shocks? Reviewing climate risks relevant for financial (in)stability 8
Figure 2b Climate risk scenarios: Strength of response
Source: NGFS Comprehensive Report, 2019, p. 21.
There are two main channels through which climate change can affect macroeconomic conditions and financial stability (NGFS, 2019a). On the one hand, there is the possibility of physical risk, or actual changes, in climate-related events. Such events can be both acute (sudden) and chronic (more gradual, but equally voracious – such as changes in precipitation, extreme weather variability, ocean acidification and rising sea levels. A shift in the climate can have both an economic impact and an impact on financial stability through a number of supply and demand channels. Physical risks have already been playing a growing role in eroding the collateral and asset values of insurers. Insurance liabilities are particularly exposed to the frequency and severity of climate and weather-related events that damage property or disrupt trade (Gassebner et al., 2010; Albouy et al., 2013; Bunten and Kahn, 2014). The share of weather-related catastrophe losses has increased steadily to account for over 80% of insured catastrophe losses in 2018, while the frequency of weather-related loss events hit a record in 2018 (Swiss Re Institute, 2018). On the demand side, extreme climate events could reduce household wealth and therefore private consumption (Hallegatte, 2009). Business investment could also be dampened by uncertainty about future demand and growth prospects and substantial price impacts (Parker, 2018). On the supply side, natural disasters can disrupt business activity and trade, and destroy infrastructure, diverting capital from technology and innovation to reconstruction and replacement (Batten, 2018). Climate change can also trigger migration on a grand scale, cause potential social conflict and have an impact on labour market dynamics (Opitz Stapleton et al., 2017). As has proven to be the case in the past, these macroeconomic and financial shocks can further interact and amplify each other

Positively green: measuring climate change risks to financial stability / June 2020 What are the shocks? Reviewing climate risks relevant for financial (in)stability 9
(Schwartz, 1995; Bordo et al., 2001). An example of this is the possibility of natural disasters causing a reduction in the collateral values of housing stock and weakening households’ balance sheets, in turn reducing household consumption (NGFS, 2019b). For Europe in particular, Ciscar et al (2018) detail potential climate impacts in two different scenarios (a high level of warming scenario and a 2°C scenario) in the JRC Project PESETA. The JRC report lists 11 categories of climate change that could all be relevant in the EU, namely coastal floods, river floods, droughts, agriculture, energy, transport, water resources, habitat loss, forest fires, labour productivity and mortality due to heat.
On the other hand, transition risk can arise as a result of the shift to a low-carbon economy (such as changes in public regulation, technology or in households’ or investors’ preferences) triggering changes in demand-related factors. This adjustment process is likely to have a significant impact on the economy and, in particular, on some financial asset values. The potential risks to the financial system from the transition are greatest in scenarios in which the redirection of capital and policy measures – such as the introduction of a carbon tax – occur in an unexpected or otherwise disorderly way (NGFS, 2019b). A sharp adjustment with a view to lowering emission pathways might mean that large shares of fossil fuel reserves can no longer be extracted, thus becoming stranded (McGlade and Elkins, 2015). Other fossil fuel-dependent sectors will probably be impacted indirectly as a consequence (Cahen-Fourot et al., 2019). The size of the impact depends on the assumptions made about when and how the transition happens, and which sectors it affects. The risk is that a sharp reassessment of climate change risks could lead to a financial market reassessment, leading to a spiral of persistent tightening of financial conditions as losses ensue (Bolton et al., 2020).
Physical and transition risks are not likely to be independent of one another (see Figure 2b). As highlighted by the NGFS scenario matrix (see NGFS, 2020), the lack of sufficiently forceful policy measures aggravates physical risks, while excessive or misplaced climate policies may intensify transition risks (Vermeulen et al., 2018). While an “orderly” scenario can be seen as the most desirable scenario, a “too late, too sudden” scenario would not allow for sufficient mitigation to limit physical risks despite radical (albeit late) policy action. Quantification of trade-offs can help inform policy action – and in an uncertain world of prediction, inform the scope for Type 1 (climate emergency) and Type 2 (misplaced policy action) errors. The difficulty of treating physical and transition risk lies in limited cross-disciplinary modelling and in marrying traditional macro-financial approaches with those informed by climate science.
Early action to tackle climate change can generate considerable benefits in reducing the nature and severity of disruptions to the economy and financial markets from climate change. That said, investments to tackle climate change involve costs, including the costs of foregone GDP in the event that physical climate risk manifests itself. A survey of the academic and policy literature on measuring climate costs suggests that the macroeconomic costs of both policy inaction and action are high – thereby creating no simple solutions, but rather trade-offs that stem from the timing and stringency of action (see Tables 1a and b). While transition risks can be avoided through inaction, this comes at significant economic costs through higher levels of physical damage and risk (ESRB, 2016; Finansinspektionen, 2016). The Organisation for Economic Co-operation and Development (OECD) estimates that as much as one-tenth of global GDP could be wiped out by the end of this century without mitigation policies, with other studies anticipating double that amount. However,

Positively green: measuring climate change risks to financial stability / June 2020 What are the shocks? Reviewing climate risks relevant for financial (in)stability 10
IPCC estimates indicate that the investment needed to reach the target set in the Paris Agreement of global warming of less than 1.5˚C could amount to USD 830 billion yearly until 2050.4 Studies on the costs of transition to a low-carbon economy, estimate the need for investment ranging from USD 1 trillion to USD 4 trillion in constant terms when considering the energy sector alone, or up to USD 20 trillion when looking at the economy more broadly.5 However, if delayed, action will need to be even more abrupt to keep temperature increases in check, further raising transition risks. These results all point to the significant economic risks that surround both climate change and transition to a low-carbon economy. However, the timing and magnitude of these impacts look considerably different in the different scenarios considered. Indeed, the results illustrate how limited our understanding still is regarding how these impacts translate into system-wide risks for financial markets, particularly when second order effects are taken into account.6
Table 1a Estimates of climate risk costs: Range of estimates for the impacts of physical risk on the macroeconomy
Studies Scenario GDP impact Timeline
Burke et al. (2015) 5 - 6°C -23% 2100
OECD (2015) 1.5°C 4.5°C
-2% -10%
2100
Nordhaus (2017) 6°C -8.50% 2100
Hsiang et al. (2017) 1.5°C 4°C 8°C
0.1% to -1.7% -1.5% to-5.6% -6.4% to -15.7%
2100 2100 2100
Source: NGFS Technical Supplement, 2019, p. 7.
4 See also IMF (2019a) for a feasibility analysis of the impacts of carbon tax changes. 5 See IEA and IRENA (2017). There is also a difference in the methodology used. The IEA estimates stranded capital, while
IRENA estimates stranded value. For instance, in the upstream oil and gas sector, the IEA considers the investments by oil and gas firms in exploration, which may not be recouped. IRENA, on the other hand, considers the potential priced-in market value of explored reserves, which – as one might expect – is higher than the cost of exploration.
6 Wagner and Weitzman (2018) argue that climate projections can vary considerably depending on the probability distributional assumptions employed; using a fat-tailed Pareto distribution instead of a (log)normal distribution can increase extreme probabilities by over 40-fold.

Positively green: measuring climate change risks to financial stability / June 2020 What are the shocks? Reviewing climate risks relevant for financial (in)stability 11
Table 1b Estimates of climate risk costs: Range of estimates for the impacts of transition risk on the macroeconomy
Studies Scenario GDP impact Timeline
IPCC (2014) Limiting warming to 2°C (summary of 31 models and 1,184 sceanrios)
1-4% of global aggregate consumption levels
2030
Finansinspektionen (2016) Limiting warming to 2-3°C Up to 3%
German Federal Ministry of Finance (2016)
Limiting warming to 1.5-2°C 2-5% of GDP
Landa et al. (2015) Emission cuts of 40% in 2030 and 50% in 2050 through carbon taxation
More than -4% of GDP, but positive GDP impact of around 4% if carbon tax is redistributed
2050
OECD (2017) Limiting warming to 2°C Positive GDP impact of 2.8% 2050
TOL (2009) +2.5 and -4.8% of GDP
Acemoglu et al. (2012) Delayed policy reaction Reduced consumption by 6% to 16%
Nordhaus (2017) Output is reduced by damages and mitigation costs
By the year 2100, damages will be around 4% of global input
CISL (2015) Limiting warming to 2°C 3.2% higher net present value of cumulative output compared to baseline
2050
Wei et al. (2017) 22 different GHG mitigation policies
Gross State Product (GSP) increase of $9.85 billion pesos
2030
Source: NGFS Technical Supplement, 2019, p. 10.
Aside from long-dated predictions, actual measurement of physical risks to date suggests that physical and transition risks are already playing a growing role in eroding collateral and asset values of insurers. Insurance liabilities are particularly exposed to the frequency and severity of climate and weather-related events that damage property or disrupt trade. An analysis of global insured catastrophe losses indicates that the share of weather-related catastrophe losses has increased steadily to account for over 80% of insured catastrophe losses in 2018 (see Charts 1a and 1b). At the same time, examining the number of relevant natural loss events worldwide suggests that the frequency of weather-related loss events hit a record in 2018. Examining the breakdown of losses suggests growth mainly in the category of hydrological events (triggered by floods and rain), but also meteorological events (storms), with much less impact from insured climatological events (extreme temperature-driven events, including droughts and wildfires).

Positively green: measuring climate change risks to financial stability / June 2020 What are the shocks? Reviewing climate risks relevant for financial (in)stability 12
Chart 1a Climate risk and insurance losses: Global insured catastrophe losses
(left-hand scale: USD billions in 2018; right-hand scale: percentages)
Sources: Swiss Re Institute, Munich Re NatCatService and ECB calculations. Notes: Shaded areas show insured losses. The Kyoto Protocol was signed in December 1997 and the Paris Agreement was signed in December 2015.
Chart 1b Climate risk and insurance losses: Increasing incidence and cost of natural loss events
(left-hand scale: number of events; right-hand scale: percentages)
Sources: Swiss Re Institute, Munich Re NatCatService and ECB calculations. Notes: Shaded areas show insured losses. The Kyoto Protocol was signed in December 1997 and the Paris Agreement was signed in December 2015.
In order to adequately capture the trade-offs of climate action, a suite of models is required, in which policy analysis takes into account behavioural implications (i.e. is resilient to the Lucas
0
10
20
30
40
50
60
70
80
90
100
0
20
40
60
80
100
120
140
160
1975 1978 1981 1984 1987 1990 1993 1996 1999 2002 2005 2008 2011 2014 2017
Earthquake/tsunamiWeather-related catastrophes
Man-made disastersPercentage of weather-related catastrophes losses – 5-year moving average
020
16
125
24
2
21
0 11
22
1810
23
2
15
Geophysical events
Meteorological events
Hydrological events
Climatological events
Post Paris agreement, € 23 billion per annum
Pre Kyoto Protocol,
€ 13 billion per annum

Positively green: measuring climate change risks to financial stability / June 2020 What are the shocks? Reviewing climate risks relevant for financial (in)stability 13
Critique).7 On the one hand, existing tools within central bank models (capturing the interplay of financial and macroeconomic dynamics) can help quantify near-term trade-offs around a given economic steady state (up to a three to five-year horizon). Using these models at the appropriate level of granularity to size the substantial redistributive effects across economic sectors may still pose a challenge. Capturing the longer-term horizon (beyond five years) of climate-related risks calls for a broader set of methodological tools that can account for a changing steady state and endogenise variables, such as technology, factor inputs and other growth elements. For the purposes of financial risk management, this will require “severe but plausible” scenarios, located at the tails of the probability distribution, which are not always congruent with the conditional projection philosophy of climate risk modelling.
7 Structural breaks associated with climate may be quite distinct from previous economic relationships inherent to many
models, see Lucas (1976).

Positively green: measuring climate change risks to financial stability / June 2020 Are financial markets pricing such shocks or building capacity to do so in the future? 14
Contrary to shocks to the global financial system with potentially sizeable economic effects, financial market pricing of climate risks appears heterogeneous at best, and absent at worst. This might not only reflect allocative market failures associated with the pricing of externalities, but also the potential for informational market failures. Much of this stems from underlying issues relating to data disclosure, which remain insufficient, incomplete, and inconsistent. As indicated in the previous section, disclosures remain insufficient as they are patchy among firms. Existing disclosures also tend to be incomplete in that they do not generally capture carbon emissions over the lifetimes of products and measure the emissions from production, omit the emissions of products in use (so-called Scope 3 emissions according to the Greenhouse Gas Protocol). Lastly, data disclosures remain inconsistent and subject to greenwashing. This can be rectified by further standardising information requirements. Addressing all three issues could, in turn, allow financial markets to do what they tend to do best, namely efficiently allocate financial flows (see De Haas and Popov, 2019). However, dealing with disclosures might not be sufficient to alleviate allocative inefficiencies in financial market pricing. Given the lack of any internationally (regionally) consistent system-wide action such as a carbon pricing scheme, the returns in carbon-intensive sectors are likely to be overestimated. Conversely, the lack of sufficiently encompassing and rigorous scenario analysis and the time inconsistency in investment decisions (longer/medium-term risks versus shorter-term financial exposures), may lead to the underestimation of climate risk and suboptimal capital allocation. Whereas a majority of banks and other surveyed institutions acknowledge that climate change poses severe financial risks, available information suggests that they have only recently started to consider the most immediate of these risks in their business models. In several cases, climate change still appears to be viewed more as a corporate social responsibility issue, which is mostly a question of reputational risk, with less emphasis on credit or market risks. In this respect, progress made on modelling climate risk has been uneven, with some banks already developing and implementing climate risk-related indicators, while others have adopted a more passive approach.
Prima facie, any limited pricing differential between green and other assets may relate to performance. On face value, there has been a discernible difference between return on equity (RoE) for relative polluters compared with relatively clean firms in recent years (see Chart 2a). That said, the gap in median RoE between relative polluters and cleaner firms has been narrowing. While this helps to shed some light on the relationship between low-carbon and high carbon firms, the definition of “relatively high-emitting” and “low-emitting” firms does not use the same threshold as those used for green bonds, potentially distorting return differentials. As climate risks are likely to materialise over a long-run horizon, without immediate cost incentives to tackle this externality, such as an increase in carbon taxes, it is unlikely that firms’ returns will be affected in the short run.
2 Are financial markets pricing such shocks or building capacity to do so in the future?

Positively green: measuring climate change risks to financial stability / June 2020 Are financial markets pricing such shocks or building capacity to do so in the future? 15
Chart 2a Green bond markets – return and maturity differentials: Distribution of return on equity for EU firms grouped by CO2 and equivalent emissions
(percentages)
Sources: Refinitiv Eikon, ESMA. Notes: The horizontal line within each box shows the median. The top and bottom of the box = 25th and 75th percentile of the sample. The upper and lower whisker are the respective adjacent values (box top/bottom; +/- 1.5*interquartile range).
Chart 2b Green bond markets – return and maturity differentials: Green bond maturity buckets
(percentages)
Sources: Climate Bonds Initiative, Refinitiv EIKON, ESMA. Note: Distribution of green bonds and corporate bonds outstanding in the EU by maturity bucket and source issued up to and including November 2019.
0%
10%
20%
30%
40%
50%
60%
70%
80%
90%
100%
Public sector green bonds Private sector green bonds Conventional corporate bonds
0-5 years5-10 years
10-20 years>20 years

Positively green: measuring climate change risks to financial stability / June 2020 Are financial markets pricing such shocks or building capacity to do so in the future? 16
The attributes of the growing market in green bonds provides a useful illustration of trends in the broader green assets universe. Although climate risk has a long horizon, green bonds do not have markedly different maturities compared with conventional corporate bonds. Currently, 80% of green bonds have a maturity of less than ten years. Green bonds issued by the public sector tend to have longer maturities, while corporate bonds generally have shorter ones (see Chart 2b). At the same time, differing liquidity in green versus non-green assets can also be an issue in conditioning price dynamics.8
Restricting the focus of financial market pricing differentials to median returns might not sufficiently nuance expected returns. Morgan Stanley (2019) do not find any consistent or statistically significant difference in total returns, but they do observe a 20% smaller downside deviation for sustainable funds compared with traditional funds. Similarly, Monasterolo and De Angelis (2020) find that, following the Paris Agreement, low-carbon and carbon-intensive indices have performed differently in terms of equity market declines. With regard to real estate, a recent study by the Bank of England concluded that mortgages for energy-efficient buildings are less frequently in payment arrears (Guin and Korhonen, 2020). In a similar vein, Cui et al. (2018) suggest that Chinese banks with higher ratios of green lending have lower non-performing loan (NPL) ratios. For other helpful literature at the European level, see Pointner and Ritzberger-Gruenwald (2019), National Bank of Belgium (2019) and Prudential Regulation Authority (2018). Lastly, Engle et al. (2020) show that textual analysis of the intensity of the climate debate can provide a meaningful dynamic hedge against climate change risk.
Chart 3a Financial market pricing of climate risk: Correlations of bank environmental scores by Bloomberg and Refinitiv
(indices)
Sources: Bloomberg, Refinitiv EIKON, S&P Global Market Intelligence and Dealogic. Notes: The Bloomberg and Refinitiv environmental scores give values of between 0 and 100, whereby a higher value indicates a better performance in terms of environmental variables. The full unbalanced sample consists of 49 banks and 23 insurers in the EU and the United States.
8 In this vein, Fender et al. (2019) find that, while the safety and returns afforded by green bonds support their incorporation
into reserve portfolios, their accessibility and liquidity currently pose some constraints.
0
10
20
30
40
50
60
70
80
90
0 10 20 30 40 50 60 70 80 90 100
Ref
initi
v EI
KO
N s
core
Bloomberg environmental score
200920152018

Positively green: measuring climate change risks to financial stability / June 2020 Are financial markets pricing such shocks or building capacity to do so in the future? 17
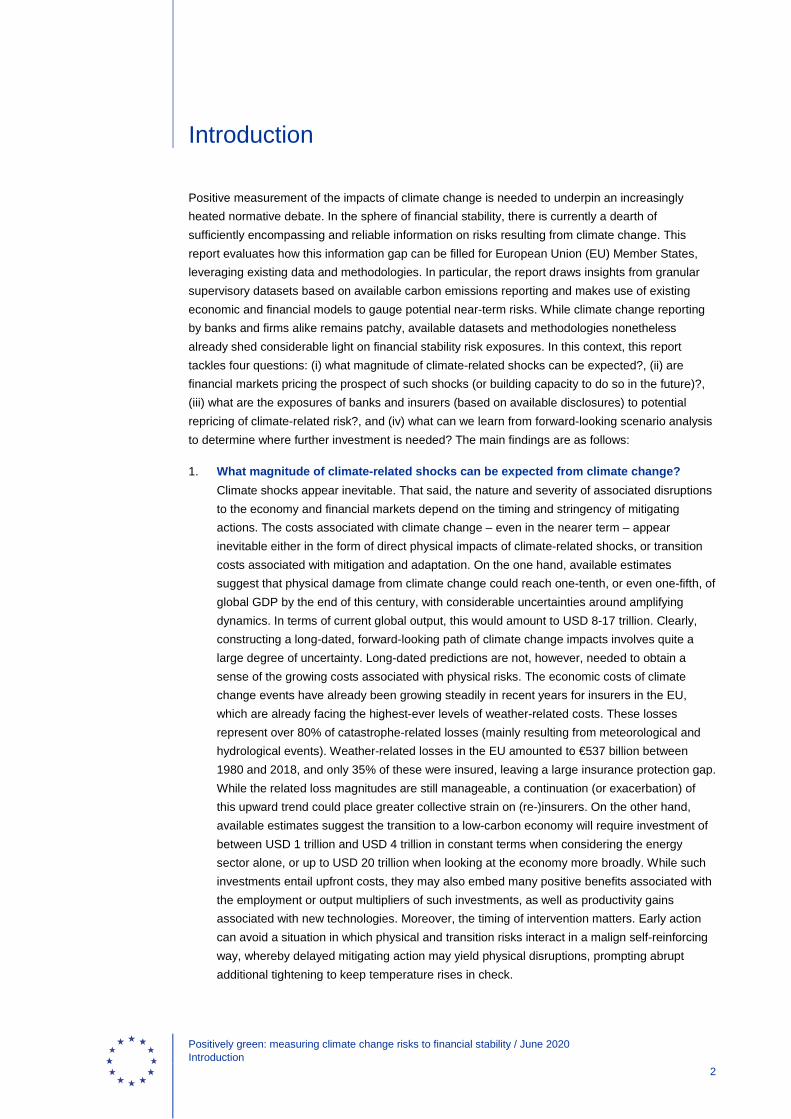
The limited evidence of pricing differentials in green assets compared with other assets may relate to informational inefficiencies, in particular limited convergence of environmental scores across main index providers. A heterogeneous set of scores have been developed by market data providers, all seeking to consolidate quantitative and qualitative environmental information into benchmark indices. Scores provided by Bloomberg and Refinitiv are examples of easily available indicators on the environmental aspects reported by individual institutions and could be used as a proxy for gauging exposure to transition risk. Although the correlation between the two indicators has improved over time, it remains low, signalling significant discretion in environmental scoring, most likely related to climate and broader factors (see Chart 3a). The limited correlation may have several different explanations, including inconsistent reporting, differences in how environmental scores are calculated, or markets not fully pricing in available information. The reporting of Scope 3 emissions or the carbon-intensity of financial portfolios remains absent in bank disclosures to date (see ECB, 2019b). Furthermore, environmental disclosures have limited correlation with stock market valuations for banks, but some for insurers (see Chart 3b). The relationship between an environmental score and price-to-book ratios for a sample of large euro area insurers is somewhat positive and statistically significant, but there is no such relationship for banks. This may reflect greater investor scrutiny of insurers owing to their higher exposure to physical climate risk as a result of their insurance liabilities. The limited evidence that financial institutions are actively reducing the carbon content of their financial portfolios supports the conclusion that market discipline is still not effective in curbing transition risk. In this context, raising awareness about the potential effects of climate risks should remain an important task for supervisory authorities. In particular, focus should be placed on strengthening climate disclosures, given that reporting on greenhouse gas (GHG) emissions currently remains patchy among large fossil fuel companies, which produce a considerable share of global carbon equivalent emissions (see the Guardian, 2019).9
9 Indeed, according to Heede (2014), CO2 emissions are concentrated in the top 20 fossil fuel companies, which have
contributed to 35% of all energy-related carbon dioxide and methane worldwide, amounting to 480 billion tonnes of carbon dioxide equivalent (GtCO2e) since 1965.
Positively green: measuring climate change risks to financial stability / June 2020 Are financial markets pricing such shocks or building capacity to do so in the future? 18
Chart 3b Financial market pricing of climate risk: Environmental score and the price-to-book ratios of European banks and insurers
(indices)
Sources: Bloomberg, Refinitiv EIKON, S&P Global Market Intelligence and Dealogic. Note: The sub-sample used in the estimation consists of 16 EU insurers and 12 EU banks. Standard errors are clustered and robust. An Arellano-Bond estimator is used, and controls include institution-specific variables (e.g. RoE, total debt, EBITDA, total expenses, total assets, dividend payout ratio, NPL ratio, Tier 1 capital ratio, solvency coverage ratio and premium growth when applicable) and market-specific variables (e.g. stock market volatility, long-term bond yields and GDP forecasts).
More recently, studies with a forward-looking orientation that incorporate rapidly expanding green market capacity and are corrected for data-related deficiencies suggest limitations to the validity of past trends, not least as uncertainties surrounding climate-related risks fall (Bolton et al., 2020). Some recent studies indicate not only that green assets can be less risky, but that financial markets are starting to reflect these risk differentials. Bolton and Kacperczyk (2020) find that the stocks of firms with higher total CO2 emissions (and changes in emissions) earn higher returns, after controlling for size, book-to-market, momentum, and other factors that predict returns. This suggests that investors are already demanding compensation for their exposure to carbon emission risk. In the same vein, Alessi et al. (2019) provide some evidence of a significant and negative green risk premium – which the authors label a “greenium”, relying on company-level disclosures and the introduction of transparency controls to account for potential “greenwashing” effects – estimating that a reconstructed green portfolio would have outperformed brown portfolios, offering a 20% return compared with a return of just 12% for a portfolio of brown assets over the period 2006-18. Comparing the performance of high-emissions industries in the S&P 500 index before and after the Paris Agreement, Ilhan et al. (2018) provide further evidence that investors have actually incorporated new information when assessing risk profiles. De Greiff et al. (2018) also find that the risk premium of fossil fuel firms has increased following the Paris Agreement and that this reassessment can be attributed to increased awareness of transition risks (Delis et al., 2018). With regard in particular to oil and gas companies’ market valuations, IHS Markit (2015) argues that market mispricing of fossil fuel assets may not be as large as expected, as they are mostly driven by commercially proven reserves that will be monetised over the medium term (within a period of 10 to 15 years) rather than over a longer-term horizon.
0.0
0.2
0.4
0.6
0.8
1.0
1.2
1.4
1.6
1.8
2.0
60 65 70 75 80 85 90 95 100
Pric
e-to
-boo
k ra
tio
Refinitiv EIKON score
Emissions score versus price-to-book ratio – EU banksEmissions score versus price-to-book ratio – EU insurers

Positively green: measuring climate change risks to financial stability / June 2020 Are financial markets pricing such shocks or building capacity to do so in the future? 19
Chart 4a Evolution of the European green bond market: European issuance of green bonds
(EUR billions)
Source: Dealogic. Note: The last observation was for 4 February 2020.
Chart 4b Evolution of the European green bond market: Rating and issuer-sector split
(EUR billions)
Source: Dealogic. Note: The last observation was for 4 February 2020.
Green market capacity has an impact on investor flows, with a rapid expansion of the green bond market in Europe over the past two years.10 Euro-denominated net green bond issuance has
10 Until recently, the EU had not defined what constituted a green bond, but as of mid-2019, the definition is tied to the EU
taxonomy of sustainable finance.
0
20
40
60
80
100
120
2013 2014 2015 2016 2017 2018 2019 2020
Reoccuring issuerNew issuer
Reoccuring issuer projectedNew issuer projected
0
20
40
60
80
AAA AA A BBB Sub-IG Not rated
2013201420152016
2017201820192020
0 40 80
Sovereign
Private sector industrial
Private sector finance
Public sector finance
Public sector industrial
Supranational

Positively green: measuring climate change risks to financial stability / June 2020 Are financial markets pricing such shocks or building capacity to do so in the future? 20
increased more than ten-fold since 2013, reaching more than €100 billion in 2019 (see Chart 4a).11 During the period 2013-18, total net euro-denominated green investment-grade issuance in the euro area represented around 24% of global net green issuance. However, despite recent growth, over the same period green bonds still only accounted for a small fraction of the overall global bond supply. Although issuance of private sector green bonds as a proportion of overall EU corporate bond issuance has risen almost five-fold over the past four years, it still accounts for only 4.7% of issuance volumes in 2019. The share of private sector green bonds in the corporate bond market has increased from 0.2% in 2015 to 2% in 2019. At the global level, Europe still remains a dominant player in green bond markets, both in terms of its share of global issuance (40% of issuers of climate bonds are by issuers domiciled in the EU) and currency of issuance (31% of green bonds were issued in euro, followed by 24% in USD, 19% in Chinese Yuan and 17% in Indian Rupee). The ratings-issuer split also suggests the market is broadening (see Chart 4b).
Despite a rapid expansion in capacity, the current scale of green bonds and green assets more generally remains far from financial needs. For instance, to become climate-neutral by 2050, the EU needs up to €290 billion in additional yearly investments over the coming decades.12 In financial terms, green bonds tend to price tighter than the initial price guidance and to be oversubscribed. They generally offer similar yields to comparable conventional bonds. However, there is evidence that, in some market segments, issuers can borrow at lower rates than via conventional bonds. This is consistent with the interpretation that investors might in some cases be prepared to forego some income as a result of their investment constraints. As capacity grows, so too might market pricing dynamics, as it is likely that current prices are distorted by a relatively small number of investors with constrained investment mandates that explicitly account for climate and related risks. A closer examination of the dynamics of green bond markets suggests a growing role for the private sector (see Chart 5a). Within the private sector, issuance has been split somewhat evenly between the financial sector and non-financial sector. To date, Issuance has been predominantly in the highly rated bucket, with three-quarters of green bonds rated A or higher (see Chart 5b). While it offers opportunities, the rapid growth in the green bond market could entail risks, not least given the earnings uncertainty owing to the lack of knowledge regarding which technology will drive the transition to a low-carbon economy. In this environment, any prospect of financial market overshooting needs close monitoring.
11 See ECB (2018). 12 See European Commission (2018).

Positively green: measuring climate change risks to financial stability / June 2020 Are financial markets pricing such shocks or building capacity to do so in the future? 21
Chart 5a The financial market for green issuance: Net green bond issuance in the EU
(left-hand scale: net cumulative amount of green bond issuance by issuer type, EUR billions; right-hand scale: private sector share, percentages)
Sources: Climate Bonds Initiative, Refinitiv Eikon, ESMA.
Chart 5b The financial market for green issuance: Credit rating quality by issuer type
(EUR billions)
Sources: Climate Bonds Initiative, Refinitiv EIKON, ESMA. Note: Green bonds outstanding in the EU, by credit rating and issuer sector.
One area that has seen particularly swift market development in recent years is the EU market for emissions allowances. Both prices and turnover have increased sharply (see Charts 6a and b), suggesting that in recent years market forces have been trending in a direction towards more stringent rationing of emissions. At the same time, interest in emissions trading on derivatives markets is still limited – with the emission allowances market still negligible compared with other derivative asset classes.
20%
25%
30%
35%
40%
45%
50%
55%
0
50
100
150
200
250
300
Q4 2014 Q4 2015 Q4 2016 Q4 2017 Q4 2018 Q4 2019
Private sectorPublic sectorPrivate share (right-hand scale)
0
10
20
30
40
50
60
70
80
90
100
AAA AA A BBB Non-IG Not rated
Private sectorPublic sector

Positively green: measuring climate change risks to financial stability / June 2020 Are financial markets pricing such shocks or building capacity to do so in the future? 22
Chart 6a Emissions trading in the EU: Emission allowance prices
(EUR/tCO2)
Sources: Refinitiv Datastream, ESMA. Note: Daily settlement price of European Emission Allowances (EUA) on the European Energy Exchange spot market.
Chart 6b Emissions trading in the EU: Emission allowance turnover
(EUR millions)
Sources: Refinitiv Datastream, ESMA. Note: Monthly turnover of European Emission Allowances (EUA) on European Energy Exchange.
0
5
10
15
20
25
30
35
2015 2016 2018 2019
EUA1Y-MA
0
10
20
30
40
50
60
70
80
90
2015 2016 2017 2018 2019
EUA1Y-MA

Positively green: measuring climate change risks to financial stability / June 2020 What can currently available disclosures tell us about the exposures of banks and insurers to climate-related risk? 23
Monitoring and quantifying risk for financial institutions stemming from near-term climate change requires clear exposures mapping –on both the side of climate-sensitive entities and credit institutions. For climate-sensitive entities, climate-related risks can be broken down into transition and physical risks. For transition risks, information on emitting firms and sectors is needed. The information that can be gauged from publicly available sources, however, remains incomplete. Thanks to the Financial Stability Board’s Task Force on Climate-related Financial Disclosures, an increasing number of firms have been disclosing climate-related emissions in CO2-equivalent units. For instance, firm-level exposures to banks or insurance companies can be mapped with GHG emissions or a related metric of emission intensity (CO2 units/sales) or even production data to measure transition risks. For physical risks, granular locational data of factories can provide a good indication of firms’ resilience to climate shocks such as hydrological events. For balance sheet exposures of credit institutions, central banks and financial supervisors maintain proprietary supervisory datasets rich in granular information. While these datasets are not specifically collected to capture climate-related risks, they can be mapped with minor adaptations to estimate exposure to climate-related risks associated with existing CO2 equivalent emissions disclosures (as the capacity builds to provide a more comprehensive and commonly accepted taxonomy of climate intensity). While available data are incomplete, they can nonetheless provide key insights into the magnitude of exposures for banks and insurers alike. A preliminary list of the most important indicators for the financial system is provided below (see Table 2).
3 What can currently available disclosures tell us about the exposures of banks and insurers to climate-related risk?

Positively green: measuring climate change risks to financial stability / June 2020 What can currently available disclosures tell us about the exposures of banks and insurers to climate-related risk? 24
Table 2 Selected indicators of transition and physical risks for banks and insurers
Sector/scope Proposed indicator Financial risk category Data availability
Banking (transition risk)
Loan book exposure to carbon-intensive sectors or firms at risk
Credit risk Large exposures, credit registers and Anacredit
Equity and bond holdings Credit and market risk Securities Holding Statistics
Banking (physical risk)
Loan book exposure to sectors and counterparties subject to physical risk – e.g. flood risk
Credit and market risk Supervisory data, credit registers, balance sheets, SDW
Bond and equity holdings – exposure to vulnerable firms located in risky areas
Credit and market risk Securities Holding Statistics, Supervisory data, credit registers, balance sheets, SDW
Historical losses due to climate events
Operational risk Supervisory reporting (COREP template) – also physical risk
Insurance (transition risk)
Equity and bond holdings – exposure to carbon-intensive sectors and sovereigns
Credit and market risk Exposure data available in SII reporting
Insurance (physical risk)
Equity and bond holdings – exposure to vulnerable firms, sectors and sovereigns
Market risk Exposure data available in SII reporting
Dramatic rise in claims due to covered catastrophe events that were not considered in premiums, mismatch with reserving
Liability Information required on individual policy-level and current reserving practices, including market developments, reinsurance prices Data are not available in structured format/reporting
Both sectors (physical risks)
Residential and commercial real estate exposure to physical risks (e.g. floods, fires, storms); also possibly transition risks
Credit and market risk Supervisory data, credit registers, national hazard maps, Private data providers like credit rating agencies, insurance companies
The granularity of financial institution exposures to climate change risk can be measured at the firm, activity or sectoral level in addition to the commonly reported country level. Climate change financial risk metrics are generally constructed at different levels of aggregation. This report identifies four levels: country, sector, firm and activity-level (see Table 3). Each of these levels is bound to suffer some degree of reporting gap that needs to be resolved. Even in the case of simple summary statistics of climate change risk such as CO2 emissions, parameters like data granularity, coverage or accuracy still present considerable challenges. The lack of accurate data can preclude a rigorous analysis of these risks.

Positively green: measuring climate change risks to financial stability / June 2020 What can currently available disclosures tell us about the exposures of banks and insurers to climate-related risk? 25
Table 3 Data granularity, climate risk and financial stability
Aggregation level Selected advantages Selected disadvantages
Country Comprehensive Suitable for monitoring country commitments
Limited suitability for monitoring effects of climate change on financial exposures
Sectoral Comprehensive at NACE-2 level Feasibility of scenario analyses
Silent on within-sector dynamics over time
Firm Allows for firm-specific climate metrics and dynamics
Partial view on consolidated firm activities Current Not encompassing (at least yet); incomplete corresponding climate data
Activity If possible to allocate an attribute for sustainability, allows monitoring financial flows to sustainable finance
Difficulty of defining green versus brown assets Financial stability is often a function of firm-level health
Source: ECB.
At the country level, it appears that CO2 emissions are quite concentrated. The top five emitters account for 58% of the total (see Chart 7a). Most striking is the rapid rise of China to account for one-third of global CO2 emissions, followed by the United States, India, Russia and Japan. In contrast, the EU’s share of global emissions has shrunk. The largest seven countries within the EU together represent only 7.2% of global emissions, of which Germany is the largest contributor at 2.1%. Clearly, it is unlikely that an abrupt financial market repricing based on the carbon exposure of large diversified sovereigns will take place. At the same time there is a possibility that indirect channels could play a role, for instance fiscal step-in measures for stranded industries (see, for instance, Battiston and Monasterolo, 2019).
Chart 7a Country and industry-level data for climate risk monitoring: CO2 emissions over time
(thousands of tonnes)
Source: ECB based on the European Commission’s EDGAR dataset.
0
5,000
10,000
15,000
20,000
25,000
30,000
35,000
40,000
1970 1975 1980 1985 1990 1995 2000 2005 2010 2015
United StatesChinaIndiaRussia
Rest of EU28GermanyJapanRest of the world

Positively green: measuring climate change risks to financial stability / June 2020 What can currently available disclosures tell us about the exposures of banks and insurers to climate-related risk? 26
Chart 7b Country and industry-level data for climate risk monitoring: Evolution of investment exposures to climate-sensitive sectors
(left-hand scale: EUR billions; right-hand scale: percentages of total holdings)
Source: ECB’s Centralised Securities Database (CSDB) on Securities Holdings. Note: The classification of climate-sensitive assets follows the approach of Battiston et al. (2017).
Moving to the industry level, the evolution of investment exposures to climate-sensitive sectors, computed using the ECB’s Securities Holdings Statistics, suggests that the percentage of total holdings in sectors at risk have been falling for investment firms and pension funds in recent years. Banks and insurance companies have, in contrast, kept their exposures relatively constant (see Chart 7b). That said, as shown in Battiston et al. (2017), this mean estimate may hide important distributional elements, whereby second-round effects polarise initial losses after a first-round repricing scenario. This can be drawn from their value at risk approach.
At the firm level, one indicator of transition risk consists of banks’ exposures to high carbon-emitting firms that would be vulnerable if the transition to a low-carbon economy is delayed and disorderly. Non-financial firms differ widely when it comes to GHG emissions. The emissions such firms generate are largely determined by their industrial sector. For instance, firms in the electricity or manufacturing sectors are significantly more polluting on average than service-oriented segments of the economy such as finance and insurance. In addition to those sector-driven emissions, there are wide variations for firms within the same industry sector. Even though companies carry out the same activities, some companies manage to conduct their business in a more emissions-efficient way (see Chart 8).
0
1
2
3
4
5
6
7
8
9
0
50
100
150
200
250
300
350
400
450
2015 2016 2017 2018 2015 2016 2017 2018 2015 2016 2017 2018 2015 2016 2017 2018
Banks Investment funds Insurance corporations Pension funds
Energy-intensiveFossil fuelsHousing
TransportUtilitiesPercentage of total holdings (right-hand scale)

Positively green: measuring climate change risks to financial stability / June 2020 What can currently available disclosures tell us about the exposures of banks and insurers to climate-related risk? 27
Chart 8 Firm-level emissions intensities within economic sectors
(2017; emission intensity in tonnes of CO2e/EUR millions)
Sources: Refinitiv, ECB calculations.
Banks’ exposures to transition and physical risks can imply individual and systemic implications to sectors and firms that are at increased risk of default, both in absolute terms and as a share of overall exposures. ECB (2019b) examines over €1.4 trillion worth of exposures to banks with their emission intensity and quantifies the degree of systemic risk originating from climate transition risks to which banks are exposed. The analysis suggests that from 2014 to 2017 banks’ firm lending portfolios appear to have become greener. On the one hand, the median emissions of non-financial corporations (NFCs) to which banks are exposed, either through lending, bond or equity holdings, has declined over that period (see Chart 9a). As a result, banks exposures are being greened as an indirect consequence of a decarbonising economy. At an individual level, when one looks at banks’ exposure-weighted emissions, most lenders show a decarbonisation process (see Chart 9b). That said, trends in syndicated lending over a longer time frame – i.e. over the past decade – point to an increase in exposures to high-emitting firms of an almost equivalent amount, suggesting recent decreases in exposure are still quite limited.

Positively green: measuring climate change risks to financial stability / June 2020 What can currently available disclosures tell us about the exposures of banks and insurers to climate-related risk? 28
Chart 9a Emissions intensities of NFCs: Median NFCs’ emissions (left-hand panel), emission intensities (middle panel), bank exposures (right-hand panel)
(median, tonnes CO2; median, tonnes CO2/EUR millions; median, EUR millions)
Sources: Refinitiv, ECB supervisory statistics (large exposures) and ECB calculations. Notes: NFC’s sample is unbalanced. In 2017 approx. 770 companies enter the sample of which 100 are classified as high polluters. High polluters are defined as the NFCs whose total emissions are in the 75th percentile of CO2.
Chart 9b Emissions intensities of NFCs: Most banks decarbonized their portfolios between 2014 and 2017
(exposure-weighted tonnes CO2; total exposures EUR millions)
Sources: Refinitiv, ECB supervisory statistics (large exposures) and ECB calculations. Note: 90 largest euro area banks are included.
0
50,000
100,000
150,000
200,000
250,000
300,000
350,000
400,000
450,000
2014 2017
Emissions of non-financialcorporations
0
10
20
30
40
50
60
70
2014 2017
Emissions of non-financial corporations
0
50
100
150
200
250
300
350
2014 2017
Banks exposures
High pollutersLow polluters

Positively green: measuring climate change risks to financial stability / June 2020 What can currently available disclosures tell us about the exposures of banks and insurers to climate-related risk? 29
Chart 9c Emissions intensities of NFCs: Top 40 CO2 emitting companies who report emissions and euro area banks’ exposures (2017)
(left-hand scale: cumulative share in total, percentages; right-hand scale: EUR billions)
Sources: Thomson Reuters, ECB supervisory statistics and ECB calculations.
Chart 9d Emissions intensities of NFCs: Euro area banks’ exposures are not concentrated towards sectors that are vulnerable to climate risk
Sources: Refinitiv, ECB supervisory statistics (large exposures) and ECB calculations.
0
10
20
30
40
50
60
0
10
20
30
40
50
60
70
80
0 5 10 15 20 25 30 35 40
Euro area Non-euro areaExposure by banks (right-hand scale)

Positively green: measuring climate change risks to financial stability / June 2020 What can currently available disclosures tell us about the exposures of banks and insurers to climate-related risk? 30
These exposures appear to be concentrated. Indeed, a sizeable part of the emissions are concentrated around a very small number of large polluters. Some 50% of all emissions are generated by only 15 firms out of a sample of over 2,000. Those firms are not necessarily the ones to which banks are most exposed. The same conclusion can be drawn at the sectoral level, where the sectors most present in banks’ balance sheets are not the most polluting ones (see Charts 9c and d).13
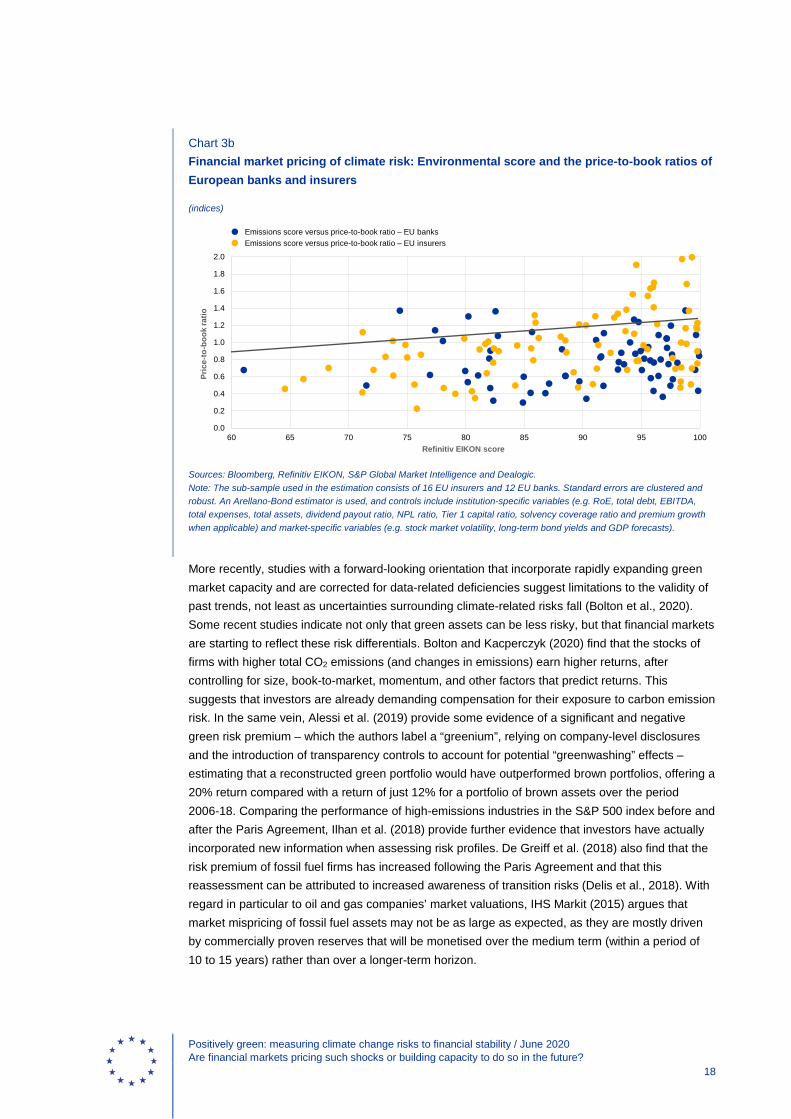
This analysis can be taken a step further, by gauging the sensitivity of market pricing to prospective shifts in sentiment towards the most polluting firms both across and within economic sectors (see Belloni et al., 2020). An analysis of the impact of corporate rating downgrades for high polluters within sectors suggests that, while diversified exposures should shield the banking sector from large losses if the highest-emitting firms within sectors at risk of climate change are downgraded, losses for selected exposures could still be significant. When shocks are applied that are proportional to each firm’s emissions rather than for a sector as a whole, losses in the banking system are estimated to increase by up to 10% for shocks corresponding to one-notch credit rating downgrades (Chart 10). System-wide losses amount to system distress only for downgrades of four notches or more. In particular, the left-hand panel of Chart 10 depicts the factor by which probabilities of default increase given an emissions-based downgrade scenario. As expected, firms in the manufacturing and electricity sectors are more vulnerable to climate risk. The right-hand panel shows the distribution of banks’ losses based on different emissions-based firm-level downgrade scenarios for the highest emitters, irrespective of sector. If the re-rating were to occur at the level of entire sectors rather than firms, losses would be expected to rise strongly.
13 Note that real estate activities do not contribute to carbon emissions as such. That said, real estate activities produce a
very large share of GHG emissions and are also subject to transition risks. In particular, measures imposing minimum Level of Energy Efficiency (EPC) on building measures could significantly impact the collateral value and/or repayment capacity related to energy-inefficient buildings. Also, higher energy prices/carbon taxes could reduce the repayment capacity of borrowers living in energy-inefficient housing.
Positively green: measuring climate change risks to financial stability / June 2020 What can currently available disclosures tell us about the exposures of banks and insurers to climate-related risk? 31
Chart 10 Bank ratings and firms’ emissions: stress factor applied to probabilities of default based on emissions in the corporate sectors (left-panel), distribution of banking system losses relative to baseline (right-panel)
(left-panel: stress factor; right-panel: ratio; system losses to baseline; frequency)
Sources: Moody’s and ECB calculations. Notes: Stresses to probabilities of default at firm level are obtained as a function of each corporation’s emissions and a sensitivity parameter α. The connection with the sectoral analysis is made based on the resulting mean stressed probabilities of default, so that for a given average probability one can find a corresponding value of α. Then, α(n-notch) refers to the level of α giving the equivalent average probability across the sample as in the case of n-notch downgrades in the sectoral analysis. Chart 10a: one-digit NACE-2 sector classification. Sectors are placed in order based on their average emissions. The x-axis shows the factor by which probabilities of default are increased given the emissions-based downgrade. Chart 10b: losses relative to baseline for levels of α comparable to one-to-five notch downgrades in the sectoral analysis
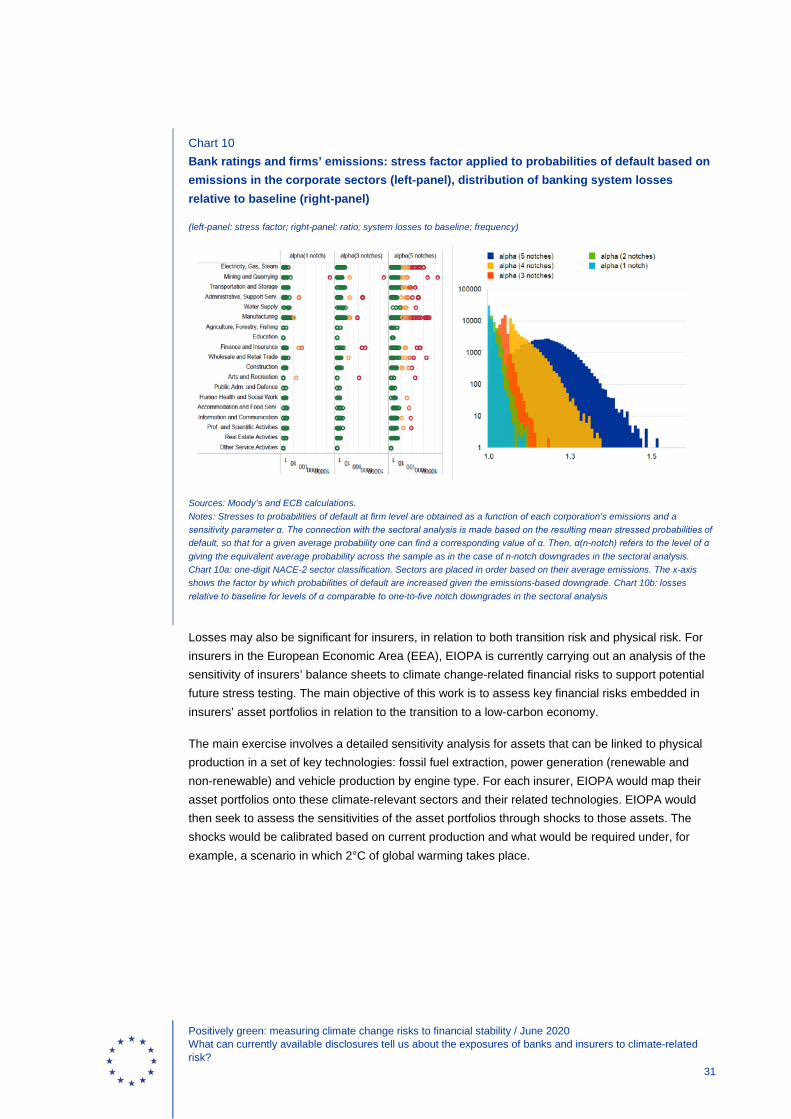
Losses may also be significant for insurers, in relation to both transition risk and physical risk. For insurers in the European Economic Area (EEA), EIOPA is currently carrying out an analysis of the sensitivity of insurers’ balance sheets to climate change-related financial risks to support potential future stress testing. The main objective of this work is to assess key financial risks embedded in insurers’ asset portfolios in relation to the transition to a low-carbon economy.
The main exercise involves a detailed sensitivity analysis for assets that can be linked to physical production in a set of key technologies: fossil fuel extraction, power generation (renewable and non-renewable) and vehicle production by engine type. For each insurer, EIOPA would map their asset portfolios onto these climate-relevant sectors and their related technologies. EIOPA would then seek to assess the sensitivities of the asset portfolios through shocks to those assets. The shocks would be calibrated based on current production and what would be required under, for example, a scenario in which 2°C of global warming takes place.
Positively green: measuring climate change risks to financial stability / June 2020 What can currently available disclosures tell us about the exposures of banks and insurers to climate-related risk? 32
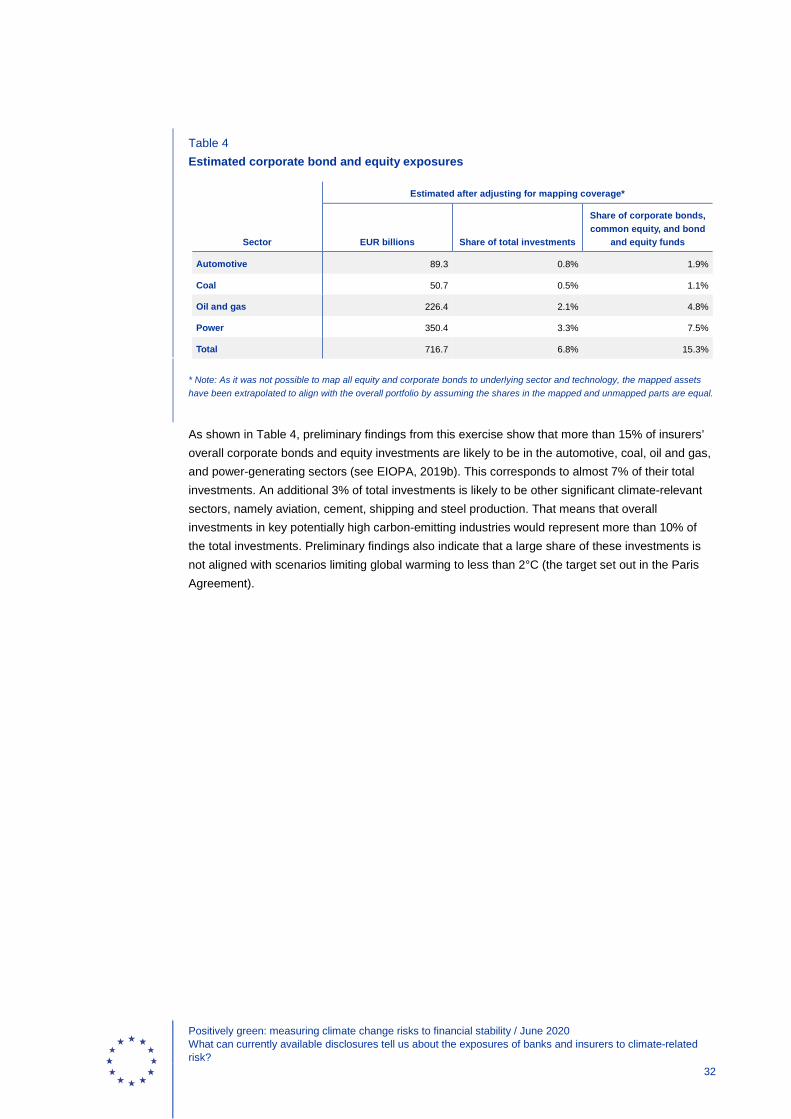
Table 4 Estimated corporate bond and equity exposures
Sector
Estimated after adjusting for mapping coverage*
EUR billions Share of total investments
Share of corporate bonds, common equity, and bond
and equity funds
Automotive 89.3 0.8% 1.9%
Coal 50.7 0.5% 1.1%
Oil and gas 226.4 2.1% 4.8%
Power 350.4 3.3% 7.5%
Total 716.7 6.8% 15.3%
* Note: As it was not possible to map all equity and corporate bonds to underlying sector and technology, the mapped assets have been extrapolated to align with the overall portfolio by assuming the shares in the mapped and unmapped parts are equal.
As shown in Table 4, preliminary findings from this exercise show that more than 15% of insurers’ overall corporate bonds and equity investments are likely to be in the automotive, coal, oil and gas, and power-generating sectors (see EIOPA, 2019b). This corresponds to almost 7% of their total investments. An additional 3% of total investments is likely to be other significant climate-relevant sectors, namely aviation, cement, shipping and steel production. That means that overall investments in key potentially high carbon-emitting industries would represent more than 10% of the total investments. Preliminary findings also indicate that a large share of these investments is not aligned with scenarios limiting global warming to less than 2°C (the target set out in the Paris Agreement).

Positively green: measuring climate change risks to financial stability / June 2020 What can we learn from forward-looking scenario analysis based on existing information and methods? 33
This section describes two interrelated exploratory scenario analyses, focusing on transition risks for the EU banking and insurance financial sectors. Although they are based on state-of-the-art macro-financial models that are currently available, the exercise remains exploratory at this stage – noting that it is not exhaustive in terms of scope, transmission channels or data coverage. However, it does constitute a foundational methodological step towards an eventual more comprehensive stress test for climate-related risks.
The exploratory scenario analysis is based on the transition risk stress test framework developed by De Nederlandsche Bank (DNB) for banks and insurance companies, and combines this with the banking model of the ECB. Figure 3 shows the different steps in the DNB approach.14 The outputs provide instantaneous losses for market risk and inputs for the ECB model to project credit risk losses.
Figure 3 Steps of scenario design
First, the exploratory scenario analysis rests on two severe tail scenarios: the first emphasises the risks of an abrupt policy response in order to meet the goals set in the Paris Agreement, and the second anticipates rapid adaptation to asymmetric technological innovation.15 The abrupt policy response scenario considers the case in which the policies aimed at achieving the goals set out in the Paris Agreement are deferred. Policies that reduce CO2 emissions and ultimately limit the increase in global temperature to below 2°C above pre-industrial levels are introduced in a disorderly manner. This late implementation of policies necessitates abrupt adjustments, which leave the private sector, and subsequently the financial sector, with insufficient time to accommodate changes. The second scenario, which considers an asymmetric technology shock, looks at what could happen in the event of a positive breakthrough in energy storage technology. As the breakthrough is unforeseen, it becomes a source of disruption for the economy and the 14 For more details on the DNB transition risk stress test framework, please consult Vermeulen et al. (2018). 15 Both scenarios stem from the energy transition risk stress test by Vermeulen et al. (2018).
Scenarionarrative
Macroeconomicscenario
Sector-levelscenario
Banking model inputs
Severe tail events:
• Delayed policy scenario• Assymetric technological
innovation
Simulation of macro-financial variables using NiGEM
Distribution of macro-financial effects across 56 industries based on their embodied carbon emissions (TVFs factors)
4 What can we learn from forward-looking scenario analysis based on existing information and methods?

Positively green: measuring climate change risks to financial stability / June 2020 What can we learn from forward-looking scenario analysis based on existing information and methods? 34
financial sector, resulting in a precipitous redistribution of resources across sectors, defaults and write-offs of carbon-intensive assets. Both scenarios are considered against a baseline scenario consisting of inherently non-disruptive policies. At the same time, the scenarios embed an assumed endogenous monetary policy response (in the form of short-term rates) to inflation shocks.16
Second, the macroeconomic calibrations of the two scenarios are derived from the multi-country model NiGEM, which provides detailed information about the evolution of macro-financial variables at country level. Chart 11 presents the impact of the scenarios on the real economy in terms of the level of euro area GDP compared with that in the baseline. Light blue bars correspond to the abrupt policy response and dark blue bars to the technological innovation shock scenario. In the abrupt policy response scenario, it is assumed that an abrupt policy change aimed at mitigating climate change translates into a sudden and sharp increase in the carbon price by USD 100 per tonne at the global level.17 An abrupt increase in energy prices leads to a sharp devaluation of trading assets, reflected in the drop of stock and bond prices, and the deterioration of economic conditions for the entire five-year horizon. In the shorter-run two-year horizon, euro area output would drop by almost 2.5% below its baseline level. Beyond this horizon, the level of output would gradually recover, signifying that the costs of sharply introducing climate-mitigating fiscal policies can be pronounced but also transitory.
Chart 11 The effect of the abrupt policy response and asymmetric technological innovation shock scenarios on euro area GDP
(y-axis: deviation from the baseline; left-hand panel: percentages; middle panel: percentage points; right-hand panel: percentages)
Source: DNB and ECB calculations.
16 Beyond the three-year horizon of the ECB forecast, the European economies are assumed to gradually converge towards
their long-run average growth and inflation rates. 17 For the purposes of simplicity, the rise in the global average carbon price, modelled in the scenario analysis in this report as
a quota, which is currently estimated to be around USD 2/tonne (see IMF, 2019a), is assumed to be revenue-neutral and to therefore not result in fiscal windfalls.
-1.5
-1.0
-0.5
0.0
0.5
1.0
1.5
Q22020
Q22021
Q22022
Q22023
Q22024
b) Euro area average 10-year bond yield
-20
-15
-10
-5
0
5
10
15
20
Q22020
Q22021
Q22022
Q22023
Q22024
c) Euro area stock market index
-3
-2
-1
0
1
2
3
Q22020
Q22021
Q22022
Q22023
Q22024
a) Euro area GDP
Delayed policy scenarioTechnology scenario

Positively green: measuring climate change risks to financial stability / June 2020 What can we learn from forward-looking scenario analysis based on existing information and methods? 35
In the technological innovation shock scenario, the technological breakthrough would allow the share of renewable energy to double over a five-year period. This asymmetric technology shock leads to a temporary economic slowdown driven by old-technology industries, but new technology supports economic growth (see Rockström et al., 2017). In the short term, the impact on GDP would be limited and would be followed by an improvement in economic conditions towards the end of the scenario horizon.
Third, not all industries are equally vulnerable to the stressed economic conditions in the two scenarios. The heterogeneous reactions of 56 industrial sectors are substantiated by calculating transition vulnerability factors (TVFs) that are determined by industries’ carbon footprints. The TVFs are a means of assessing the probability of asset revaluations for industries likely to be affected by climate risk mitigation transition policies – not only for bonds and equities, but also for corporate loans (based on a DNB questionnaire to selected Dutch banks). Notably, they take into account not only an industry’s own emissions, but also the emissions of the supply firms throughout the production chain.18
Chart 12 summarises the TVFs used in the two climate risk-oriented scenarios for NACE-2 sectors.19 Two observations are in order. First, the two sets of TVFs differ. The sectors most affected by the abrupt policy adjustment (electricity, gas and steam production) are not the same as those that are worst hit by asymmetric technological change (mining and quarrying, and a share of manufacturing). Second, the charts reveal substantial heterogeneity of TVFs within the manufacturing, and transportation and storage sectors.
18 Compared with the binary measures often used (green versus brown industry), the TVFs capture a more granular
distribution of sensitivities across 56 sectors. 19 “NACE” is derived from the French title “Nomenclature générale des Activités économiques dans les Communautés
Européennes” and is the statistical classification of economic activities in the European Communities.

Positively green: measuring climate change risks to financial stability / June 2020 What can we learn from forward-looking scenario analysis based on existing information and methods? 36
Chart 12 Transition vulnerability factors in two climate risk scenarios
a) TVFs in abrupt policy shock scenario
b) TVFs in the technological innovation shock scenario
Sources: DNB and ECB calculations based on input-output tables and carbon emissions data.
Chart 13 plots the effective TVFs of individual banks for both their trading book exposures (Chart 13a) and their banking book large exposures (Chart 13b). Both charts suggest that, while the majority of banks are only moderately affected by both scenarios, there is a relatively small share of banks which are heavily exposed to scenario risks (marked by dots).
0
2
4
6
8
10
12
14
16
NACE level-2 sectors
TVFs
Electricity/gas/steamTransportation and storageManufacturingWater supply/waste managementConstructionMining and quarryingAgricultureProfessional, scientific, technical activitiesPublic administration and defence
Wholesale and retail tradeAdministrative and support service activitiesInformation and communicationOther service activitiesActivities of households as employersEducationAccommodation/food service activitiesReal estate activities

Positively green: measuring climate change risks to financial stability / June 2020 What can we learn from forward-looking scenario analysis based on existing information and methods? 37
Chart 13a Effective bank-level TVFs for trading book exposures and banking book large exposures: Trading book securities-holding statistics exposure-weighted TVFs by bank
Sources: DNB and ECB calculations based on SHS-G data, input-output tables and emissions data. Notes: Effective TFVs by bank in their trading and banking books. The boxplots report the 10th, 25th, 50th, 75th and 90th percentiles of the obtained distributions (from bottom to top).
Chart 13b Effective bank-level TVFs for trading book exposures and banking book large exposures: Banking book large exposure-weighted TVFs by bank
Sources: DNB and ECB calculations based on SHS-G data, input-output tables and emissions data. Notes: Effective TFVs by bank in their trading and banking books. The boxplots report the 10th, 25th, 50th, 75th and 90th percentiles of the obtained distributions (from bottom to top).

Positively green: measuring climate change risks to financial stability / June 2020 What can we learn from forward-looking scenario analysis based on existing information and methods? 38
Fourth, the NiGEM forecast of stock price indices and government bond yields is then translated into industry-specific equity and bond returns. To derive equity returns and bond yields by industry, the aggregate equity and bond price losses incurred in a given scenario are transposed onto the sectoral level through the TVFs. Figure 4 summarises the steps that follow the approach of the DNB.
Next, the exploratory scenario analysis employs the ECB’s banking sector euro area stress test (BEAST) banking model.20 This is a large-scale, semi-structural model that links macro-level and bank-level data. Banks’ balance sheets and profit and loss accounts are modelled at a high level of granularity, distinguishing between bank loans to the public sector, financial sector and three subsectors of the non-financial sector, namely non-financial enterprises, households for house purchase and other purposes. It also keeps track of the geography of exposures to the non-financial private sector. In the model, macro-financial scenarios affect the quality of assets in the banking book, loan-loss provisioning and credit risk capital charges. The model captures the effect of the scenarios on bank-level parameters such as point-in-time and regulatory probability of default or loss given default. These parameters influence bank profitability and risk-weighted amounts respectively.
A feature of the standard ECB stress test framework is that it takes into account endogenous reactions of banks to modelled stress. In particular, banks react to the deterioration (or improvement) in the economic situation by adjusting their volumes of lending and interest rates on loans and deposits. In addition, they can change their profit distribution policies. Furthermore, the framework takes into account two amplification mechanisms. First, if a bank’s own funds decline (for example, as a result of having to absorb credit losses) and leverage increases, the costs of wholesale funding and (at least initially) also the demand for debt funding will increase. In turn, this has a negative effect on banks’ profitability, further aggravating banks’ solvency. Second, the model acknowledges interactions between banks and the real economy. The adverse feedback loop between the banking sector and the real economy may materialise as a result of changes in the volume and cost of aggregate credit that banks supply to the real economy. This feedback loop can further aggravate the adversity of the macroeconomic outcomes. The working of the dynamic balance sheet and the feedback loop between the banking sector and the real economy is illustrated in Figure 4 below.
20 For more details about the banking model and the design of a macroprudential stress test, see Budnik et al. (2019).

Positively green: measuring climate change risks to financial stability / June 2020 What can we learn from forward-looking scenario analysis based on existing information and methods? 39
Figure 4 Schematic representation of the feedback loop between the banking sector and the real economy
The banking sector exploratory scenario analysis is applied to the 91 largest euro area credit institutions and involves two direct transmission channels: credit risk and market risk. The propagation of transition scenarios into banks’ banking and trading books depends on a sectoral breakdown of their exposures. The exact calibration of model parameters and shocks that ensures sector-specific pass-through of the scenarios is summarised in Table 5.
Macroeconomic and financial shocks
Economic conditions and last period bank-level
outcomes
Deterioration of banks’ balance sheets
Reaction of banks: deleveraging, profit
accumulation, interest rates, liability structure
(Excessive) deleveraging triggers adverse credit
supply shock

Positively green: measuring climate change risks to financial stability / June 2020 What can we learn from forward-looking scenario analysis based on existing information and methods? 40
Table 5 Summary of the calibration of credit and market risk channels
Credit risk Market risk
Banks: 91 largest euro area credit institutions
Banks’ loan exposures to the corporate sector are split between loans covered by large exposure statistics and other. NACE-2 level sectoral breakdown of former exposures is recovered from the large exposure statistics. For loans covered by large exposure statistics, the sensitivity of probability of default (PDs) and loss given default (LGD) of corporate exposures is proportional to the portfolio-specific TVF. For the remaining loans, an implicit assumption is made that their carbon-intensity is representative for the corporate sector in a country of exposure.
NACE-2 level sectoral breakdown of banks’ holdings of equities and bonds in trading books is recovered from instrument-level information in securities holding statistics (SHS).21 Price impact for sector-representative stocks is then mapped onto the revaluation losses of individual banks. Revaluation losses are included as an exogenous variable in model simulation.
Insurers: 100 EU insurance groups
The NACE-2 level sectoral breakdown of insurance assets is recovered using Solvency II data. Price impact for sector-representative stocks and bonds is derived from aggregate stock and bond prices using TVFs. The derived price impact is then mapped onto the revaluation losses of individual insurers.
The initial effect on the solvency of the banking sector will derive from mark-to-market losses, credit losses in the banking book and an increase in credit risk capital charges. Credit losses and risk capital charges are calculated along with endogenous formulas for probability of default or loss given default in the model and evolve in line with scenario variables and assumptions in Table 5. The final effect will integrate the outcomes of bank reactions such as deleveraging and potential second-round impact of these actions on the broader economy.
An analogous exploratory scenario analysis for the insurance sector is applied to 100 EU insurance companies, which is static and involves only the market risk channel. The main features of this exercise are summarised in Table 6 below, distinguishing between the banking and insurance sectors.
21 The overall securities holdings for the analysed set of banks amount to approximately €4.6 trillion, and the total assets of
the insurance groups correspond to approximately €5.6 trillion.

Positively green: measuring climate change risks to financial stability / June 2020 What can we learn from forward-looking scenario analysis based on existing information and methods? 41
Table 6 Main features of the scenario analysis
For banks For insurers
Climate-related risks assessed
Transition risk Transition risk
Economic and/or financial risks assessed
Credit risk, market risk Market risk
Time horizon Five years Immediate impact
Feedback between economic and financial conditions
Yes No
Sectoral granularity for economic/financial variables
Industry-level breakdown for securities Industry-level breakdown for loans covered by the large exposure statistics, sector-level for remaining loans
Industry-level breakdown for securities
Geographic coverage All euro area countries All EU countries
Focus variables CET1 ratio, lending to non-financial private sector
Devaluation effects (by sectors of exposure)
Data frequency for future updates
Quarterly for market impact (based on SHS-G) Bi-annual for feedback loop (based on stress test template)
Quarterly (based on Solvency II data)
Results suggest that mark-to-market losses for the banking sector amount to 0.6% of CET1 capital on average in the abrupt policy response scenario and half of this impact for the technology innovation shock scenario.22 Chart 14a shows the average and the distribution of the immediate mark-to-market losses for the banking sector. Chart 14b reports the overall mark-to-market losses obtained when applying the methodology to the insurance sector. For insurers, the chart distinguishes between impact on corporate bonds, equity and government bonds. The results show that the biggest impact on insurance portfolios derives from equities, for which the average losses amount to approximately 3.5%, while for corporate and government bonds losses are quite limited not only in median terms but also to extreme cases. Considering the entire mapped portfolios of the 100 insurance groups included in the sample, average losses stay well below 1%.
22 These estimates do not account for duration effect. Including the duration effect would result in an increase in losses to
around 4% on average under the abrupt policy response scenario and around 1% under the rapid technological change scenario. However, banks often hedge interest rate risk and the inclusion of duration effect could have produced misleading results.

Positively green: measuring climate change risks to financial stability / June 2020 What can we learn from forward-looking scenario analysis based on existing information and methods? 42
Chart 14a Mark to market losses for the banking sector and insurance sectors: Banking sector
Sources: DNB and ECB calculations based on SHS-G data and NiGEM outputs. Notes: Mark-to-market losses excluding duration effects obtained in case of an abrupt policy response shock (left boxplot) and a technology shock (right boxplot) applied to the euro area banking sector. The boxplots report the 10th, 25th, 50th, 75th and 90th percentiles of the obtained loss distributions (from bottom to top).
Chart 14b Mark to market losses for the banking sector and insurance sectors: Insurance sector
Sources: DNB and EIOPA calculations based on Solvency II data and NiGEM outputs. Notes: Losses obtained in case of an abrupt policy response shock and a technology shock applied to the EU insurance sector. The first two boxplots refer to the impact on corporate bonds, the second one to the impact on equity, the third one to the impact on government bonds and the last ones to the overall impact on the mapped portfolios. The boxplots report the 10th, 25th, 50th, 75th and 90th percentiles of the obtained loss distributions (from bottom to top).
The overall impact of the two climate risk-related scenarios on the banking sector is assessed by looking at their solvency rates, as measured by CET1 ratios. Chart 15 displays the impact on CET1 ratios: in particular, the left-hand panel reports deviations in the CET1 ratio with respect to the baseline scenario, both in the event of an abrupt policy response shock (light blue bar) and of an asymmetric technological innovation shock (dark blue bar), with a five-year horizon. The CET1 ratio
-1.2%
-1.0%
-0.8%
-0.6%
-0.4%
-0.2%
0.0%
Policy Technology
-8%
-7%
-6%
-5%
-4%
-3%
-2%
-1%
0%
Policy Tech Policy Tech Policy Tech Policy Tech
Corporate bonds Equity Government bonds Total Mapped Portfolio
Q2 2019

Positively green: measuring climate change risks to financial stability / June 2020 What can we learn from forward-looking scenario analysis based on existing information and methods? 43
of euro area banks would drop by 0.8 percentage points in the second year following an overdue and disorderly catching-up of climate protection policies. This effect gradually fades and halves at the end of the five-year horizon. The technology shock leads to a short-lasting and shallow reduction in the CET1 ratio of less than 0.2 percentage points in the first two years of the horizon. At the end of the scenario horizon, banks’ solvency rates are actually higher by 0.2 percentage points than in the baseline.23
Chart 15 The effect of the abrupt policy response and asymmetric technological innovation shock scenarios on system-wide CET1 ratios and loans to the non-financial private sector
(y-axis: deviation from the baseline; left-hand panel: percentage points; right-hand panel: percentages)
Source: DNB and ECB calculations based on NiGEM outputs, SHS-G data and 2017 stress test templates. Notes: In the left-hand panel, deviations in average CET1 ratios with respect to the baseline scenario in case of an abrupt policy response scenario (light blue bar) and a technological innovation shock scenario (dark blue bar); deviations in the average bank lending to the non-financial corporate sector with respect to the baseline scenario in case of an abrupt policy response shock (light blue bar) and a technological innovation shock (dark blue bar).
Another metric that provides information on the economy-wide effects of climate-related scenarios is the expected reduction in lending to the non-financial private sector. Chart 15 reports that following the abrupt policy response shock, lending in real terms contracts by approximately 5% compared with the baseline scenario in the first year of the scenario. The reduction in lending gradually vanishes and amounts to only 1.5% difference compared with the baseline at the end of the five-year horizon. Most of the fall in lending relates to the weakening of credit demand related to the temporary economic slowdown ingrained in the scenario. The scenario is too benign to trigger significant second-round effects between the financial sector and the real economy.
There is no deterioration in lending conditions under the asymmetric technological innovation shock scenario. A technological breakthrough is most likely to trigger a reallocation of banks’ portfolios
23 While assessing the solvency effect of both scenarios, it is worth considering that they are likely to add to any solvency
effects resulting from, for example, adverse economic conditions or parallel supervisory policies.
-0.8
-0.6
-0.4
-0.2
0.0
0.2
0.4
0.6
0.8
Q2 2020 Q2 2021 Q2 2022 Q2 2023 Q2 2024
a) CET1 ratio
-6
-4
-2
0
2
4
6
Q2 2020 Q2 2021 Q2 2022 Q2 2023 Q2 2024
b) Loans to the non-financial private sector in real terms
Abrupt policy response scenarioTechnological innovation shock scenario

Positively green: measuring climate change risks to financial stability / June 2020 What can we learn from forward-looking scenario analysis based on existing information and methods? 44
rather than an overall reduction in bank lending. Additionally, in this scenario, the feedback loop between the banking sector and the real economy hardly plays any role.
The above exploratory scenario analysis shows that existing stress-testing technologies and supervisory datasets can serve as useful starting points to develop a forward-looking assessment of climate-related risks, even if caution is needed in interpreting such results. At the same time, the scenario analysis exposes the core weaknesses and gaps in detail that should guide future work. A first challenge relates to limited supervisory reporting of the carbon-intensity of financial institutions’ exposures. As things stand, under FINREP reporting in the EEA, banks are asked to report loans by NACE-1 sector and with no country disaggregation. When conducting the scenario analysis, sectoral banks’ exposures have been broken down using detailed information in other datasets such as the SHS and large exposure data. Going forward, similar exercises can be conducted exploring more detailed credit registers (for example, the upcoming Anacredit dataset). Nevertheless, in order to substantially improve the quality of scenario analysis (and eventual stress test exercises), policy initiatives expanding supervisory reporting or pushing for ad hoc information collection exercises would be required.
The second challenge relates to the need for better tailored models. This concerns both models applied to develop relevant scenarios and models of asset quality. Regarding the former, there is a need to consider scenario horizons reaching beyond the five years assumed in this exercise with a substantial sector level detail. In addition, scenarios should be better linked to climate outcomes and aligned with pledges or targets. The upcoming work of Bank de France (Allen et al, 2020) makes an important step in this direction by developing scenarios up to 30 years ahead, aligned with the NGFS high-level reference scenarios. Building on the DNB approach, it proposes a suite of models to quantity the economic and financial impacts of a number of transition scenarios at the sectoral level. Regarding the modelling of asset quality, firm-level or region-level datasets can be further explored to link asset quality with variables correlating with climate risks, and potentially capture differing sensitivities of “greener” and “browner” assets in banks’ balance sheets.24 In this respect, there is a need to more comprehensively capture the differing evolution of lending to “greener” and “browner” sectors. In terms of transmission channels, further work is needed to map the scenarios into bank lending to “greener” and “browner” sectors and improve the assessment of the evolution of operational risk (in order to capture business, legal and underwriting aspects of climate related and environmental risks).
Future research should also target physical risks. It is more straightforward to align models of transition risks with existing infrastructure and the accumulated knowledge of central banks. However, in the case of climate, it is arguably even more important to assess the costs of policy inaction in terms of increased severity of physical risks.
24 The work of Allen et al (2020) makes a step also in this direction by employing firm-level information to project probability of
defaults at sectoral level for each simulated transition scenarios.

Positively green: measuring climate change risks to financial stability / June 2020 Conclusions, open issues and proposed way forward 45
This report looked in detail at quantitative perspectives on climate-related risks to financial stability for the euro area and the EU, leveraging available information and existing models. It proposed foundations for the risk monitoring that is required, as well as initial elements underpinning a pilot risk assessment framework for banks and insurers. In doing so, it presented measurement where possible – noting in particular a limited granular coverage of loans for banks. Mindful of the limitations of both available data and models, the report also detailed where further work is needed to develop better measurement, enabling a more complete evaluation of the risks associated with climate change.
Four findings emerge from the report. First, costs associated with climate change appear inevitable. There will either be physical costs resulting from an insufficiency (or lack of timeliness) of mitigating action, or transition costs from stringent action – or both. A second finding is that, to date financial markets only price this risk in a limited way. Notwithstanding data which are incomplete, inconsistent and insufficient, green capacity is building rapidly in bond, equity and emissions trading. A third finding concerns direct exposures of European financial institutions to CO2-intensive sectors, drawing on currently available supervisory reporting of large exposures of banks. Direct exposures appear to be limited and falling moderately on average, but with tail risk in the form of concentrated exposures in a few sectors and firms. A fourth finding stems from forward-looking exploratory scenario analysis that builds on the methodology developed by the DNB and in the ECB’s BEAST model. The analysis of the transition risk scenarios suggests that the costs to the economic or banking sector of even a sharp rise in carbon pricing or marked industrial shifts over a five-year timeframe are likely to be contained, and lower than for the potential losses due to physical risks resulting from climate change. Taken together, all four of these elements, beyond the initial quantification of climate risk for the euro area financial sector, also clarify data gaps and deepen knowledge about the relevant transmission channels that warrant further attention for modelling purposes.
While this report contains many new findings, it also raises more refined questions that can help to steer further work on addressing gaps in knowledge, notably data gaps and methodological investments. Both are needed to provide a solid foundation for potential evidence-based policy reflections. With regard to data gaps, both financial and non-financial reporting remain incomplete. Financial sector exposures and vulnerabilities to climate change currently involve an eclectic collection of existing supervisory data, market data sources and other data available to ATC/FSC members. Once more comprehensive granular data are available, the opportunities created as a result, for example from credit registers, should be explored. Climate risk measurement could also be improved. Additional data collections may be needed to supplement existing firm disclosures, which are patchy and at times heterogeneous. With regard to methodological investments, more climate-specific modelling (including long-term stress testing for banks and insurers) is needed. This would involve devising models with a larger scope (stronger inclusion of physical risk) and longer horizons (beyond the five-year horizon considered in this report). Moreover, the baseline
5 Conclusions, open issues and proposed way forward

Positively green: measuring climate change risks to financial stability / June 2020 Conclusions, open issues and proposed way forward 46
long-term projection would need to be more clearly linked to meeting EU environmental goals in an orderly manner.25 Ultimately, analysis of systemic risks from climate change should provide the foundations for evidence-based macroprudential policy reflections. As a minimum, further work is needed to better frame disclosure needs to help address informational market failures associated with climate change risk, thereby providing a basis for effectively addressing the allocative market failures associated with climate change.
25 This could, for instance, be the “EU Carbon Neutral Scenario”, shaped on the ambitions declared in the European strategic
long-term vision and more recently reasserted in the European green deal – see European Commission (2018 and 2019).

Positively green: measuring climate change risks to financial stability / June 2020 References 47
Acemoglu, D., Aghion, P., Bursztyn, L. and Hemous, D. (2012), “The environment and directed technical change”, American Economic Review, Vol. 102(1), pp. 131-66.
Abel, G.J., Brottrager, M., Crespo Cuaresma, J., and Muttarak, R. (2019), “Climate, Conflict and Forced Migration”, Global Environmental Change, No 54, January, pp. 239-49.
Albouy, D., Graf, W., Kellogg, R., and Wolff, H. (2013), “Climate Amenities, Climate Change, and American Quality of Life”, Working Paper, No 18925, National Bureau of Economic Research.
Alessi, L., Ossola, E. and Panzica, R. (2019), “The Greenium matters: evidence on the pricing of climate risk”, JRC Working Papers in Economics and Finance, No 2019/12.
Allen, T., Dees, S., Boissinot, J., Caicedo Graciano, M., Chouard, V., Clerc, L., and Vernet, L. (2020), “Climate-related scenarios for financial stability assessment: An application to France”, Banque de France Working paper, forthcoming.
Alok, S., Kumar, N. and Wermers, R. (2020), “Do fund managers misestimate climatic disaster risk” Review of Financial Studies, Vol. 33(3), pp. 1146-1183.
Auffhammer, M. (2018), “Quantifying Economic Damages from Climate Change”, Journal of Economic Perspectives, Vol. 32, No 4, pp. 33-52.
Bachelet, M.J., Becchetti, L. and Manfredonia, S. (2019), “The Green Bonds Premium Puzzle: The Role of Issuer Characteristics and Third-Party Verification”, Sustainability, Vol. 11(4), p. 1098.
Barth, F., Hübel, B. and Scholz, H. (2019), “ESG and Corporate Credit Spreads: Evidence from Europe”, SSRN.
Batten, S. (2018), “Climate change and the macro-economy: a critical review”, Staff Working Paper, Bank of England, No 706.
Batten, S., Sowerbutts, R. and Tanaka, M. (2016), “Let’s talk about the weather: the impact of climate change on central banks”. Staff Working Paper, Bank of England, No 603.
Battiston, S. (2019), “The Importance of Being Forward‐looking: Managing Financial Stability in the Face of Climate Risk”, Financial Stability Review, Banque de France, No 23, pp. 39-48.
Battiston, S., Mandel, A., Monasterolo, I., Schütze, F. and Visentin, G. (2017), “A climate stress-test of the financial system”, Nature Climate Change, Vol. 7(4), pp. 283-290.
Battiston, S., Mandel, A. and Monasterolo, I. (2018), “A carbon risk assessment of central banks’ portfolios under 2°C aligned climate scenarios”, working paper prepared for the NGFS workshop “Scaling up green finance: what role for central banks”, Deutsche Bundesbank, 8 November 2018.
Battiston, S. and Monasterolo, I. (2019), “A climate risk assessment of sovereign bonds”, Mimeo, March.
References

Positively green: measuring climate change risks to financial stability / June 2020 References 48
Belloni, M., Mingarelli, L., Moyà Porcel, R. and Radulova, P. (2020), “Euro area banks’ sensitivity to corporate decarbonisation”, Financial Stability Review, Box 3, European Central Bank, Frankfurt am Main, May.
Bolton, P. and Kacperczyk, M.T. (2020), “Do Investors Care about Carbon Risk?”, Columbia Business School Research Paper, forthcoming.
Bolton, P., Despres, M., Pereira da Silva, L. and Svartzman, R. (2020), “The green swan: Central banking and financial stability in the age of climate change”, BIS/Banque de France, January.
Bordo, M., Dueker, M.J. and Wheelock, D.C. (2001), “Aggregate Price Shocks and Financial instability: a Historical Analysis”, Working Paper, FRB of Saint Louis, No 2000-005B.
Budnik, K., Balatti Mozzanica, M., Dimitrov, I., Groß, J., Hansen, I., di Iasio, G., Kleemann, M., Sanna, F., Sarychev, A., Siņenko, N. and Volk, M. (2019), “Macroprudential stress test of the euro area banking system”, Occasional Paper Series, No 226, ECB, Frankfurt am Main, July.
Bunten, D. and Matthew, E.K. (2014), “The Impact of Emerging Climate Risks on Urban Real Estate Price Dynamics”, Working Paper Series, National Bureau of Economic Research, No 20018, pp. 1-21.
Burke, M., Hsiang, S.M. and Miguel, E. (2015), “Global non-linear effect of temperature on economic production”, Nature, Vol. 527(7577), p. 235.
Cahen-Fourot, Louison, Emanuele Campiglio, Elena Dawkins, Godin, A. and Kemp-Benedict, E. (2019a), “Looking for the Inverted Pyramid: An Application Using Input-Output Networks”. Ecological Economics, Vol. 169, March.
Campiglio, E., Dafermos, Y., Monnin, P., Ryan-Collins J., Schotten G. and Tanaka, M. (2018), “Climate change challenges for central banks and financial regulators”, Nature Climate Change, Vol. 8, pp. 462-468.
Cahen-Fourot, L., Campiglio, E., Dawkins, E., Godin, A. and Kemp-Benedict, E. (2019), “Capital stranding cascades: the impact of decarbonisation on productive asset utilisation”, WU Working Paper Series, No 18/2019.
Ciscar, J.C., Feyen, L., Ibarreta D. and Soria A. (eds) (2018), “Climate Impacts in Europe: Final report of the JRC PESETA III project”, Publications Office of the European Union, Luxembourg.
CISL – Kelly, S. and Reynolds, J. (2016), “Unhedgeable risk: How climate change sentiment impacts investment. Central Banking, Climate Change and Environmental Sustainability”, University of Cambridge Institute for Sustainability Leadership (CISL).
De Greiff, K., Ehlers, T. and Packer, F. (2018), “The Pricing and Term Structure of Environmental Risk in Syndicated Loans, Bank for International Settlements.
De Haas, R. and Popov, A.A. (2019)c “Finance and carbon emissions”, Working Paper Series, No 2318, European Central Bank, September.

Positively green: measuring climate change risks to financial stability / June 2020 References 49
Delis, M.D., de Greiff, K. and Ongena, S. (2018), “Being Stranded on the Carbon Bubble? Climate Policy Risk and the Pricing of Bank Loans”, SSRN Electronic Journal.
Dietz, S., Bowen A., Dixon, C. and Gradwell, P. (2016), Climate value at risk of global financial assets. Nature Climate Change, Vol. 6, pp. 676-689.
EIOPA (2019a), Financial Stability Report, December.
EIOPA (2019b), “Insurance sector climate-related transition risks”, Discussion Paper, December.
Engle, R. F., Giglio, S., Kelly, B., Lee, H. and Stroebel, J. (2020), “Hedging climate change news”, The Review of Financial Studies, Vol. 33(3), pp. 1184-1216.
European Central Bank (2019a), Financial Stability Review, Frankfurt am Main, May.
European Central Bank (2019b), Financial Stability Review, Frankfurt am Main, November.
European Central Bank (2018), Economic Bulletin, Frankfurt am Main, November.
European Commission (2018), “A Clean Planet for all – a European strategic long-term vision for a prosperous, modern, competitive and climate neutral economy”, COM (2018) 773.
European Commission (2019), “The European Green Deal”, COM (2019) 640.
European Environment Agency (2017), “Climate change impacts and vulnerabilities 2016”,
European Banking Authority (2019), “Action plan on sustainable finance”, December.
ESRB, (2016), “Too Late, Too Sudden: Transition to a Low-Carbon Economy and Systemic Risk”, ESRB Reports of the Advisory Scientific Committee, No 6, February.
Faiella, I. and Natoli, F. (2018), “Natural catastrophes and bank lending: the case of flood risk in Italy”, Occasional Paper, No 457, Banca d’Italia.
Fankhauser, S. and Tol, R. (2005), “On Climate Change and Economic Growth”, Resource and Energy Economics, Vol. 27 (1), pp. 1-17.
Fender, I., McMorrow, M., Sahakyan, V. and Zulaica, O (2019), “Green bonds: the reserve management perspective”, Quarterly Review, Bank for International Settlements, September.
Finansinspektionen – Bowen, A. and Dietz, S. (2016), “The effects of climate change on financial stability, with particular reference to Sweden”, A report for Finansinspektionen. Accessed online on 3 June 2019.
Gassebner, M., Keck, A. and the, R., (2010), “Shaken, Not Stirred: The Impact of Disasters on International Trade”, Review of International Economics, Vol. 18(2), pp. 351-68.
German Ministry of Finance (2016), “Climate change and financial markets”, accessed online on 3 June 2019.

Positively green: measuring climate change risks to financial stability / June 2020 References 50
Giglio, S., Maggiori, M., Stroebel, J. and Weber, A. (2015), “Climate change and long-run discount rates: Evidence from real estate”, No w21767, National Bureau of Economic Research.
Gillingham, K. and Stock, J. (2019), “The cost of reducing greenhouse gas emissions”, Journal of Economic Perspectives, Vol. 32(4), pp. 53-72.
Giuzio, M, Krusec, D., Levels, A., Melo, A.S., Mikkonen, K. and Radulova, P, “Climate change and financial stability”, Financial Stability Review, European Central Bank, Frankfurt am Main, May.
Gros, D., Lane, P.R., Langfield, S., Matikainen, S., Pagano, M., Schoenmaker, D. and Suarez, J. (2016), “Too late, too sudden: Transition to a low-carbon economy and systemic risk”, No 6, Reports of the Advisory Scientific Committee.
The Guardian (2019), “Revealed: the 20 firms behind a third of all carbon emissions”, 9 October.
Guin, B. and Korhonen, P. (2020), “Does energy efficiency predict mortgage performance?”, Working paper, No 852, Bank of England.
Hallegatte, S. (2009), “Strategies to Adapt to an Uncertain Climate Change”, Global Environmental Change, Vol. 19(2), pp. 240-247.
Heede, R. (2014), “Tracing anthropogenic carbon dioxide and methane emissions to fossil fuel and cement producers, 1854-2010”, Climatic Change, Vol. 122, pp. 229-241, (see also Climate Accountability Institute).
Hsiang S. and Kopp, R. (2018), “An Economist’s Guide to Climate Change Science”, Journal of Economic Perspectives, Vol. 32(4), pp. 3-32.
Hsiang, S., Kopp, R., Jina, A., Rising, J., Delgado, M., Mohan, S., Rasmussen, D.J., Muir-Wood, R., Wilson, P., Oppenheimer, M. and Larsen, K. (2017), “Estimating economic damage from climate change in the United States”, Science, Vol. 356(6345), pp. 1362-1369.
International Capital Market Association (2018), “Green bond principles”.
IHS Markit (2015), “Deflating the ‘Carbon Bubble’”.
Ilhan, E., Sautner, Z. and Vilkov, G. (2018), “Carbon Tail Risk”, SSRN Electronic Journal.
IMF (2019a), “How to Mitigate Climate Change”, IMF Fiscal Monitor, October.
IMF (2019b), “Sustainable Finance: Looking Farther”, Global Financial Stability Report, October 2019.
IPCC (2018), “Summary for Policymakers: Global Warming of 1.5°C”, IPCC Special Report on the impacts of global warming of 1.5°C above pre-industrial levels and related global greenhouse gas emission pathways, in the context of strengthening the global response to the threat of climate change, sustainable development, and efforts to eradicate poverty.
IPCC (2014), ”Fifth assessment synthesis report on climate change”, 2014 synthesis report, Cambridge University Press, Cambridge, United Kingdom and New York, NY, USA.

Positively green: measuring climate change risks to financial stability / June 2020 References 51
Jaeger, C.J. and Jaeger, J. (2011), “Three views of two degrees”, Regional Environmental Change, Vol. 11, pp. 15-26.
Kamiar Mohaddes, Kahn, M.E.Ng, R.N.C., Pesaran, M.H., Raissi, M. and Yang, J.C. (2019), “Long-Term Macroeconomic Effects of Climate Change: A Cross-Country Analysis”, NBER Working Paper, No 19/215, October.
Klomp, J. (2015), “Sovereign risk and natural disasters in emerging markets”, Emerging Markets Finance and Trade, Vol. 51(6), pp. 1326-1341.
Landa, G., Reynes, F. and Islas, I. (2015), “Towards a low carbon growth in Mexico: is a double dividend possible? A Dynamic General Equilibrium Assessment”, AFD Research Paper Series, No 2015-09.
Lucas, R. (1976), "Econometric Policy Evaluation: A Critique". In Brunner, K.; Meltzer, A. (eds.). The Phillips Curve and Labor Markets. Carnegie-Rochester Conference Series on Public Policy. pp. 19-46.
Monasterolo, I. and De Angelis, L. (2020), “Blind to carbon risk? An analysis of stock market reaction to the Paris Agreement”, Ecological Economics, Vol. 170.
McGlade, C. and Ekins, P. (2015), “The Geographical Distribution of Fossil Fuels Unused When Limiting Global Warming to 2°C”, Nature, Vol. 517, pp. 187-90.
Mittnik, S., Semmler, W. and Haider, A., (2019), “Climate Disaster Risks–Empirics and a Multi-Phase Dynamic Model”, Working Paper Series, IMF, No 19(145), July.
Monasterolo, I., Battiston S., Janetos A.C. and Zengh Z. (2017), “Vulnerable yet relevant: the two dimensions of climate-related financial disclosure”, Climatic Change, Vol. 145(3), pp. 495-507.
Monasterolo, I., Jiani I. Zheng and Battiston, S. (2018), “Climate transition risk and development finance: a climate stress-test of China’s overseas energy portfolios”, Input to the G20 Task Force “An International Financial Architecture for Stability and Development”, forthcoming in China and the World Economy.
Monnin, P. (2018) “Integrating Climate Risks into Credit Risk Assessment-Current Methodologies and the Case of Central Banks Corporate Bond Purchases”, Discussion Note, Council on Economic Policies, No. 4.
Morana, C. and Sbrana, G.(2019), “Climate change implications for the catastrophe bonds market: An empirical analysis”, Economic Modelling, No 81, May.
Morgan Stanley (2019), “Sustainable reality: Analysing risk and returns of sustainable funds”, Institute for sustainable investing.
MunichRe (2018), “The Natural Disasters of 2018 in Figures”.
National Bank of Belgium (2019), Financial Stability Report.

Positively green: measuring climate change risks to financial stability / June 2020 References 52
NGFS (2020), Integrating climate-related and environmental risks in prudential supervision – Guide for Supervisors, Network for Greening the Financial System, Paris, France.
NGFS (2019a). “A Call for Action – Climate Change as a Source of Financial Risk”, First Comprehensive Report, NGFS, April.
NGFS (2019b), “Macroeconomic and Financial Stability: Implications of Climate Change”, Technical Supplement to the First Comprehensive Report, NGFS, July.
Nordhaus, W.D. (2017), “Revisiting the social cost of carbon”, Proceedings of the National Academy of Sciences, Vol. 114(7), pp. 1518-1523.
Normand, J. (2020), “From pandemics to climate catastrophes: Hedging options as environmental tail risks become recognized as baselines”, JP Morgan Mimeo, May.
Opitz Sapleton, S., Nadin, R., Watson, C. and Kellett, J. (2017), “Climate Change, Migration, and Displacement: The Need for a Risk-Informed and Coherent Approach” in The Encyclopedia of Global Human Migration.
OECD (2015), The Economic Consequences of Climate Change, OCDE Publishing, Paris.
OECD (2017), Investing in Climate, Investing in Growth, OCDE Publishing, Paris.
Parker, M. (2018), “The impact of disasters on inflation”, Economics of disasters and climate change, Vol. 2(1), pp. 21-48.
Pointner, W and Ritzberger-Grünwald, D. (2019), “Climate Change and Financial Stability”, OeNB Financial Stability Report, No 38, December.
Prudential Regulation Authority (2019), Transition in thinking: The impact of climate change on the UK banking sector, September.
Prudential Regulation Authority (2019), A framework for assessing financial impacts of physical climate change: A practitioner’s aide for the general insurance sector, May.
Rockström, J., Gaffney, O., Rogelj, J., Meinshausen, M., Nakicenovic, N. and Schellnhuber, H.-J. (2017), “A roadmap for rapid decarbonisation”, Science, Vol. 355, No 6331.
Rudebusch, G.D. (2019), “Climate Change and the Federal Reserve”, FRBSF Economic Letter, No 2019-09.
Schwartz, A.J. (1995), Coping with financial fragility: a global perspective Springer, Boston, MA, pp. 251-257.
Stolbova V., Monasterolo I., Battiston, S. (2017), “A macro-financial network approach to climate policies’ evaluation”, Ecological Economics, (R&R).
Tol, R.S.J. (2009), “The Economic Effects of Climate Change”, Journal of Economic Perspectives, Vol. 23 (2), pp. 29-51.

Positively green: measuring climate change risks to financial stability / June 2020 References 53
Vermeulen, R., Schets, E., Lohuis, M., Kölbl, B., Jansen, D.J. and Heeringa, W. (2018), “An energy transition risk stress test for the financial system of the Netherlands”, DNB Occasional Studies, Vol. 16(7).
Wagner G. and Weitzman, M. (2018), “Potentially large equilibrium climate sensitivity tail uncertainty”, Economics Letters, Vol. 168, pp. 144-146.
Wei, D., Brugués, A., Rose, A., Carlos, A., García, R. and Martínez, F. (2017), “Climate change and the economy in Baja California: Assessment of macroeconomic impacts of the State’s Climate Action Plan”, Ecological economics, Vol. 131, pp. 373-388.

This report was prepared jointly by the ESRB Advisory Technical Committee and Eurosystem Financial Stability Committee. Drafted by Morgan Despres and Paul Hiebert (editors), Thomas Allen, Katarzyna Budnik and Rafel Moyà Porcel. Significant contributions from Adrien Amzallag, Marco Belloni, Casper Christophersen, Valerie Chouard, Carla Giglio, Margherita Giuzio, Johannes Gross, Willem Heeringa, Dejan Krusec, Sini Matikainen, Laura Parisi, Petya Radulova and Robert Vermeulen. Comments and helpful input from other ATC/FSC project team members.
Project team coordinators
Morgan Despres Banque de France
Paul Hiebert European Central Bank
Workstream coordinators
Sini Matikainen Risk monitoring
Willem Heeringa Risk assessment
Valérie Chouard Risk monitoring
Katarzyna Budnik Risk assessment
Secretary
Dejan Krusec From February 2020
Rafel Moyà Porcel Until January 2020
Team members
Katarzyna Budnik European Central Bank
Brenda Vantendeloo BE
Rafel Moyà Porcel European Central Bank
Markus Bellion DE
Petya Radulova European Central Bank
Philipp Hänle DE
Marco Belloni European Central Bank
Raffaele Passaro EBA
Laura Parisi European Central Bank
Andreas Pfeil EBA
Thomas Allen Banque de France
Anna Grochowska EC
Antoine Boirard FR
Lucia Alessi EC
Lucas Vernet FR
Valentina Mejdahl ESMA
Adrien Amzallag ESMA
Eva Harangozo European Systemic Risk Board
Casper Christophersen EIOPA
Sam Langfield European Systemic Risk Board
Matteo Sottocornola EIOPA
Clara Isabel Gonzalez Martinez ES
Robert Vermeulen NL
Yvonne McCarthy IE
Wolfgang Pointner AT
Federico Lubello LU
Imprint and acknowledgements

Ricardo Marques PT
Hans Bäckström SE
Rui Silva PT
Iskra Sokolovska SI
Luminita Tatarici RO
Ivan Faiella IT
© European Systemic Risk Board, 2020
Postal address 60640 Frankfurt am Main, Germany Telephone +49 69 1344 0 Website www.esrb.europa.eu
All rights reserved. Reproduction for educational and non-commercial purposes is permitted provided that the source is acknowledged.
The cut-off date for the data included in this report was 28 February 2020.
For specific terminology please refer to the ESRB glossary (available in English only).
ISBN 978-92-9472-143-3 (pdf) DOI 10.2849/63039 (pdf) EU catalogue No DT-01-20-342-EN-N (pdf)