positioning of mozambique in the international trade · 2019-11-07 · positioning of mozambique in...
TRANSCRIPT
2016 Edition
REPUBLIC OF MOZAMBIQUEMINISTRY OF INDUSTRY AND COMMERCE
POSITIONING OF MOZAMBIQUE IN THE INTERNATIONAL TRADE
Trade Flows in Mozambique: Trends and Policy Measures

REPUBLIC OF MOZAMBIQUE
MINISTRY OF INDUSTRY AND COMMERCE
2016 Edition
POSITIONING OF MOZAMBIQUE IN THE INTERNATIONAL TRADE
Trade Flows in Mozambique: Trends and Policy Measures

Positioning of Mozambique in the International Trade 2016 iii
Foreword
This report seeks to analyse the position of Mozambique in the international trade in the period of 2010-2015 vis-à-vis relations with principal trade partners. This analysis essentially systematizes the information signalling the status of various socio-economic factors which are infl uencing the performance of economy.
Mozambique’s trade fl ows, especially the value and volume of imports and exports, are important data to un-derstand the situation of Mozambique in the international trade, and to take corrective measures to the coun-try’s less favourable position, as well as to extract the maximum benefi ts granted by the facilities resulting from the implementation of the various trade agreements of which the country is a signatory.
With the modifi cation of the structure of traditional export products (as fi sheries and primary agriculture products reduced its proportion in the exports structure), the country should explore new opportunities in the international trade, increasing the value of primary products, and the opportunities which are emerging in competitive markets for minerals and hydrocarbons.
There is a need to explore all the avenues offered by the greater openness of international trade, the global population increase, as well as the dynamics in the indicators of the ease of doing business, par ticularly in the regional markets, in the context of the profi le of the least developed countries that Mozambique is part of.
The challenge is to orient the government to defi ne trade policies, to benefi t more from trade opportunities in regional and international markets with the aim of improving the balance of payment, and creating new jobs and using trade as a tool for reducing poverty.
We would like to express our appreciation to the United Nations Development Programme (UNDP), for its assistance to the Ministry of Industry and Commerce (MIC) in the elaboration of this report. This support was provided through capacity building for statistical data collection and analysis related to international trade.
We look forward to continuing to engage with UNDP in the future on trade related matters that will enable us to make informed decisions that help the country to use trade as an additional tool in economic growth and development.
Maputo, 12th December 2016
Minister of Industry and Commerce
Ernesto Max Tonela
TECHNICAL NOTE
TITLE:
Positioning of Mozambique in the International Trade
REVIEW:
Sabado Matsolo, Cláudia Langa, José Leonardo, Agonias Macia, Calado Silva, Samuel Zita, Masaki Mifune and John Barns.
PRODUCTION:
Ministério da Indústria e Comércio (MIC)
Direcção de Planifi cação e Estudos – Cláudia Correia Langa e José LeonardoDirecção Nacional Comércio Interno – Isabel SimangoEnhanced Integrated Framework (EIF) – Herlander Namuiche, Samuel ZitaUnited Nations Development Programme (UNDP) – Masaki Mifune
LAYOUT:
Elografi co
EDITION:
1st Edition 2016
PRINTING
500 copies
PUBLISHED BY:
REPUBLIC OF MOZAMBIQUE
MINISTRY OF INDUSTRY AND COMMERCE
Praca 25 de Junho, n° 300Tel: +258 21 320401www.mic.gov.mz
WITH SUPPORT FROM:
UNITED NATIONS DEVELOPMENT PROGRAMME (UNDP)
Av. Kenneth Kaunda 921/931, P.O Box 4595www.undp.org

Positioning of Mozambique in the International Trade 2016 v
Contents
Abbreviations . . . . . . . . . . . . . . . . . . . . . . . . . . . . . . . . . . . . . . . . . . . . . . . viii
Executive Summary. . . . . . . . . . . . . . . . . . . . . . . . . . . . . . . . . . . . . . . . . . . . ix
Chapter I. Overview of Trade Trends in Mozambique . . . . . . . . . . . . . . . . . . . . . . . . . . 1
1.1 The Landscape of Trade in Mozambique . . . . . . . . . . . . . . . . . . . . . . . . . . . . . 1
1.2 Trade Partners in Mozambique . . . . . . . . . . . . . . . . . . . . . . . . . . . . . . . . . . 4
Chapter II. Trend Analysis of Trade Products in Mozambique . . . . . . . . . . . . . . . . . . . . . . 5
2.1 Trade Products Portfolio . . . . . . . . . . . . . . . . . . . . . . . . . . . . . . . . . . . . . . 5
2.2 Main Cash Crops and Foods Exports . . . . . . . . . . . . . . . . . . . . . . . . . . . . . . . 7
2.3 Main Food Imports . . . . . . . . . . . . . . . . . . . . . . . . . . . . . . . . . . . . . . . . 21
Chapter III. Global & Regional Trends . . . . . . . . . . . . . . . . . . . . . . . . . . . . . . . . . . 27
3.1 Demographic Trends and Food Security . . . . . . . . . . . . . . . . . . . . . . . . . . . . . 27
3.2 Demographic Trends and Socio-Economic Structure. . . . . . . . . . . . . . . . . . . . . . . 29
3.3 Energy Demand and Industrialization. . . . . . . . . . . . . . . . . . . . . . . . . . . . . . . 33
3.4 SDGs and Trade. . . . . . . . . . . . . . . . . . . . . . . . . . . . . . . . . . . . . . . . . . 38
Chapter IV. Policy and Institutional Framework for Trade in Mozambique . . . . . . . . . . . . . . . . 40
4.1 Policy and Institutional Framework in the Trade Sector . . . . . . . . . . . . . . . . . . . . . . 40
4.2 International Trade Agreements . . . . . . . . . . . . . . . . . . . . . . . . . . . . . . . . . 44
4.3 Business Environment in Mozambique . . . . . . . . . . . . . . . . . . . . . . . . . . . . . . 47
Reference . . . . . . . . . . . . . . . . . . . . . . . . . . . . . . . . . . . . . . . . . . . . . . . . . 50
Figures
Figure 1.1: Degree of trade openness 2000-2014 . . . . . . . . . . . . . . . . . . . . . . . . . . . . 2
Figure 1.2: Current account, trade and FDI fl ow in Mozambique 2010-2014 . . . . . . . . . . . . . . 2
Figure 1.3: Principal trade products exported from Mozambique 2000 and 2015. . . . . . . . . . . . 3
Figure 1.4: Commodity price trend (Index, 2005=100). . . . . . . . . . . . . . . . . . . . . . . . . . 3
Figure 2.1: Megaproject/extractive industry export value 2000-2015 (selected prducts) . . . . . . . . 6
Figure 2.2: Cash crops and foods exports value 2000-2015 (selected products) . . . . . . . . . . . 6
Figure 2.3: Exports destinations by product (2011-2015 avg.). . . . . . . . . . . . . . . . . . . . . . 7
Figure 2.4 Mozambique cashew nuts exports and global trends . . . . . . . . . . . . . . . . . . . . 8
Figure 2.5: Mozambique cashew nuts export destinations. . . . . . . . . . . . . . . . . . . . . . . . 9
Figure 2.6: Mozambique sesame exports and global trends . . . . . . . . . . . . . . . . . . . . . . 10
Figure 2.7: Mozambique sesame export destinations . . . . . . . . . . . . . . . . . . . . . . . . . . 10
Figure 2.8: Mozambique almonds exports and global trends . . . . . . . . . . . . . . . . . . . . . . 12
Figure 2.9: Mozambique almonds export destinations . . . . . . . . . . . . . . . . . . . . . . . . . . 12
Figure 2.10: Mozambique cotton exports and global trends . . . . . . . . . . . . . . . . . . . . . . . 14
Figure 2.11: Mozambique cotton export destinations . . . . . . . . . . . . . . . . . . . . . . . . . . 14
Positioning of Mozambique in the International Trade 2016 vii
Tables
Table 1.1: Mozambique’s major trading partners (2011-2015 avg.) . . . . . . . . . . . . . . . . . . . 4
Table 2.1: Main export and import products in Mozambique . . . . . . . . . . . . . . . . . . . . . . 5
Table 2.2: Cashew nuts export world ranking . . . . . . . . . . . . . . . . . . . . . . . . . . . . . . 9
Table 2.3: Sesame exports word ranking. . . . . . . . . . . . . . . . . . . . . . . . . . . . . . . . . 11
Table 2.4: Almonds export world ranking. . . . . . . . . . . . . . . . . . . . . . . . . . . . . . . . . 13
Table 2.5: Cotton exports world ranking . . . . . . . . . . . . . . . . . . . . . . . . . . . . . . . . . 15
Table 2.6: Banana exports world ranking . . . . . . . . . . . . . . . . . . . . . . . . . . . . . . . . 17
Table 2.7: Sugar exports world ranking. . . . . . . . . . . . . . . . . . . . . . . . . . . . . . . . . . 19
Table 2.8: Crustaceans exports world ranking . . . . . . . . . . . . . . . . . . . . . . . . . . . . . . 21
Table 4.1: Preferential Trade Agreements - Mozambique . . . . . . . . . . . . . . . . . . . . . . . . 45
Table 4.2: Bilateral investment agreements – Mozambique . . . . . . . . . . . . . . . . . . . . . . . 46
Table 4.3: Doing Business 2016 (comparison w/selected countries in Sub-Saharan Africa) . . . . . . 47
Table 4.4: GCI 2015-2016 global ranking (comparison w/selected countries in Sub-Saharan Africa). . 48
Table 4.5: LPI 2016 Sub-Saharan Africa ranking (comparison w/selected countries) . . . . . . . . . . 49
Boxes
Box 1.1: Volatile commodity prices destabilize the economy . . . . . . . . . . . . . . . . . . . . . . 3
Box 2.1: Food security and trade. . . . . . . . . . . . . . . . . . . . . . . . . . . . . . . . . . . . . 24
Box 3.1: Changing dietary habits and diversifi cation of foods demand . . . . . . . . . . . . . . . . . 29
Box 3.2: Consumption in developing & emerging countries – Bottom of Pyramid . . . . . . . . . . . . 33
Box 3.3: COP 21 and energy demand forecast – IEA Bridge Scenario . . . . . . . . . . . . . . . . . 34
Box 3.4: Global Value Chains (GVCs) – opportunities and risks . . . . . . . . . . . . . . . . . . . . . 36
Box 3.5: Trade and Development Agenda . . . . . . . . . . . . . . . . . . . . . . . . . . . . . . . . 38
Box 4.1: Functions attributed to the Ministry of Industry and Commerce . . . . . . . . . . . . . . . . 41
Box 4.2: Trade related issues coordination mechanism – Aid for Trade and EIF in Mozambique . . . . 43
Box 4.3: Logistics Performance Index (LPI) . . . . . . . . . . . . . . . . . . . . . . . . . . . . . . . 49
vi Positioning of Mozambique in the International Trade 2016
Figure 2.12: Mozambique banana exports and global trends . . . . . . . . . . . . . . . . . . . . . . 16
Figure 2.13: Mozambique banana export destination . . . . . . . . . . . . . . . . . . . . . . . . . . 16
Figure 2.14: Mozambique sugar export/import and global trends . . . . . . . . . . . . . . . . . . . . 18
Figure 2.15: Mozambique sugar export destinations . . . . . . . . . . . . . . . . . . . . . . . . . . 18
Figure 2.16: Mozambique crustaceans exports and global trends . . . . . . . . . . . . . . . . . . . 20
Figure 2.17: Mozambique crustaceans export destinations . . . . . . . . . . . . . . . . . . . . . . . 20
Figure 2.18: Food products imported by Mozambique 2001-2015 . . . . . . . . . . . . . . . . . . . 22
Figure 2.19: Population trends and projections for Mozambique . . . . . . . . . . . . . . . . . . . . 22
Figure 2.20: Wheat import origins . . . . . . . . . . . . . . . . . . . . . . . . . . . . . . . . . . . . 23
Figure 2.21: Maize import origins. . . . . . . . . . . . . . . . . . . . . . . . . . . . . . . . . . . . . 23
Figure 2.22: Rice import origins . . . . . . . . . . . . . . . . . . . . . . . . . . . . . . . . . . . . . 24
Figure 2.23: Frozen fi sh imported by Mozambique & import origins . . . . . . . . . . . . . . . . . . . 25
Figure 2.24: Tomatoes imported by Mozambique & Fresh tomatoes import origin . . . . . . . . . . . 25
Figure 2.25: Mozambique meats and live animals imports and import origins . . . . . . . . . . . . . 26
Figure 3.1: World population trends 1980-2050 . . . . . . . . . . . . . . . . . . . . . . . . . . . . . 28
Figure 3.2: Cereals production, consumption and net import – Sub-Saharan Africa (excl. South Africa) . . . . . . . . . . . . . . . . . . . . . . . . . . . . . . . . . . . . . . . . . . . . . . . 28
Figure 3.3: Calorie intake per capita in LDCs and Developed countries. . . . . . . . . . . . . . . . . 29
Figure 3.4: World demographic trends by age group 1980-2050 . . . . . . . . . . . . . . . . . . . . 30
Figure 3.5: World population median age trends 1990-2050. . . . . . . . . . . . . . . . . . . . . . . 30
Figure 3.6: Demographic age pyramid - Mozambique. . . . . . . . . . . . . . . . . . . . . . . . . . 31
Figure 3.7: World urban population growth rates & Rural/urban population trends for Mozam-bique1990-2050 . . . . . . . . . . . . . . . . . . . . . . . . . . . . . . . . . . . . . . . . . . . . . 31
Figure 3.8: Trend of urbanization and services value added (% of GDP) 1980-2014 . . . . . . . . . . 32
Figure 3.9: Mobile and fi xed telephone subscription & International tourism arrivals and revenues . . 32
Figure 3.10: Consumption patterns by sector and income segment – 2010 (average of 92 countries) . . 33
Figure 3.11: Energy demand by sector & Total primary energy demand by resource . . . . . . . . . 33
Figure 3.12: Electricity generation trend by resource – IEA bridge scenario . . . . . . . . . . . . . . 34
Figure 3.13: Industry, value added (% of GDP) 2014 – Sub-Saharan Africa + Gulf States . . . . . . . 35
Figure 3.14: Fuel price trends and world trade (exports) 2002-2014 . . . . . . . . . . . . . . . . . . 36
Figure 3.15: Fuel price trends and global GDP & Government revenue in oil producing countries . . . 37
Figure 3.16: Fuel price trend and global FDI trend & Mozambique and Nigeria FDI trend . . . . . . . 37
Figure 3.17: Global development initiatives related to trade agenda . . . . . . . . . . . . . . . . . . 39
Figure 4.1: Organigram – Ministry of Industry and Commerce. . . . . . . . . . . . . . . . . . . . . . 41
Figure 4.2: Policy and strategic framework – Ministry of Industry and Commerce. . . . . . . . . . . . 43
Figure 4.3: Average MFN applied duties 2014 – Mozambique . . . . . . . . . . . . . . . . . . . . . 46
Figure 4.4: LPI – Mozambique 2010 vs 2016. . . . . . . . . . . . . . . . . . . . . . . . . . . . . . . 49
Positioning of Mozambique in the International Trade 2016 vii
Tables
Table 1.1: Mozambique’s major trading partners (2011-2015 avg.) . . . . . . . . . . . . . . . . . . . 4
Table 2.1: Main export and import products in Mozambique . . . . . . . . . . . . . . . . . . . . . . 5
Table 2.2: Cashew nuts export world ranking . . . . . . . . . . . . . . . . . . . . . . . . . . . . . . 9
Table 2.3: Sesame exports word ranking. . . . . . . . . . . . . . . . . . . . . . . . . . . . . . . . . 11
Table 2.4: Almonds export world ranking. . . . . . . . . . . . . . . . . . . . . . . . . . . . . . . . . 13
Table 2.5: Cotton exports world ranking . . . . . . . . . . . . . . . . . . . . . . . . . . . . . . . . . 15
Table 2.6: Banana exports world ranking . . . . . . . . . . . . . . . . . . . . . . . . . . . . . . . . 17
Table 2.7: Sugar exports world ranking. . . . . . . . . . . . . . . . . . . . . . . . . . . . . . . . . . 19
Table 2.8: Crustaceans exports world ranking . . . . . . . . . . . . . . . . . . . . . . . . . . . . . . 21
Table 4.1: Preferential Trade Agreements - Mozambique . . . . . . . . . . . . . . . . . . . . . . . . 45
Table 4.2: Bilateral investment agreements – Mozambique . . . . . . . . . . . . . . . . . . . . . . . 46
Table 4.3: Doing Business 2016 (comparison w/selected countries in Sub-Saharan Africa) . . . . . . 47
Table 4.4: GCI 2015-2016 global ranking (comparison w/selected countries in Sub-Saharan Africa). . 48
Table 4.5: LPI 2016 Sub-Saharan Africa ranking (comparison w/selected countries) . . . . . . . . . . 49
Boxes
Box 1.1: Volatile commodity prices destabilize the economy . . . . . . . . . . . . . . . . . . . . . . 3
Box 2.1: Food security and trade. . . . . . . . . . . . . . . . . . . . . . . . . . . . . . . . . . . . . 24
Box 3.1: Changing dietary habits and diversifi cation of foods demand . . . . . . . . . . . . . . . . . 29
Box 3.2: Consumption in developing & emerging countries – Bottom of Pyramid . . . . . . . . . . . . 33
Box 3.3: COP 21 and energy demand forecast – IEA Bridge Scenario . . . . . . . . . . . . . . . . . 34
Box 3.4: Global Value Chains (GVCs) – opportunities and risks . . . . . . . . . . . . . . . . . . . . . 36
Box 3.5: Trade and Development Agenda . . . . . . . . . . . . . . . . . . . . . . . . . . . . . . . . 38
Box 4.1: Functions attributed to the Ministry of Industry and Commerce . . . . . . . . . . . . . . . . 41
Box 4.2: Trade related issues coordination mechanism – Aid for Trade and EIF in Mozambique . . . . 43
Box 4.3: Logistics Performance Index (LPI) . . . . . . . . . . . . . . . . . . . . . . . . . . . . . . . 49
Positioning of Mozambique in the International Trade 2016 ix
Executive Summary
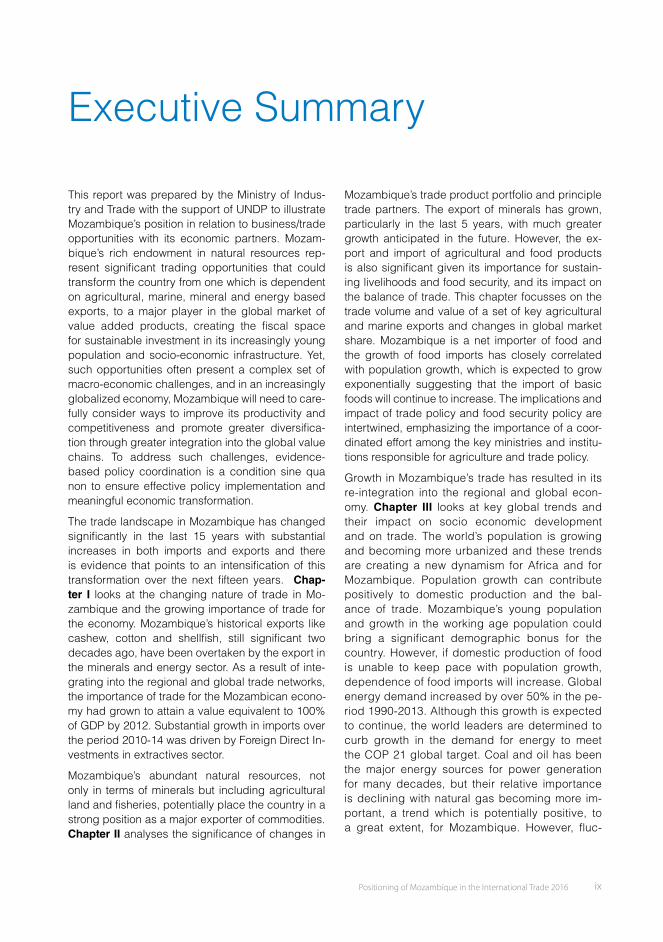
This report was prepared by the Ministry of Indus-try and Trade with the support of UNDP to illustrate Mozambique’s position in relation to business/trade opportunities with its economic partners. Mozam-bique’s rich endowment in natural resources rep-resent signifi cant trading opportunities that could transform the country from one which is dependent on agricultural, marine, mineral and energy based exports, to a major player in the global market of value added products, creating the fi scal space for sustainable investment in its increasingly young population and socio-economic infrastructure. Yet, such opportunities often present a complex set of macro-economic challenges, and in an increasingly globalized economy, Mozambique will need to care-fully consider ways to improve its productivity and competitiveness and promote greater diversifi ca-tion through greater integration into the global value chains. To address such challenges, evidence-based policy coordination is a condition sine qua non to ensure effective policy implementation and meaningful economic transformation.
The trade landscape in Mozambique has changed signifi cantly in the last 15 years with substantial increases in both imports and exports and there is evidence that points to an intensifi cation of this transformation over the next fi fteen years. Chap-ter I looks at the changing nature of trade in Mo-zambique and the growing importance of trade for the economy. Mozambique’s historical exports like cashew, cotton and shellfi sh, still signifi cant two decades ago, have been overtaken by the export in the minerals and energy sector. As a result of inte-grating into the regional and global trade networks, the importance of trade for the Mozambican econo-my had grown to attain a value equivalent to 100% of GDP by 2012. Substantial growth in imports over the period 2010-14 was driven by Foreign Direct In-vestments in extractives sector.
Mozambique’s abundant natural resources, not only in terms of minerals but including agricultural land and fi sheries, potentially place the country in a strong position as a major exporter of commodities. Chapter II analyses the signifi cance of changes in
Mozambique’s trade product portfolio and principle trade partners. The export of minerals has grown, particularly in the last 5 years, with much greater growth anticipated in the future. However, the ex-port and import of agricultural and food products is also signifi cant given its importance for sustain-ing livelihoods and food security, and its impact on the balance of trade. This chapter focusses on the trade volume and value of a set of key agricultural and marine exports and changes in global market share. Mozambique is a net importer of food and the growth of food imports has closely correlated with population growth, which is expected to grow exponentially suggesting that the import of basic foods will continue to increase. The implications and impact of trade policy and food security policy are intertwined, emphasizing the importance of a coor-dinated effort among the key ministries and institu-tions responsible for agriculture and trade policy.
Growth in Mozambique’s trade has resulted in its re-integration into the regional and global econ-omy. Chapter III looks at key global trends and their impact on socio economic development and on trade. The world’s population is growing and becoming more urbanized and these trends are creating a new dynamism for Africa and for Mozambique. Population growth can contribute positively to domestic production and the bal-ance of trade. Mozambique’s young population and growth in the working age population could bring a signifi cant demographic bonus for the country. However, if domestic production of food is unable to keep pace with population growth, dependence of food imports will increase. Global energy demand increased by over 50% in the pe-riod 1990-2013. Although this growth is expected to continue, the world leaders are determined to curb growth in the demand for energy to meet the COP 21 global target. Coal and oil has been the major energy sources for power generation for many decades, but their relative importance is declining with natural gas becoming more im-portant, a trend which is potentially positive, to a great extent, for Mozambique. However, fl uc-
viii Positioning of Mozambique in the International Trade 2016
Abbreviations
ACP African, Caribbean and Pacifi c Countries
AfT Aid for Trade
AGOA African Growth and Opportunity Act
CAADP Comprehensive African Agriculture Development Program
COMESA Common Market for Eastern and Southern Africa
COP Conference of the Parties
DTIS Diagnostic of Trade Integration Study
EAC East African Community
EIF Enhanced Integrated Framework
ENDE Estratégia Nacional de Desenvolvimento (National Development Strategy)
FAO Food and Agriculture Organization
FDI Foreign Direct Investment
GSP Generalized System of Preferences
GVCs Global Value Chains
ICT Information and Communication Technology
IEA International Energy Agency
INE Instituto Nacional de Estatistica (National Statistics Institutions)
LDCs Least Developed Countries
LPI Logistics Performance Index
MASA Ministro da Agricultura e Segurança Alimentar (Ministry of Agriculture and Food Security)
MDG Millennium Development Goals
MEF Ministro de Economia e Finanças (Ministry of Economy and Finance)
MFN Most Favoured Nation
MIC Ministro da Indústria e Comércio (Ministry of Industry and Commerce)
MMAIP Ministro do Mar, Águas Interiores e Pescas (Ministry for the Sea, Inland Water and Fishery)
MTOE Million Tonnes of Oil Equivalent
OECD Organisation for Economic Co-operation and Development
PES Plano Economico e Social (Social Economic Plan)
PEDSA Plan for the Development of the Agricultural Sector
PPP Purchasing Power Parity
PQG Programa Quinquenal do Governo (Government’s fi ve-year programme)
PTA Preferential Trade Agreement
SADC Southern African Development Community
SDGs Sustainable Development Goals
SDT Special and Differential Treatment
TWh Terawatt Hour
UNDP United Nations Development Programme
UNCTAD United Nations Conference on Trade and Development
WEF World Economic Forum
WTO World Trade Organization
Positioning of Mozambique in the International Trade 2016 ix
Executive Summary
This report was prepared by the Ministry of Indus-try and Trade with the support of UNDP to illustrate Mozambique’s position in relation to business/trade opportunities with its economic partners. Mozam-bique’s rich endowment in natural resources rep-resent signifi cant trading opportunities that could transform the country from one which is dependent on agricultural, marine, mineral and energy based exports, to a major player in the global market of value added products, creating the fi scal space for sustainable investment in its increasingly young population and socio-economic infrastructure. Yet, such opportunities often present a complex set of macro-economic challenges, and in an increasingly globalized economy, Mozambique will need to care-fully consider ways to improve its productivity and competitiveness and promote greater diversifi ca-tion through greater integration into the global value chains. To address such challenges, evidence-based policy coordination is a condition sine qua non to ensure effective policy implementation and meaningful economic transformation.
The trade landscape in Mozambique has changed signifi cantly in the last 15 years with substantial increases in both imports and exports and there is evidence that points to an intensifi cation of this transformation over the next fi fteen years. Chap-ter I looks at the changing nature of trade in Mo-zambique and the growing importance of trade for the economy. Mozambique’s historical exports like cashew, cotton and shellfi sh, still signifi cant two decades ago, have been overtaken by the export in the minerals and energy sector. As a result of inte-grating into the regional and global trade networks, the importance of trade for the Mozambican econo-my had grown to attain a value equivalent to 100% of GDP by 2012. Substantial growth in imports over the period 2010-14 was driven by Foreign Direct In-vestments in extractives sector.
Mozambique’s abundant natural resources, not only in terms of minerals but including agricultural land and fi sheries, potentially place the country in a strong position as a major exporter of commodities. Chapter II analyses the signifi cance of changes in
Mozambique’s trade product portfolio and principle trade partners. The export of minerals has grown, particularly in the last 5 years, with much greater growth anticipated in the future. However, the ex-port and import of agricultural and food products is also signifi cant given its importance for sustain-ing livelihoods and food security, and its impact on the balance of trade. This chapter focusses on the trade volume and value of a set of key agricultural and marine exports and changes in global market share. Mozambique is a net importer of food and the growth of food imports has closely correlated with population growth, which is expected to grow exponentially suggesting that the import of basic foods will continue to increase. The implications and impact of trade policy and food security policy are intertwined, emphasizing the importance of a coor-dinated effort among the key ministries and institu-tions responsible for agriculture and trade policy.
Growth in Mozambique’s trade has resulted in its re-integration into the regional and global econ-omy. Chapter III looks at key global trends and their impact on socio economic development and on trade. The world’s population is growing and becoming more urbanized and these trends are creating a new dynamism for Africa and for Mozambique. Population growth can contribute positively to domestic production and the bal-ance of trade. Mozambique’s young population and growth in the working age population could bring a signifi cant demographic bonus for the country. However, if domestic production of food is unable to keep pace with population growth, dependence of food imports will increase. Global energy demand increased by over 50% in the pe-riod 1990-2013. Although this growth is expected to continue, the world leaders are determined to curb growth in the demand for energy to meet the COP 21 global target. Coal and oil has been the major energy sources for power generation for many decades, but their relative importance is declining with natural gas becoming more im-portant, a trend which is potentially positive, to a great extent, for Mozambique. However, fl uc-
Positioning of Mozambique in the International Trade 2016 1
1.1 The Landscape of Trade in Mozambique
Overview of Trade Trends in Mozambique
C h a p t e r I
Political reforms and sound macro-economic man-agement have been important factors in stimulating economic development in Mozambique over the past 15 years, securing one of the highest growth rates for African non-oil economies with annual real GDP growth over the period 2002-2012 averaging 7.5%.
Economic reforms since 2000 have resulted in the gradual reintegration of the economy into both re-gional and global markets, directly impacting on the country’s trade structure and enabling trade to play an important role in facilitating economic growth.
The trade landscape in Mozambique has changed signifi cantly over the last 15 years, as both imports and exports have grown dramatically as a result of Foreign Direct Investment (FDI) in mega-projects, and this dynamic is likely to continue for the fore-seeable future as the country’s trading potential be-comes a reality, particularly in the extractive sector.
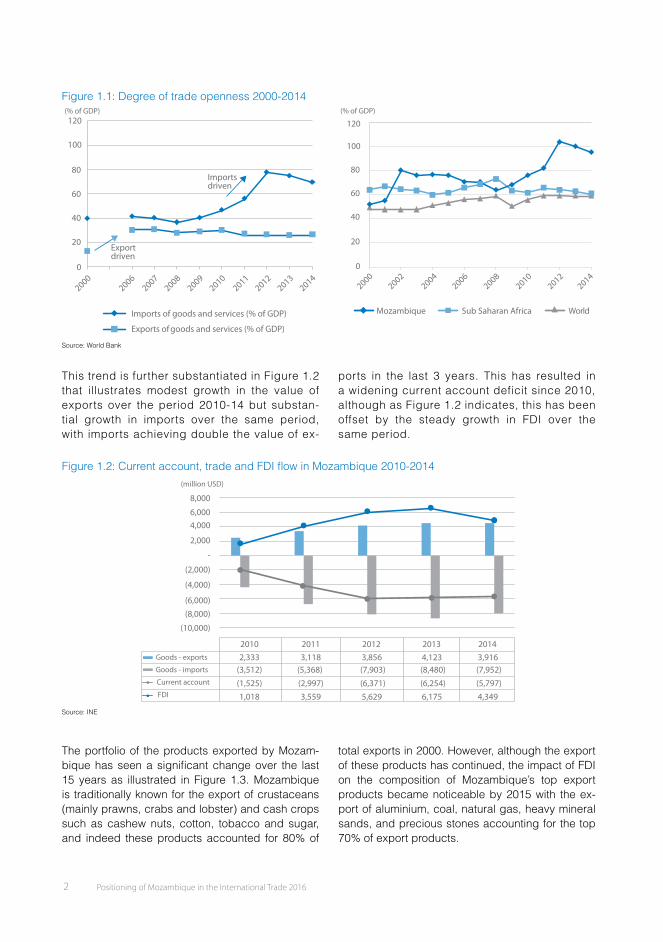
The Trade Openness Index measures the relation-ship between the combined value of imports and exports in relation to the size of GDP. Figure 1.1 il-lustrates the changing importance of trade for the Mozambican economy. There has been a notable change in Mozambique’s score on the index since 2000 in comparison to regional and global averages emphasizing the steady re-integration of Mozam-bican trade into regional and global trade networks.
A closer examination of the value of imports and exports as a percentage of GDP over the same pe-riod shows that changes in trade openness appear to be largely export driven in the period 2000-2002 and import driven in the period 2008-12. This almost certainly refl ects the beginning of the export of alu-minium in the early part of the decade and the im-port of equipment and machinery associated with investments in the energy and mineral resources sector, particularly coal and natural gas, at the end of the decade.
x Positioning of Mozambique in the International Trade 2016
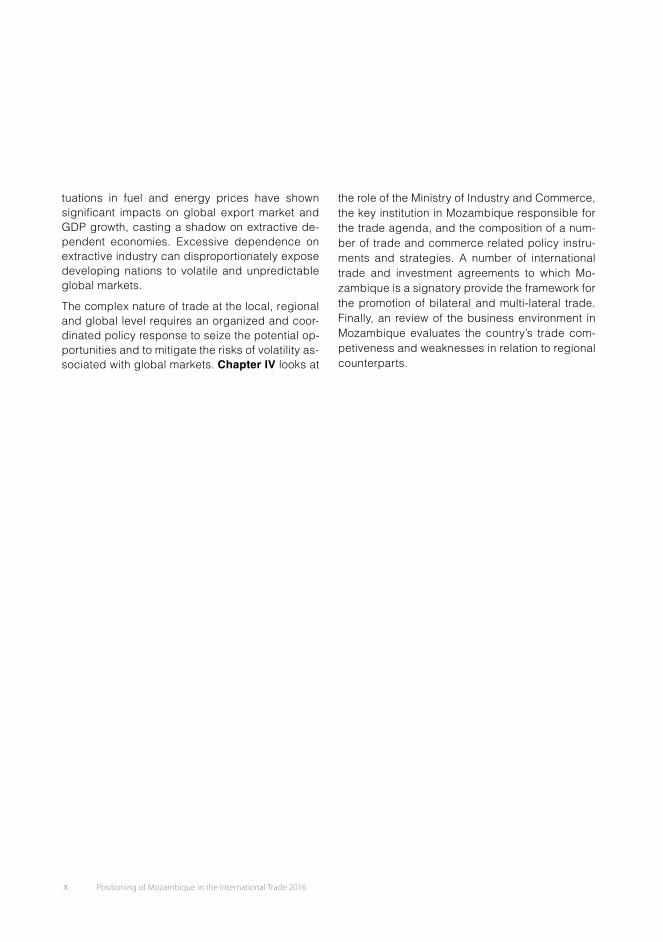
tuations in fuel and energy prices have shown signifi cant impacts on global export market and GDP growth, casting a shadow on extractive de-pendent economies. Excessive dependence on extractive industry can disproportionately expose developing nations to volatile and unpredictable global markets.
The complex nature of trade at the local, regional and global level requires an organized and coor-dinated policy response to seize the potential op-portunities and to mitigate the risks of volatility as-sociated with global markets. Chapter IV looks at
the role of the Ministry of Industry and Commerce, the key institution in Mozambique responsible for the trade agenda, and the composition of a num-ber of trade and commerce related policy instru-ments and strategies. A number of international trade and investment agreements to which Mo-zambique is a signatory provide the framework for the promotion of bilateral and multi-lateral trade. Finally, an review of the business environment in Mozambique evaluates the country’s trade com-petiveness and weaknesses in relation to regional counterparts.

Positioning of Mozambique in the International Trade 2016 1
1.1 The Landscape of Trade in Mozambique
Overview of Trade Trends in Mozambique
C h a p t e r I
Political reforms and sound macro-economic man-agement have been important factors in stimulating economic development in Mozambique over the past 15 years, securing one of the highest growth rates for African non-oil economies with annual real GDP growth over the period 2002-2012 averaging 7.5%.
Economic reforms since 2000 have resulted in the gradual reintegration of the economy into both re-gional and global markets, directly impacting on the country’s trade structure and enabling trade to play an important role in facilitating economic growth.
The trade landscape in Mozambique has changed signifi cantly over the last 15 years, as both imports and exports have grown dramatically as a result of Foreign Direct Investment (FDI) in mega-projects, and this dynamic is likely to continue for the fore-seeable future as the country’s trading potential be-comes a reality, particularly in the extractive sector.
The Trade Openness Index measures the relation-ship between the combined value of imports and exports in relation to the size of GDP. Figure 1.1 il-lustrates the changing importance of trade for the Mozambican economy. There has been a notable change in Mozambique’s score on the index since 2000 in comparison to regional and global averages emphasizing the steady re-integration of Mozam-bican trade into regional and global trade networks.
A closer examination of the value of imports and exports as a percentage of GDP over the same pe-riod shows that changes in trade openness appear to be largely export driven in the period 2000-2002 and import driven in the period 2008-12. This almost certainly refl ects the beginning of the export of alu-minium in the early part of the decade and the im-port of equipment and machinery associated with investments in the energy and mineral resources sector, particularly coal and natural gas, at the end of the decade.
2 Positioning of Mozambique in the International Trade 2016
Figure 1.1: Degree of trade openness 2000-2014
Imports of goods and services (% of GDP)
Exports of goods and services (% of GDP)
0
20
40
60
80
100
120
20002006
20072008
20092010
20112012
20132014
Importsdriven
Exportdriven
(% of GDP)
0
20
40
60
80
100
120
20002002
20042006
20082010
20122014
Mozambique Sub Saharan Africa World
(% of GDP)
Source: World Bank
This trend is further substantiated in Figure 1.2 that illustrates modest growth in the value of exports over the period 2010-14 but substan-tial growth in imports over the same period, with imports achieving double the value of ex-
ports in the last 3 years. This has resulted in a widening current account deficit since 2010, although as Figure 1.2 indicates, this has been offset by the steady growth in FDI over the same period.
Figure 1.2: Current account, trade and FDI fl ow in Mozambique 2010-2014
2010 2011 2012 2013 2014Goods - exports 2,333 3,118 3,856 4,123 3,916Goods - imports (3,512) (5,368) (7,903) (8,480) (7,952)Current account (1,525) (2,997) (6,371) (6,254) (5,797)FDI 1,018 3,559 5,629 6,175 4,349
(10,000)
(8,000)
(6,000)
(4,000)
(2,000)
-
2,000
4,0006,000
8,000
(million USD)
Source: INE
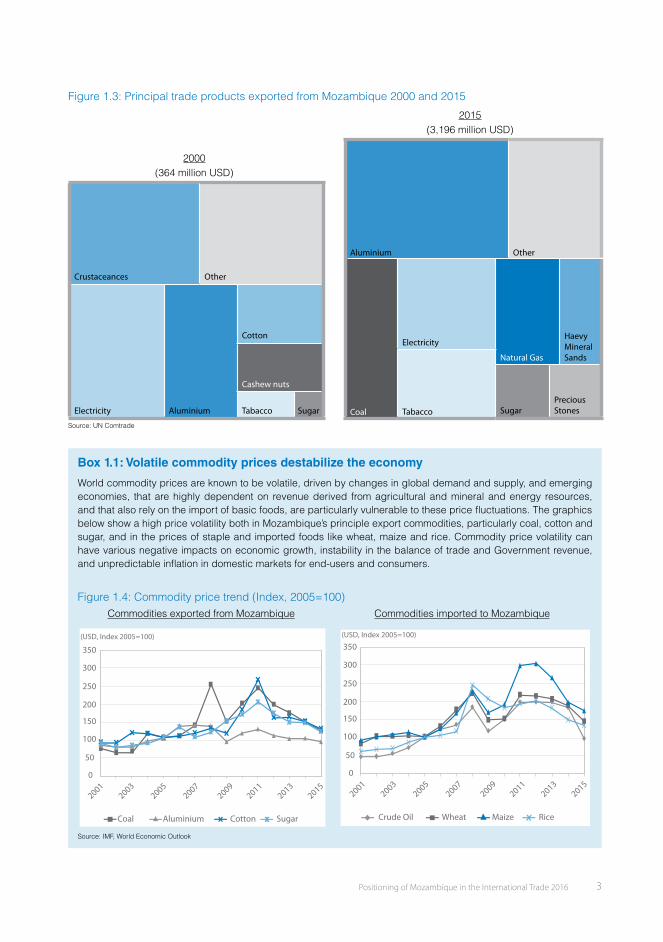
The portfolio of the products exported by Mozam-bique has seen a signifi cant change over the last 15 years as illustrated in Figure 1.3. Mozambique is traditionally known for the export of crustaceans (mainly prawns, crabs and lobster) and cash crops such as cashew nuts, cotton, tobacco and sugar, and indeed these products accounted for 80% of
total exports in 2000. However, although the export of these products has continued, the impact of FDI on the composition of Mozambique’s top export products became noticeable by 2015 with the ex-port of aluminium, coal, natural gas, heavy mineral sands, and precious stones accounting for the top 70% of export products.
Positioning of Mozambique in the International Trade 2016 3
Figure 1.3: Principal trade products exported from Mozambique 2000 and 2015
2000 (364 million USD)
Crustaceances Other
Electricity Aluminium
Cotton
Cashew nuts
Tabacco Sugar
2015 (3,196 million USD)
Aluminium Other
Coal
Electricity
Natural Gas
Haevy Mineral Sands
Tabacco SugarPreciousStones
Source: UN Comtrade
Box 1.1: Volatile commodity prices destabilize the economy
World commodity prices are known to be volatile, driven by changes in global demand and supply, and emerging economies, that are highly dependent on revenue derived from agricultural and mineral and energy resources, and that also rely on the import of basic foods, are particularly vulnerable to these price fl uctuations. The graphics below show a high price volatility both in Mozambique’s principle export commodities, particularly coal, cotton and sugar, and in the prices of staple and imported foods like wheat, maize and rice. Commodity price volatility can have various negative impacts on economic growth, instability in the balance of trade and Government revenue, and unpredictable infl ation in domestic markets for end-users and consumers.
Figure 1.4: Commodity price trend (Index, 2005=100)Commodities exported from Mozambique Commodities imported to Mozambique
0
50
100
150
200
250
300
350
(USD, Index 2005=100)
20012003
20052007
20092011
20132015
Coal Aluminium Cotton Sugar
0
50
100
150
200
250
300
350(USD, Index 2005=100)
20012003
20052007
20092011
20132015
Crude Oil Wheat Maize Rice
Source: IMF, World Economic Outlook

Positioning of Mozambique in the International Trade 2016 5
2.1 Trade Products Portfolio
Trend Analysis of Trade Products in Mozambique
C h a p t e r II
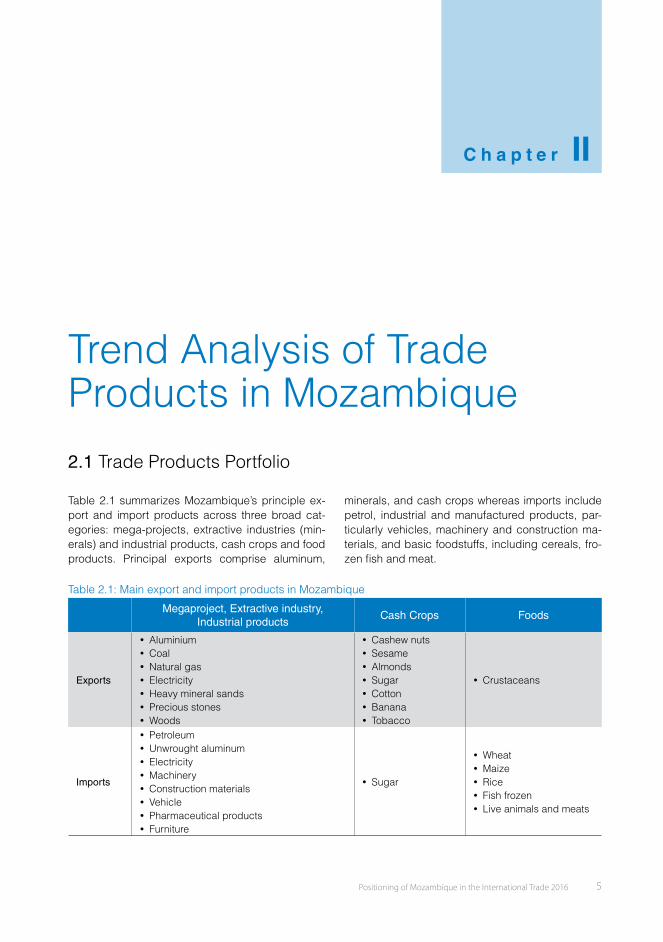
Table 2.1 summarizes Mozambique’s principle ex-port and import products across three broad cat-egories: mega-projects, extractive industries (min-erals) and industrial products, cash crops and food products. Principal exports comprise aluminum,
minerals, and cash crops whereas imports include petrol, industrial and manufactured products, par-ticularly vehicles, machinery and construction ma-terials, and basic foodstuffs, including cereals, fro-zen fi sh and meat.
Table 2.1: Main export and import products in Mozambique
Megaproject, Extractive industry, Industrial products
Cash Crops Foods
Exports
� Aluminium � Coal � Natural gas � Electricity � Heavy mineral sands � Precious stones � Woods
� Cashew nuts � Sesame � Almonds � Sugar � Cotton � Banana � Tobacco
� Crustaceans
Imports
� Petroleum � Unwrought aluminum � Electricity � Machinery � Construction materials � Vehicle � Pharmaceutical products � Furniture
� Sugar
� Wheat � Maize � Rice � Fish frozen � Live animals and meats
4 Positioning of Mozambique in the International Trade 2016
Table 1.1 shows Mozambique’s top ten trading partners according to the value of exports and im-ports. Proximity to South Africa, the second-larg-est economy in Africa, accounting for 24% of the continent’s gross domestic product in 2015, make it Mozambique’s biggest trading partner. Mozam-bique’s principle exports to South Africa are gas from Inhambane, and electricity from the Cahorra Bassa hydro dam in Tete. However, the importance of South Africa as a trading partner lies principally in its role as a source of imports particularly in re-lation to machinery, vehicles, and foods, and as a result Mozambique runs a signifi cant trade defi cit with its neighbour that has averaged close to $2bn per annum over the last fi ve years. In fact, Mozam-
1.2 Trade Partners in Mozambique
bique runs a trade defi cit with most of its top ten trade partners with the exception of the Netherlands and India. The Netherlands is a special case due to the trading of aluminum and India is Mozambique’s largest coal export destination.
China and India, ranked in 3rd and 4th position, are gaining increasing importance as trade partners and are the principle destinations for primary commodities such as coal and heavy mineral sands. The impor-tance of Bahrain and the UEA is related to the import of petroleum. Traditional trading partners amongst de-veloped countries, notably Portugal, the UK, the USA and Japan, are international suppliers of machinery, vehicles, and electrical and electronic products.
Table 1.1: Mozambique’s major trading partners (2011-2015 avg.)
(million USD)Trade value
(exports + imports)Trade balance
South Africa 3,264 -1,789Netherlands 1,678 537China 851 -371India 625 34United Arab Emirates 550 -465Bahrain 465 -447Portugal 434 -336United Kingdom 354 -68USA 289 -152Japan 238 -198
Source: UN Comtrade
Figure 1.5: Mozambique’s principle export destination and import origins (2011-2015 avg.)
Exports destinations Imports origins
South Africa19%
China6%
Netherlands29%
India9%
USA2%
Italy2%
Switzerland2%
Zimbabwe2%
Singapore4%
United Kingdom
4%
Other21%
South Africa32%
China8%
Netherlands7%
United Arab Emirates
6%Bahrain6%
Portugal5%
India4%
USA3%
Japan3%
United Kingdom
3%
Other23%
Source: UN Comtrade
Positioning of Mozambique in the International Trade 2016 5
2.1 Trade Products Portfolio
Trend Analysis of Trade Products in Mozambique
C h a p t e r II
Table 2.1 summarizes Mozambique’s principle ex-port and import products across three broad cat-egories: mega-projects, extractive industries (min-erals) and industrial products, cash crops and food products. Principal exports comprise aluminum,
minerals, and cash crops whereas imports include petrol, industrial and manufactured products, par-ticularly vehicles, machinery and construction ma-terials, and basic foodstuffs, including cereals, fro-zen fi sh and meat.
Table 2.1: Main export and import products in Mozambique
Megaproject, Extractive industry, Industrial products
Cash Crops Foods
Exports
� Aluminium � Coal � Natural gas � Electricity � Heavy mineral sands � Precious stones � Woods
� Cashew nuts � Sesame � Almonds � Sugar � Cotton � Banana � Tobacco
� Crustaceans
Imports
� Petroleum � Unwrought aluminum � Electricity � Machinery � Construction materials � Vehicle � Pharmaceutical products � Furniture
� Sugar
� Wheat � Maize � Rice � Fish frozen � Live animals and meats
Positioning of Mozambique in the International Trade 2016 7
Regarding cash crops, the markets for sugar and cotton are relatively diverse. Sugar is exported al-most entirely to Europe, although split relatively equally between Portugal, Spain and Italy and with smaller volumes going to France and the Nether-lands. Cotton exports go almost entirely to Asia with the biggest volumes going to Indonesia but with
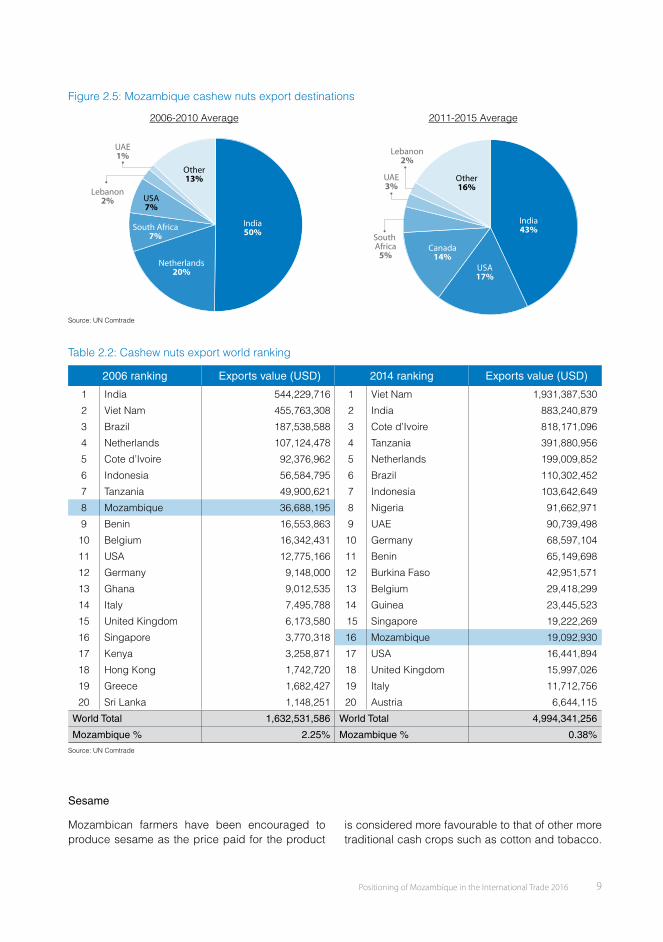
Bangladesh, China, Singapore and Vietnam as im-portant destinations. Over 60 % of the exports of sesame go to China, with the balance exported to various countries mainly in Asia. Finally, India is the principal market for Mozambican cashew nuts ac-counting for over 40% of export volume, but the USA and Canada are also important export destinations.
Figure 2.3: Exports destinations by product (2011-2015 avg.)Destinations of export products - megaproject/extractive resources (2011-2015 avg.)
Aluminium Coal Natural gas Heavy mineral sands
Netherlands83%
Singapore3%
United Kingdom
9%
Other5%
China16%
Italy17%
India22%
USA15%Spain
6%
Other20%
Japan4%
India52%
Other7%
China25%
Singapore16%
Other5%
South Africa95%
Destinations of export products - cash crops (2011-2015 avg.)
Sugar Cotton Sesame Cashew nuts
Netherlands6%
Portugal25%
France6%
Spain24%
Italy22%
Other17%
China14%
Indonesia24%
Bangladesh16%
Other16%
Viet Nam7%
Singapore9%
Mauritius10%
Malaysia4%
South Africa3%
Turkey6%
China61%
Singapore2%
India2%
Japan16%
UAE2%
Other8%
South Africa5%
Canada14%
India43%
USA17%
Lebanon2%
UAE3%
Other16%
Source: UN Comtrade
2.2 Main Cash Crops and Foods Exports
Turning from general trends to look in more detail at specifi c export products, this section will analyse seven key export products for Mozambique: cash-ew, sesame, almonds, cotton, banana, sugar and crustaceans.
Cashew Nuts
Since production began in the early 20th century, cashew nuts have been an important cash crop for Mozambique. In the post war period numerous factories were built for processing cashew nuts for
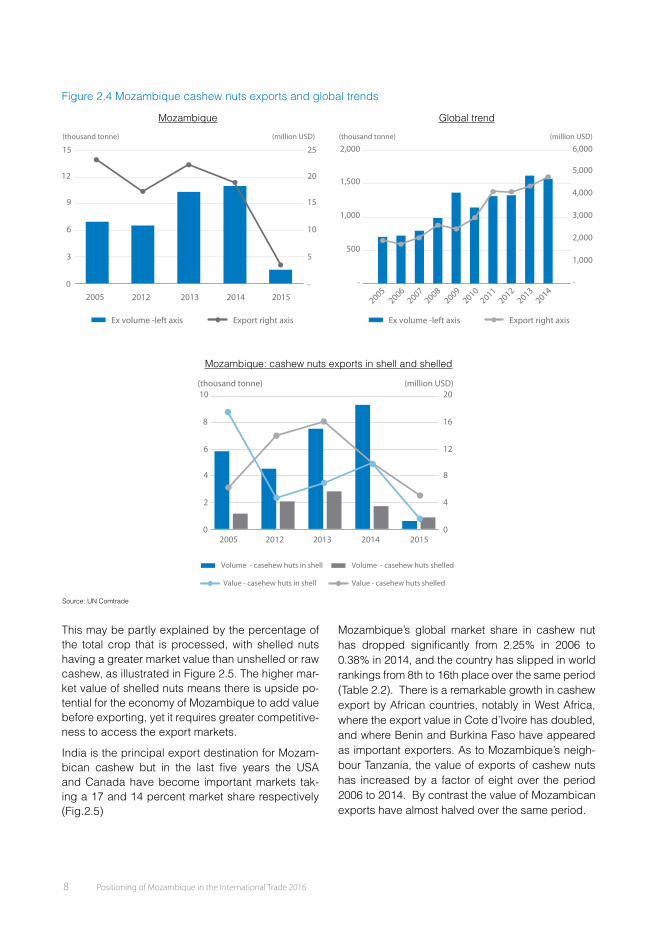
export. Production peaked in the 70’s when Mozam-bique was the world’s leading exporter of shelled cashew. However, in recent years the volume and quality of cashew nuts produced and exported has declined.
The volume of cashew nuts exported over the pe-riod 2005-2015 has been fl uctuating as export value has sharply declined in 2015 (Fig. 2.4). This shows a marked contrast to global trends where export vol-umes have more than doubled over the same period and export value has increased by almost tenfold.
6 Positioning of Mozambique in the International Trade 2016
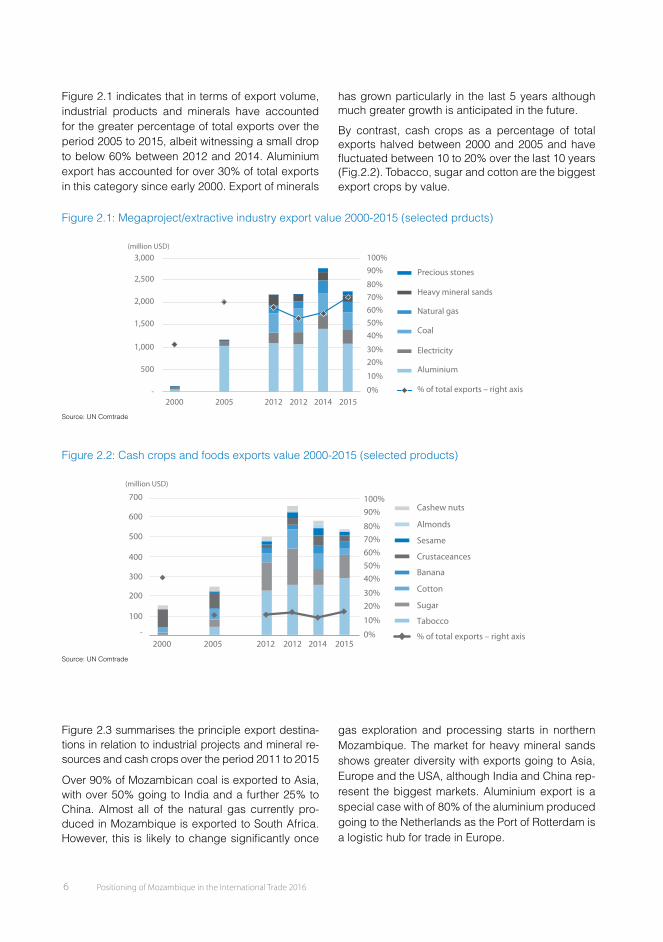
Figure 2.1 indicates that in terms of export volume, industrial products and minerals have accounted for the greater percentage of total exports over the period 2005 to 2015, albeit witnessing a small drop to below 60% between 2012 and 2014. Aluminium export has accounted for over 30% of total exports in this category since early 2000. Export of minerals
has grown particularly in the last 5 years although much greater growth is anticipated in the future.
By contrast, cash crops as a percentage of total exports halved between 2000 and 2005 and have fl uctuated between 10 to 20% over the last 10 years (Fig.2.2). Tobacco, sugar and cotton are the biggest export crops by value.
Figure 2.1: Megaproject/extractive industry export value 2000-2015 (selected prducts)
100%3,000(million USD)
2,500
2,000
1,500
1,000
500
-
Precious stones
Heavy mineral sands
Natural gas
Coal
Electricity
Aluminium
% of total exports – right axis
90%
80%70%60%50%40%
30%20%
10%
0%2000 2005 2012 2012 2014 2015
Source: UN Comtrade
Figure 2.2: Cash crops and foods exports value 2000-2015 (selected products)
100%90%
80%70%60%50%40%
30%20%
10%
0%
700
600
500
400
300
200
100
-
Cashew nuts
Almonds
Sesame
Crustaceances
Cotton
Banana
Sugar
Tabocco
% of total exports – right axis2000 2005 2012 2012 2014 2015
(million USD)
Source: UN Comtrade
Figure 2.3 summarises the principle export destina-tions in relation to industrial projects and mineral re-sources and cash crops over the period 2011 to 2015
Over 90% of Mozambican coal is exported to Asia, with over 50% going to India and a further 25% to China. Almost all of the natural gas currently pro-duced in Mozambique is exported to South Africa. However, this is likely to change signifi cantly once
gas exploration and processing starts in northern Mozambique. The market for heavy mineral sands shows greater diversity with exports going to Asia, Europe and the USA, although India and China rep-resent the biggest markets. Aluminium export is a special case with of 80% of the aluminium produced going to the Netherlands as the Port of Rotterdam is a logistic hub for trade in Europe.

Positioning of Mozambique in the International Trade 2016 7
Regarding cash crops, the markets for sugar and cotton are relatively diverse. Sugar is exported al-most entirely to Europe, although split relatively equally between Portugal, Spain and Italy and with smaller volumes going to France and the Nether-lands. Cotton exports go almost entirely to Asia with the biggest volumes going to Indonesia but with
Bangladesh, China, Singapore and Vietnam as im-portant destinations. Over 60 % of the exports of sesame go to China, with the balance exported to various countries mainly in Asia. Finally, India is the principal market for Mozambican cashew nuts ac-counting for over 40% of export volume, but the USA and Canada are also important export destinations.
Figure 2.3: Exports destinations by product (2011-2015 avg.)Destinations of export products - megaproject/extractive resources (2011-2015 avg.)
Aluminium Coal Natural gas Heavy mineral sands
Netherlands83%
Singapore3%
United Kingdom
9%
Other5%
China16%
Italy17%
India22%
USA15%Spain
6%
Other20%
Japan4%
India52%
Other7%
China25%
Singapore16%
Other5%
South Africa95%
Destinations of export products - cash crops (2011-2015 avg.)
Sugar Cotton Sesame Cashew nuts
Netherlands6%
Portugal25%
France6%
Spain24%
Italy22%
Other17%
China14%
Indonesia24%
Bangladesh16%
Other16%
Viet Nam7%
Singapore9%
Mauritius10%
Malaysia4%
South Africa3%
Turkey6%
China61%
Singapore2%
India2%
Japan16%
UAE2%
Other8%
South Africa5%
Canada14%
India43%
USA17%
Lebanon2%
UAE3%
Other16%
Source: UN Comtrade
2.2 Main Cash Crops and Foods Exports
Turning from general trends to look in more detail at specifi c export products, this section will analyse seven key export products for Mozambique: cash-ew, sesame, almonds, cotton, banana, sugar and crustaceans.
Cashew Nuts
Since production began in the early 20th century, cashew nuts have been an important cash crop for Mozambique. In the post war period numerous factories were built for processing cashew nuts for
export. Production peaked in the 70’s when Mozam-bique was the world’s leading exporter of shelled cashew. However, in recent years the volume and quality of cashew nuts produced and exported has declined.
The volume of cashew nuts exported over the pe-riod 2005-2015 has been fl uctuating as export value has sharply declined in 2015 (Fig. 2.4). This shows a marked contrast to global trends where export vol-umes have more than doubled over the same period and export value has increased by almost tenfold.
Positioning of Mozambique in the International Trade 2016 9
Figure 2.5: Mozambique cashew nuts export destinations
2006-2010 Average 2011-2015 Average
South Africa7%
India50%
USA7%
Lebanon2%
UAE1%
Other13%
Netherlands20%
South Africa5%
Canada14%
India43%
USA17%
Lebanon2%
UAE3%
Other16%
Source: UN Comtrade
Table 2.2: Cashew nuts export world ranking
2006 ranking Exports value (USD) 2014 ranking Exports value (USD)
1 India 544,229,716 1 Viet Nam 1,931,387,530
2 Viet Nam 455,763,308 2 India 883,240,879
3 Brazil 187,538,588 3 Cote d’Ivoire 818,171,096
4 Netherlands 107,124,478 4 Tanzania 391,880,956
5 Cote d’Ivoire 92,376,962 5 Netherlands 199,009,852
6 Indonesia 56,584,795 6 Brazil 110,302,452
7 Tanzania 49,900,621 7 Indonesia 103,642,649
8 Mozambique 36,688,195 8 Nigeria 91,662,971
9 Benin 16,553,863 9 UAE 90,739,498
10 Belgium 16,342,431 10 Germany 68,597,104
11 USA 12,775,166 11 Benin 65,149,698
12 Germany 9,148,000 12 Burkina Faso 42,951,571
13 Ghana 9,012,535 13 Belgium 29,418,299
14 Italy 7,495,788 14 Guinea 23,445,523
15 United Kingdom 6,173,580 15 Singapore 19,222,269
16 Singapore 3,770,318 16 Mozambique 19,092,930
17 Kenya 3,258,871 17 USA 16,441,894
18 Hong Kong 1,742,720 18 United Kingdom 15,997,026
19 Greece 1,682,427 19 Italy 11,712,756
20 Sri Lanka 1,148,251 20 Austria 6,644,115
World Total 1,632,531,586 World Total 4,994,341,256
Mozambique % 2.25% Mozambique % 0.38%
Source: UN Comtrade
Sesame
Mozambican farmers have been encouraged to produce sesame as the price paid for the product
is considered more favourable to that of other more traditional cash crops such as cotton and tobacco.
8 Positioning of Mozambique in the International Trade 2016
Figure 2.4 Mozambique cashew nuts exports and global trends
Mozambique Global trend
-
5
10
15
20
25
0
3
6
9
12
15
(thousand tonne) (million USD)
2005 2012 2013 2014 2015
Ex volume -left axis Export right axis Ex volume -left axis Export right axis
-
1,000
2,000
3,000
4,000
5,000
6,000
-
500
1,000
1,500
2,000(thousand tonne) (million USD)
20052006
20072008
20092010
20112012
20132014
Mozambique: cashew nuts exports in shell and shelled
0
4
8
12
16
20
0
2
4
6
8
10
2005 2012 2013 2014 2015
Volume - casehew huts in shell Volume - casehew huts shelled
Value - casehew huts in shell Value - casehew huts shelled
(thousand tonne) (million USD)
Source: UN Comtrade
This may be partly explained by the percentage of the total crop that is processed, with shelled nuts having a greater market value than unshelled or raw cashew, as illustrated in Figure 2.5. The higher mar-ket value of shelled nuts means there is upside po-tential for the economy of Mozambique to add value before exporting, yet it requires greater competitive-ness to access the export markets.
India is the principal export destination for Mozam-bican cashew but in the last fi ve years the USA and Canada have become important markets tak-ing a 17 and 14 percent market share respectively (Fig.2.5)
Mozambique’s global market share in cashew nut has dropped signifi cantly from 2.25% in 2006 to 0.38% in 2014, and the country has slipped in world rankings from 8th to 16th place over the same period (Table 2.2). There is a remarkable growth in cashew export by African countries, notably in West Africa, where the export value in Cote d’Ivoire has doubled, and where Benin and Burkina Faso have appeared as important exporters. As to Mozambique’s neigh-bour Tanzania, the value of exports of cashew nuts has increased by a factor of eight over the period 2006 to 2014. By contrast the value of Mozambican exports have almost halved over the same period.
Positioning of Mozambique in the International Trade 2016 9
Figure 2.5: Mozambique cashew nuts export destinations
2006-2010 Average 2011-2015 Average
South Africa7%
India50%
USA7%
Lebanon2%
UAE1%
Other13%
Netherlands20%
South Africa5%
Canada14%
India43%
USA17%
Lebanon2%
UAE3%
Other16%
Source: UN Comtrade
Table 2.2: Cashew nuts export world ranking
2006 ranking Exports value (USD) 2014 ranking Exports value (USD)
1 India 544,229,716 1 Viet Nam 1,931,387,530
2 Viet Nam 455,763,308 2 India 883,240,879
3 Brazil 187,538,588 3 Cote d’Ivoire 818,171,096
4 Netherlands 107,124,478 4 Tanzania 391,880,956
5 Cote d’Ivoire 92,376,962 5 Netherlands 199,009,852
6 Indonesia 56,584,795 6 Brazil 110,302,452
7 Tanzania 49,900,621 7 Indonesia 103,642,649
8 Mozambique 36,688,195 8 Nigeria 91,662,971
9 Benin 16,553,863 9 UAE 90,739,498
10 Belgium 16,342,431 10 Germany 68,597,104
11 USA 12,775,166 11 Benin 65,149,698
12 Germany 9,148,000 12 Burkina Faso 42,951,571
13 Ghana 9,012,535 13 Belgium 29,418,299
14 Italy 7,495,788 14 Guinea 23,445,523
15 United Kingdom 6,173,580 15 Singapore 19,222,269
16 Singapore 3,770,318 16 Mozambique 19,092,930
17 Kenya 3,258,871 17 USA 16,441,894
18 Hong Kong 1,742,720 18 United Kingdom 15,997,026
19 Greece 1,682,427 19 Italy 11,712,756
20 Sri Lanka 1,148,251 20 Austria 6,644,115
World Total 1,632,531,586 World Total 4,994,341,256
Mozambique % 2.25% Mozambique % 0.38%
Source: UN Comtrade
Sesame
Mozambican farmers have been encouraged to produce sesame as the price paid for the product
is considered more favourable to that of other more traditional cash crops such as cotton and tobacco.
Positioning of Mozambique in the International Trade 2016 11
Table 2.3: Sesame exports word ranking
2006 ranking Exports (USD) 2014 ranking Exports (USD)
1 India 171,301,580 1 India 813,601,513
2 Ethiopia 160,618,956 2 Ethiopia 714,545,764
3 Fmr Sudan 143,712,121 3 Nigeria 553,561,191
4 China 55,915,893 4 Tanzania 324,414,519
5 Paraguay 28,363,175 5 Burkina Faso 131,838,092
6 Tanzania 21,135,390 6 China 97,584,787
7 Netherlands 19,080,060 7 Paraguay 78,608,002
8 Guatemala 16,206,568 8 Pakistan 65,401,723
9 Mexico 15,696,397 9 Uganda 55,165,179
10 Bolivia 13,736,288 10 Guatemala 52,858,249
11 Mozambique 13,499,546 11 Netherlands 47,432,050
12 Pakistan 10,884,218 12 Mozambique 40,453,920
13 Venezuela 9,700,650 13 Mexico 26,141,253
14 Thailand 7,736,563 14 Egypt 17,106,452
15 Turkey 7,261,183 15 Germany 16,640,180
16 Uganda 4,547,430 16 Greece 14,489,832
17 Germany 4,351,000 17 USA 14,140,743
18 Nicaragua 4,319,270 18 Bolivia 13,018,099
19 Greece 3,090,870 19 Nicaragua 12,986,969
20 Egypt 2,925,392 20 Afghanistan 11,861,646
World Total 742,134,620 World Total 3,203,518,646
Mozambique % 1.82% Mozambique % 1.26%Source: UN Comtrade
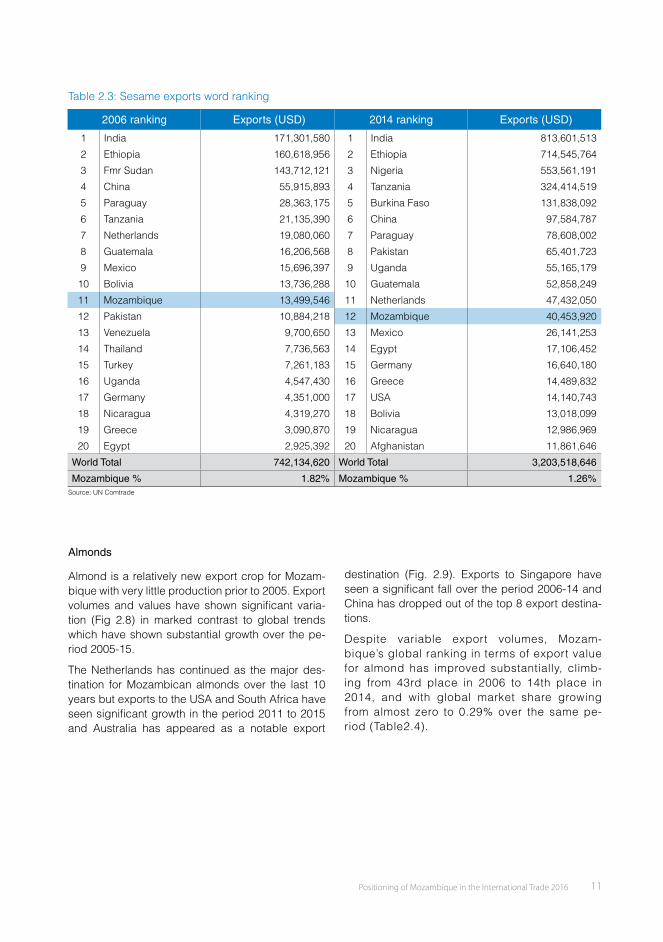
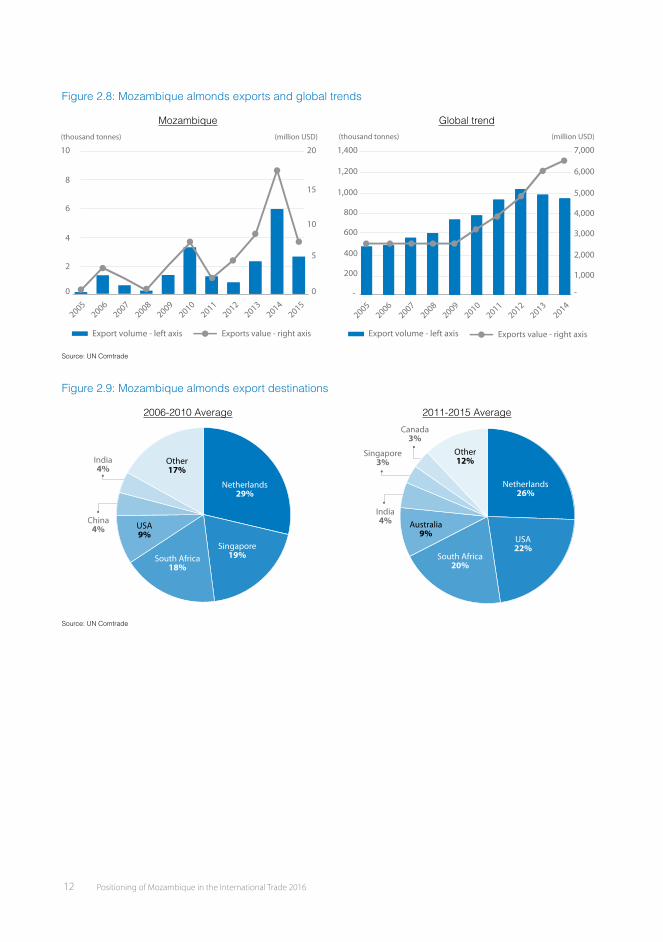
Almonds
Almond is a relatively new export crop for Mozam-bique with very little production prior to 2005. Export volumes and values have shown signifi cant varia-tion (Fig 2.8) in marked contrast to global trends which have shown substantial growth over the pe-riod 2005-15.
The Netherlands has continued as the major des-tination for Mozambican almonds over the last 10 years but exports to the USA and South Africa have seen signifi cant growth in the period 2011 to 2015 and Australia has appeared as a notable export
destination (Fig. 2.9). Exports to Singapore have seen a signifi cant fall over the period 2006-14 and China has dropped out of the top 8 export destina-tions.
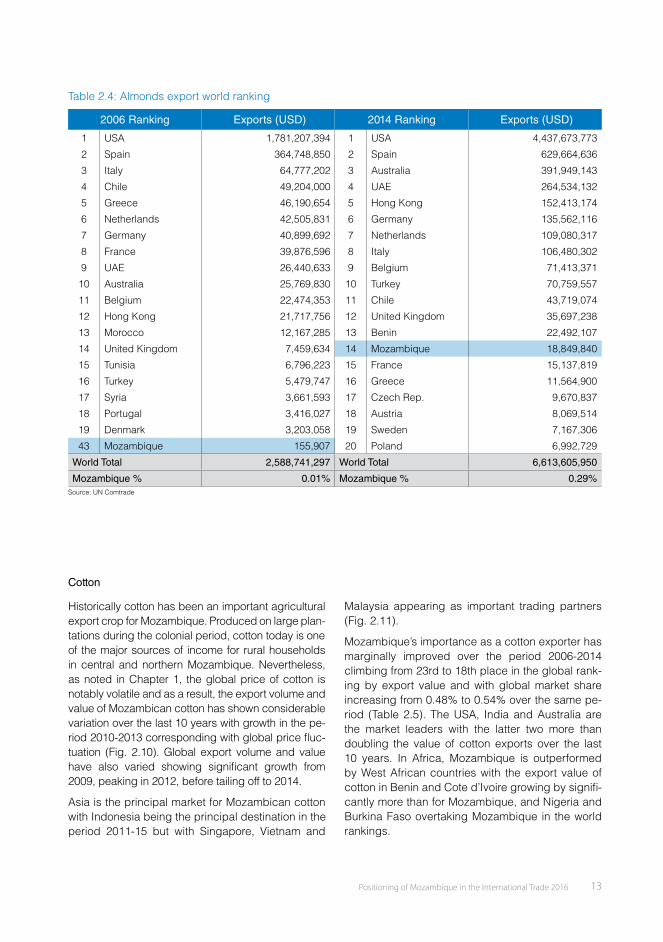
Despite variable export volumes, Mozam-bique’s global ranking in terms of export value for almond has improved substantially, climb-ing from 43rd place in 2006 to 14th place in 2014, and with global market share growing from almost zero to 0.29% over the same pe-riod (Table2.4).
10 Positioning of Mozambique in the International Trade 2016
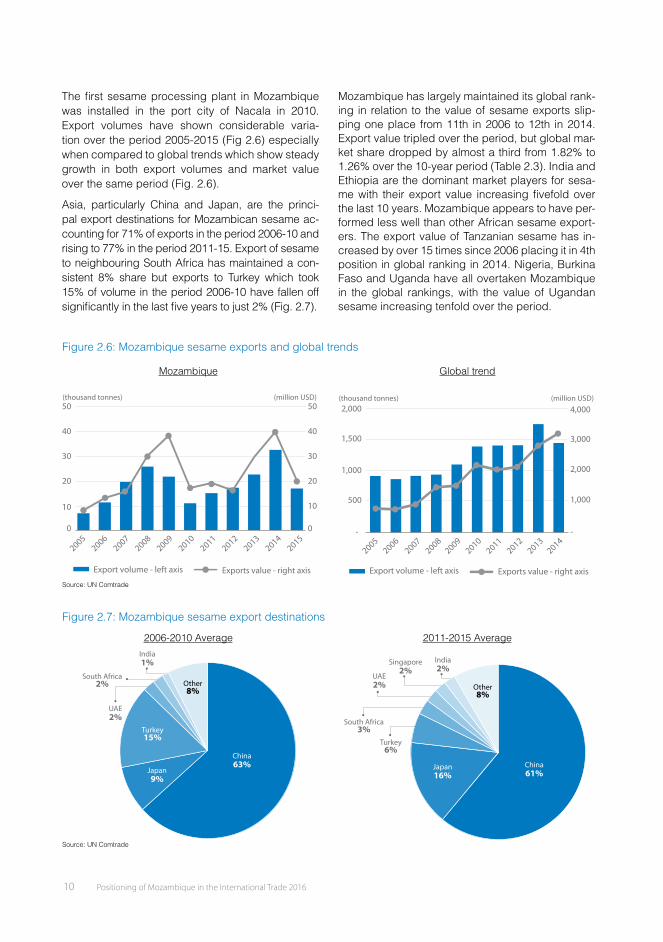
The fi rst sesame processing plant in Mozambique was installed in the port city of Nacala in 2010. Export volumes have shown considerable varia-tion over the period 2005-2015 (Fig 2.6) especially when compared to global trends which show steady growth in both export volumes and market value over the same period (Fig. 2.6).
Asia, particularly China and Japan, are the princi-pal export destinations for Mozambican sesame ac-counting for 71% of exports in the period 2006-10 and rising to 77% in the period 2011-15. Export of sesame to neighbouring South Africa has maintained a con-sistent 8% share but exports to Turkey which took 15% of volume in the period 2006-10 have fallen off signifi cantly in the last fi ve years to just 2% (Fig. 2.7).
Mozambique has largely maintained its global rank-ing in relation to the value of sesame exports slip-ping one place from 11th in 2006 to 12th in 2014. Export value tripled over the period, but global mar-ket share dropped by almost a third from 1.82% to 1.26% over the 10-year period (Table 2.3). India and Ethiopia are the dominant market players for sesa-me with their export value increasing fi vefold over the last 10 years. Mozambique appears to have per-formed less well than other African sesame export-ers. The export value of Tanzanian sesame has in-creased by over 15 times since 2006 placing it in 4th position in global ranking in 2014. Nigeria, Burkina Faso and Uganda have all overtaken Mozambique in the global rankings, with the value of Ugandan sesame increasing tenfold over the period.
Figure 2.6: Mozambique sesame exports and global trends
Mozambique Global trend
Export volume - left axis Exports value - right axis
0
10
20
30
40
50(thousand tonnes) (million USD)
0
10
20
30
40
50
20052006
20072008
20092010
20112012
20132014
2015
Export volume - left axis Exports value - right axis
- -
500
1,000
1,500
2,000(thousand tonnes) (million USD)
1,000
2,000
3,000
4,000
20052006
20072008
20092010
20112012
20132014
Source: UN Comtrade
Figure 2.7: Mozambique sesame export destinations
2006-2010 Average 2011-2015 Average
South Africa2%
Turkey15%
China63%
India1%
Japan9%
UAE2%
Other8%
South Africa3%
Turkey6%
China61%
Singapore2%
India2%
Japan16%
UAE2% Other
8%
Source: UN Comtrade
Positioning of Mozambique in the International Trade 2016 11
Table 2.3: Sesame exports word ranking
2006 ranking Exports (USD) 2014 ranking Exports (USD)
1 India 171,301,580 1 India 813,601,513
2 Ethiopia 160,618,956 2 Ethiopia 714,545,764
3 Fmr Sudan 143,712,121 3 Nigeria 553,561,191
4 China 55,915,893 4 Tanzania 324,414,519
5 Paraguay 28,363,175 5 Burkina Faso 131,838,092
6 Tanzania 21,135,390 6 China 97,584,787
7 Netherlands 19,080,060 7 Paraguay 78,608,002
8 Guatemala 16,206,568 8 Pakistan 65,401,723
9 Mexico 15,696,397 9 Uganda 55,165,179
10 Bolivia 13,736,288 10 Guatemala 52,858,249
11 Mozambique 13,499,546 11 Netherlands 47,432,050
12 Pakistan 10,884,218 12 Mozambique 40,453,920
13 Venezuela 9,700,650 13 Mexico 26,141,253
14 Thailand 7,736,563 14 Egypt 17,106,452
15 Turkey 7,261,183 15 Germany 16,640,180
16 Uganda 4,547,430 16 Greece 14,489,832
17 Germany 4,351,000 17 USA 14,140,743
18 Nicaragua 4,319,270 18 Bolivia 13,018,099
19 Greece 3,090,870 19 Nicaragua 12,986,969
20 Egypt 2,925,392 20 Afghanistan 11,861,646
World Total 742,134,620 World Total 3,203,518,646
Mozambique % 1.82% Mozambique % 1.26%Source: UN Comtrade
Almonds
Almond is a relatively new export crop for Mozam-bique with very little production prior to 2005. Export volumes and values have shown signifi cant varia-tion (Fig 2.8) in marked contrast to global trends which have shown substantial growth over the pe-riod 2005-15.
The Netherlands has continued as the major des-tination for Mozambican almonds over the last 10 years but exports to the USA and South Africa have seen signifi cant growth in the period 2011 to 2015 and Australia has appeared as a notable export
destination (Fig. 2.9). Exports to Singapore have seen a signifi cant fall over the period 2006-14 and China has dropped out of the top 8 export destina-tions.
Despite variable export volumes, Mozam-bique’s global ranking in terms of export value for almond has improved substantially, climb-ing from 43rd place in 2006 to 14th place in 2014, and with global market share growing from almost zero to 0.29% over the same pe-riod (Table2.4).
Positioning of Mozambique in the International Trade 2016 13
Table 2.4: Almonds export world ranking
2006 Ranking Exports (USD) 2014 Ranking Exports (USD)
1 USA 1,781,207,394 1 USA 4,437,673,773
2 Spain 364,748,850 2 Spain 629,664,636
3 Italy 64,777,202 3 Australia 391,949,143
4 Chile 49,204,000 4 UAE 264,534,132
5 Greece 46,190,654 5 Hong Kong 152,413,174
6 Netherlands 42,505,831 6 Germany 135,562,116
7 Germany 40,899,692 7 Netherlands 109,080,317
8 France 39,876,596 8 Italy 106,480,302
9 UAE 26,440,633 9 Belgium 71,413,371
10 Australia 25,769,830 10 Turkey 70,759,557
11 Belgium 22,474,353 11 Chile 43,719,074
12 Hong Kong 21,717,756 12 United Kingdom 35,697,238
13 Morocco 12,167,285 13 Benin 22,492,107
14 United Kingdom 7,459,634 14 Mozambique 18,849,840
15 Tunisia 6,796,223 15 France 15,137,819
16 Turkey 5,479,747 16 Greece 11,564,900
17 Syria 3,661,593 17 Czech Rep. 9,670,837
18 Portugal 3,416,027 18 Austria 8,069,514
19 Denmark 3,203,058 19 Sweden 7,167,306
43 Mozambique 155,907 20 Poland 6,992,729
World Total 2,588,741,297 World Total 6,613,605,950
Mozambique % 0.01% Mozambique % 0.29%Source: UN Comtrade
Cotton
Historically cotton has been an important agricultural export crop for Mozambique. Produced on large plan-tations during the colonial period, cotton today is one of the major sources of income for rural households in central and northern Mozambique. Nevertheless, as noted in Chapter 1, the global price of cotton is notably volatile and as a result, the export volume and value of Mozambican cotton has shown considerable variation over the last 10 years with growth in the pe-riod 2010-2013 corresponding with global price fl uc-tuation (Fig. 2.10). Global export volume and value have also varied showing signifi cant growth from 2009, peaking in 2012, before tailing off to 2014.
Asia is the principal market for Mozambican cotton with Indonesia being the principal destination in the period 2011-15 but with Singapore, Vietnam and
Malaysia appearing as important trading partners (Fig. 2.11).
Mozambique’s importance as a cotton exporter has marginally improved over the period 2006-2014 climbing from 23rd to 18th place in the global rank-ing by export value and with global market share increasing from 0.48% to 0.54% over the same pe-riod (Table 2.5). The USA, India and Australia are the market leaders with the latter two more than doubling the value of cotton exports over the last 10 years. In Africa, Mozambique is outperformed by West African countries with the export value of cotton in Benin and Cote d’Ivoire growing by signifi -cantly more than for Mozambique, and Nigeria and Burkina Faso overtaking Mozambique in the world rankings.
12 Positioning of Mozambique in the International Trade 2016
Figure 2.8: Mozambique almonds exports and global trends
Mozambique Global trend
Export volume - left axis Exports value - right axis
0
2
4
6
8
10
0
5
10
15
20
20052006
20072008
20092010
20112012
20132014
2015
(thousand tonnes) (million USD)
Export volume - left axis Exports value - right axis
20052006
20072008
20092010
20112012
20132014
-
1,000
2,000
3,000
4,000
5,000
6,000
7,000
-
200
400
600
800
1,000
1,200
1,400
(thousand tonnes) (million USD)
Source: UN Comtrade
Figure 2.9: Mozambique almonds export destinations
2006-2010 Average 2011-2015 Average
South Africa18%
China4%
India4%
Other17%
Netherlands29%
Singapore19%
USA9%
Canada3%
South Africa20%
India4%
Other12%
Netherlands26%
Australia9%
Singapore3%
USA22%
Source: UN Comtrade
Positioning of Mozambique in the International Trade 2016 13
Table 2.4: Almonds export world ranking
2006 Ranking Exports (USD) 2014 Ranking Exports (USD)
1 USA 1,781,207,394 1 USA 4,437,673,773
2 Spain 364,748,850 2 Spain 629,664,636
3 Italy 64,777,202 3 Australia 391,949,143
4 Chile 49,204,000 4 UAE 264,534,132
5 Greece 46,190,654 5 Hong Kong 152,413,174
6 Netherlands 42,505,831 6 Germany 135,562,116
7 Germany 40,899,692 7 Netherlands 109,080,317
8 France 39,876,596 8 Italy 106,480,302
9 UAE 26,440,633 9 Belgium 71,413,371
10 Australia 25,769,830 10 Turkey 70,759,557
11 Belgium 22,474,353 11 Chile 43,719,074
12 Hong Kong 21,717,756 12 United Kingdom 35,697,238
13 Morocco 12,167,285 13 Benin 22,492,107
14 United Kingdom 7,459,634 14 Mozambique 18,849,840
15 Tunisia 6,796,223 15 France 15,137,819
16 Turkey 5,479,747 16 Greece 11,564,900
17 Syria 3,661,593 17 Czech Rep. 9,670,837
18 Portugal 3,416,027 18 Austria 8,069,514
19 Denmark 3,203,058 19 Sweden 7,167,306
43 Mozambique 155,907 20 Poland 6,992,729
World Total 2,588,741,297 World Total 6,613,605,950
Mozambique % 0.01% Mozambique % 0.29%Source: UN Comtrade
Cotton
Historically cotton has been an important agricultural export crop for Mozambique. Produced on large plan-tations during the colonial period, cotton today is one of the major sources of income for rural households in central and northern Mozambique. Nevertheless, as noted in Chapter 1, the global price of cotton is notably volatile and as a result, the export volume and value of Mozambican cotton has shown considerable variation over the last 10 years with growth in the pe-riod 2010-2013 corresponding with global price fl uc-tuation (Fig. 2.10). Global export volume and value have also varied showing signifi cant growth from 2009, peaking in 2012, before tailing off to 2014.
Asia is the principal market for Mozambican cotton with Indonesia being the principal destination in the period 2011-15 but with Singapore, Vietnam and
Malaysia appearing as important trading partners (Fig. 2.11).
Mozambique’s importance as a cotton exporter has marginally improved over the period 2006-2014 climbing from 23rd to 18th place in the global rank-ing by export value and with global market share increasing from 0.48% to 0.54% over the same pe-riod (Table 2.5). The USA, India and Australia are the market leaders with the latter two more than doubling the value of cotton exports over the last 10 years. In Africa, Mozambique is outperformed by West African countries with the export value of cotton in Benin and Cote d’Ivoire growing by signifi -cantly more than for Mozambique, and Nigeria and Burkina Faso overtaking Mozambique in the world rankings.
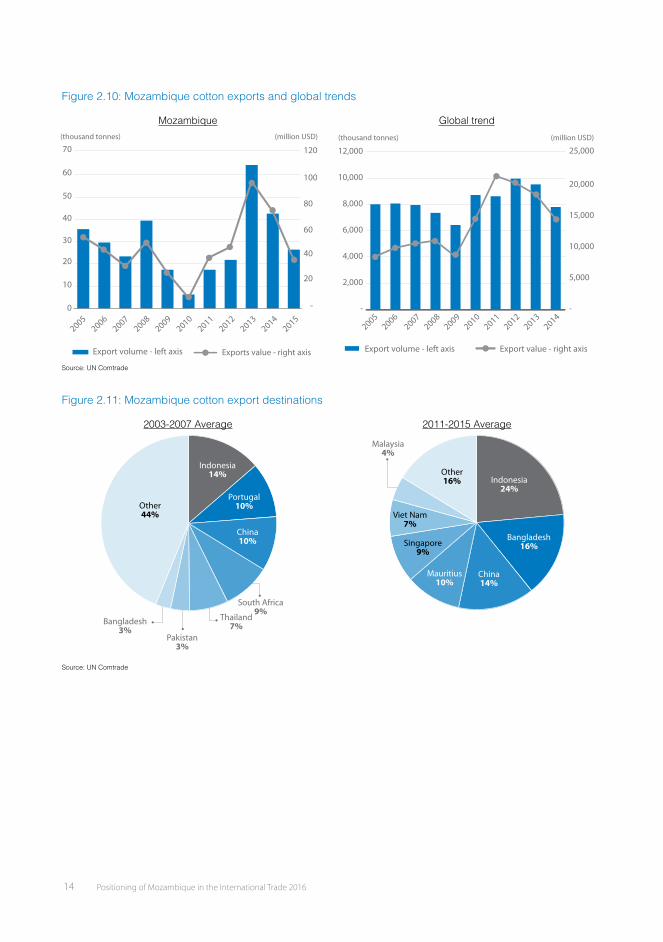
Positioning of Mozambique in the International Trade 2016 15
Table 2.5: Cotton exports world ranking
2006 ranking Exports (USD) 2014 ranking Exports (USD)
1 USA 4,641,121,974 1 USA 4,501,584,351
2 India 992,939,039 2 India 2,880,677,123
3 Australia 764,544,644 3 Australia 1,812,264,006
4 Greece 414,035,736 4 Brazil 1,359,826,889
5 Brazil 342,721,628 5 Burkina Faso 496,611,800
6 Mali 254,078,848 6 Greece 417,961,866
7 Syria 194,266,487 7 Cote d’Ivoire 323,251,535
8 Kazakhstan 180,750,202 8 Benin 288,167,103
9 Turkey 138,555,686 9 Pakistan 251,777,123
10 Egypt 132,516,874 10 Nigeria 181,961,335
11 Pakistan 116,820,039 11 Turkey 170,720,195
12 Cote d’Ivoire 113,524,524 12 Cameroon 160,565,582
13 Cameroon 103,741,608 13 Spain 153,810,726
14 Spain 97,902,716 14 Argentina 120,577,571
15 Benin 90,837,230 15 UAE 89,942,916
16 Zimbabwe 83,120,690 16 Egypt 89,613,305
17 Fmr Sudan 71,116,956 17 Kazakhstan 80,264,846
18 Tanzania 69,077,820 18 Mozambique 77,354,954
19 Mexico 62,996,162 19 Germany 75,878,216
23 Mozambique 45,691,101 20 Zambia 67,173,377
World Total 9,599,912,474 World Total 14,287,068,758
Mozambique % 0.48% Mozambique % 0.54%Source: UN Comtrade
Banana
Bananas are one of the most common fruit crops grown in Mozambique, but like Sesame, the com-mercialisation of Banana is a fairly recent develop-ment and banana is a relatively new export crop for the country. Approximately 60% of banana produc-tion is undertaken on medium to large commercial plantations mainly in Maputo, Manica and Nampula Provinces. Export volume and value of Banana has grown signifi cantly over the last 10 years from al-most zero in 2004 outperforming the global trend (Figs. 2.12).
The market for Mozambican banana over the last 10 years has been dominated by neighbouring South
Africa as the principle export destination, although in the last 5 years the market has become more di-versifi ed with the notable entry of the Gulf States (Fig. 2.13).
Growth in the value of Mozambique’s banana exports has been impressive in the last ten years with the country climbing in world ranking from 53rd place in 2006 to 20th place in 2014 and market share growing from nearly zero to 0.41% over the same period (Ta-ble 2.6). It appears that Mozambique has few com-petitors in the Southern Africa region and looking to Africa as a whole, Mozambique is outperformed in West Africa only by Cameroon and Cote d’Ivoire.
14 Positioning of Mozambique in the International Trade 2016
Figure 2.10: Mozambique cotton exports and global trends
Mozambique Global trend
Export volume - left axis Exports value - right axis
20
10
0
30
40
50
60
70
40
20
-
60
80
100
120
20052006
20072008
20092010
20112012
20132014
2015
(thousand tonnes) (million USD)
Export volume - left axis Export value - right axis
-
5,000
10,000
15,000
20,000
25,000
-
2,000
4,000
6,000
8,000
12,000
10,000
20052006
20072008
20092010
20112012
20132014
(thousand tonnes) (million USD)
Source: UN Comtrade
Figure 2.11: Mozambique cotton export destinations
2003-2007 Average 2011-2015 Average
Indonesia14%
Bangladesh3%
Pakistan3%
China10%
Portugal10%
Thailand7%
Other44%
South Africa9%
China14%
Indonesia24%
Bangladesh16%
Other16%
Viet Nam7%
Singapore9%
Mauritius10%
Malaysia4%
Source: UN Comtrade
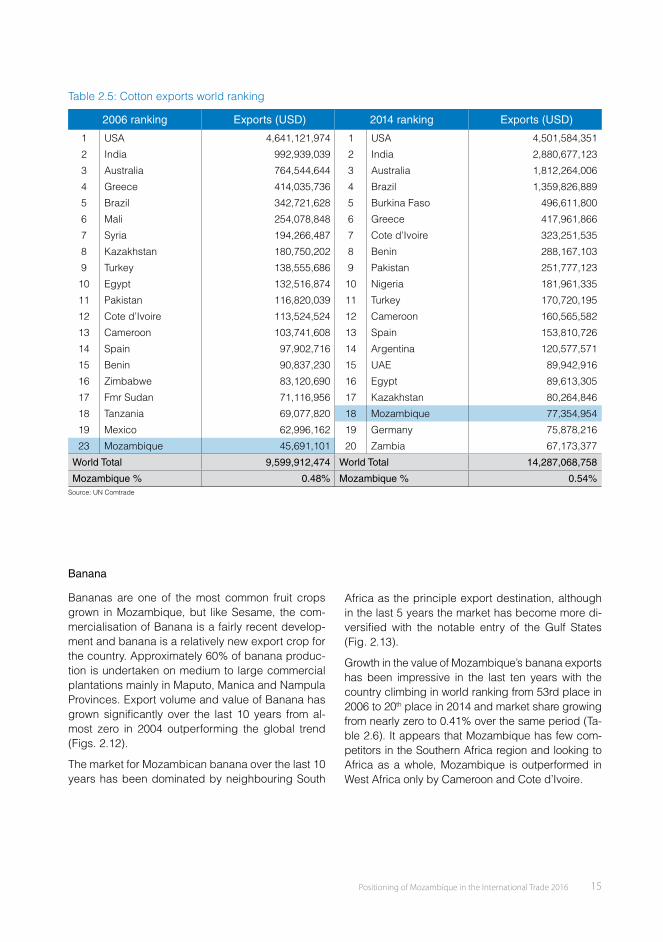
Positioning of Mozambique in the International Trade 2016 15
Table 2.5: Cotton exports world ranking
2006 ranking Exports (USD) 2014 ranking Exports (USD)
1 USA 4,641,121,974 1 USA 4,501,584,351
2 India 992,939,039 2 India 2,880,677,123
3 Australia 764,544,644 3 Australia 1,812,264,006
4 Greece 414,035,736 4 Brazil 1,359,826,889
5 Brazil 342,721,628 5 Burkina Faso 496,611,800
6 Mali 254,078,848 6 Greece 417,961,866
7 Syria 194,266,487 7 Cote d’Ivoire 323,251,535
8 Kazakhstan 180,750,202 8 Benin 288,167,103
9 Turkey 138,555,686 9 Pakistan 251,777,123
10 Egypt 132,516,874 10 Nigeria 181,961,335
11 Pakistan 116,820,039 11 Turkey 170,720,195
12 Cote d’Ivoire 113,524,524 12 Cameroon 160,565,582
13 Cameroon 103,741,608 13 Spain 153,810,726
14 Spain 97,902,716 14 Argentina 120,577,571
15 Benin 90,837,230 15 UAE 89,942,916
16 Zimbabwe 83,120,690 16 Egypt 89,613,305
17 Fmr Sudan 71,116,956 17 Kazakhstan 80,264,846
18 Tanzania 69,077,820 18 Mozambique 77,354,954
19 Mexico 62,996,162 19 Germany 75,878,216
23 Mozambique 45,691,101 20 Zambia 67,173,377
World Total 9,599,912,474 World Total 14,287,068,758
Mozambique % 0.48% Mozambique % 0.54%Source: UN Comtrade
Banana
Bananas are one of the most common fruit crops grown in Mozambique, but like Sesame, the com-mercialisation of Banana is a fairly recent develop-ment and banana is a relatively new export crop for the country. Approximately 60% of banana produc-tion is undertaken on medium to large commercial plantations mainly in Maputo, Manica and Nampula Provinces. Export volume and value of Banana has grown signifi cantly over the last 10 years from al-most zero in 2004 outperforming the global trend (Figs. 2.12).
The market for Mozambican banana over the last 10 years has been dominated by neighbouring South
Africa as the principle export destination, although in the last 5 years the market has become more di-versifi ed with the notable entry of the Gulf States (Fig. 2.13).
Growth in the value of Mozambique’s banana exports has been impressive in the last ten years with the country climbing in world ranking from 53rd place in 2006 to 20th place in 2014 and market share growing from nearly zero to 0.41% over the same period (Ta-ble 2.6). It appears that Mozambique has few com-petitors in the Southern Africa region and looking to Africa as a whole, Mozambique is outperformed in West Africa only by Cameroon and Cote d’Ivoire.

Positioning of Mozambique in the International Trade 2016 17
Table 2.6: Banana exports world ranking
2006 ranking Exports (USD) 2014 ranking Exports (USD)
1 Ecuador 1,213,576,373 1 Ecuador 2,620,664,069
2 Belgium 1,151,309,846 2 Belgium 1,335,550,929
3 Costa Rica 645,152,006 3 Philippines 1,137,315,622
4 Colombia 525,457,557 4 Colombia 835,546,254
5 Germany 406,015,000 5 Guatemala 721,443,494
6 Philippines 405,444,333 6 USA 470,246,918
7 USA 240,069,557 7 Germany 391,873,334
8 Guatemala 233,031,692 8 Dominican Rep. 331,572,516
9 Honduras 131,525,973 9 Netherlands 249,783,121
10 Ghana 118,945,693 10 France 246,041,287
11 Cote d’Ivoire 115,625,889 11 Honduras 221,616,975
12 France 114,726,827 12 Mexico 179,693,289
13 Netherlands 112,765,451 13 Cote d’Ivoire 139,788,913
14 Panama 110,162,330 14 Spain 139,233,789
15 Italy 104,865,505 15 Peru 119,415,764
16 Cameroon 64,653,451 16 Panama 97,900,985
17 Dominican Rep. 58,149,595 17 Cameroon 77,074,916
18 Sweden 45,166,669 18 Italy 60,192,897
19 Brazil 38,555,322 19 Czech Rep. 49,747,656
53 Mozambique 1,670,994 20 Mozambique 41,533,060
World Total 6,251,811,011 World Total 10,080,297,698
Mozambique % 0.03% Mozambique % 0.41%Source: UN Comtrade
50% over the same period (Fig. 2.14). The glob-al sugar price is subject to volatility and due to excess supply has fallen since 2011. The value of Mozambican sugar exports has mirrored this trend.
Europe is the principle destination for Mozambican sugar exports with over 70% of exports going to Portugal, Spain and Italy in the period 2011 to 2015 and these markets growing signifi cantly over the last 10 years. (Fig. 2.15)
Mozambique’s global ranking in the sugar market by export value has improved climbing, from 69th place in 2006 to 64th place in 2014 (Table 2.7).
Sugar
Historically, Mozambique has been a major sugar producer but by 1980 production had fallen to a sig-nifi cant low level as a result of the civil war. The re-vitalisation of Mozambique’s sugar industry is con-sidered a major success story attracting investment from South Africa and Mauritius.
Sugar is both exported, as cane or syrup (molas-ses), and imported as refi ned, white sugar mainly to meet demand from beverage companies and a number of breweries. Exports by volume have ris-en over the last ten years to over 300,000 tonnes in 2015 and have outperformed the global trend where volumes have increased by approximately
16 Positioning of Mozambique in the International Trade 2016
Figure 2.12: Mozambique banana exports and global trends
Mozambique Global trend
Export volume - left axis Export value - right axis
-
20
10
30
40
50
-
30
60
90
120
150
20042006
20082010
20122013
20142015
(thousand tonnes) (million USD)
Export volume - left axis Export value - right axis
-
6,000
3,000
9,000
12,000
15,000
18,000
-
5,000
10,000
15,000
20,000
30,000
25,000
20052006
20072008
20092010
20112012
20132014
(thousand tonnes) (million USD)
Source: UN Comtrade
Figure 2.13: Mozambique banana export destination
2006-2010 Average 2012-2015 Average
South Africa82%
Other2%
Iran16%
South Africa69%
Kuwait2%
Other3%
UAE4%
Iran4%
Saudi Arabia18%
Source: UN Comtrade
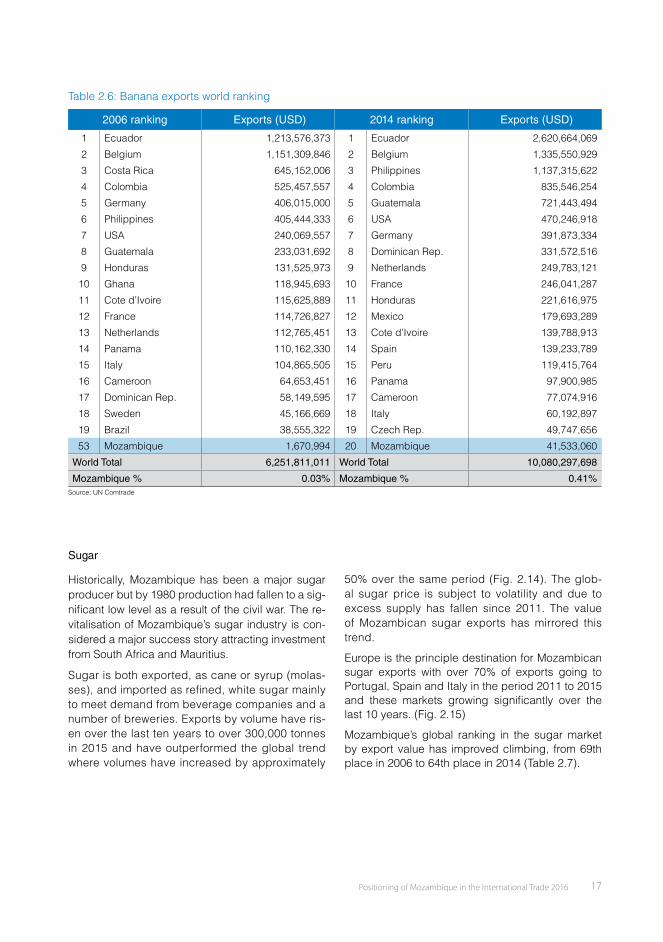
Positioning of Mozambique in the International Trade 2016 17
Table 2.6: Banana exports world ranking
2006 ranking Exports (USD) 2014 ranking Exports (USD)
1 Ecuador 1,213,576,373 1 Ecuador 2,620,664,069
2 Belgium 1,151,309,846 2 Belgium 1,335,550,929
3 Costa Rica 645,152,006 3 Philippines 1,137,315,622
4 Colombia 525,457,557 4 Colombia 835,546,254
5 Germany 406,015,000 5 Guatemala 721,443,494
6 Philippines 405,444,333 6 USA 470,246,918
7 USA 240,069,557 7 Germany 391,873,334
8 Guatemala 233,031,692 8 Dominican Rep. 331,572,516
9 Honduras 131,525,973 9 Netherlands 249,783,121
10 Ghana 118,945,693 10 France 246,041,287
11 Cote d’Ivoire 115,625,889 11 Honduras 221,616,975
12 France 114,726,827 12 Mexico 179,693,289
13 Netherlands 112,765,451 13 Cote d’Ivoire 139,788,913
14 Panama 110,162,330 14 Spain 139,233,789
15 Italy 104,865,505 15 Peru 119,415,764
16 Cameroon 64,653,451 16 Panama 97,900,985
17 Dominican Rep. 58,149,595 17 Cameroon 77,074,916
18 Sweden 45,166,669 18 Italy 60,192,897
19 Brazil 38,555,322 19 Czech Rep. 49,747,656
53 Mozambique 1,670,994 20 Mozambique 41,533,060
World Total 6,251,811,011 World Total 10,080,297,698
Mozambique % 0.03% Mozambique % 0.41%Source: UN Comtrade
50% over the same period (Fig. 2.14). The glob-al sugar price is subject to volatility and due to excess supply has fallen since 2011. The value of Mozambican sugar exports has mirrored this trend.
Europe is the principle destination for Mozambican sugar exports with over 70% of exports going to Portugal, Spain and Italy in the period 2011 to 2015 and these markets growing signifi cantly over the last 10 years. (Fig. 2.15)
Mozambique’s global ranking in the sugar market by export value has improved climbing, from 69th place in 2006 to 64th place in 2014 (Table 2.7).
Sugar
Historically, Mozambique has been a major sugar producer but by 1980 production had fallen to a sig-nifi cant low level as a result of the civil war. The re-vitalisation of Mozambique’s sugar industry is con-sidered a major success story attracting investment from South Africa and Mauritius.
Sugar is both exported, as cane or syrup (molas-ses), and imported as refi ned, white sugar mainly to meet demand from beverage companies and a number of breweries. Exports by volume have ris-en over the last ten years to over 300,000 tonnes in 2015 and have outperformed the global trend where volumes have increased by approximately
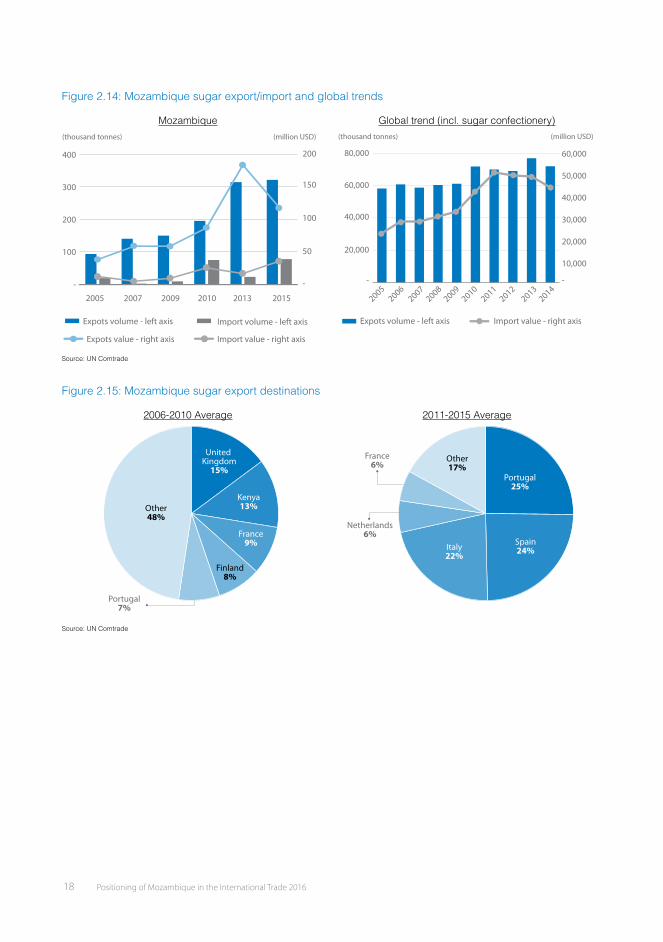
Positioning of Mozambique in the International Trade 2016 19
Table 2.7: Sugar exports world ranking2006 ranking Exports (USD) 2014 ranking Exports (USD)
1 Brazil 6.347.522.140 1 Brazil 9.616.252.505
2 France 1.845.479.894 2 Thailand 2.971.493.438
3 Germany 1.621.460.000 3 Germany 2.518.813.552
4 Belgium 1.411.180.375 4 USA 2.267.758.308
5 USA 1.042.843.156 5 Netherlands 1.818.248.331
6 Thailand 873.841.792 6 France 1.729.429.451
7 Netherlands 866.789.002 7 Mexico 1.721.427.209
8 Mexico 857.568.289 8 China 1.540.350.663
9 Canada 712.393.121 9 Belgium 1.364.298.276
10 United Kingdom 710.806.172 10 India 1.306.197.907
11 India 680.052.657 11 Guatemala 1.051.411.878
12 Colombia 568.786.182 12 Canada 934.930.883
13 Spain 520.577.315 13 Colombia 819.552.311
14 Poland 480.908.894 14 Spain 720.900.869
15 China 462.420.105 15 Poland 679.670.253
16 Italy 407.703.221 16 Turkey 669.764.958
17 United Arab Emirates 404.844.228 17 United Kingdom 645.645.649
18 South Africa 397.755.299 18 United Arab Emirates 576.019.561
19 Mauritius 357.019.910 19 South Africa 526.583.005
69 Mozambique 48.010.267 64 Mozambique 86.484.255
Grand Total 28.259.217.357 Grand Total 44.354.416.786
Mozambique % 0,17% Mozambique % 0,19%
Source: UN Comtrade
Crustaceans
Mozambique is famous for its seafood with prawn and shrimp accounting for approximately 80% of export volume of crustaceans. Nevertheless, export volumes and value have fallen by two thirds over the last ten years in contrast to global trends where volumes have steadily increased and export values have risen signifi cantly (Figs. 2.16).
Europe is the principal export destination for Mo-zambique’s crustaceans with Spain and Portugal consistently taking over 50% of export volume (Fig. 2.17). However, the importance of these markets
has reduced over the last 5 years with increasing volumes being exported to Asia and notably to Chi-na which accounts for 18% of export volume.
The decline in the export value of Mozambican crustacean is refl ected its global ranking that has fallen from 30th place in 2006 to 44th place in 2014 with a fall in global market share of more than two thirds from 0.63% to 0.19% over the same period (Table 2.8). On a more positive note, Mozambique appears to have few regional competitors in this sector.
18 Positioning of Mozambique in the International Trade 2016
Figure 2.14: Mozambique sugar export/import and global trends
Mozambique Global trend (incl. sugar confectionery)
2005 2007 2009 20132010 2015
Expots volume - left axis Import volume - left axis
Expots value - right axis Import value - right axis
-
50
100
150
200
-
100
200
300
400
(thousand tonnes) (million USD)
Expots volume - left axis Import value - right axis
40,000
60,000
80,000
20,000
-
10,000
20,000
30,000
40,000
50,000
60,000
-
20052006
20072008
20092010
20132012
20112014
(thousand tonnes) (million USD)
Source: UN Comtrade
Figure 2.15: Mozambique sugar export destinations
2006-2010 Average 2011-2015 Average
Portugal7%
Kenya13%
France9%
Finland8%
Other48%
United Kingdom15%
Netherlands6%
Portugal25%
France6%
Spain24%Italy
22%
Other17%
Source: UN Comtrade
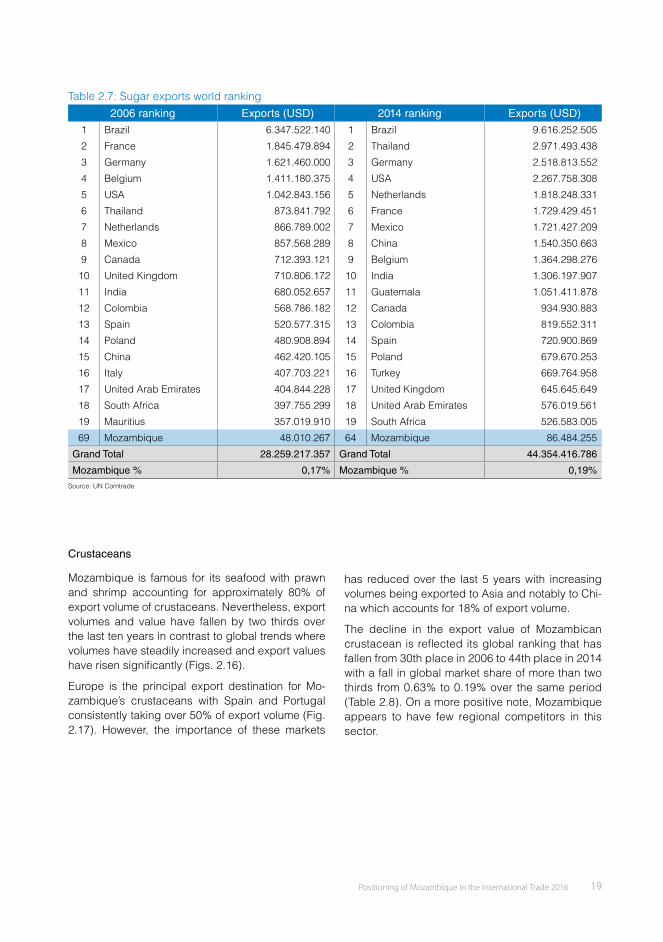
Positioning of Mozambique in the International Trade 2016 19
Table 2.7: Sugar exports world ranking2006 ranking Exports (USD) 2014 ranking Exports (USD)
1 Brazil 6.347.522.140 1 Brazil 9.616.252.505
2 France 1.845.479.894 2 Thailand 2.971.493.438
3 Germany 1.621.460.000 3 Germany 2.518.813.552
4 Belgium 1.411.180.375 4 USA 2.267.758.308
5 USA 1.042.843.156 5 Netherlands 1.818.248.331
6 Thailand 873.841.792 6 France 1.729.429.451
7 Netherlands 866.789.002 7 Mexico 1.721.427.209
8 Mexico 857.568.289 8 China 1.540.350.663
9 Canada 712.393.121 9 Belgium 1.364.298.276
10 United Kingdom 710.806.172 10 India 1.306.197.907
11 India 680.052.657 11 Guatemala 1.051.411.878
12 Colombia 568.786.182 12 Canada 934.930.883
13 Spain 520.577.315 13 Colombia 819.552.311
14 Poland 480.908.894 14 Spain 720.900.869
15 China 462.420.105 15 Poland 679.670.253
16 Italy 407.703.221 16 Turkey 669.764.958
17 United Arab Emirates 404.844.228 17 United Kingdom 645.645.649
18 South Africa 397.755.299 18 United Arab Emirates 576.019.561
19 Mauritius 357.019.910 19 South Africa 526.583.005
69 Mozambique 48.010.267 64 Mozambique 86.484.255
Grand Total 28.259.217.357 Grand Total 44.354.416.786
Mozambique % 0,17% Mozambique % 0,19%
Source: UN Comtrade
Crustaceans
Mozambique is famous for its seafood with prawn and shrimp accounting for approximately 80% of export volume of crustaceans. Nevertheless, export volumes and value have fallen by two thirds over the last ten years in contrast to global trends where volumes have steadily increased and export values have risen signifi cantly (Figs. 2.16).
Europe is the principal export destination for Mo-zambique’s crustaceans with Spain and Portugal consistently taking over 50% of export volume (Fig. 2.17). However, the importance of these markets
has reduced over the last 5 years with increasing volumes being exported to Asia and notably to Chi-na which accounts for 18% of export volume.
The decline in the export value of Mozambican crustacean is refl ected its global ranking that has fallen from 30th place in 2006 to 44th place in 2014 with a fall in global market share of more than two thirds from 0.63% to 0.19% over the same period (Table 2.8). On a more positive note, Mozambique appears to have few regional competitors in this sector.
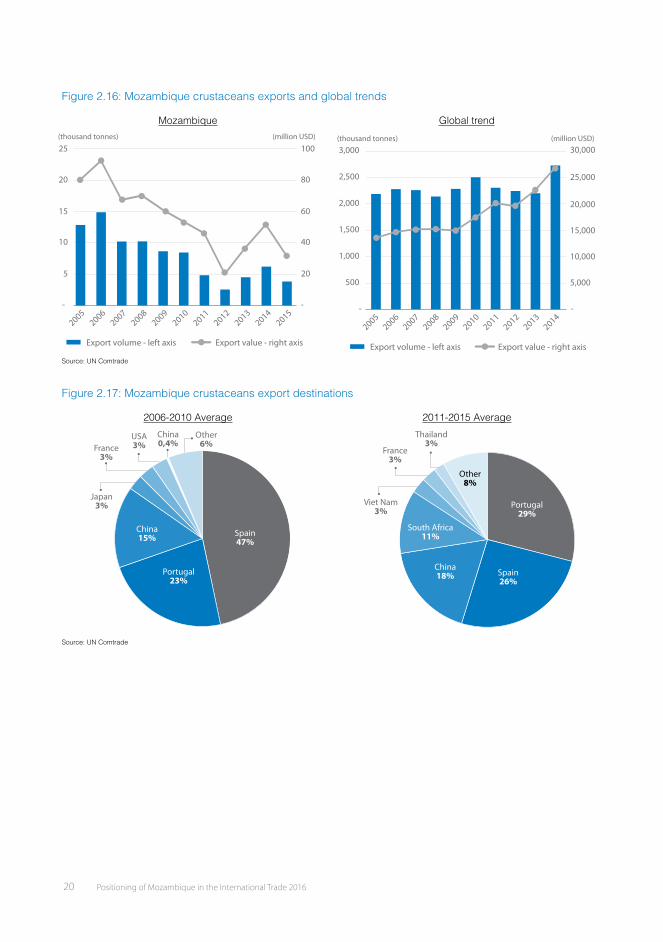
Positioning of Mozambique in the International Trade 2016 21
Table 2.8: Crustaceans exports world ranking
2006 ranking Exports (USD) 2014 ranking Exports (USD)
1 Canada 1,444,389,184 1 India 3,834,859,472
2 Viet Nam 1,421,035,051 2 Ecuador 2,580,590,424
3 Thailand 1,192,221,015 3 Viet Nam 2,553,754,261
4 Indonesia 1,067,782,393 4 Canada 2,295,764,945
5 India 922,800,349 5 China 2,043,897,702
6 Ecuador 591,886,549 6 Indonesia 1,815,229,830
7 USA 588,027,358 7 USA 1,138,532,729
8 Bangladesh 482,589,875 8 Thailand 966,598,099
9 Australia 481,733,373 9 Argentina 776,825,030
10 United Kingdom 467,255,007 10 Australia 699,795,116
11 Denmark 418,859,591 11 Netherlands 621,758,630
12 China 398,469,866 12 Russian Federation 548,821,139
13 Mexico 374,697,119 13 Denmark 491,329,091
14 Argentina 371,517,765 14 United Kingdom 441,933,755
15 Belgium 360,933,410 15 Mexico 423,084,461
16 Netherlands 315,433,450 16 Malaysia 418,278,046
17 Malaysia 286,190,492 17 Belgium 413,414,836
18 Brazil 241,114,229 18 Spain 409,786,537
19 Spain 239,386,924 19 Honduras 345,303,963
30 Mozambique 90,802,806 44 Mozambique 50,769,320
World Total 14,340,753,842 World Total 26,304,890,877
Mozambique % 0.63% Mozambique % 0.19%Source: UN Comtrade
2015 with volume increasing fi vefold over the pe-riod. As Figure 2.18 illustrates, there is a high cor-relation between the increase in food imports and population growth.
2.3 Main Food Imports
Mozambique is a net importer of basic foods includ-ing cereals (maize, wheat, and rice) and substan-tial quantities of meat and livestock products. Food imports have risen substantially between 2001 and
20 Positioning of Mozambique in the International Trade 2016
Figure 2.16: Mozambique crustaceans exports and global trends
Mozambique Global trend
Export volume - left axis Export value - right axis
-
40
20
60
80
100
-
5
10
15
20
25
20052006
20072008
20092010
20112012
20132014
2015
(thousand tonnes) (million USD)
Export volume - left axis Export value - right axis
-
10,000
5,000
15,000
20,000
25,000
30,000
-
500
1,000
1,500
2,000
3,000
2,500
20052006
20072008
20092010
20112012
20132014
(thousand tonnes) (million USD)
Source: UN Comtrade
Figure 2.17: Mozambique crustaceans export destinations
2006-2010 Average 2011-2015 Average
China15%
France3%
Japan3%
Portugal23%
USA3%
China0,4%
Spain47%
Other6%
South Africa11%
China18%
France3%
Thailand3%
Viet Nam3%
Portugal29%
Spain26%
Other8%
Source: UN Comtrade

Positioning of Mozambique in the International Trade 2016 21
Table 2.8: Crustaceans exports world ranking
2006 ranking Exports (USD) 2014 ranking Exports (USD)
1 Canada 1,444,389,184 1 India 3,834,859,472
2 Viet Nam 1,421,035,051 2 Ecuador 2,580,590,424
3 Thailand 1,192,221,015 3 Viet Nam 2,553,754,261
4 Indonesia 1,067,782,393 4 Canada 2,295,764,945
5 India 922,800,349 5 China 2,043,897,702
6 Ecuador 591,886,549 6 Indonesia 1,815,229,830
7 USA 588,027,358 7 USA 1,138,532,729
8 Bangladesh 482,589,875 8 Thailand 966,598,099
9 Australia 481,733,373 9 Argentina 776,825,030
10 United Kingdom 467,255,007 10 Australia 699,795,116
11 Denmark 418,859,591 11 Netherlands 621,758,630
12 China 398,469,866 12 Russian Federation 548,821,139
13 Mexico 374,697,119 13 Denmark 491,329,091
14 Argentina 371,517,765 14 United Kingdom 441,933,755
15 Belgium 360,933,410 15 Mexico 423,084,461
16 Netherlands 315,433,450 16 Malaysia 418,278,046
17 Malaysia 286,190,492 17 Belgium 413,414,836
18 Brazil 241,114,229 18 Spain 409,786,537
19 Spain 239,386,924 19 Honduras 345,303,963
30 Mozambique 90,802,806 44 Mozambique 50,769,320
World Total 14,340,753,842 World Total 26,304,890,877
Mozambique % 0.63% Mozambique % 0.19%Source: UN Comtrade
2015 with volume increasing fi vefold over the pe-riod. As Figure 2.18 illustrates, there is a high cor-relation between the increase in food imports and population growth.
2.3 Main Food Imports
Mozambique is a net importer of basic foods includ-ing cereals (maize, wheat, and rice) and substan-tial quantities of meat and livestock products. Food imports have risen substantially between 2001 and
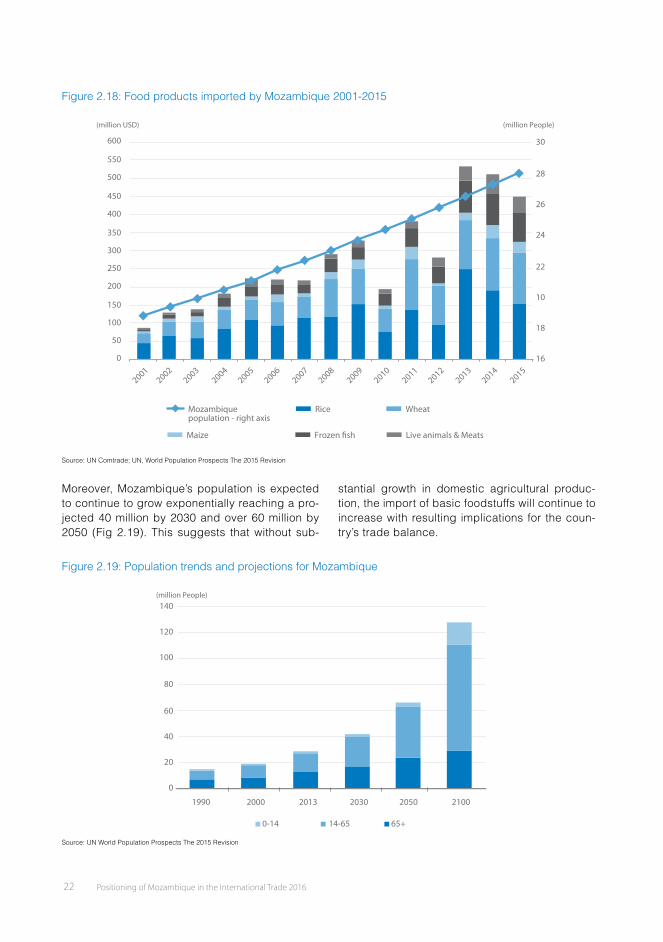
Positioning of Mozambique in the International Trade 2016 23
Wheat
As bread is a staple food for many Mozambican families, wheat is one of the country’s major food imports. During the period 2006 to 2010, the USA, Germany and Argentinian were the princi-pal suppliers, with 70% of wheat imports coming from these countries (Fig. 2.20). However, the
last fi ve years have witnessed greater diversity in supply with Australia emerging as a signifi cant supplier and imports from the UEA, Canada, and Russia all growing. In contrast, imports from the USA have seen a reduction of approximately two thirds.
Figure 2.20: Wheat import origins
2006-2010 Average 2011-2015 Average
Canada6% Argentina
14%Germany23%
Australia4%
UAE4%
Other11%
Russian4%
USA33%
South Africa1%
Ukraine6%
Brazil7%
Canada8%
Germany6%
Australia24%
UAE12%
Other17%
Russian10%
USA10%
Source: UN Comtrade
Maize
Maize imports are sourced principally from within the SADC region with neighbouring South Africa being the dominant supplier (Fig. 2.21). However, during the last fi ve years, Zambia has
emerged as the supplier of 11% of imported maize and imports from Malawi, although small, have tripled from 1 % to 3 % over the last ten years.
Figure 2.21: Maize import origins
2006-2010 Average 2011-2015 Average
South Africa91%
Other6%Malawi
1%USA2%
United Kingdom3%
South Africa82%
Other2%
Zambia2%
Malawi11%
Source: UN Comtrade
22 Positioning of Mozambique in the International Trade 2016
Figure 2.18: Food products imported by Mozambique 2001-2015
RiceMozambiquepopulation - right axis
Wheat
Maize Frozen �sh
250
200
150
100
50
0
300
350
400
450
550
600
(million USD) (million People)
500
20012002
20032004
20052006
20072008
20092010
20112012
20132014
2015
Live animals & Meats
16
18
10
22
24
26
28
30
Source: UN Comtrade; UN, World Population Prospects The 2015 Revision
Moreover, Mozambique’s population is expected to continue to grow exponentially reaching a pro-jected 40 million by 2030 and over 60 million by 2050 (Fig 2.19). This suggests that without sub-
stantial growth in domestic agricultural produc-tion, the import of basic foodstuffs will continue to increase with resulting implications for the coun-try’s trade balance.
Figure 2.19: Population trends and projections for Mozambique
0
20
40
60
80
100
120
140
1990 2000 2013 2030 2050 2100
0-14 14-65 65+
(million People)
Source: UN World Population Prospects The 2015 Revision
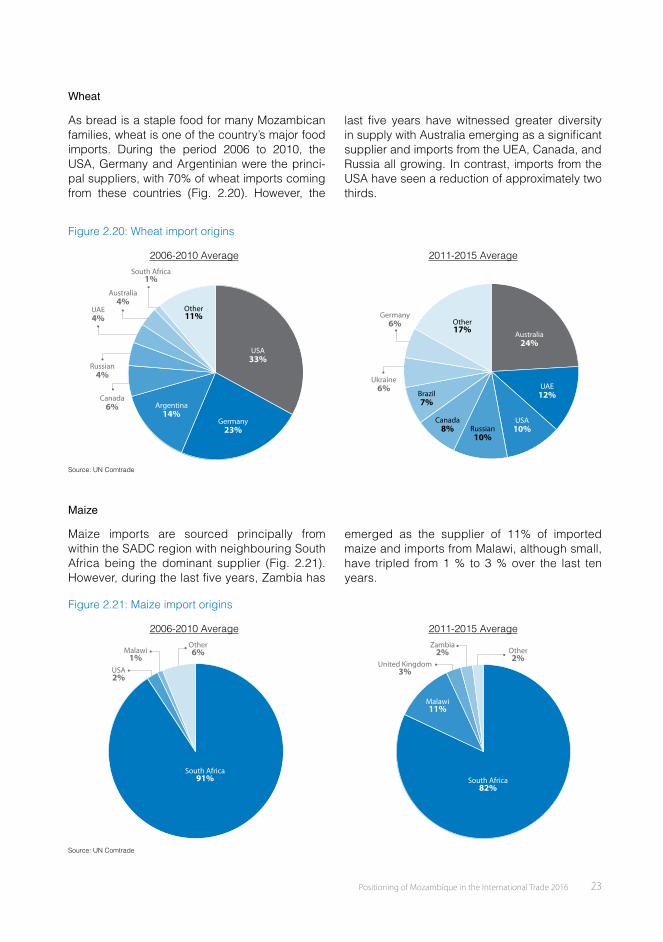
Positioning of Mozambique in the International Trade 2016 23
Wheat
As bread is a staple food for many Mozambican families, wheat is one of the country’s major food imports. During the period 2006 to 2010, the USA, Germany and Argentinian were the princi-pal suppliers, with 70% of wheat imports coming from these countries (Fig. 2.20). However, the
last fi ve years have witnessed greater diversity in supply with Australia emerging as a signifi cant supplier and imports from the UEA, Canada, and Russia all growing. In contrast, imports from the USA have seen a reduction of approximately two thirds.
Figure 2.20: Wheat import origins
2006-2010 Average 2011-2015 Average
Canada6% Argentina
14%Germany23%
Australia4%
UAE4%
Other11%
Russian4%
USA33%
South Africa1%
Ukraine6%
Brazil7%
Canada8%
Germany6%
Australia24%
UAE12%
Other17%
Russian10%
USA10%
Source: UN Comtrade
Maize
Maize imports are sourced principally from within the SADC region with neighbouring South Africa being the dominant supplier (Fig. 2.21). However, during the last fi ve years, Zambia has
emerged as the supplier of 11% of imported maize and imports from Malawi, although small, have tripled from 1 % to 3 % over the last ten years.
Figure 2.21: Maize import origins
2006-2010 Average 2011-2015 Average
South Africa91%
Other6%Malawi
1%USA2%
United Kingdom3%
South Africa82%
Other2%
Zambia2%
Malawi11%
Source: UN Comtrade
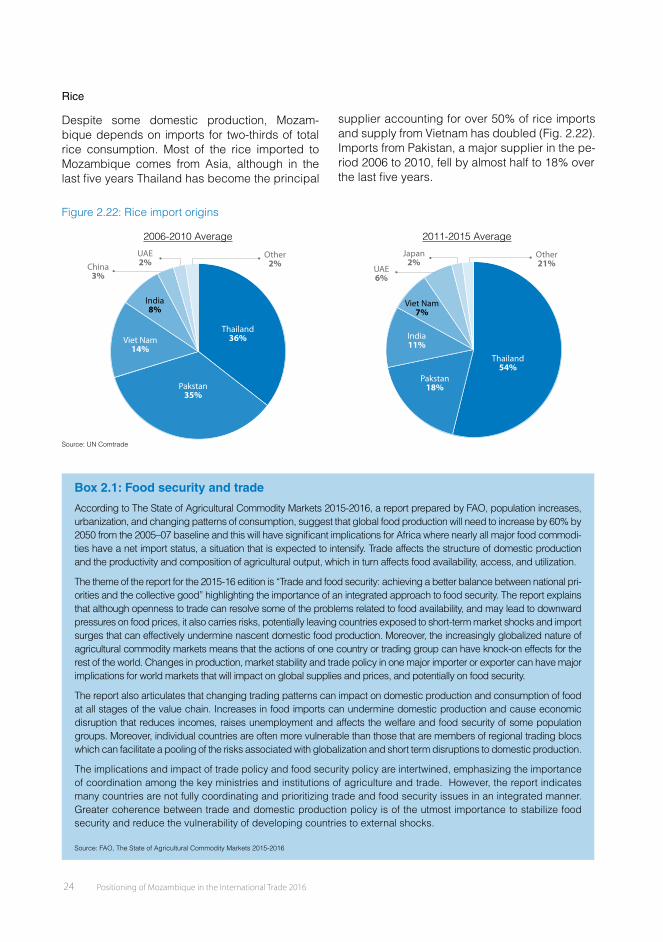
Positioning of Mozambique in the International Trade 2016 25
Frozen � sh
The value of frozen fi sh imports has steadily grown over the last 15 years with a notable increase to over $80 million per year in the last three years (Fig 2.23).
Supply is dominated by two southern African countries with Namibia supplying 60% of frozen fi sh imports and a further 26% coming from South Africa (Fig. 2.23).
Figure 2.23: Frozen fi sh imported by Mozambique & import origins
-
20
40
60
80
100(million USD)
20012002
20032004
20052006
20072008
20092010
20112012
20132014
2015
South Africa26%
Other8%
Japan2%
Namibia60%
New Zealand4%
Source: UN Comtrade
Tomatoes
Almost all fresh tomatoes imported into Mozambique come from neighbouring South Africa and despite some increase in domestic production, imported tomatoes dominate Mozambique’s urban retail mar-ket (Fig.2.24). The value of imported fresh tomatoes
has, in fact, varied over the period 2002 to 2014, yet Mozambique has consistently imported fresh toma-toes over the last ten years. The value of imported preserved tomatoes has also slowly increased as a proportion of the total value of imported tomato.
Figure 2.24: Tomatoes imported by Mozambique & Fresh tomatoes import origin
0
1
2
3
4
5(million USD)
2002 2004 2006 2008 2010 2012 2014
Tomatoes fresh Tomatoes preserved
South Africa98%
Other2%
Source: UN Comtrade
24 Positioning of Mozambique in the International Trade 2016
Rice
Despite some domestic production, Mozam-bique depends on imports for two-thirds of total rice consumption. Most of the rice imported to Mozambique comes from Asia, although in the last fi ve years Thailand has become the principal
supplier accounting for over 50% of rice imports and supply from Vietnam has doubled (Fig. 2.22). Imports from Pakistan, a major supplier in the pe-riod 2006 to 2010, fell by almost half to 18% over the last fi ve years.
Figure 2.22: Rice import origins
2006-2010 Average 2011-2015 Average
India8%
Thailand36%
UAE2%China
3%
Viet Nam14%
Pakstan35%
Other2%
India11%
Japan2%
Thailand54%
UAE6%
Viet Nam7%
Pakstan18%
Other21%
Source: UN Comtrade
Box 2.1: Food security and trade
According to The State of Agricultural Commodity Markets 2015-2016, a report prepared by FAO, population increases, urbanization, and changing patterns of consumption, suggest that global food production will need to increase by 60% by 2050 from the 2005–07 baseline and this will have signifi cant implications for Africa where nearly all major food commodi-ties have a net import status, a situation that is expected to intensify. Trade affects the structure of domestic production and the productivity and composition of agricultural output, which in turn affects food availability, access, and utilization.
The theme of the report for the 2015-16 edition is “Trade and food security: achieving a better balance between national pri-orities and the collective good” highlighting the importance of an integrated approach to food security. The report explains that although openness to trade can resolve some of the problems related to food availability, and may lead to downward pressures on food prices, it also carries risks, potentially leaving countries exposed to short-term market shocks and import surges that can effectively undermine nascent domestic food production. Moreover, the increasingly globalized nature of agricultural commodity markets means that the actions of one country or trading group can have knock-on effects for the rest of the world. Changes in production, market stability and trade policy in one major importer or exporter can have major implications for world markets that will impact on global supplies and prices, and potentially on food security.
The report also articulates that changing trading patterns can impact on domestic production and consumption of food at all stages of the value chain. Increases in food imports can undermine domestic production and cause economic disruption that reduces incomes, raises unemployment and affects the welfare and food security of some population groups. Moreover, individual countries are often more vulnerable than those that are members of regional trading blocs which can facilitate a pooling of the risks associated with globalization and short term disruptions to domestic production.
The implications and impact of trade policy and food security policy are intertwined, emphasizing the importance of coordination among the key ministries and institutions of agriculture and trade. However, the report indicates many countries are not fully coordinating and prioritizing trade and food security issues in an integrated manner. Greater coherence between trade and domestic production policy is of the utmost importance to stabilize food security and reduce the vulnerability of developing countries to external shocks.
Source: FAO, The State of Agricultural Commodity Markets 2015-2016
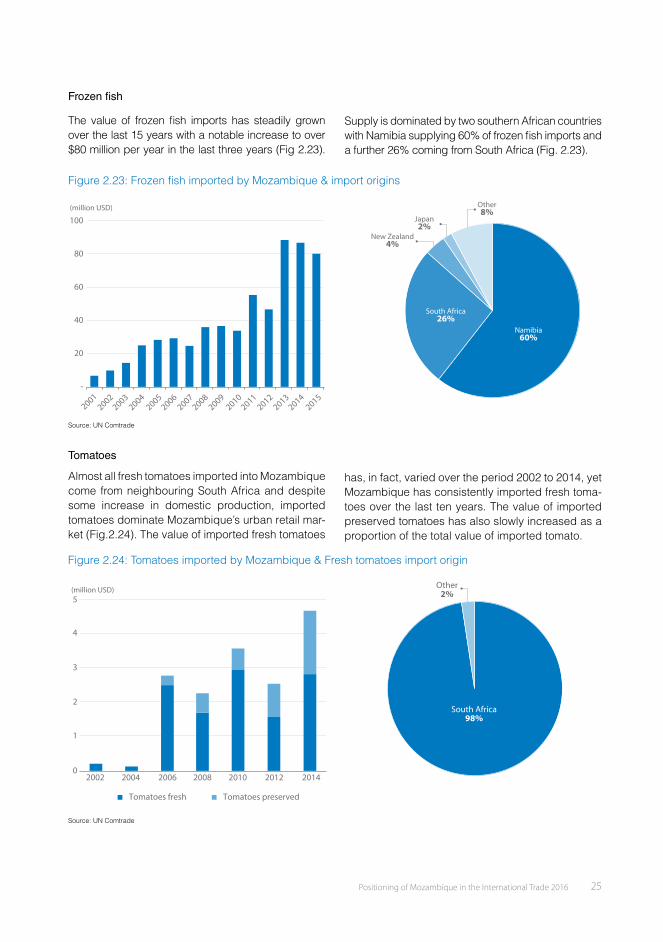
Positioning of Mozambique in the International Trade 2016 25
Frozen � sh
The value of frozen fi sh imports has steadily grown over the last 15 years with a notable increase to over $80 million per year in the last three years (Fig 2.23).
Supply is dominated by two southern African countries with Namibia supplying 60% of frozen fi sh imports and a further 26% coming from South Africa (Fig. 2.23).
Figure 2.23: Frozen fi sh imported by Mozambique & import origins
-
20
40
60
80
100(million USD)
20012002
20032004
20052006
20072008
20092010
20112012
20132014
2015
South Africa26%
Other8%
Japan2%
Namibia60%
New Zealand4%
Source: UN Comtrade
Tomatoes
Almost all fresh tomatoes imported into Mozambique come from neighbouring South Africa and despite some increase in domestic production, imported tomatoes dominate Mozambique’s urban retail mar-ket (Fig.2.24). The value of imported fresh tomatoes
has, in fact, varied over the period 2002 to 2014, yet Mozambique has consistently imported fresh toma-toes over the last ten years. The value of imported preserved tomatoes has also slowly increased as a proportion of the total value of imported tomato.
Figure 2.24: Tomatoes imported by Mozambique & Fresh tomatoes import origin
0
1
2
3
4
5(million USD)
2002 2004 2006 2008 2010 2012 2014
Tomatoes fresh Tomatoes preserved
South Africa98%
Other2%
Source: UN Comtrade
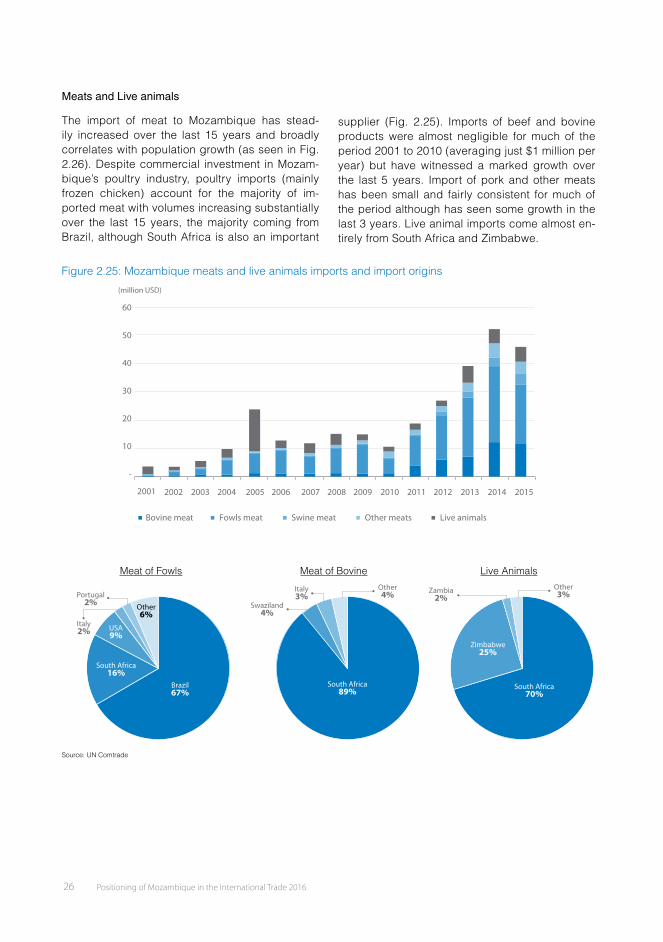
27Positioning of Mozambique in the International Trade 2016
Global & Regional Trends
C h a p t e r III
Population growth leads to various socio-economic changes, including increased demand for food and growth in available labour force. If the working age population can be equipped with the appropriate skill-set and absorbed into the labour force, then popula-tion growth can contribute positively to domestic pro-duction, economic growth and the balance of trade. However, if domestic production of food is unable to keep pace with population growth, dependence of food imports will increase, making a country more vulnerable to global commodity price fl uctuations.
3.1 Demographic Trends and Food Security
Demography as a factor of socio-economic change impacts on every aspect of human development. The global population is expected to grow by ap-proximately 30% during the next 35 years, from 7.3 billion in 2015 to 9.7 billion in 2050, according to UN World Population Prospects. As Figure 3.1 shows, population in Africa is projected to grow at a faster rate. In 2015, Africa accounted for 16% of the global population, but by 2050, this is projected to rise to over 25% with the population of Africa exceeding that of both China and India.
26 Positioning of Mozambique in the International Trade 2016
Meats and Live animals
The import of meat to Mozambique has stead-ily increased over the last 15 years and broadly correlates with population growth (as seen in Fig. 2.26). Despite commercial investment in Mozam-bique’s poultry industry, poultry imports (mainly frozen chicken) account for the majority of im-ported meat with volumes increasing substantially over the last 15 years, the majority coming from Brazil, although South Africa is also an important
supplier (Fig. 2.25). Imports of beef and bovine products were almost negligible for much of the period 2001 to 2010 (averaging just $1 million per year) but have witnessed a marked growth over the last 5 years. Import of pork and other meats has been small and fairly consistent for much of the period although has seen some growth in the last 3 years. Live animal imports come almost en-tirely from South Africa and Zimbabwe.
Figure 2.25: Mozambique meats and live animals imports and import origins
10
-
20
30
40
50
60
(million USD)
2001 2002 2003 2004 2005 2006 2007 2008 2009 2010 2011 2012 2013 2014 2015
Bovine meat Fowls meat Swine meat Other meats Live animals
Meat of Fowls Meat of Bovine Live Animals
South Africa16%
Brazil67%
Portugal2%
Italy2%
Other6%
USA9%
South Africa89%
Italy3%
Swaziland4%
Other4%
South Africa70%
Other3%
Zimbabwe25%
Zambia2%
Source: UN Comtrade
27Positioning of Mozambique in the International Trade 2016
Global & Regional Trends
C h a p t e r III
Population growth leads to various socio-economic changes, including increased demand for food and growth in available labour force. If the working age population can be equipped with the appropriate skill-set and absorbed into the labour force, then popula-tion growth can contribute positively to domestic pro-duction, economic growth and the balance of trade. However, if domestic production of food is unable to keep pace with population growth, dependence of food imports will increase, making a country more vulnerable to global commodity price fl uctuations.
3.1 Demographic Trends and Food Security
Demography as a factor of socio-economic change impacts on every aspect of human development. The global population is expected to grow by ap-proximately 30% during the next 35 years, from 7.3 billion in 2015 to 9.7 billion in 2050, according to UN World Population Prospects. As Figure 3.1 shows, population in Africa is projected to grow at a faster rate. In 2015, Africa accounted for 16% of the global population, but by 2050, this is projected to rise to over 25% with the population of Africa exceeding that of both China and India.
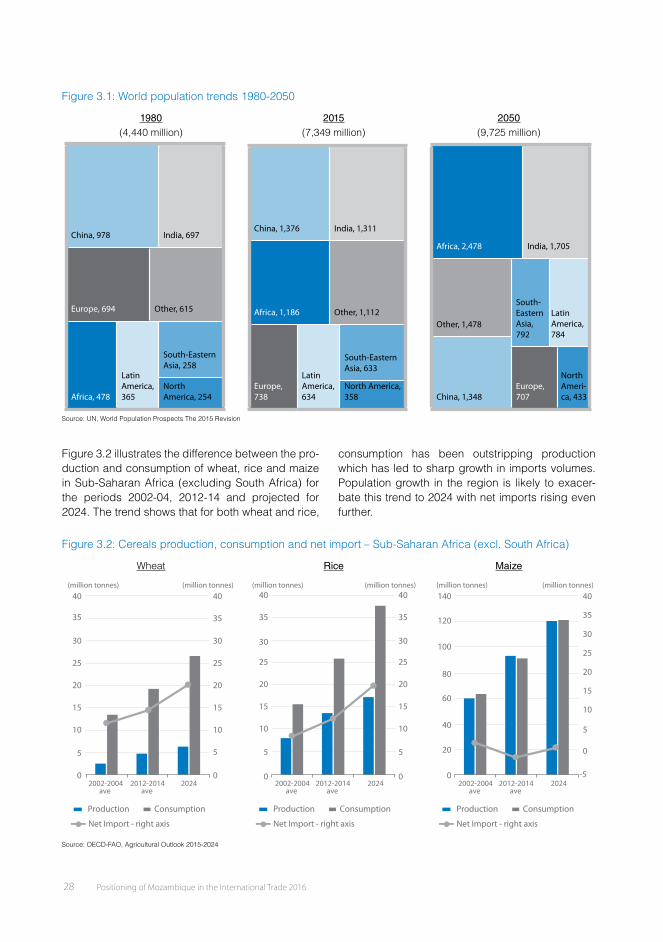
Positioning of Mozambique in the International Trade 2016 29
Box 3.1: Changing dietary habits and diversi cation of foods demand
The OECD-FAO Agriculture Outlook 2015-2024 (2015) shows consumption patterns of basic foodstuffs for least developed countries (LDCs) in comparison to developed countries for the periods 2002-04, 2012-14 and projected for 2024 (Fig. 3.4). Food consumption in LDCs has been growing and this trend is projected to continue over the next 10 years. As economic development in LDCs improves, calorie consumption increases and the population starts to consume a greater variety of foods. However, whilst the pattern for developed countries shows a balanced consumption across different food types, consumption in LDCs, even as they start to grow and diversify, is domi-nated by cereals. Increases in consumption of protein rich meat and dairy products are still signifi cantly smaller. Nevertheless, the pattern of food consumption certainly changes, and to respond to this growing demand for food and greater dietary variations, LDCs will have to increase domestic production of cereal and meats, or import these commodities in increasing volumes. Moreover, increasing domestic meat production is likely to require a concomi-tant increase in domestic cereal production (or imports) to provide animal feed. This suggests that in order to un-derstand changing dietary and food consumption patterns, it is necessary to take a holistic look at the food value chain and to see how economic development will impact on the supply and demand for food.
Figure 3.3: Calorie intake per capita in LDCs and Developed countries
2002-04 ave
2012-14 ave
Least Developed Countries
Dairy Meat Fish Sugar OtherVegetable oilsCereals
(kcal/day/person)
Developed Countries
2024-
500
1,000
1,500
2,000
2,500
3,000
2002-04 ave
2012-14 ave
2024
Source: OECD-FAO, Agricultural Outlook 2015-2024
3.2 Demographic Trends and Socio-Economic Structure
An analysis of the structure of global population by age group over the last 35 years (1980-2015) shows that the labour force (those in the 15-65 age group) has increased as a percentage of the total popula-tion, but has been accompanied by an increase in the elderly, dependent population (over 65s). How-ever, projections anticipate a marked change oc-curring over the next 35 years with the working age population falling back (from 66% to 63%) but the
percentage of the elderly population doubling from 8% to 16% of the total, indicating a decline in the importance of what is termed the “demographic bo-nus”. However, an examination of continental data suggests that Africa will contradict the global trend with the labour force, as a percentage of total popu-lation, continuing to grow for the next 30 years, thus maintaining the demographic bonus for the conti-nent.
28 Positioning of Mozambique in the International Trade 2016
Figure 3.1: World population trends 1980-2050
1980 (4,440 million)
2015 (7,349 million)
2050 (9,725 million)
China, 978 India, 697
Europe, 694 Other, 615
Africa, 478
Latin America, 365
South-Eastern Asia, 258
North America, 254
China, 1,376 India, 1,311
Africa, 1,186 Other, 1,112
Europe, 738
Latin America, 634
South-Eastern Asia, 633
North America, 358
Africa, 2,478 India, 1,705
Other, 1,478
South-Eastern Asia, 792
Latin America, 784
China, 1,348Europe, 707
North Ameri-ca, 433
Source: UN, World Population Prospects The 2015 Revision
Figure 3.2 illustrates the difference between the pro-duction and consumption of wheat, rice and maize in Sub-Saharan Africa (excluding South Africa) for the periods 2002-04, 2012-14 and projected for 2024. The trend shows that for both wheat and rice,
consumption has been outstripping production which has led to sharp growth in imports volumes. Population growth in the region is likely to exacer-bate this trend to 2024 with net imports rising even further.
Figure 3.2: Cereals production, consumption and net import – Sub-Saharan Africa (excl. South Africa)
Wheat Rice Maize
0
5
10
15
20
25
30
35
40(million tonnes)
0
5
10
15
20
25
30
35
40(million tonnes)
2002-2004 2012-2014 2024
Production
Net Import - right axis
Consumption
Net Import - right axis
ave ave
0
5
10
15
20
25
30
35
40(million tonnes)
0
5
10
15
20
25
30
35
40(million tonnes)
2002-2004 2012-2014 2024
Production Consumption
ave ave
Net Import - right axis
0
20
40
60
80
100
120
140(million tonnes)
-5
0
5
10
15
20
25
30
35
40(million tonnes)
2002-2004 2012-2014 2024
Production Consumption
ave ave
Source: OECD-FAO, Agricultural Outlook 2015-2024
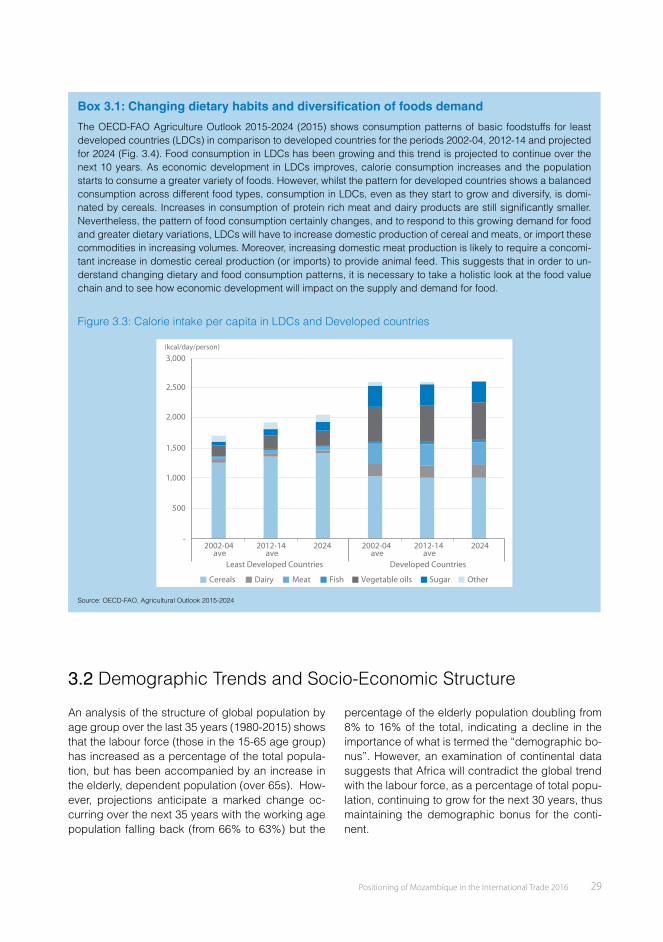
Positioning of Mozambique in the International Trade 2016 29
Box 3.1: Changing dietary habits and diversi cation of foods demand
The OECD-FAO Agriculture Outlook 2015-2024 (2015) shows consumption patterns of basic foodstuffs for least developed countries (LDCs) in comparison to developed countries for the periods 2002-04, 2012-14 and projected for 2024 (Fig. 3.4). Food consumption in LDCs has been growing and this trend is projected to continue over the next 10 years. As economic development in LDCs improves, calorie consumption increases and the population starts to consume a greater variety of foods. However, whilst the pattern for developed countries shows a balanced consumption across different food types, consumption in LDCs, even as they start to grow and diversify, is domi-nated by cereals. Increases in consumption of protein rich meat and dairy products are still signifi cantly smaller. Nevertheless, the pattern of food consumption certainly changes, and to respond to this growing demand for food and greater dietary variations, LDCs will have to increase domestic production of cereal and meats, or import these commodities in increasing volumes. Moreover, increasing domestic meat production is likely to require a concomi-tant increase in domestic cereal production (or imports) to provide animal feed. This suggests that in order to un-derstand changing dietary and food consumption patterns, it is necessary to take a holistic look at the food value chain and to see how economic development will impact on the supply and demand for food.
Figure 3.3: Calorie intake per capita in LDCs and Developed countries
2002-04 ave
2012-14 ave
Least Developed Countries
Dairy Meat Fish Sugar OtherVegetable oilsCereals
(kcal/day/person)
Developed Countries
2024-
500
1,000
1,500
2,000
2,500
3,000
2002-04 ave
2012-14 ave
2024
Source: OECD-FAO, Agricultural Outlook 2015-2024
3.2 Demographic Trends and Socio-Economic Structure
An analysis of the structure of global population by age group over the last 35 years (1980-2015) shows that the labour force (those in the 15-65 age group) has increased as a percentage of the total popula-tion, but has been accompanied by an increase in the elderly, dependent population (over 65s). How-ever, projections anticipate a marked change oc-curring over the next 35 years with the working age population falling back (from 66% to 63%) but the
percentage of the elderly population doubling from 8% to 16% of the total, indicating a decline in the importance of what is termed the “demographic bo-nus”. However, an examination of continental data suggests that Africa will contradict the global trend with the labour force, as a percentage of total popu-lation, continuing to grow for the next 30 years, thus maintaining the demographic bonus for the conti-nent.
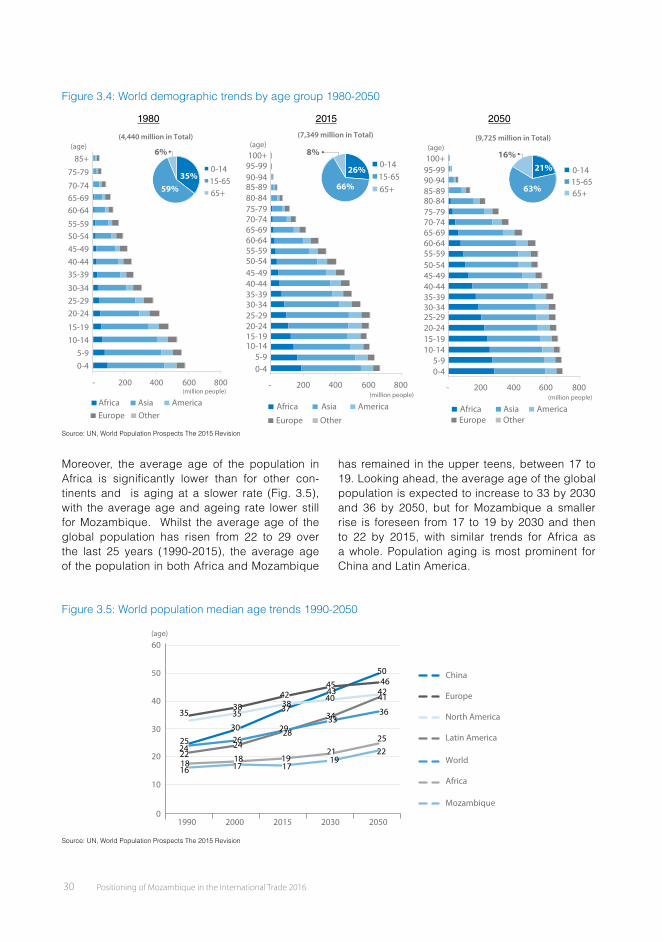
Positioning of Mozambique in the International Trade 2016 31
Looking in more detail at the changes expected to the population structure in Mozambique, Figure 3.6 shows a dependency rate of approximately 50/50 for 2015, that is 49% of the population economically in-active (under 15s and over 65s) dependent on 51%
of the population that forms the labour force. Howev-er, this trend is changing. By 2050, those of working age are expected to comprise 61% of the population supporting the remaining 39%, representing a signifi -cant potential demographic bonus for the country.
Figure 3.6: Demographic age pyramid - Mozambique
1980 2015
4.5 3.5 2.5 1.5 0.5 0.5 1.5 2.5 3.5 4.5
Famele
(million people)
Male
85+
75-79
70-7465-69
60-64
55-5950-5445-49
40-4435-39
30-3425-2920-24
15-1910-145-90-4
4%
45%24%
27%
0-14
30-6515-29
65+
4.5 3.5 2.5 1.5 0.5 0.5 1.5 2.5 3.5 4.5
Famele
Male
85+75-79
70-74
65-69
60-64
55-5950-54
45-4940-4435-39
30-3425-29
20-24
15-1910-145-90-4
0-14
30-6515-29
65+
33% 35%
28%
4%
(million people)
Source: UN, World Population Prospects The 2015 Revision
Not only is the world’s population growing, but it is becom-ing more urbanised. The proportion of the world’s popula-tion living in urban areas is expected to increase from 54% in 2014 to 66% in 2050. The population of Mozambique is also rapidly urbanising. In 1990, 75% of the population lived in rural areas and the remaining 25% in urban areas.
Population projections for 2015 indicate that out of the to-tal of c. 25 million inhabitants, 32% live in urban areas and 68% in rural areas. By 2030 the urban population of Mo-zambique is expected to account for 38% of the total and in less than 35 years’ time, by 2050, half of Mozambique’s population is projected to live in towns or cities.
Figure 3.7: World urban population growth rates & Rural/urban population trends for Mozambique1990-2050
60
80
100(% of urban population)
40
20
01990
Africa
Europe
World
Northern America
Asia
Latin America
2000 2015 2030 2050
60
70
80
90100
5040
302010
0
% of urban population % of rural population
1990 2000 2015 2030 2050
7571 68
625149
3832
2925
(% of rural/urban population in Mozambique)
Source: UN, World Urbanization Prospects The 2014 Revision
30 Positioning of Mozambique in the International Trade 2016
Figure 3.4: World demographic trends by age group 1980-2050
1980 2015 2050
85+
75-79
70-7465-6960-64
55-5950-5445-4940-4435-39
30-3425-2920-24
15-1910-14
5-90-4
Africa Asia AmericaEurope Other
- 200 400 600 800(million people)
6%
35%59%
0-1415-6565+
(age)(4,440 million in Total)
100+95-9990-9485-8980-8475-7970-7465-6960-6455-5950-5445-4940-4435-3930-3425-2920-2415-1910-14
5-90-4
Africa Asia America
Europe Other
- 200 400 600 800
8%
26%
66%
0-1415-6565+
(million people)
(age)(7,349 million in Total)
100+(age)
95-9990-9485-8980-8475-7970-7465-6960-6455-5950-5445-4940-4435-3930-3425-2920-2415-1910-14
5-90-4
Africa Asia AmericaEurope Other
- 200 400 600 800
0-1415-6565+
21%16%
63%
(million people)
(9,725 million in Total)
Source: UN, World Population Prospects The 2015 Revision
Moreover, the average age of the population in Africa is signifi cantly lower than for other con-tinents and is aging at a slower rate (Fig. 3.5), with the average age and ageing rate lower still for Mozambique. Whilst the average age of the global population has risen from 22 to 29 over the last 25 years (1990-2015), the average age of the population in both Africa and Mozambique
has remained in the upper teens, between 17 to 19. Looking ahead, the average age of the global population is expected to increase to 33 by 2030 and 36 by 2050, but for Mozambique a smaller rise is foreseen from 17 to 19 by 2030 and then to 22 by 2015, with similar trends for Africa as a whole. Population aging is most prominent for China and Latin America.
Figure 3.5: World population median age trends 1990-2050
60(age)
50
40
30
20
10
0
35 3538
4245 46
50 China
Europe
North America
Latin America
World
Africa
Mozambique
1990 2000 2015 2030 2050
4340
37
30252422
26242829
3334
4241
36
252221
191918171718
16
38
Source: UN, World Population Prospects The 2015 Revision
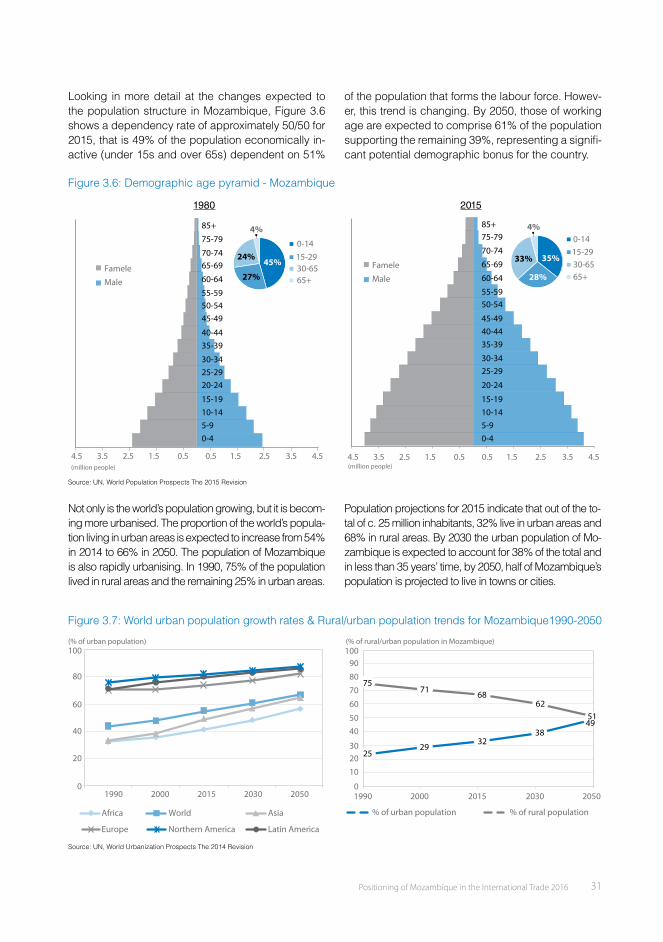
Positioning of Mozambique in the International Trade 2016 31
Looking in more detail at the changes expected to the population structure in Mozambique, Figure 3.6 shows a dependency rate of approximately 50/50 for 2015, that is 49% of the population economically in-active (under 15s and over 65s) dependent on 51%
of the population that forms the labour force. Howev-er, this trend is changing. By 2050, those of working age are expected to comprise 61% of the population supporting the remaining 39%, representing a signifi -cant potential demographic bonus for the country.
Figure 3.6: Demographic age pyramid - Mozambique
1980 2015
4.5 3.5 2.5 1.5 0.5 0.5 1.5 2.5 3.5 4.5
Famele
(million people)
Male
85+
75-79
70-7465-69
60-64
55-5950-5445-49
40-4435-39
30-3425-2920-24
15-1910-145-90-4
4%
45%24%
27%
0-14
30-6515-29
65+
4.5 3.5 2.5 1.5 0.5 0.5 1.5 2.5 3.5 4.5
Famele
Male
85+75-79
70-74
65-69
60-64
55-5950-54
45-4940-4435-39
30-3425-29
20-24
15-1910-145-90-4
0-14
30-6515-29
65+
33% 35%
28%
4%
(million people)
Source: UN, World Population Prospects The 2015 Revision
Not only is the world’s population growing, but it is becom-ing more urbanised. The proportion of the world’s popula-tion living in urban areas is expected to increase from 54% in 2014 to 66% in 2050. The population of Mozambique is also rapidly urbanising. In 1990, 75% of the population lived in rural areas and the remaining 25% in urban areas.
Population projections for 2015 indicate that out of the to-tal of c. 25 million inhabitants, 32% live in urban areas and 68% in rural areas. By 2030 the urban population of Mo-zambique is expected to account for 38% of the total and in less than 35 years’ time, by 2050, half of Mozambique’s population is projected to live in towns or cities.
Figure 3.7: World urban population growth rates & Rural/urban population trends for Mozambique1990-2050
60
80
100(% of urban population)
40
20
01990
Africa
Europe
World
Northern America
Asia
Latin America
2000 2015 2030 2050
60
70
80
90100
5040
302010
0
% of urban population % of rural population
1990 2000 2015 2030 2050
7571 68
625149
3832
2925
(% of rural/urban population in Mozambique)
Source: UN, World Urbanization Prospects The 2014 Revision

Positioning of Mozambique in the International Trade 2016 33
Box 3.2: Consumption in developing & emerging countries – Bottom of Pyramid
Global Consumption Data prepared by the World Bank provides meticulously disaggregated information on con-sumption patterns in 92 developing and emerging countries ranked into four income groups (Fig 3.10). It clearly shows how consumption patterns change according to income strata, with an average close to 50% of income be-ing spent on food and beverages for the low income and poorest population strata. The potential commercial impli-cations of this area worth consideration, particularly the structure of economy is dynamically transforming. Countries with low income and the poorest populations tend to have the greatest population growth and urbanisation rates. If economic development and growth were anticipated in these countries, the expected change in consumption patterns that would likely to follow could point to some interesting business and investment opportunities that could lead to greater diversifi cation of the economy.
Figure 3.10: Consumption patterns by sector and income segment – 2010 (average of 92 countries)
0 10 20 30 40 50 60 70 80 90 100(%)
54Lowest
Low
Middle
High
Food and Beverages
Health & EducationEnergy & Water Utility
Transport
Clothing and FootwearFinancial Service
Housing
ICTOthers
42
35
21 19 12 9 7 7 4 3 20
10 11 10 8 7 6 1 13
7 11 10 7 5 7 1 11
4 8 7 6 3 7 0 10 Consumer segmentation is based on income per capita (PPP, USD basis using local cur-rency exchange rate as of 2010)
� Lowest: below $2.97 per capita a day
� Low: between $2.97 and $8.44 per capita a day
� Middle: between $8.44 and $23.03 per cap-ita a day
� Higher: above $23.03 per capita a day
Source: World Bank, Global Consumption Database
A key sector for future trade and development in Mo-zambique, Figure 3.11 shows that global energy de-mand increased by over 50% during the period 1990 to 2013 and during this period, the quantity of energy used for power generation almost doubled. Demand for energy is expected to continue to grow to 2030. How-ever, the rate of growth is estimated by the IEA to slow, based on the assumptions and recommendations of the
3.3 Energy Demand and IndustrializationCOP21 climate change conference. This is predicted to lead to signifi cant changes in fuel sources used for power generation. Historically, coal and oil have been the predominant fuels used to generate power with consumption of both increasing over the period 1990 to 2013. However, the importance of these fuels needs to decrease during the period 2013 to 2030 with gas, biofuels and renewables taking on greater signifi cance.
Figure 3.11: Energy demand by sector & Total primary energy demand by resource
1990 2013 2030
Power generation Industry Transport Buildings
8,000
6,000
4,000
2,000
-
10,000
12,000
14,000
16,000
18,000(Mtoe)
1990 2013 2030Coal Oil Gas Nuclear
Hydro Bioenergy Other renewables
8,000
6,000
4,000
2,000
-
10,000
12,000
14,000
16,000
18,000(Mtoe)
Source: IEA, World Energy Outlook 2015
32 Positioning of Mozambique in the International Trade 2016
As urban areas grow, they become important clusters for economic development and invest-ment due to the benefits of economies of ag-glomeration. However, with urbanisation the structure of the economy also tends to shift to one which is more service sector driven as economic actors become concentrated in ur-ban areas and engage in the supply of services and greater concentrations of population create
demand. Figure 3.8 shows growth in the ser-vice sector as a percentage of GDP in relation to change in the urban population for Mozam-bique, South Africa, Brazil and India. All coun-tries show greater dependence on the service sector as urbanisation increases. Even with a relatively low urbanisation rate, the service sec-tor in Mozambique already contributes over 50% to GDP.
Figure 3.8: Trend of urbanization and services value added (% of GDP) 1980-2014
20
10
40
30
60
50
80
70
100
90
10 20 30 40 50 60 70 80 90 100
South Africa
(Services, etc. value added % of GDP)
(% of urban population)
Brazil
India
1980
1980
19801980
2014
20142014
Mozambique
2014
Source: UN, World Urbanization Prospects The 2014 Revision; World Bank
As an indication of the dynamic of service sec-tor growth in Mozambique, Figure 3.10 shows the growth in the number of mobile phone subscriptions in the period 2001 to 2013, increasing from nearly zero in 2001 to over 12 million subscriptions in 2012.
Figure 3.11 shows the growth in international tourism and tourism derived revenue over the same period and indicates a similar trend in a key service sector that creates jobs and new business opportunities in both urban areas and other tourist attractions.
Figure 3.9: Mobile and fi xed telephone subscription & International tourism arrivals and revenues
0
2
6
4
10
8
14(million subscriptions)
12
2001 2003 2005 2007 2009 2011 2013
Mobile Celular Fixed telephone
0
0.5
1.0
1.5
2.0
2.5
0
50
150
100
250
200
350
300
2001 2003 2005 2007 2009 2011 2013
International tourism, arrivals - left axis
International tourism, revenue - right axis
(million people) (million USD)
Source: INE
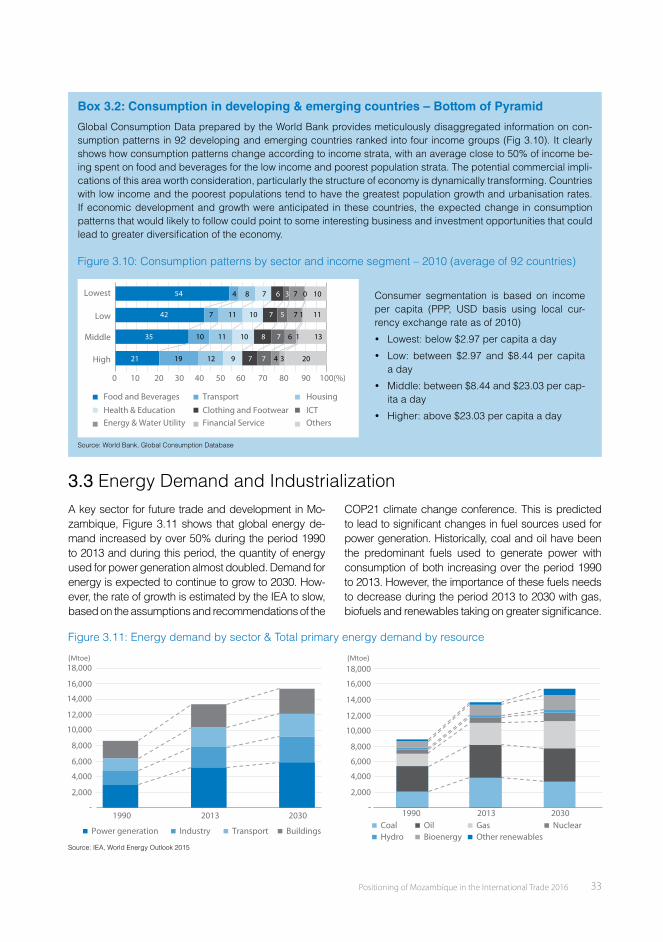
Positioning of Mozambique in the International Trade 2016 33
Box 3.2: Consumption in developing & emerging countries – Bottom of Pyramid
Global Consumption Data prepared by the World Bank provides meticulously disaggregated information on con-sumption patterns in 92 developing and emerging countries ranked into four income groups (Fig 3.10). It clearly shows how consumption patterns change according to income strata, with an average close to 50% of income be-ing spent on food and beverages for the low income and poorest population strata. The potential commercial impli-cations of this area worth consideration, particularly the structure of economy is dynamically transforming. Countries with low income and the poorest populations tend to have the greatest population growth and urbanisation rates. If economic development and growth were anticipated in these countries, the expected change in consumption patterns that would likely to follow could point to some interesting business and investment opportunities that could lead to greater diversifi cation of the economy.
Figure 3.10: Consumption patterns by sector and income segment – 2010 (average of 92 countries)
0 10 20 30 40 50 60 70 80 90 100(%)
54Lowest
Low
Middle
High
Food and Beverages
Health & EducationEnergy & Water Utility
Transport
Clothing and FootwearFinancial Service
Housing
ICTOthers
42
35
21 19 12 9 7 7 4 3 20
10 11 10 8 7 6 1 13
7 11 10 7 5 7 1 11
4 8 7 6 3 7 0 10 Consumer segmentation is based on income per capita (PPP, USD basis using local cur-rency exchange rate as of 2010)
� Lowest: below $2.97 per capita a day
� Low: between $2.97 and $8.44 per capita a day
� Middle: between $8.44 and $23.03 per cap-ita a day
� Higher: above $23.03 per capita a day
Source: World Bank, Global Consumption Database
A key sector for future trade and development in Mo-zambique, Figure 3.11 shows that global energy de-mand increased by over 50% during the period 1990 to 2013 and during this period, the quantity of energy used for power generation almost doubled. Demand for energy is expected to continue to grow to 2030. How-ever, the rate of growth is estimated by the IEA to slow, based on the assumptions and recommendations of the
3.3 Energy Demand and IndustrializationCOP21 climate change conference. This is predicted to lead to signifi cant changes in fuel sources used for power generation. Historically, coal and oil have been the predominant fuels used to generate power with consumption of both increasing over the period 1990 to 2013. However, the importance of these fuels needs to decrease during the period 2013 to 2030 with gas, biofuels and renewables taking on greater signifi cance.
Figure 3.11: Energy demand by sector & Total primary energy demand by resource
1990 2013 2030
Power generation Industry Transport Buildings
8,000
6,000
4,000
2,000
-
10,000
12,000
14,000
16,000
18,000(Mtoe)
1990 2013 2030Coal Oil Gas Nuclear
Hydro Bioenergy Other renewables
8,000
6,000
4,000
2,000
-
10,000
12,000
14,000
16,000
18,000(Mtoe)
Source: IEA, World Energy Outlook 2015
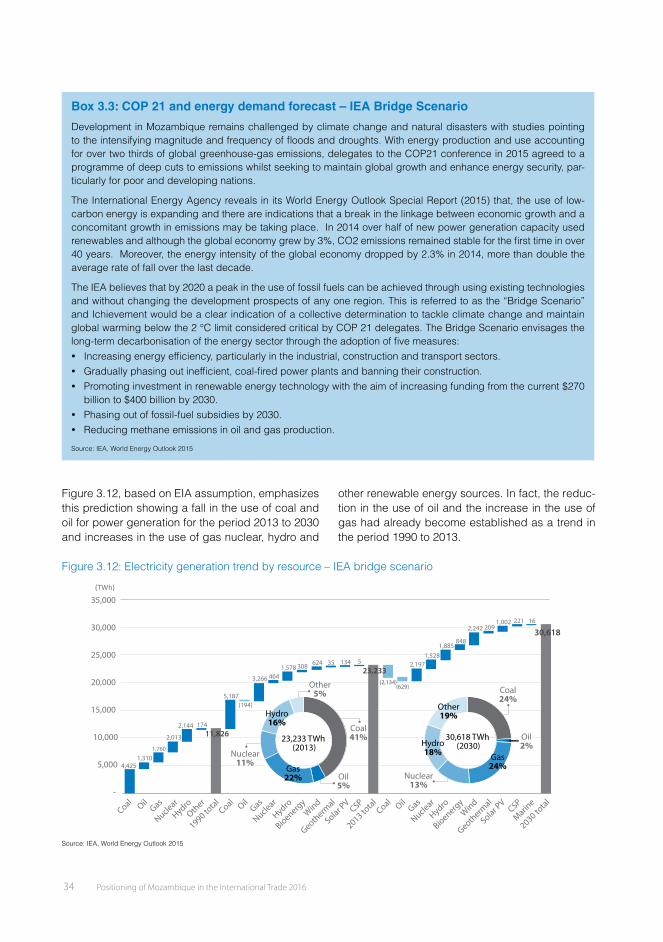
Positioning of Mozambique in the International Trade 2016 35
Turning to the economic impact of the energy and industrial sectors, Figure 3.13 shows the contribution of industry to GDP for Africa and the Gulf States for 2014. The average contribution of the industrial sec-tor to GDP for both Sub-Saharan Africa and world-wide is less than 30% (27% and 26% respectively). For oil producing and resource rich countries, the percentage tends to be much higher, for instance in DR Congo, Gabon, Algeria and the Gulf States. Ni-geria is an interesting case where the data has been disaggregated for the periods 2000-04 and 2010-14,
illustrating that as the country became less depend-ent on oil, and began to diversify its economy, then it became less dependent on the industrial sector for GDP growth, dropping from a 40% to 26% con-tribution to GDP. This would seem to suggest that as Mozambique becomes an exporter of mineral re-sources, and particularly gas, it risks becoming over-dependent on the industrial sector. However, as the case of Nigeria shows, there is also an opportunity to take steps to promote greater economic diversity and more balanced economic development.
Figure 3.13: Industry, value added (% of GDP) 2014 – Sub-Saharan Africa + Gulf States
Mauritania
Congo Rep.
69 6865 64
5756
46
4039 39
3836
33 32 3229 29 29
28 27 26 2625 24 23 23 22 22 21 20 19
17 17 16 16 15 15 14 1410
29
Qatar
Kuwait
Gabon
Saudi Arabia
Algeria
Nigeria(2000-04 ave)
Egipt
Botswana
Lesoth
o
Tunisia
Marocc
o
GuineaBenin
Ghana
Congo, Dem. R
ep
Namibia
Zimbabwe
Burkina Faso
South Afri
caMali
Sub.Saharan Africa
World (2
013)
Nigeria(2010-14 ave.)
Niger
Tanzania
Senegal
Uganda
Sierra Leone
Kenya
Mozambique
Malawi
Cabo Verde
Madagascar
RwandaChad
Guinea-Bissau
Sao Tome and Prince
pe
Ethiopia
Oman
(Industry, value added % of GDP)
Source: World Bank
34 Positioning of Mozambique in the International Trade 2016
Box 3.3: COP 21 and energy demand forecast – IEA Bridge Scenario
Development in Mozambique remains challenged by climate change and natural disasters with studies pointing to the intensifying magnitude and frequency of fl oods and droughts. With energy production and use accounting for over two thirds of global greenhouse-gas emissions, delegates to the COP21 conference in 2015 agreed to a programme of deep cuts to emissions whilst seeking to maintain global growth and enhance energy security, par-ticularly for poor and developing nations.
The International Energy Agency reveals in its World Energy Outlook Special Report (2015) that, the use of low-carbon energy is expanding and there are indications that a break in the linkage between economic growth and a concomitant growth in emissions may be taking place. In 2014 over half of new power generation capacity used renewables and although the global economy grew by 3%, CO2 emissions remained stable for the fi rst time in over 40 years. Moreover, the energy intensity of the global economy dropped by 2.3% in 2014, more than double the average rate of fall over the last decade.
The IEA believes that by 2020 a peak in the use of fossil fuels can be achieved through using existing technologies and without changing the development prospects of any one region. This is referred to as the “Bridge Scenario” and Ichievement would be a clear indication of a collective determination to tackle climate change and maintain global warming below the 2 °C limit considered critical by COP 21 delegates. The Bridge Scenario envisages the long-term decarbonisation of the energy sector through the adoption of fi ve measures: � Increasing energy effi ciency, particularly in the industrial, construction and transport sectors. � Gradually phasing out ineffi cient, coal-fi red power plants and banning their construction. � Promoting investment in renewable energy technology with the aim of increasing funding from the current $270
billion to $400 billion by 2030. � Phasing out of fossil-fuel subsidies by 2030. � Reducing methane emissions in oil and gas production.
Source: IEA, World Energy Outlook 2015
Figure 3.12, based on EIA assumption, emphasizes this prediction showing a fall in the use of coal and oil for power generation for the period 2013 to 2030 and increases in the use of gas nuclear, hydro and
other renewable energy sources. In fact, the reduc-tion in the use of oil and the increase in the use of gas had already become established as a trend in the period 1990 to 2013.
Figure 3.12: Electricity generation trend by resource – IEA bridge scenario
5,000 4,4251,310
1,760
2,013
2,144
5,187(194)
3,266 4641,578 308 624 35 134 5 2,197
1,5281,885
848
2,242 2091,002 221 16
174
-
10,000
15,000
20,000
25,000
30,000
35,000
CoalOil
Gas
(TWh)
Nuclear
HydroOth
er
1990 total
CoalOil
Gas
Nuclear
Hydro
Bioenergy
Wind
Geotherm
al
Solar PV
CSP
2013 total
CoalOil
Gas
Nuclear
Hydro
BioenergyWind
Geotherm
al
Solar PV
CSP
Marine
2030 total
30,618
23,233
11,826
(2,134)(629)
Gas22%
Coal41%
Oil5%
Nuclear11%
23,233 TWh (2013)
30,618 TWh (2030)
Hydro16%
Other5%
Gas24%
Coal24%
Oil2%
Nuclear13%
Hydro18%
Other19%
Source: IEA, World Energy Outlook 2015
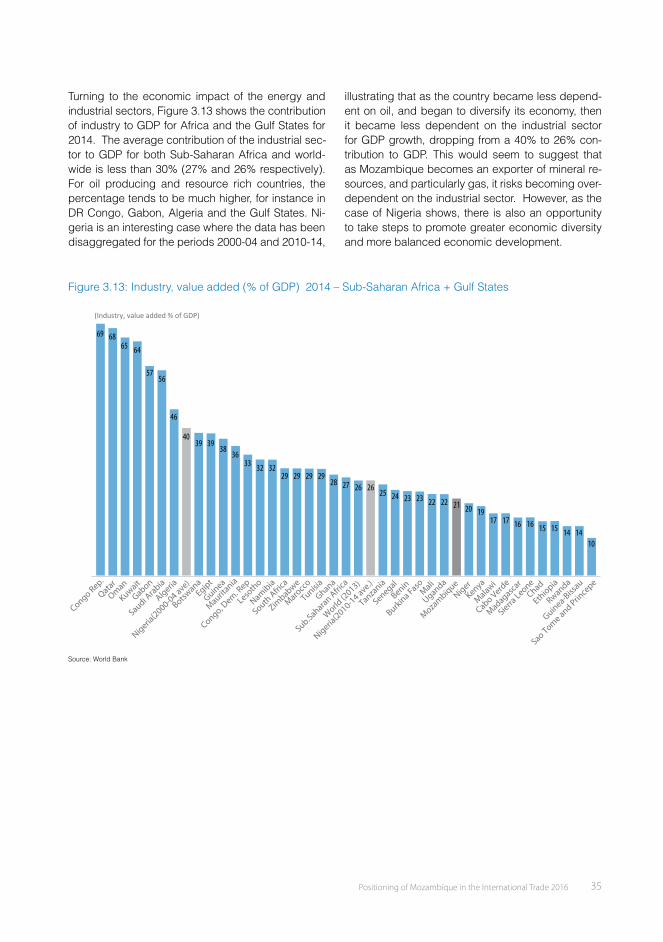
Positioning of Mozambique in the International Trade 2016 35
Turning to the economic impact of the energy and industrial sectors, Figure 3.13 shows the contribution of industry to GDP for Africa and the Gulf States for 2014. The average contribution of the industrial sec-tor to GDP for both Sub-Saharan Africa and world-wide is less than 30% (27% and 26% respectively). For oil producing and resource rich countries, the percentage tends to be much higher, for instance in DR Congo, Gabon, Algeria and the Gulf States. Ni-geria is an interesting case where the data has been disaggregated for the periods 2000-04 and 2010-14,
illustrating that as the country became less depend-ent on oil, and began to diversify its economy, then it became less dependent on the industrial sector for GDP growth, dropping from a 40% to 26% con-tribution to GDP. This would seem to suggest that as Mozambique becomes an exporter of mineral re-sources, and particularly gas, it risks becoming over-dependent on the industrial sector. However, as the case of Nigeria shows, there is also an opportunity to take steps to promote greater economic diversity and more balanced economic development.
Figure 3.13: Industry, value added (% of GDP) 2014 – Sub-Saharan Africa + Gulf States
Mauritania
Congo Rep.
69 6865 64
5756
46
4039 39
3836
33 32 3229 29 29
28 27 26 2625 24 23 23 22 22 21 20 19
17 17 16 16 15 15 14 1410
29
Qatar
Kuwait
Gabon
Saudi Arabia
Algeria
Nigeria(2000-04 ave)
Egipt
Botswana
Lesoth
o
Tunisia
Marocc
o
GuineaBenin
Ghana
Congo, Dem. R
ep
Namibia
Zimbabwe
Burkina Faso
South Afri
caMali
Sub.Saharan Africa
World (2
013)
Nigeria(2010-14 ave.)
Niger
Tanzania
Senegal
Uganda
Sierra Leone
Kenya
Mozambique
Malawi
Cabo Verde
Madagascar
RwandaChad
Guinea-Bissau
Sao Tome and Prince
pe
Ethiopia
Oman
(Industry, value added % of GDP)
Source: World Bank

Positioning of Mozambique in the International Trade 2016 37
Figure 3.15: Fuel price trends and global GDP & Government revenue in oil producing countries
0
50
100
150
200
250
20012000
20022003
20042005
20062007
20082009
20102011
20122013
20142015
Fuel/energy prince index World GDP
Sub-Sahara Africa GDP Mozambique GDP
(index, USD basis 2005=100)
0
50
100
150
200
250
300
350
500
400
450
20012000
20022003
20042005
20062007
20082009
20102011
20122013
20142015
Angola Gov. general revenue Nigeria Gov. generalrevenue
Gabon Gov. general revenue Fuel/energy price index
(index, USD basis 2005=100)
Source: IMF, World Economic Outlook
Finally, in relation to energy demand, Figures 3.16 looks at the relationship between changes in the fuel/energy price index and FDI over the period 2000 to 2014 at a global level, and specifi cally in Nigeria and Mozambique. At the global level, although there is a time lag, there appears to be strong correlation between the variables with no-ticeable drops in FDI following reductions in the
fuel/energy price index. However, for Mozam-bique, reductions in FDI have only noticeably cor-responded to drops in the fuel/energy price in-dex in the last 3 years, with investment growing for most of the period 2000 to 2012 regardless of changes to fuel and energy prices. However, for Nigeria, a bigger and more mature economy, the correlation is more marked.
Figure 3.16: Fuel price trend and global FDI trend & Mozambique and Nigeria FDI trend
-
200
400
600
800
1,000
1,200
1,400
2,000
1,600
1,800
-
50
100
150
250
200
20012000
20022003
20042005
20062007
20082009
20102011
20122013
2014
AfricaAsiaOceania
AmericaEuropaFuel/energy price-right axis
(billion USD) (index, USD basis 2005=100)
-
1
2
3
4
5
6
7
10
8
9
-
50
100
150
250
200
20012000
20022003
20042005
20062007
20082009
20102011
20122013
2014
Mozambique Nigeria Fuel/energy price-right axis
(billion USD) (index, USD basis 2005=100)
Source: UNCTAD; IMF, World Economic Outlook
36 Positioning of Mozambique in the International Trade 2016
Box 3.4: Global Value Chains (GVCs) – opportunities and risks
Global Value Chains (GVCs) represent a systeI which fi nished goods are no longer produced in a single country of a single location. Rather the components of a product are both manufactured and assembled in various locations across the globe. Thus the structure of a country’s production capacity and its economic success is deterI by its ability to become, and stay part of, one or more global value chains. The web of global production is becoming more and more complex and changing rapidly, as the mobility of human resources, capital, goods, information drastically increase.
Economic growth in East Asia, attained by addressing the demand for manufactured goods from advanced coun-tries and integration into GVCs, has encouraged other countries to adopt an export-led approach to development. The Industrial Development Report 2013 (2013) explains that being a part of GVCs, can improve the development of industry in four main ways: � Increases in revenue from trade integration encourage exporters to upgrade technology. � International trade exposes fi rms to forms of competition that they may not face in the domestic market. � Foreign buyers may exert pressure in relation to quality and price forcing fi rms to improve their effi ciency � It can improve access to advanced equipment and research and development facilities.
The Industrial Development Report 2016 (2015) emphasizes that although the exports of African countries are already integrating into GVCs, they tend to be at the lower end of the value chain involving the products of primary production processes (such as minerals and rIaterials) which tend to offer few opportunities for the type of tech-nological innovation that would create greater potential for growth and economic expansion. It also leaves these countries extremely vulnerable to volatility in the world economy, notably commodity prices. Trade openness can create opportunities but excessive dependence on primary industry and low-tech manufacturing may dispropor-tionately expose developing nations to international markets leading to signifi cant variation in government revenue.
Source: UNIDO, Industrial Development Report 2013, 2016
There is a strong correlation between changes in the fuel/energy price index (including crude oil, nat-ural gas and coal prices) and world export values. The export of mineral fuels and oils is the biggest component of world trade, and has had a signifi cant impact on trade trends over the period 2002 to 2014 as highlighted in Figure 3.14.
Changes in the fuel/energy price index also ap-pear to impact on GDP and government reve-
nue. Economic growth in Sub-Saharan Africa, including Mozambique, seems to be more sensi-tive to falls in the fuel/energy price index than is the case for the global economy as a whole. Similarly, Figure 3.15 shows a particularly strong correlation between the fuel/energy price index and government revenue in three resource-rich African countries over the period 2000 to 2014, an important factor for Mozambique to take into consideration.
Figure 3.14: Fuel price trends and world trade (exports) 2002-2014
0
20
40
60
80
100
120
140
160
180
200
20022003
20042005
20062007
20082009
20102011
20122013
2014
Vehicles (excl. railway)
Other
Machinery, nuclear reactorboiler, etcElectrical, ElectronicEquipment
Mineral fuel, oils, etc
Fuel /energy price indx - right axis
2,000
-
4,000
6,000
8,000
10,000
12,000
14,000
16,000
18,000
20,000
(billion USD) (USD, Index 2005=100))
Source: UN Comtrade; IMF, World Economic Outlook
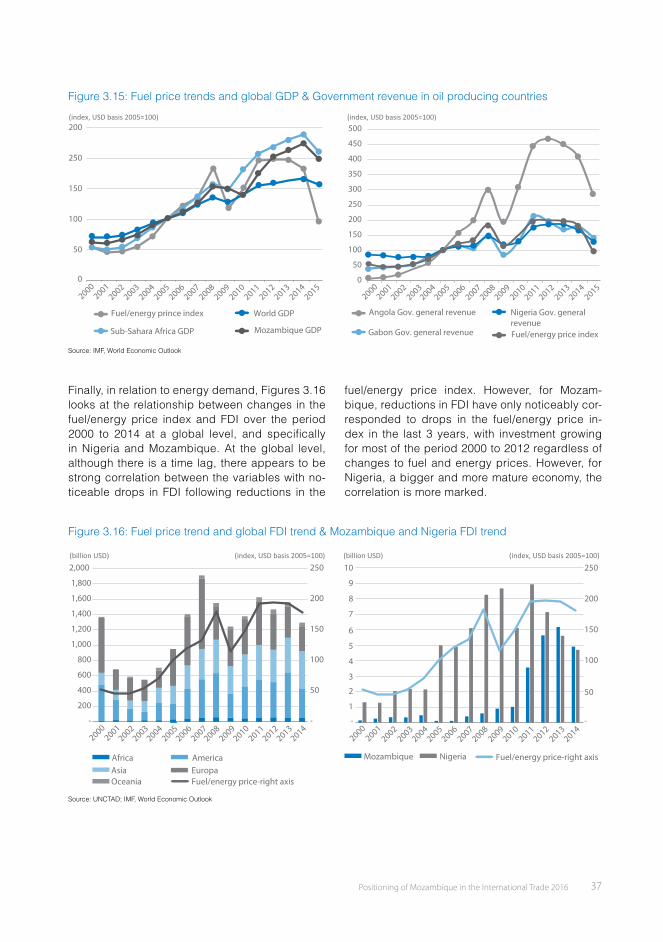
Positioning of Mozambique in the International Trade 2016 37
Figure 3.15: Fuel price trends and global GDP & Government revenue in oil producing countries
0
50
100
150
200
250
20012000
20022003
20042005
20062007
20082009
20102011
20122013
20142015
Fuel/energy prince index World GDP
Sub-Sahara Africa GDP Mozambique GDP
(index, USD basis 2005=100)
0
50
100
150
200
250
300
350
500
400
450
20012000
20022003
20042005
20062007
20082009
20102011
20122013
20142015
Angola Gov. general revenue Nigeria Gov. generalrevenue
Gabon Gov. general revenue Fuel/energy price index
(index, USD basis 2005=100)
Source: IMF, World Economic Outlook
Finally, in relation to energy demand, Figures 3.16 looks at the relationship between changes in the fuel/energy price index and FDI over the period 2000 to 2014 at a global level, and specifi cally in Nigeria and Mozambique. At the global level, although there is a time lag, there appears to be strong correlation between the variables with no-ticeable drops in FDI following reductions in the
fuel/energy price index. However, for Mozam-bique, reductions in FDI have only noticeably cor-responded to drops in the fuel/energy price in-dex in the last 3 years, with investment growing for most of the period 2000 to 2012 regardless of changes to fuel and energy prices. However, for Nigeria, a bigger and more mature economy, the correlation is more marked.
Figure 3.16: Fuel price trend and global FDI trend & Mozambique and Nigeria FDI trend
-
200
400
600
800
1,000
1,200
1,400
2,000
1,600
1,800
-
50
100
150
250
200
20012000
20022003
20042005
20062007
20082009
20102011
20122013
2014
AfricaAsiaOceania
AmericaEuropaFuel/energy price-right axis
(billion USD) (index, USD basis 2005=100)
-
1
2
3
4
5
6
7
10
8
9
-
50
100
150
250
200
20012000
20022003
20042005
20062007
20082009
20102011
20122013
2014
Mozambique Nigeria Fuel/energy price-right axis
(billion USD) (index, USD basis 2005=100)
Source: UNCTAD; IMF, World Economic Outlook
Positioning of Mozambique in the International Trade 2016 39
Regional integration will be an important means to achieving this through reducing trade barriers and introducing policy reforms that allow large, small and micro enterprises to integrate more effectively into re-gional and global value chains. This will require support from the international community including regional development banks. Moreover, Aid for Trade will need to give special attention to LDCs particularly through the Enhanced Integrated Framework for Trade-Related Technical Assistance.
SDGs
AAAA
AfT IPOA
RomeDeclaration
Figure 3.17: Global development initiatives related to trade agenda
MDG(2000)
Brussel Planof Action
(2001)
MonterryConsensus
(2002)
DohaDeclaration
(2008)
Addis AbabaActon Agenda
(2015)
Istanbul Plainof Action
(2011)
SDGs(2015)
AfT - Hong KongWTO Ministerial
Conference (2005)
Rome Declarationon World FoodSecurity(1996)
Source: OECD/WTO, Aid for Trade at a Glance 2015
38 Positioning of Mozambique in the International Trade 2016
3.4 SDGs and Trade
In 2015, United Nations member states unanimous-ly agreed on a set of Sustainable Development Goals (SDGs) with the aim of ending poverty by 2030. The SDGs are a set of 17 aspirational goals with 169 specifi c development targets. The 2030 agenda is the foundation on which efforts to secure sustainable and inclusive development will be built over the next 15 years and in September 2015 the Government of Mozambique committed itself to im-plementing the 2030 Agenda and working towards the achievement of the SDGs.
Trade, and the government revenue derived from it, will make an important contribution to fi nancing the implementation of the SDGs and will have a positive impact on socio-economic development if it can be effectively harnessed. A number of the SDGs have direct linkages to trade, for example:
� Goal 2: End hunger, achieve food security and improved nutrition and promote sustainable ag-riculture
Target 2.b: Correct and prevent trade restric-tions and distortion in world agricultural mar-kets, including by the parallel elimination of all forms of agricultural export subsidies and
all export measures with equivalent effect, in accordance with the mandate of the Doha Development Round
� Goal 8: Promote sustained, inclusive and sus-tainable economic growth, full and productive employment and decent work for all
Target 8.a: Increase aid-for-trade support for developing countries, particularly LDCs, including through the Enhanced Integrated Framework for LDCs
� Goal 10: Reduce inequality within and among countries
Target 10.b: Implement the principle of special and differential treatment (SDT) of developing countries, in particular least developed coun-tries, in accordance with WTO agreement
� Goal 17 Strengthen the means of implementation and revitalize the global partnership for sustain-able development
Target 17.11: Signifi cantly increase the ex-ports of developing countries, in particular with a view to doubling the LDC share of global exports by 2020
Box 3.5: Trade and Development Agenda
Trade is a key factor in economic development and can improve the access of developing countries to essential goods and services by further reducing their costs and trade defi cits. It is widely agreed that trade, development, and poverty reduction are intrinsically linked. Sustained growth is strongly associated with poverty reduction, and trade and growth are strongly linked.
Trade is an important source of both fi nancial and non-fi nancial means for development. International trade is an important source of revenue and capital investment that is essential for structural transformation. The 2030 develop-ment agenda requires signifi cant increases in development fi nance and international trade could play an important contributory role, particularly for LDCs.
Trade policy should not only promote trade, but use improvements in trade to promote more inclusive and sustain-able development. The Aid-for-Trade Initiative helps countries improve policy coherence in relation to trade and economic development whilst adhering to wider social and environmental development objectives
The Rome Declaration (1996) considers trade to be a key element in achieving world food security through enabling food consumption to exceed food production and helping to overcome variations in production and consumption.
The Addis Ababa Action Agenda (2015) notes the importance of trade fi nance for maximizing a country’s trading po-tential through allowing it to seize opportunities to use trade as an engine for development. The Agenda advocates for a signifi cant increase world trade, seeking to double the share of global exports of LDCs by 2020, but in a way which is consistent with the attainment of the sustainable development goals.
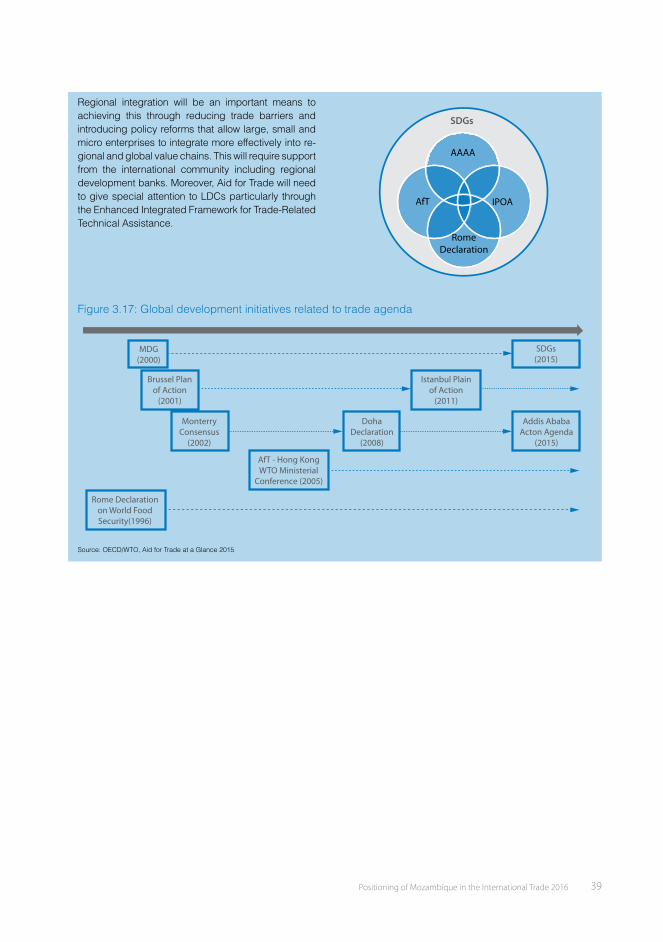
Positioning of Mozambique in the International Trade 2016 39
Regional integration will be an important means to achieving this through reducing trade barriers and introducing policy reforms that allow large, small and micro enterprises to integrate more effectively into re-gional and global value chains. This will require support from the international community including regional development banks. Moreover, Aid for Trade will need to give special attention to LDCs particularly through the Enhanced Integrated Framework for Trade-Related Technical Assistance.
SDGs
AAAA
AfT IPOA
RomeDeclaration
Figure 3.17: Global development initiatives related to trade agenda
MDG(2000)
Brussel Planof Action
(2001)
MonterryConsensus
(2002)
DohaDeclaration
(2008)
Addis AbabaActon Agenda
(2015)
Istanbul Plainof Action
(2011)
SDGs(2015)
AfT - Hong KongWTO Ministerial
Conference (2005)
Rome Declarationon World FoodSecurity(1996)
Source: OECD/WTO, Aid for Trade at a Glance 2015
Positioning of Mozambique in the International Trade 2016 41
Figure 4.1: Organigram – Ministry of Industry and Commerce
MinistroVice Ministro
Secretaria Permanente
IPEX Instituto para a Promoção de Exportações
ICM Instituto de Cereais de Moçambique
IPI Instituto da Propriedade Industrial
INNOQ Instituto Nacional de Normalização e Qualidade
IPEME Instituto Promoção das Pequenas e Medias Empresas
INAE Inspecção Nacional das Actividades Económicas
BMM Bolsa de Mercadorias de Moçambique
Gabinete do Ministro
Gabinete Jurídico
Inspeção da Industria e Comercio
Conselho Coordenador(uma vez por ano)
Conselho Consultivo(bimensalmente)
Conselho Técnico(semanal)
DNI
Direcção Nacional da
Industria
DNCI
Direcção Nacional do
Comercio Interno
DNCE
Direcção Nacional do
Comercio Externo
DASP
Dirceção Nacional da
Apoio ao Desenvolvi-mento do
Sector Privado
DPE
Direcção do Plani�cação
e Estudos
DTIC
Departa-mento de
Tecnologias de
Informação e Comuni-
cação
DAF
Departa-mento de Adminis-tração e Finanças
DRH
Departa-mento de Recursos Humanos
DA
Departa-mento de
Aquisições
DCI
Departa-mento de Comuni-cação e Imagem
BAU Balcões de Atendimento Único
Instituição Subordinadas/Tuteladas
Colectivos de MIC
Box 4.1: Functions attributed to the Ministry of Industry and Commerce � Preparation of proposals and monitoring the implementation of policies and industrial development
strategies;
� Promotion of a legal and institutional framework for the development of the sector;
� Promotion of services relating to standards and quality;
� Protection of industrial property rights and combating unfair competition;
� Streamlining the inspection and supervision of economic activities;
� Promote measures that protect consumer rights;
� Coordinate with other government agencies to ensure competition;
� Inter-sectoral coordination for private sector development;
� Promotion of industrialization and the modernize the economy;
� Promotion of industrial production, agro-processing and industrial competitiveness;
� Promote cooperation with a view to mobilizing technical assistance and sector programs;
� Promote the development of infrastructure for agricultural marketing and to support industrial activity;
� Development and promotion of exports;
� Promote the development of products with added value and local content;
� Promotion of industrial research and development; and
� Promote the participation of the private sector in industrial development, trade and services.
40 Positioning of Mozambique in the International Trade 2016
Policy and Institutional Framework for Trade in Mozambique
C h a p t e r IV
revised in April 2016 and attribute 16 functions to the Ministry (Box 4.1).
To operationalize these functions, MIC has defi ned four key policy areas
1. Industry
2. Internal commerce
3. External commerce
4. Support to the Private Sector
and these are refl ected in the organizational struc-ture of the Ministry that was redefi ned in its Statute. There are also a number of specialized institutions that perform specifi c functions in in the context of the mandate of the MIC and fall under the Ministry’s supervision (Fig. 4.1).
4.1 Policy and Institutional Framework in the Trade Sector
Trade is a cross-cutting issue which impacts nearly every sector and which therefore requires a holis-tic and integrated approach to ensure effective and effi cient policy measures. Moreover, given that the private sector is the key player in the trade sector, the role of government in terms of promoting and facilitating the role of the private sector in economic development and improving the business environ-ment is critical to the growth of both domestic and international trade.
The Ministry of Industry and Commerce (MIC) is the key institution with the mandate to promote trade, improve competitiveness and coordinate this cross-cutting issue across various sectors and institutions in order to maximize efforts to improve trade. The statute setting out the competencies of MIC were
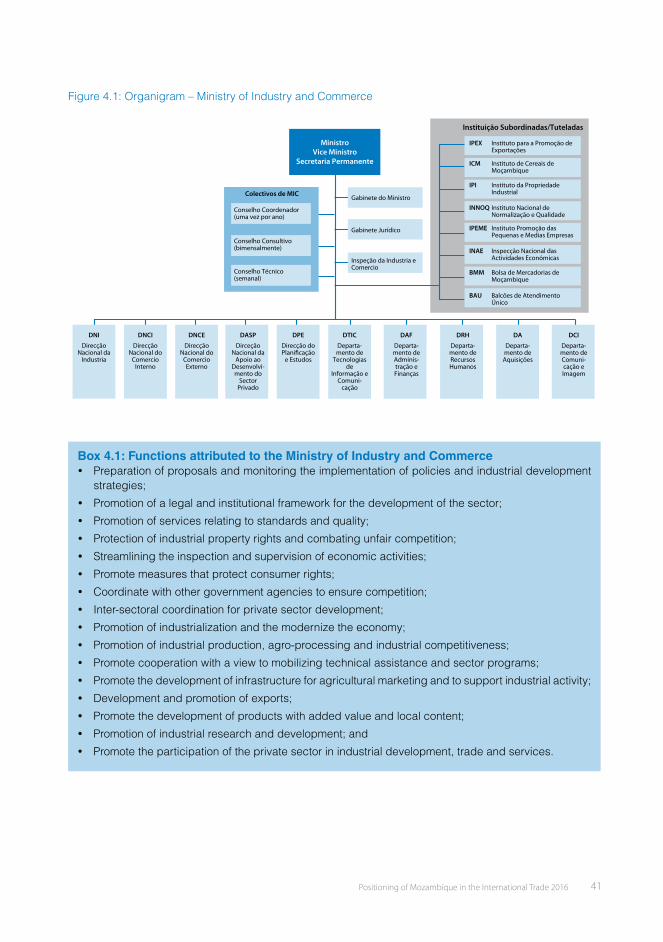
Positioning of Mozambique in the International Trade 2016 41
Figure 4.1: Organigram – Ministry of Industry and Commerce
MinistroVice Ministro
Secretaria Permanente
IPEX Instituto para a Promoção de Exportações
ICM Instituto de Cereais de Moçambique
IPI Instituto da Propriedade Industrial
INNOQ Instituto Nacional de Normalização e Qualidade
IPEME Instituto Promoção das Pequenas e Medias Empresas
INAE Inspecção Nacional das Actividades Económicas
BMM Bolsa de Mercadorias de Moçambique
Gabinete do Ministro
Gabinete Jurídico
Inspeção da Industria e Comercio
Conselho Coordenador(uma vez por ano)
Conselho Consultivo(bimensalmente)
Conselho Técnico(semanal)
DNI
Direcção Nacional da
Industria
DNCI
Direcção Nacional do
Comercio Interno
DNCE
Direcção Nacional do
Comercio Externo
DASP
Dirceção Nacional da
Apoio ao Desenvolvi-mento do
Sector Privado
DPE
Direcção do Plani�cação
e Estudos
DTIC
Departa-mento de
Tecnologias de
Informação e Comuni-
cação
DAF
Departa-mento de Adminis-tração e Finanças
DRH
Departa-mento de Recursos Humanos
DA
Departa-mento de
Aquisições
DCI
Departa-mento de Comuni-cação e Imagem
BAU Balcões de Atendimento Único
Instituição Subordinadas/Tuteladas
Colectivos de MIC
Box 4.1: Functions attributed to the Ministry of Industry and Commerce � Preparation of proposals and monitoring the implementation of policies and industrial development
strategies;
� Promotion of a legal and institutional framework for the development of the sector;
� Promotion of services relating to standards and quality;
� Protection of industrial property rights and combating unfair competition;
� Streamlining the inspection and supervision of economic activities;
� Promote measures that protect consumer rights;
� Coordinate with other government agencies to ensure competition;
� Inter-sectoral coordination for private sector development;
� Promotion of industrialization and the modernize the economy;
� Promotion of industrial production, agro-processing and industrial competitiveness;
� Promote cooperation with a view to mobilizing technical assistance and sector programs;
� Promote the development of infrastructure for agricultural marketing and to support industrial activity;
� Development and promotion of exports;
� Promote the development of products with added value and local content;
� Promotion of industrial research and development; and
� Promote the participation of the private sector in industrial development, trade and services.
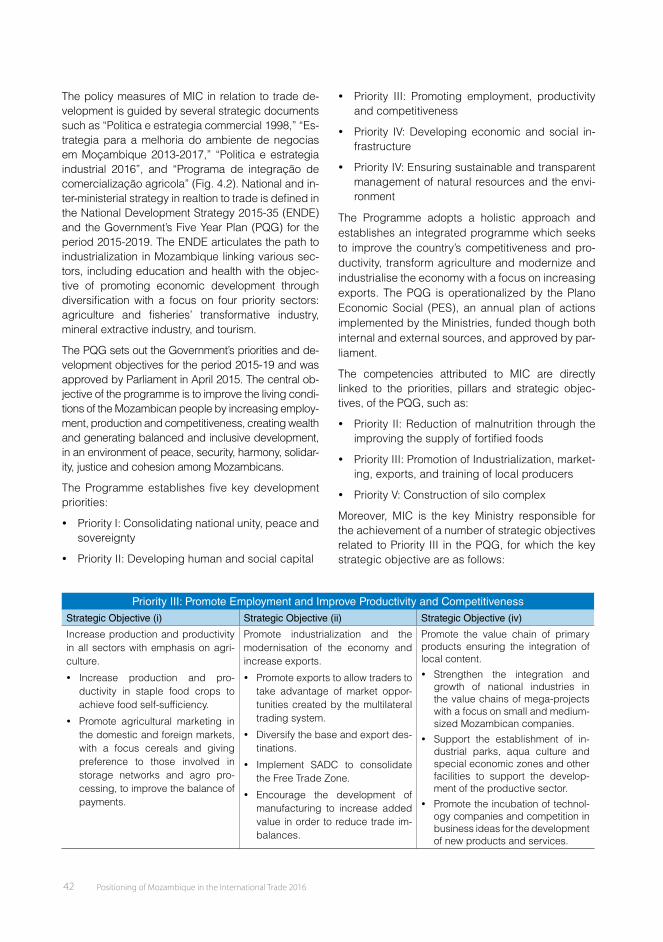
Positioning of Mozambique in the International Trade 2016 43
Given the multi-sectoral and cross-cutting nature of trade promotion in a global economy, it is of the ut-most importance that in exercising its functions, MIC coordinates and collaborates with other Ministries and participates in the formulation and implementa-tion of policy and strategies that are relevant for its remit. For instance, policy coordination is important with the of Agriculture and Food Security (MASA)
in relation to the implementation of the Strategic Plan for the Development of the Agricultural Sector 2010-2019; with the Ministry of the Sea, Inland Water and Fishery (MMAIP) regarding the National Programme for the Development of Fishing 2010-2019; and with Ministry of the Economy and Finance (MEF) related to the Integrated Investment Programme for strate-gic infrastructure development.
Figure 4.2: Policy and strategic framework – Ministry of Industry and Commerce
PES 2016
Politica e estratégia comercial 1998
Estudo Diagnostico para Integração do Comercio (EDIC) 2014
Politica e estratégia industrial 2016
Estratégia para a Melhoria do Ambiente de Negócios em
Moçambique (EMAN 2) 2013-2017
Programa Integrado de Comerciali-zação Agrícola (PICA)
Lei do Sistema Nacional de Qualidade
Estrategia para o Desenvolvimento das Pequenas e Medias Empresas
em Mocambique 2007
MASA - PEDSA, PNISA, etc.MMAIP - PDP, PESPA, etc.
MEF - PII, etc.
Politica e Estratégias ligado nos outros sectores (e.g. MASA, MMAIP, MEF)
Politica e Estratégias ligado ao missão de MIC
PQG 2015-2019
Estratégia Nacional de Desenvolvimento 2015-2035 (ENDE)
(National Level)
(Other Ministry)
(MIC)
Box 4.2: Trade related issues coordination mechanism – Aid for Trade and EIF in Mozambique
The Enhanced Integrated Framework (EIF) is the only global initiative on Aid for Trade (AfT) for Least Developed Countries. Mozambique became eligible for support under the Integrated Framework (IF) in 2004 and later by the EIF in 2010. Support is given under Tier 1 and Tier 2 projects. Current support is for Tier 1 projects which include an update of the Diagnostic of Trade Integration Study (DTIS), capacity building for trade-related institutions, and trade mainstreaming actions such as workshops and studies. Tier 2 projects are based on the priorities defi ned in the DTIS Action Matrix fi nalized in 2014. The EIF is also providing technical assistance to national stakeholders to identify, select, prioritize, and draft small-scale business development projects and mobilize fi nancial resources.
One of the key challenges faced by Mozambique in the area of trade policy in general, and AfT in particular, is the weakness of coordination mechanisms at institutional and policy levels. There is no single body responsible for the coordination of trade issues and mechanisms tend to be established on an ad hoc basis to address specifi c issues.
42 Positioning of Mozambique in the International Trade 2016
The policy measures of MIC in relation to trade de-velopment is guided by several strategic documents such as “Politica e estrategia commercial 1998,” “Es-trategia para a melhoria do ambiente de negocias em Moçambique 2013-2017,” “Politica e estrategia industrial 2016”, and “Programa de integração de comercialização agricola” (Fig. 4.2). National and in-ter-ministerial strategy in realtion to trade is defi ned in the National Development Strategy 2015-35 (ENDE) and the Government’s Five Year Plan (PQG) for the period 2015-2019. The ENDE articulates the path to industrialization in Mozambique linking various sec-tors, including education and health with the objec-tive of promoting economic development through diversifi cation with a focus on four priority sectors: agriculture and fi sheries’ transformative industry, mineral extractive industry, and tourism.
The PQG sets out the Government’s priorities and de-velopment objectives for the period 2015-19 and was approved by Parliament in April 2015. The central ob-jective of the programme is to improve the living condi-tions of the Mozambican people by increasing employ-ment, production and competitiveness, creating wealth and generating balanced and inclusive development, in an environment of peace, security, harmony, solidar-ity, justice and cohesion among Mozambicans.
The Programme establishes fi ve key development priorities:
� Priority I: Consolidating national unity, peace and sovereignty
� Priority II: Developing human and social capital
� Priority III: Promoting employment, productivity and competitiveness
� Priority IV: Developing economic and social in-frastructure
� Priority IV: Ensuring sustainable and transparent management of natural resources and the envi-ronment
The Programme adopts a holistic approach and establishes an integrated programme which seeks to improve the country’s competitiveness and pro-ductivity, transform agriculture and modernize and industrialise the economy with a focus on increasing exports. The PQG is operationalized by the Plano Economic Social (PES), an annual plan of actions implemented by the Ministries, funded though both internal and external sources, and approved by par-liament.
The competencies attributed to MIC are directly linked to the priorities, pillars and strategic objec-tives, of the PQG, such as:
� Priority II: Reduction of malnutrition through the improving the supply of fortifi ed foods
� Priority III: Promotion of Industrialization, market-ing, exports, and training of local producers
� Priority V: Construction of silo complex
Moreover, MIC is the key Ministry responsible for the achievement of a number of strategic objectives related to Priority III in the PQG, for which the key strategic objective are as follows:
Priority III: Promote Employment and Improve Productivity and Competitiveness
Strategic Objective (i) Strategic Objective (ii) Strategic Objective (iv)
Increase production and productivity in all sectors with emphasis on agri-culture.
� Increase production and pro-ductivity in staple food crops to achieve food self-suffi ciency.
� Promote agricultural marketing in the domestic and foreign markets, with a focus cereals and giving preference to those involved in storage networks and agro pro-cessing, to improve the balance of payments.
Promote industrialization and the modernisation of the economy and increase exports.
� Promote exports to allow traders to take advantage of market oppor-tunities created by the multilateral trading system.
� Diversify the base and export des-tinations.
� Implement SADC to consolidate the Free Trade Zone.
� Encourage the development of manufacturing to increase added value in order to reduce trade im-balances.
Promote the value chain of primary products ensuring the integration of local content.
� Strengthen the integration and growth of national industries in the value chains of mega-projects with a focus on small and medium-sized Mozambican companies.
� Support the establishment of in-dustrial parks, aqua culture and special economic zones and other facilities to support the develop-ment of the productive sector.
� Promote the incubation of technol-ogy companies and competition in business ideas for the development of new products and services.
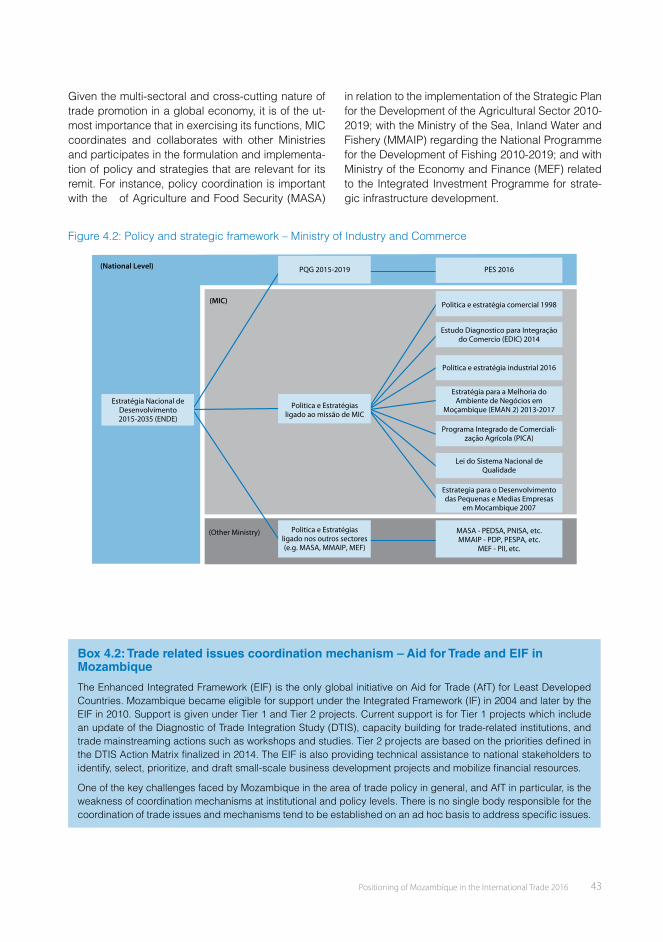
Positioning of Mozambique in the International Trade 2016 43
Given the multi-sectoral and cross-cutting nature of trade promotion in a global economy, it is of the ut-most importance that in exercising its functions, MIC coordinates and collaborates with other Ministries and participates in the formulation and implementa-tion of policy and strategies that are relevant for its remit. For instance, policy coordination is important with the of Agriculture and Food Security (MASA)
in relation to the implementation of the Strategic Plan for the Development of the Agricultural Sector 2010-2019; with the Ministry of the Sea, Inland Water and Fishery (MMAIP) regarding the National Programme for the Development of Fishing 2010-2019; and with Ministry of the Economy and Finance (MEF) related to the Integrated Investment Programme for strate-gic infrastructure development.
Figure 4.2: Policy and strategic framework – Ministry of Industry and Commerce
PES 2016
Politica e estratégia comercial 1998
Estudo Diagnostico para Integração do Comercio (EDIC) 2014
Politica e estratégia industrial 2016
Estratégia para a Melhoria do Ambiente de Negócios em
Moçambique (EMAN 2) 2013-2017
Programa Integrado de Comerciali-zação Agrícola (PICA)
Lei do Sistema Nacional de Qualidade
Estrategia para o Desenvolvimento das Pequenas e Medias Empresas
em Mocambique 2007
MASA - PEDSA, PNISA, etc.MMAIP - PDP, PESPA, etc.
MEF - PII, etc.
Politica e Estratégias ligado nos outros sectores (e.g. MASA, MMAIP, MEF)
Politica e Estratégias ligado ao missão de MIC
PQG 2015-2019
Estratégia Nacional de Desenvolvimento 2015-2035 (ENDE)
(National Level)
(Other Ministry)
(MIC)
Box 4.2: Trade related issues coordination mechanism – Aid for Trade and EIF in Mozambique
The Enhanced Integrated Framework (EIF) is the only global initiative on Aid for Trade (AfT) for Least Developed Countries. Mozambique became eligible for support under the Integrated Framework (IF) in 2004 and later by the EIF in 2010. Support is given under Tier 1 and Tier 2 projects. Current support is for Tier 1 projects which include an update of the Diagnostic of Trade Integration Study (DTIS), capacity building for trade-related institutions, and trade mainstreaming actions such as workshops and studies. Tier 2 projects are based on the priorities defi ned in the DTIS Action Matrix fi nalized in 2014. The EIF is also providing technical assistance to national stakeholders to identify, select, prioritize, and draft small-scale business development projects and mobilize fi nancial resources.
One of the key challenges faced by Mozambique in the area of trade policy in general, and AfT in particular, is the weakness of coordination mechanisms at institutional and policy levels. There is no single body responsible for the coordination of trade issues and mechanisms tend to be established on an ad hoc basis to address specifi c issues.

Positioning of Mozambique in the International Trade 2016 45
also the tripartite SADC-EAC-COMESA which is currently being negotiated
� Unilateral initiatives: This mainly refers to the Preferential Trade Agreements (PTA) provided to LDCs, including the African Growth and Oppor-tunity Act (AGOA). (Table 4.1)
� Multilateral Agreements: this refers to the trade negotiations among WTO member countries. The Doha Round is the current trade negotia-tion round launched in 2001, also known as Doha Development Agenda as it focusses on trade prospects of developing countries. In 2013, WTO members concluded negations
Trade tariff are a key measure in international trade to promote trade and also nurture domestic indus-try and business. In 2014, the applied tariff for agri-cultural products was 13.8%, while the bound tariff
on a Trade Facilitation Agreement (Bali Min-isterial Declaration adopted on December 2013) which will enter into once two-thirds of WTO members have completed the ratifica-tion process. In Mozambique the ratification process is on-going (as of July 2016). Mo-zambique participates in several negotiations in the Doha round as a group of ACP (African, Caribbean and Pacific countries with prefer-ences in the EU), the African Group (African members of the WTO), LDCs, G-33 (Coalition of developing country pressing for flexibility to undertake limited market opening in agri-culture).
Table 4.1: Preferential Trade Agreements - Mozambique
Country TypeYear of Entry into
ForcePTA sub-schemes
EU GSP 1971 GSP+, Everything but Arms (LDCs)
Japan GSP 1971 LDCs
Norway GSP 1971 GSP zero, GSP plus
Switzerland GSP 1972 LDSs and countries undergoing debt relief
Australia GSP 1974 LDCs
New Zealand GSP 1972 LDCs
Canada GSP 1974 LDCs
USA GSP 1979 LDCs
USA Other PTAs 2000 Textile and apparel benefi ts
Morocco LDC-specifi c 2001
Turkey GSP 2002 LDSs, Special incentive arrangement
Iceland GSP 2002
Chinese Taipei LDC-specifi c 2003
Tajikistan LDC-specifi c 2003
Kyrgyz LDC-specifi c 2006
India LDC-specifi c 2008
China LDC-specifi c 2010
Russia GSP 2010 LDCs
Kazakhstan GSP 2010 LDCs
Belarus GSP 2010 LDCs
Chile LDC-specifi c 2014
Thailand LDC-specifi c 2015Source: WTO
was set at 100%. On non-agriculture products, the applied tariff was 9.5%, while the bound tariff was 22.8%. Figure 4.3 shows the tariff applied to prod-ucts imported in Mozambique in 2014.
44 Positioning of Mozambique in the International Trade 2016
Two examples are worth noting. The EIF National Steering Committee was set up to monitor the implementation of the EIF at national level. It meets on a quarterly under the chairmanship of the Director of External Trade (MIC) its members comprise representatives from the public and private sectors, civil society, academia and development partners. Despite the importance of the issues addressed by the EIF the level of engagement by stakeholders needs to improve. The establishment of the National Committee on Trade Facilitation was a recommendation of the 2013 WTO’s Trade Facilitation Agreement and is expected to be set up as a sub-group Inter-Ministerial Group for the Removal of Trade Barriers (GIRBI - Grupo Inter-Ministerial de Remoção de Barreiras ao Investimento) which meets quarterly under the chairmanship of the MIC at technical level, and the Prime Minister at political level. These examples show how that whilst mechanisms are structured in a manner to produce results, at the same time they pose challenges for the coordination of efforts at a national level.
At the policy level coordination is also essential. On the one hand, policy instruments such as the African Union’s Comprehensive African Agriculture Development Program (CAADP), PQG 2015-2019 and the National Strategic Plan for the Development of the Agricultural Sector (PEDSA) stress the importance of the need to increase produc-tion, productivity, jobs and income from agricultural products. On the other hand, the government needs to ensure that the operationalization of these policies and strategies are effectively aligned with MIC’s policy instruments including the Industrial Policy and Strategy 2015-2025, the Trade Policy and Strategy, and DTIS 2014 to better facilitate integration of the domestic economy with regional and global value chains.
EIF Coordination Mechanism - Inter-institutional committee
Private Sector (CTA,
etc.)
MASA
MMAIP
MEF
MINEC
MITESSMITADER
MTC
MCT
MIREME
MIC
Multilateral Cooperation
(WTO, UN, IFI, etc.)
Academia/ Think-tank (UEM, ACIS, CEMO, etc.)
Civil Society, Media
Bilateral Cooperation
4.2 International Trade Agreements
There are a number of international trade agreements in force in Mozambique which provide the framework for the promotion of bilateral and multi-lateral trade. International trade agreements, to which Mozam-bique is a party, can be grouped in to four types:
� Bilateral Agreements: Agreements with Zimba-bwe (2004) and Malawi (2006)
� Regional Agreements: These include the SADC Free Trade Zone, the SADC-EU Economic Part-nership Agreements (signed in June 2016), and
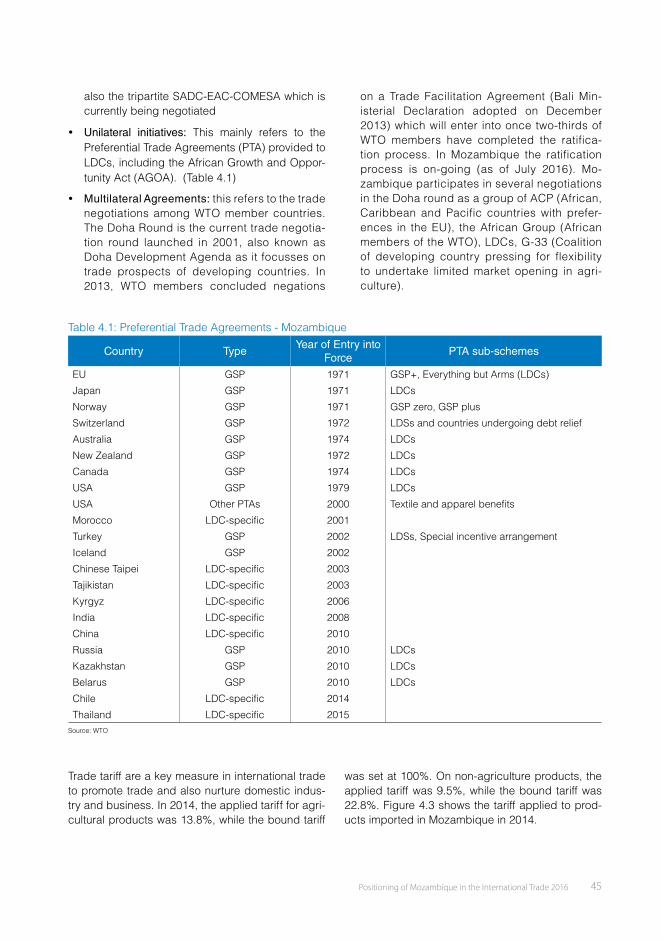
Positioning of Mozambique in the International Trade 2016 45
also the tripartite SADC-EAC-COMESA which is currently being negotiated
� Unilateral initiatives: This mainly refers to the Preferential Trade Agreements (PTA) provided to LDCs, including the African Growth and Oppor-tunity Act (AGOA). (Table 4.1)
� Multilateral Agreements: this refers to the trade negotiations among WTO member countries. The Doha Round is the current trade negotia-tion round launched in 2001, also known as Doha Development Agenda as it focusses on trade prospects of developing countries. In 2013, WTO members concluded negations
Trade tariff are a key measure in international trade to promote trade and also nurture domestic indus-try and business. In 2014, the applied tariff for agri-cultural products was 13.8%, while the bound tariff
on a Trade Facilitation Agreement (Bali Min-isterial Declaration adopted on December 2013) which will enter into once two-thirds of WTO members have completed the ratifica-tion process. In Mozambique the ratification process is on-going (as of July 2016). Mo-zambique participates in several negotiations in the Doha round as a group of ACP (African, Caribbean and Pacific countries with prefer-ences in the EU), the African Group (African members of the WTO), LDCs, G-33 (Coalition of developing country pressing for flexibility to undertake limited market opening in agri-culture).
Table 4.1: Preferential Trade Agreements - Mozambique
Country TypeYear of Entry into
ForcePTA sub-schemes
EU GSP 1971 GSP+, Everything but Arms (LDCs)
Japan GSP 1971 LDCs
Norway GSP 1971 GSP zero, GSP plus
Switzerland GSP 1972 LDSs and countries undergoing debt relief
Australia GSP 1974 LDCs
New Zealand GSP 1972 LDCs
Canada GSP 1974 LDCs
USA GSP 1979 LDCs
USA Other PTAs 2000 Textile and apparel benefi ts
Morocco LDC-specifi c 2001
Turkey GSP 2002 LDSs, Special incentive arrangement
Iceland GSP 2002
Chinese Taipei LDC-specifi c 2003
Tajikistan LDC-specifi c 2003
Kyrgyz LDC-specifi c 2006
India LDC-specifi c 2008
China LDC-specifi c 2010
Russia GSP 2010 LDCs
Kazakhstan GSP 2010 LDCs
Belarus GSP 2010 LDCs
Chile LDC-specifi c 2014
Thailand LDC-specifi c 2015Source: WTO
was set at 100%. On non-agriculture products, the applied tariff was 9.5%, while the bound tariff was 22.8%. Figure 4.3 shows the tariff applied to prod-ucts imported in Mozambique in 2014.

Positioning of Mozambique in the International Trade 2016 47
Table 4.3: Doing Business 2016 (comparison w/selected countries in Sub-Saharan Africa)
Glo
bal R
ank
(out
of 1
89)
Sta
rtin
g a
Bus
ines
s
Dea
ling
with
C
onst
ruct
ion
Per
mits
Get
ting
Ele
ctric
ity
Reg
iste
ring
Pro
pert
y
Get
ting
Cre
dit
Pro
tect
ing
Min
ority
In
vest
ors
Pay
ing
Taxe
s
Trad
ing
Acr
oss
Bor
ders
Enf
orci
ng C
ontr
acts
Res
olvi
ng In
solv
ency
Mauritius 32 3 2 1 9 4 3 1 4 1 1
Rwanda 62 14 3 8 1 1 9 5 28 20 6
Botswana 72 28 11 10 3 10 7 6 3 21 3
South Africa 73 17 10 31 11 7 1 2 21 16 2
Seychelles 95 22 20 16 2 13 15 3 7 23 4
Zambia 97 8 14 11 32 2 9 4 26 22 15
Namibia 101 35 5 2 41 7 4 9 15 10 11
Swaziland 105 32 8 25 15 10 22 8 1 41 10
Kenya 108 31 28 12 17 3 17 11 22 9 29
Ghana 114 13 23 9 5 4 4 15 36 14 36
Lesotho 114 15 38 20 13 33 12 16 2 8 22
Uganda 122 36 33 30 18 4 12 14 19 6 14
Cabo Verde 126 7 12 17 4 13 37 10 11 2 39
Mozambique 133 18 1 28 12 33 12 20 20 46 5
Tanzania 139 21 21 3 22 33 20 26 40 3 12
Malawi 141 33 4 35 7 33 17 12 16 28 37
Zimbabwe 155 43 46 27 16 12 7 24 8 38 33
Angola 181 27 13 29 38 45 4 23 41 47 39Source: World Bank, Doing Business 2016
4.3 Business Environment in Mozambique
Doing Business
“Doing Business”, annually produced by World Bank Group since 2003, measures 10 aspects of a country’s legal and regulatory framework to compare the ease of doing business in global context. According to Doing Business 2016, Mo-zambique was positioned in 133rd place in the index of a total of 189 countries. Table 4.3 shows a comparison of the rankings of Sub-Saharan Af-rican countries and highlights that Mozambique
performs relatively well in relation to dealing with construction permits, resolving insolvency, pro-tecting minority investors and registering proper-ty, while under-performing in the area of connect-ing to electricity, accessing credit and enforcing contracts. It is worthwhile to note that Rwanda records excellent performance in terms of getting credit which position the country 2nd rank among Sub-Saharan African countries.
46 Positioning of Mozambique in the International Trade 2016
Figure 4.3: Average MFN applied duties 2014 – Mozambique
0
ClothingFish & �sh products
Animal productsBeverages & tobacco
Co�ee, teaFruit, vegetables, plants
Dairy productsTextiles
Cereals & preparationsLeather, footwear, etc.
Wood, paper, etc.Oilseeds, fat & oils
Sugars and confectioneryElectrical machinery
Transport equipamentMinerals & metals
Non-electrical machineryPetroleumChemicals
Cotton
2 4 6 8 10 12 14 16 18 20
Source: WTO
Trade agreements and investment agreements are inseparable legal frameworks in global economic sys-tem, as both promote fl ows of goods, fi nancial means,
and human resources between two or more countries. Table 4.2 shows the bilateral investment agreements in force in Mozambique and/or signed bilaterally.
Table 4.2: Bilateral investment agreements – Mozambique Country Year of Signature Year of Entry into Force
Zimbabwe 1990
Portugal 1996 1998Mauritius 1997 2003South Africa 1997 1998Algeria 1998 2000Egypt 1998Italy 1998 2003United States of America 1998 2005Indonesia 1999 2000China 2001 2002Cuba 2001 2002Netherlands 2001 2004Sweden 2001 2007Denmark 2002 2002France 2002 2006Germany 2002 2007Switzerland 2002 2004United Arab Emirates 2003Finland 2004 2005United Kingdom 2004 2004United States of America (TIFA) 2005 2005BLEU (Belgium-Luxembourg Economic Union)
2006 2009
Viet Nam 2007 2007India 2009 2009Spain 2010Japan 2013 2014Brazil 2015Singapore 2016
Source: UNCTAD
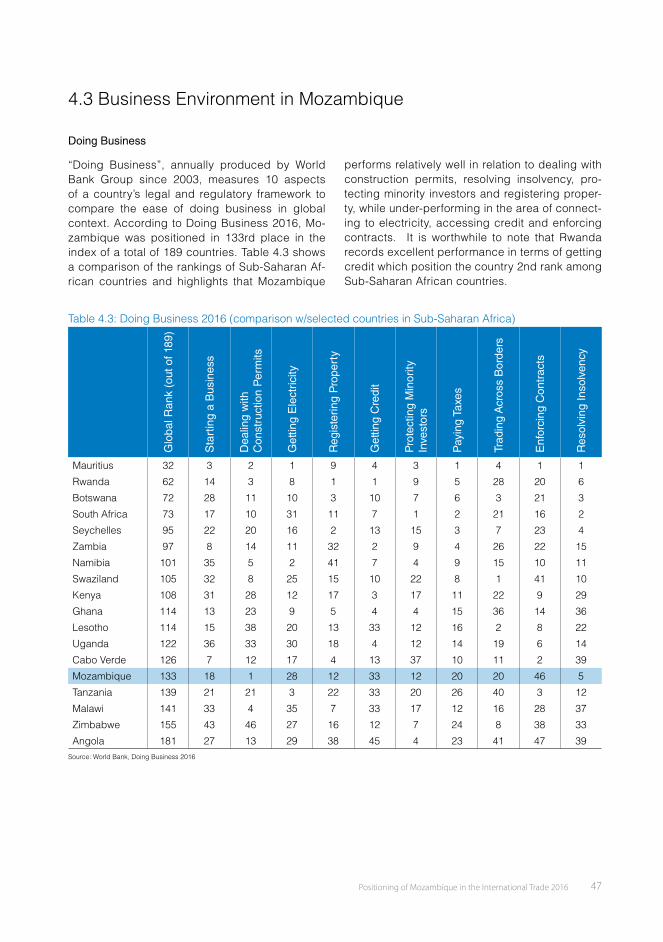
Positioning of Mozambique in the International Trade 2016 47
Table 4.3: Doing Business 2016 (comparison w/selected countries in Sub-Saharan Africa)
Glo
bal R
ank
(out
of 1
89)
Sta
rtin
g a
Bus
ines
s
Dea
ling
with
C
onst
ruct
ion
Per
mits
Get
ting
Ele
ctric
ity
Reg
iste
ring
Pro
pert
y
Get
ting
Cre
dit
Pro
tect
ing
Min
ority
In
vest
ors
Pay
ing
Taxe
s
Trad
ing
Acr
oss
Bor
ders
Enf
orci
ng C
ontr
acts
Res
olvi
ng In
solv
ency
Mauritius 32 3 2 1 9 4 3 1 4 1 1
Rwanda 62 14 3 8 1 1 9 5 28 20 6
Botswana 72 28 11 10 3 10 7 6 3 21 3
South Africa 73 17 10 31 11 7 1 2 21 16 2
Seychelles 95 22 20 16 2 13 15 3 7 23 4
Zambia 97 8 14 11 32 2 9 4 26 22 15
Namibia 101 35 5 2 41 7 4 9 15 10 11
Swaziland 105 32 8 25 15 10 22 8 1 41 10
Kenya 108 31 28 12 17 3 17 11 22 9 29
Ghana 114 13 23 9 5 4 4 15 36 14 36
Lesotho 114 15 38 20 13 33 12 16 2 8 22
Uganda 122 36 33 30 18 4 12 14 19 6 14
Cabo Verde 126 7 12 17 4 13 37 10 11 2 39
Mozambique 133 18 1 28 12 33 12 20 20 46 5
Tanzania 139 21 21 3 22 33 20 26 40 3 12
Malawi 141 33 4 35 7 33 17 12 16 28 37
Zimbabwe 155 43 46 27 16 12 7 24 8 38 33
Angola 181 27 13 29 38 45 4 23 41 47 39Source: World Bank, Doing Business 2016
4.3 Business Environment in Mozambique
Doing Business
“Doing Business”, annually produced by World Bank Group since 2003, measures 10 aspects of a country’s legal and regulatory framework to compare the ease of doing business in global context. According to Doing Business 2016, Mo-zambique was positioned in 133rd place in the index of a total of 189 countries. Table 4.3 shows a comparison of the rankings of Sub-Saharan Af-rican countries and highlights that Mozambique
performs relatively well in relation to dealing with construction permits, resolving insolvency, pro-tecting minority investors and registering proper-ty, while under-performing in the area of connect-ing to electricity, accessing credit and enforcing contracts. It is worthwhile to note that Rwanda records excellent performance in terms of getting credit which position the country 2nd rank among Sub-Saharan African countries.
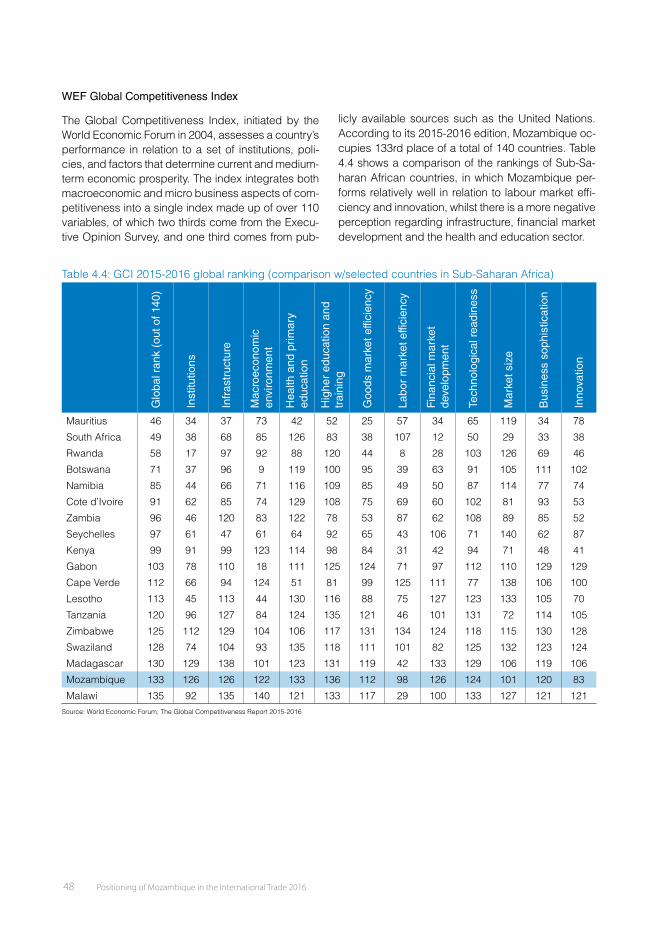
Positioning of Mozambique in the International Trade 2016 49
Box 4.3: Logistics Performance Index (LPI)
The Logistics Performance Index has been prepared annually by the World Bank since 2010 and it represents an in-teractive benchmarking tool created to help countries identify the challenges and opportunities they face in their per-formance on trade logistics and what they can do to improve their performance. The LPI 2016 allows for comparisons across 160 countries. Mozambique scores relatively well at 9th position in the index for the Southern African region and in 88th place globally and performs well on international shipments and tracking and tracing of goods. Overall Mozambique’s performance in the index has improved since 2010 particularly in relation to timeliness of shipping, customs and tracking and tracing which probably refl ects works undertaken to upgrade the port of Nacala.
Figure 4.4: LPI – Mozambique 2010 vs 2016
Customs
Infrastructure
InternationalShipments
Logistics quality
Mozambique 2016 Mozambique 2010
Timeliness ofshipmant
Tracking and tracing
5
4
3
2
1
0
� Customs: The effi ciency of customs and border management clearance.
� Infrastructure: The quality of trade and transport infrastructure.
� International shipments: The ease of arranging competitively priced shipments.
� Logistics quali ty and competence: The compe-tence and quality of logistics services—truck-ing, forwarding, and customs brokerage.
� Tracking and tracing: The ability to track and trace consignments.
� Timeliness of shipment: The frequency with which shipments reach consignees within scheduled or expected delivery times
Table 4.5: LPI 2016 Sub-Saharan Africa ranking (comparison w/selected countries)
LPI O
vera
ll R
ank
Cus
tom
s
Infr
astr
uctu
re
Inte
rnat
iona
l S
hipm
ents
Logi
stic
s qu
ality
an
d co
mpe
tenc
e
Trac
king
and
tr
acin
g
Tim
elin
ess
of
ship
men
t
Regional GlobalSouth Africa 1 20 18 21 23 22 17 24Kenya 2 42 39 42 46 40 38 46Botswana 3 57 48 54 70 75 70 43Uganda 4 58 51 67 74 57 59 45Tanzania 5 61 60 60 63 58 60 64Rwanda 6 62 52 76 59 63 58 69Namibia 7 79 73 64 86 86 100 85Burkina Faso 8 81 84 71 83 71 103 88Mozambique 9 84 88 116 58 109 79 97Ghana 10 88 93 86 85 98 101 82Nigeria 11 90 92 96 118 74 82 95Togo 12 92 89 117 93 106 91 76Côte d’Ivoire 13 95 70 89 105 87 89 128
Source: World Bank, Connecting to Compete Trade Logistics in the Global Economy 2016
48 Positioning of Mozambique in the International Trade 2016
Table 4.4: GCI 2015-2016 global ranking (comparison w/selected countries in Sub-Saharan Africa)
Glo
bal r
ank
(out
of 1
40)
Inst
itutio
ns
Infr
astr
uctu
re
Mac
roec
onom
ic
envi
ronm
ent
Hea
lth a
nd p
rimar
y ed
ucat
ion
Hig
her
educ
atio
n an
d tr
aini
ng
Goo
ds m
arke
t effi
cien
cy
Labo
r m
arke
t effi
cien
cy
Fin
anci
al m
arke
t de
velo
pmen
t
Tech
nolo
gica
l rea
dine
ss
Mar
ket s
ize
Bus
ines
s so
phis
ticat
ion
Inno
vatio
n
Mauritius 46 34 37 73 42 52 25 57 34 65 119 34 78
South Africa 49 38 68 85 126 83 38 107 12 50 29 33 38
Rwanda 58 17 97 92 88 120 44 8 28 103 126 69 46
Botswana 71 37 96 9 119 100 95 39 63 91 105 111 102
Namibia 85 44 66 71 116 109 85 49 50 87 114 77 74
Cote d’Ivoire 91 62 85 74 129 108 75 69 60 102 81 93 53
Zambia 96 46 120 83 122 78 53 87 62 108 89 85 52
Seychelles 97 61 47 61 64 92 65 43 106 71 140 62 87
Kenya 99 91 99 123 114 98 84 31 42 94 71 48 41
Gabon 103 78 110 18 111 125 124 71 97 112 110 129 129
Cape Verde 112 66 94 124 51 81 99 125 111 77 138 106 100
Lesotho 113 45 113 44 130 116 88 75 127 123 133 105 70
Tanzania 120 96 127 84 124 135 121 46 101 131 72 114 105
Zimbabwe 125 112 129 104 106 117 131 134 124 118 115 130 128
Swaziland 128 74 104 93 135 118 111 101 82 125 132 123 124
Madagascar 130 129 138 101 123 131 119 42 133 129 106 119 106
Mozambique 133 126 126 122 133 136 112 98 126 124 101 120 83
Malawi 135 92 135 140 121 133 117 29 100 133 127 121 121Source: World Economic Forum, The Global Competitiveness Report 2015-2016
WEF Global Competitiveness Index
The Global Competitiveness Index, initiated by the World Economic Forum in 2004, assesses a country’s performance in relation to a set of institutions, poli-cies, and factors that determine current and medium-term economic prosperity. The index integrates both macroeconomic and micro business aspects of com-petitiveness into a single index made up of over 110 variables, of which two thirds come from the Execu-tive Opinion Survey, and one third comes from pub-
licly available sources such as the United Nations. According to its 2015-2016 edition, Mozambique oc-cupies 133rd place of a total of 140 countries. Table 4.4 shows a comparison of the rankings of Sub-Sa-haran African countries, in which Mozambique per-forms relatively well in relation to labour market effi -ciency and innovation, whilst there is a more negative perception regarding infrastructure, fi nancial market development and the health and education sector.

Positioning of Mozambique in the International Trade 2016 49
Box 4.3: Logistics Performance Index (LPI)
The Logistics Performance Index has been prepared annually by the World Bank since 2010 and it represents an in-teractive benchmarking tool created to help countries identify the challenges and opportunities they face in their per-formance on trade logistics and what they can do to improve their performance. The LPI 2016 allows for comparisons across 160 countries. Mozambique scores relatively well at 9th position in the index for the Southern African region and in 88th place globally and performs well on international shipments and tracking and tracing of goods. Overall Mozambique’s performance in the index has improved since 2010 particularly in relation to timeliness of shipping, customs and tracking and tracing which probably refl ects works undertaken to upgrade the port of Nacala.
Figure 4.4: LPI – Mozambique 2010 vs 2016
Customs
Infrastructure
InternationalShipments
Logistics quality
Mozambique 2016 Mozambique 2010
Timeliness ofshipmant
Tracking and tracing
5
4
3
2
1
0
� Customs: The effi ciency of customs and border management clearance.
� Infrastructure: The quality of trade and transport infrastructure.
� International shipments: The ease of arranging competitively priced shipments.
� Logistics quali ty and competence: The compe-tence and quality of logistics services—truck-ing, forwarding, and customs brokerage.
� Tracking and tracing: The ability to track and trace consignments.
� Timeliness of shipment: The frequency with which shipments reach consignees within scheduled or expected delivery times
Table 4.5: LPI 2016 Sub-Saharan Africa ranking (comparison w/selected countries)
LPI O
vera
ll R
ank
Cus
tom
s
Infr
astr
uctu
re
Inte
rnat
iona
l S
hipm
ents
Logi
stic
s qu
ality
an
d co
mpe
tenc
e
Trac
king
and
tr
acin
g
Tim
elin
ess
of
ship
men
t
Regional GlobalSouth Africa 1 20 18 21 23 22 17 24Kenya 2 42 39 42 46 40 38 46Botswana 3 57 48 54 70 75 70 43Uganda 4 58 51 67 74 57 59 45Tanzania 5 61 60 60 63 58 60 64Rwanda 6 62 52 76 59 63 58 69Namibia 7 79 73 64 86 86 100 85Burkina Faso 8 81 84 71 83 71 103 88Mozambique 9 84 88 116 58 109 79 97Ghana 10 88 93 86 85 98 101 82Nigeria 11 90 92 96 118 74 82 95Togo 12 92 89 117 93 106 91 76Côte d’Ivoire 13 95 70 89 105 87 89 128
Source: World Bank, Connecting to Compete Trade Logistics in the Global Economy 2016
50 Positioning of Mozambique in the International Trade 2016
Reference
FAO (2015) “The State of Agricultural Commodity Markets 2015-2016,” FAO: Rome
IEA (2015) “World Energy Outlook Special Report - Energy and Climate Change,” IEA: Paris
IMF (2016) “World Economic Outlook Database April 2016,” IMF: Washington DC
INE (2015) “Anuário Estatístico 2014- Moçambique,” INE: Mozambique
OECD-FAO (2015) “Agricultural Outlook 2015-2024,” OECD: Paris
OECD/WTO (2015) “Aid for Trade at a Glance 2015: Reducing Trade Costs for Inclusive, Sustainable Growth,” OECD: Paris
UNCTAD “Investment Policy Hub,” UNCTAD: Geneva
UNCTAD “UNCTADSTAT,” UNCTAD: Geneva
UNDESA “UN Comtrade Database,” the United Nations: New York
UNDESA (2015) “World Population Prospects The 2015 Revision,” United Nations: New York
UNDESA (2015) “World Urbanization Prospects The 2014 Revision,” United Nations: New York
UNIDO (2013) “Industrial Development Report 2013 - Sustaining Employment Growth: The Role of Manufacturing and Structural Change,” UNIDO: Vienna
UNIDO (2015) “Industrial Development Report 2016 - The Role of Technology and Innovation in Inclusive and Sustain-able Industrial Development,” UNIDO: Vienna
World Economic Forum (2015) “The Global Competitiveness Report 2015-2016.” World Economic Forum: Geneva
World Bank (2016) “Connecting to Compete 2016 Trade Logistics in the Global Economy,” World Bank: Washington DC
World Bank (2015) “Doing Business 2016 Measuring Regulatory Quality and Effi ciency,” World Bank: Washington DC
World Bank “Global Consumption Database,” World Bank: Washington DC
World Bank “World Development Indicators,” World Bank: Washington DC
WTO “Trade profi les – Mozambique,” WTO: Geneva
WTO “Regional trade agreements and preferential trade agreements,” WTO: Geneva