positioning for sustainable growth · island gold technical session. agenda. 4. ric: tsx nyse. our...
TRANSCRIPT

POSITIONINGFOR
SUSTAINABLEGROWTH
Island Gold Technical SessionExpansion Case PEA
May 29, 2017

2RIC: TSX NYSE
2
RICHMONT MINESFORWARD-LOOKING STATEMENTSSafe Harbor Statement & Cautionary Note to U.S. Investors Concerning Resources EstimatesThis presentation contains forward-looking statements that include risks and uncertainties. When used in this presentation, the words“estimate”, “projects”, “anticipate”, “expects”, “intend”, “believe”, “hope”, “may”, and similar expressions, as well as “will”, “shall”, and otherindications of future tense, are intended to identify forward-looking statements. The forward-looking statements are based on currentexpectations and apply only as of the date on which they were made. Except as required by law or regulation, Richmont Mines Inc. (“Richmont”or the “Corporation”) undertakes no obligation and disclaims any responsibility to publicly update or revise any forward-looking statements ofinformation, whether as a result of new information, future events or otherwise. The factors that could cause actual results to differ materiallyfrom those indicated in such forward-looking statements include the ability to ramp up productivity to 1,100 tonnes per day in a timely manner,the ability to achieve the enhanced production levels expected, the ability to realize further expansion scenarios, any increases in capital anddevelopment or infrastructure costs, , changes in the prevailing price of gold, the Canadian-U.S. exchange rate, grade of ore mined andunforeseen difficulties in mining operations that could affect revenue and production costs. Other factors such as uncertainties regardinggovernment regulations could also affect the results. Other risks may be detailed from time to time in Richmont’s Annual InformationForm and other public disclosure.
The resource estimates in this presentation were prepared in accordance with National Instrument 43-101 Standards of Disclosure of MineralProjects (“NI 43-101”) adopted by the Canadian Securities Administrators. The requirements of NI 43-101 differ significantly from therequirements of the United States Securities and Exchange Commission (the “SEC”). In this presentation, we use the terms “Measured”,“Indicated” and “Inferred” Resources. Although these terms are recognized and required to be used in Canada, the SEC does notrecognize them. The SEC permits U.S. mining corporations, in their filings with the SEC, to disclose only those mineral deposits that constitute“Reserves”. Under United States standards, mineralization may not be classified as a Reserve unless the determination has been made that themineralization could be economically and legally extracted at the time the determination is made. United States investors should notassume that all or any portion of a Measured or Indicated Resource will ever be converted into “Reserves”. Furthermore. “InferredResources” have a great amount of uncertainty as to their existence and whether they can be mined economically or legally, and United Statesinvestors should not assume that “Inferred Resources” exist or can be legally or economically mined, or that they will ever be upgraded to amore certain category.
An NI 43-101 Technical Report for the Island Gold Mine Expansion Case Preliminary Economic Assessment (“PEA”) will be filed within 45 days.
For additional information regarding the Mineral Reserves and Resources referred to in this presentation, please refer to the press releasedated Jan. 31, 2017 reporting Richmont’s Mineral Reserve and Resource estimates as of Dec. 31. 2016.
U.S. Investors are urged to consider the disclosure in our annual report on Form 40-F. File No. 001-14598, which may be obtained from us orfrom the SEC’s web site: http://sec.gov/edgar.shtml.
(All amounts are in Canadian dollars. unless otherwise indicated.)

3RIC: TSX NYSE
3
Corporate Overview & Key Highlights (Renaud Adams)
Evolution of the Island Gold Mine: Geology and Exploration (Doug McMillan)
Expansion Case PEA (Christian Bourcier)
Underground Mine Plan with Operating and Capital Costs
Milling Plan with Operating and Capital Costs
Financial Analysis (Robert Chausse)
Next Steps and Upside Opportunities (Renaud Adams)
Q&A
ISLAND GOLD TECHNICAL SESSIONAGENDA
4RIC: TSX NYSE
4
Our vision is to become a leading intermediate gold producer focused on theAmericas generating superior per share valuation. We are committed to a “SustainableBusiness Model” and a strategy of long-term growth, and will fully utilize theCorporation’s strong balance sheet, assets, cash flow, capital structure and theextensive experience of the Corporations’ Board of Directors and management team tobuild the next leading Canadian based intermediate gold company.
RICHMONT MINESOUR VISION AND STRATEGY
Our Strategic Focus
Creating Shareholder Value
• Quality assets in low risk jurisdictions
• Long life assets with growth potential
• Low cost operations that drive free cash flow streams
Phase 1 Objectives
Repositioning for Sustainable Growth
• Establishing Island Gold as one of the lowest cost producers in low risk jurisdictions in the Americas
• Assessing the strategic fit of the Quebec assets

5RIC: TSX NYSE
5
Long-term value
Quality asset base in CanadaGrowingproduction profileSignificant exploration potential
Capital discipline & shareholder returns
Lowshares outstandingDecreasingcost structureMaximizing per share valuation
Cash focus
Strong balance sheetFavourableCAD$ exposureGrowingcash flow streams
ESTABLISHED CANADIAN GOLD PRODUCERPOSITIONING FOR SUSTAINABLE GROWTH
ontario

6RIC: TSX NYSE
6
Strong cash position supports fully funded strategic organic growth plan
Analyst CoverageBMO Capital Markets Brian Quast
Canaccord Genuity Rahul Paul
CIBC Jeff Killeen
Cormark Securities Richard Gray
Desjardins Capital Mike Parkin
Haywood Securities Kerry Smith
Macquarie Capital Markets Michael Gray
National Bank Raj Ray
Paradigm Capital Don Blyth
PI Financial Brian Szeto
Scotia Capital Ovais Habib
TD Securities Daniel Earle
CAPITAL STRUCTURE AND COVERAGEPOSITIONING FOR SUSTAINABLE GROWTH
TSX-NYSE: RIC Share Capital (at May 1, 2017)
Issued & Outstanding Shares 63.7M
Fully Diluted 66.5M
Market Capital C$621M
CASH(1)
C$75.2M(US$56.5M)
DEBT(1,2)
C$10.4M(US$7.8M)
(1) As at March 31, 2017.(2) Comprised mainly of mobile equipment capital leases.
7RIC: TSX NYSE
7
ISLAND GOLD MINE2016 SCORECARD
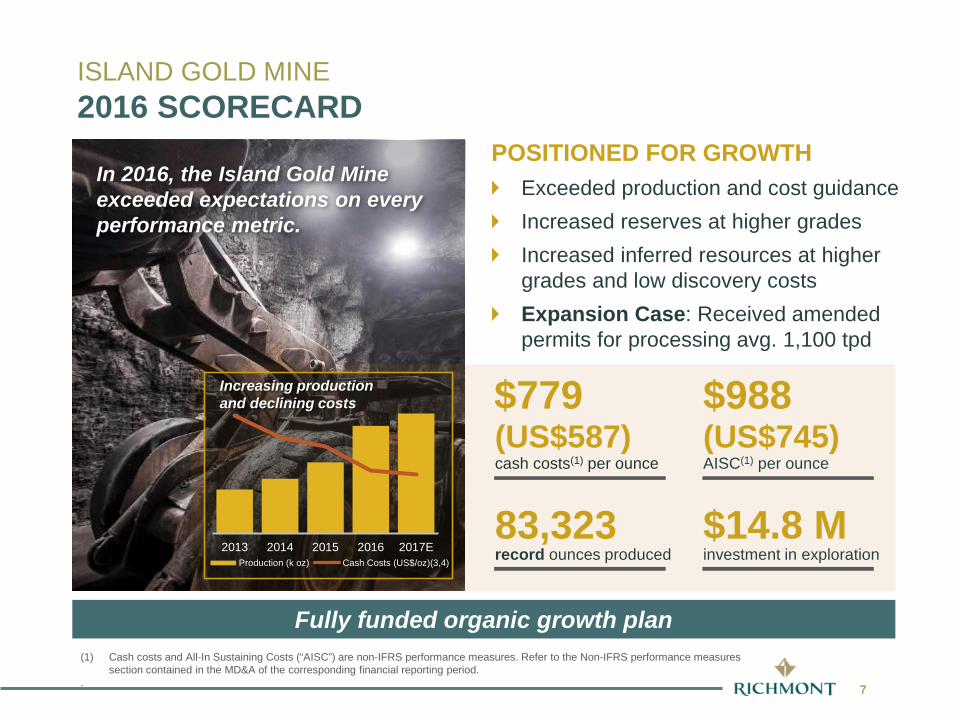
POSITIONED FOR GROWTHExceeded production and cost guidanceIncreased reserves at higher gradesIncreased inferred resources at higher grades and low discovery costsExpansion Case: Received amended permits for processing avg. 1,100 tpd
(US$745)AISC(1) per ounce
83,323record ounces produced
$14.8 Minvestment in exploration
Fully funded organic growth plan
In 2016, the Island Gold Mine exceeded expectations on every performance metric.
(1) Cash costs and All-In Sustaining Costs (“AISC”) are non-IFRS performance measures. Refer to the Non-IFRS performance measures section contained in the MD&A of the corresponding financial reporting period.
.
2013 2014 2015 2016 2017EProduction (k oz) Cash Costs (US$/oz)(3,4)
Increasing productionand declining costs $988
(US$587)cash costs(1) per ounce
$779
8
0
100
200
300
400
500
600
700
800
2012 2013 2014 2015 2016
Min
eral
Res
erve
s (0
00’s
oun
ces)
Monique Beaufor Island Gold
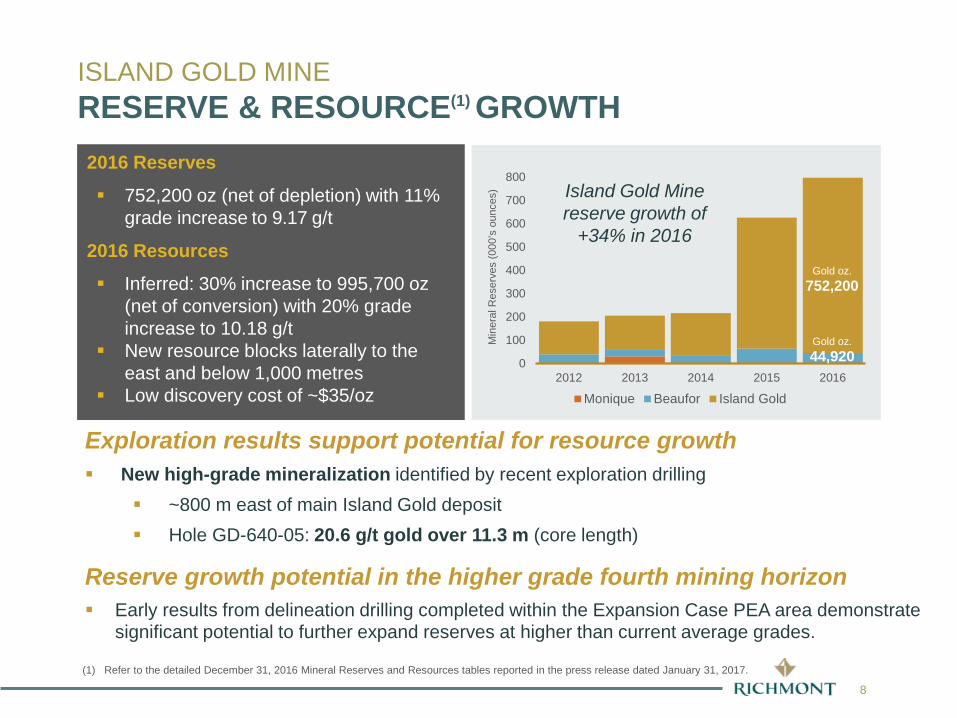
Gold oz.752,200
Island Gold Mine reserve growth of
+34% in 2016
Gold oz.44,920
ISLAND GOLD MINERESERVE & RESOURCE(1) GROWTH
Exploration results support potential for resource growth New high-grade mineralization identified by recent exploration drilling
~800 m east of main Island Gold deposit Hole GD-640-05: 20.6 g/t gold over 11.3 m (core length)
Reserve growth potential in the higher grade fourth mining horizon Early results from delineation drilling completed within the Expansion Case PEA area demonstrate
significant potential to further expand reserves at higher than current average grades.
(1) Refer to the detailed December 31, 2016 Mineral Reserves and Resources tables reported in the press release dated January 31, 2017.
2016 Reserves
752,200 oz (net of depletion) with 11%grade increase to 9.17 g/t
2016 Resources
Inferred: 30% increase to 995,700 oz(net of conversion) with 20% grade increase to 10.18 g/t
New resource blocks laterally to the east and below 1,000 metres
Low discovery cost of ~$35/oz

9RIC: TSX NYSE
9
20.8
14.6
9.2 9.2 8.8 8.4 8.2 7.7 7.3 6.4 6.14.6 4.5 4.3 4.3 4.2 3.8
2.71.6
19.2
13.210.6 9.5 9.4 9.0 8.7 7.9
6.4 6.4 5.9 5.8 5.6 4.9 4.4 4.4 4.12.8
1.3
Reserve Grade (g/t Au) Resource Grade (g/t Au)
424%
105%104% 90%
38% 20% 19% 13%
(0%) (6%) (9%) (10%)(20%)(25%)(34%)(65%)(83%)(87%)
Reserve Growth (3-Year)
52%
35% 30%21% 18% 14%
6%
(0%) (1%) (3%) (5%) (5%) (9%)(17%)
(25%)(30%)
(52%)
(67%)
Resource Growth (3-Year)
ISLAND GOLD MINEA QUALITY ASSET IN THE AMERICAS
Source: Company disclosure, Fact Set and available street research.

10RIC: TSX NYSE
10
Island Gold Mine 2017 Guidance Q1 2017
Gold Production (ounces) 87,000 - 93,000 23,772
Cost Estimates(1)
C$/ozCash Costs $715 - $765 $668All-in Sustaining Costs $945 - $995 $848
US$/ozCash Costs $550 - $590(2) $504All-in Sustaining Costs $725 - $765(2) $640
Capital Investment Estimates
C$(M)Sustaining Capital $19 - $22 $4.1Expansion Capital (3) $33 - $35 $5.9Exploration & Project Evaluation $14 - $16 $3.8
US$(M)Sustaining Capital(2) $15 - $17(2) $3.1Expansion Capital(2)(3) $25 - $27(2) $4.5Exploration & Project Evaluation (2) $11 - $12(2) $2.8
ISLAND GOLD MINE2017 PRODUCTION AND COST GUIDANCE
(1) Cash costs and all-in sustaining costs (“AISC”) are non-IFRS measures. Refer to the Non-IFRS Performance Measures in the 2016 MD&A.(2) Assuming an exchange rate of 1.30 Canadian dollars to 1.0 US dollar.(3) Expansion capital estimates for 2017 are discretionary in nature.

11RIC: TSX NYSE
11
ISLAND GOLD MINEEXPANSION CASE PEA – A DISCIPLINED APPROACH
The Expansion Case PEA represents only the first step in a disciplined multi-phased strategy
Use of current infrastructure; postponing the need for additional infrastructure to a further phase
Approximately 24% of Inferred Resources were incorporated in the PEA; +750k ounces Inferred Resources available for further growth phase
Maximizing mine productivity while maintaining a minimum mine life of 8 years
Positioning the mine as a low cost operation that generates strong cash flow streams, with minimal capital requirements
Currently realized cost data used; Further cost reduction and productivity enhancement initiatives not considered in the PEA
The objective of the PEA was to consider the most cost and capital effectivestrategy to mine the portion of the mineral resources that is located within themain area of interest over four mining horizons, to a maximum depth of 1,000metres below surface, using the current mine infrastructure.

12RIC: TSX NYSE
12
PEA Highlights: Increased productivity (mine and mill) to 1,100 tpd by 2018 over a PEA period of 8 years
The operation is expected to produce an average of 125,000 gold ounces per year, excluding the 2017 and 2018 ramp-up period, or 115,000 ounces over the 8-year mine life considered in the PEA.
Low industry cost profile over the PEA period, including cash costs of approximately $650 (US$480) per ounce, All-in Sustaining Costs (“AISC”) of approximately $835 (US$620) per ounce and All-in Costs (“AIC”), which includes all project and sustaining capital, of approximately $910 (US$675) per ounce.
Minimal incremental capital investment of $28.2 (US$20.9) million is estimated to support a productivity increase from 900 to 1,100 tonnes per day, which will contribute to a strong cumulative pre-tax net cash flow stream, after all capital expenditures, of $749 (US$555) million at a spot gold price of $1,700 (US$1,260) per ounce, or $615 (US$456) million at a downside case gold price of $1,550 (US$1,150) per ounce over the eight years covered by the PEA.
Additional opportunities remain for further expansion scenarios and mine life extension as the PEA only incorporates approximately 24% of the current total inferred resources (as at Dec. 31, 2016) and excludes more than 750,000 inferred resource ounces and does not take into consideration the most recent drilling success laterally to the east and at depth below the 1,000m level.
ISLAND GOLD MINE1,100 TPD EXPANSION CASE PEA

www.richmont-mines.com
Evolution of the Island Gold Mine
Geology and Exploration

14RIC: TSX NYSE
14
GEOLOGY AND EXPLORATIONPROLIFIC GOLD-PRODUCING REGION
Superior Lake
Marathon
White River
17
25 km
Wawa
HEMLO
RENABIE
MISHI EDWARDS
ISLAND GOLD MINE
Proterozoic RocksArchean Granitoid PlutonsArchean Metasedimentary TerranesArchean Greenstone BeltsFaultGold Past Producer
Gold Producer
SCHREIBER
EAGLE RIVER

15RIC: TSX NYSE
15
GEOLOGY AND EXPLORATIONAdjacent Past Producers in HIGH GRADE SYSTEM
Mill
CLINE 63 k oz Au0.3 MT @ 6.5 g/t Au
1 km
EDWARDS 144 k oz Au0.5 MT @ 11.0 g/t Au
KREMZAR 47 k oz Au0.6 MT @ 4.8 g/t Au
ISLAND GOLD MINE450 k oz Au produced (Dec 2016)
Ramp
MAGINO OPEN PIT Goudreau Zone
Lochalsh Zone
Typical Cross Section
Typical Cross SectionSW NE

16RIC: TSX NYSE
16
Gold is mainly contained in high grade quartz veins located inside plurimetricshear zones with altered host rocks (API)
Number and thickness of quartz veins are more important in the core of the new deep C Zone
GEOLOGY AND EXPLORATIONGOLD OCCURRENCE

17RIC: TSX NYSE
17
2010 Deep drilling began with encouraging results
GD-10-098.1 / 19.5 (9.6)
GD-10-108.6 / 3.3 (1.7)
GD-10-0210.4 / 5.1 (2.9)
GD-10-048.2 / 6.4 (3.2)
E1E7.4 / 5.1 (2.6)
GEOLOGY AND EXPLORATIONEVOLUTION OF RESERVES & RESOURCES
FIXDrilling in 2010 resulted in favourable results at depth, between -400 and -900 metres elevation, specifically:Drill results at Island Gold
These results confirmed the extension of the Island Gold mineralized zones at depth over a lateral distance of more than 1 km. Please see the Island Gold longitudinal section below.
18RIC: TSX NYSE
18
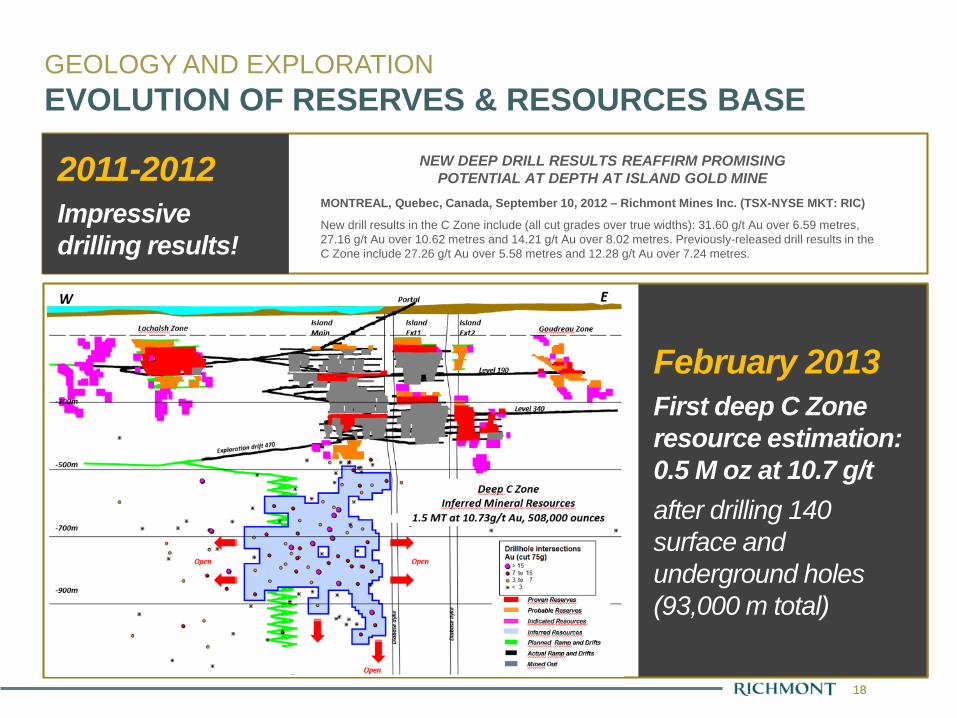
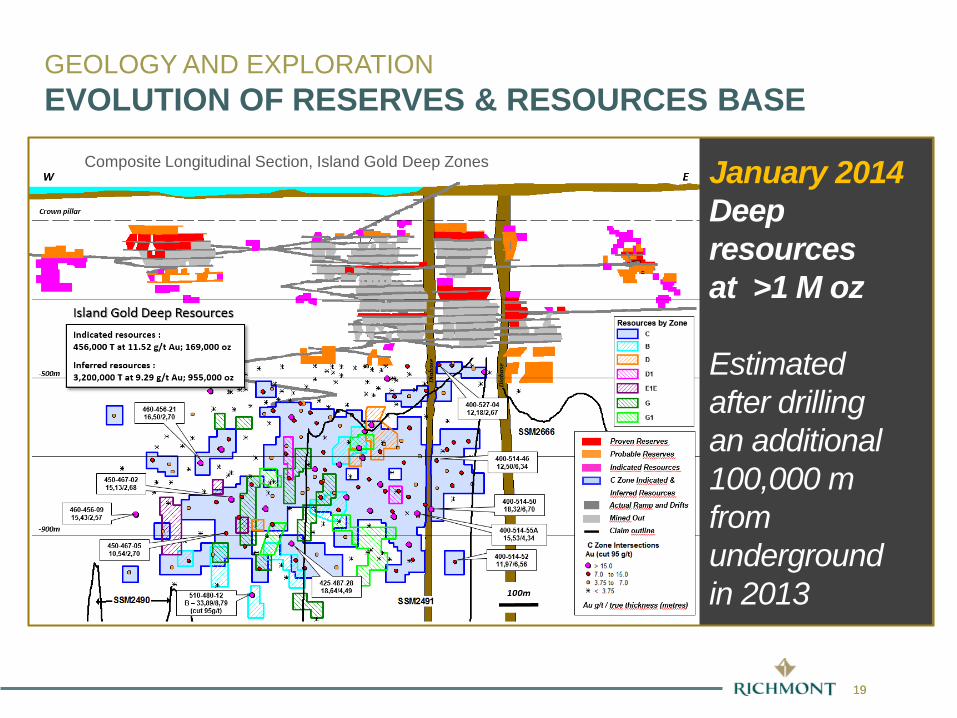
February 2013 First deep C Zone resource estimation: 0.5 M oz at 10.7 g/tafter drilling 140 surface and underground holes (93,000 m total)
2011-2012Impressive drilling results!
GEOLOGY AND EXPLORATIONEVOLUTION OF RESERVES & RESOURCES BASE
NEW DEEP DRILL RESULTS REAFFIRM PROMISINGPOTENTIAL AT DEPTH AT ISLAND GOLD MINE
MONTREAL, Quebec, Canada, September 10, 2012 – Richmont Mines Inc. (TSX-NYSE MKT: RIC)
New drill results in the C Zone include (all cut grades over true widths): 31.60 g/t Au over 6.59 metres,27.16 g/t Au over 10.62 metres and 14.21 g/t Au over 8.02 metres. Previously-released drill results in theC Zone include 27.26 g/t Au over 5.58 metres and 12.28 g/t Au over 7.24 metres.
19RIC: TSX NYSE
19
Composite Longitudinal Section, Island Gold Deep Zones January 2014Deep resources at >1 M oz
Estimated after drilling an additional 100,000 m from underground in 2013
GEOLOGY AND EXPLORATIONEVOLUTION OF RESERVES & RESOURCES BASE

20RIC: TSX NYSE
20
190 Level
Crown pillar
W EGOUDREAULOCHALSH ISLAND EXT1 EXT2
400-528-104.44 / 6.07
400-528-104.79 / 2.87
GD-14-01C19.87 g/t / 3.93m
GDE-10-141.62 / 1.95
GDE-10-153.99 / 1.97
GDE-10-169.93 / 0.89
GD-10-114.94 / 2.63400-528-09
7.44 / 8.49
GDE-10-045.83 / 3.53
GDE-10-056.28 / 1.80
Surface deep directional exploration 23,000 m
- 500 m
- 1,000 m
- 1,500 m
Actual Ramp and Drifts
Gold Zone Intersections (Au cut 95 g/t)Au g/t / true thickness (metres)
Previous holesTarget
Reserves – Resources 31/12/2014
Mined out
2015 New planned deep directional exploration drilling to follow up on GD-14-01C intercept
GEOLOGY AND EXPLORATIONEVOLUTION OF RESERVES & RESOURCES BASE

21RIC: TSX NYSE
21
W EGOUDREAULOCHALSH ISLAND EXT1 EXT2
- 1,000 m
- 500 m
Crown pillar
- 1,500 m 15.0
00 m
E
340 m Level
190 m Level
Deep Directional Drilling
PEA
Surface
200 m
Dyk
e
Dyk
e
620 m LevelExplo. drift
Eastern Lateral Exploration
Legend
> 30
8.0 to 30.0
4.0 to 8.0
< 4.0
Drillhole IntersectionAu (cut 95 g/t)
Proven Reserves( 2015/12/31)
Probable Reserves (2015/12/31)
Indicated Resources
(2015/12/31)
Inferred Resources (2015/12/31)
Ramp and Actual Development
Mined Out Au g/t / true thickness (metres)
14.0
00 m
E
620-556-0421.0/2.78
620-543-3417.41/2.27
MH3-612.49/2.19
MH4-16.36/5.84
(Parallel Zone)
POTENTIAL AREAS
GD-590-0510.55/2.46
MH1-618.63/6.60
MH1-79.11/4.12
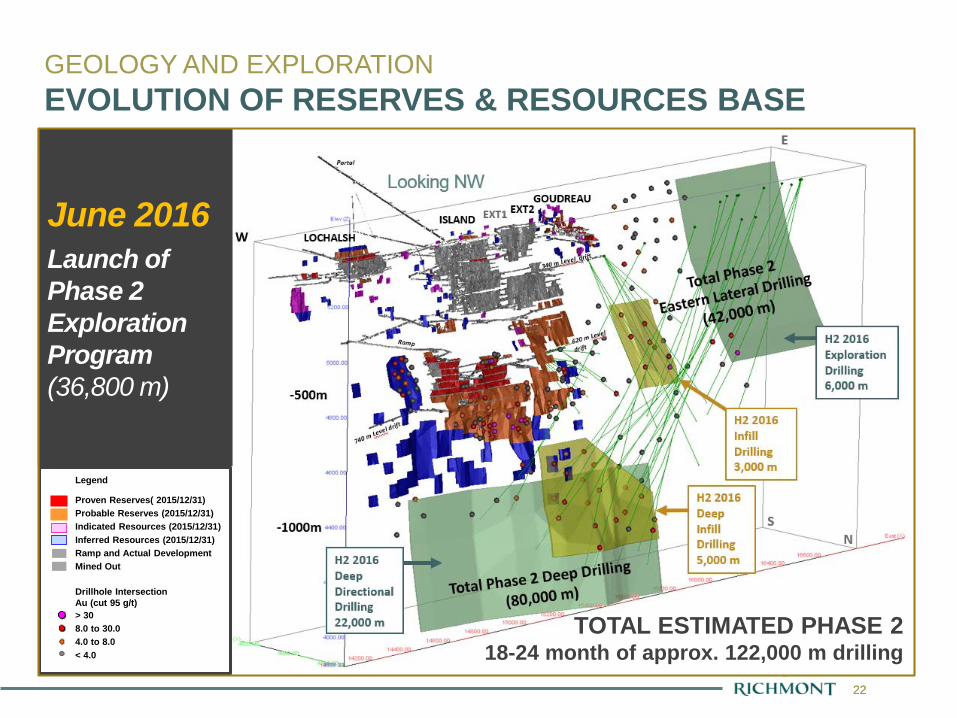
GEOLOGY AND EXPLORATIONEVOLUTION OF RESERVES & RESOURCES BASEJune 2016 2 potential areas for new resources have been found
End of Phase 1 Exploration Program (71,800 m)
22RIC: TSX NYSE
22
Legend
> 308.0 to 30.04.0 to 8.0< 4.0
Drillhole IntersectionAu (cut 95 g/t)
Proven Reserves( 2015/12/31)Probable Reserves (2015/12/31)Indicated Resources (2015/12/31)Inferred Resources (2015/12/31)Ramp and Actual DevelopmentMined Out
TOTAL ESTIMATED PHASE 2 18-24 month of approx. 122,000 m drilling
June 2016Launch of Phase 2 Exploration Program(36,800 m)
GEOLOGY AND EXPLORATIONEVOLUTION OF RESERVES & RESOURCES BASE

23RIC: TSX NYSE
23
Year-end 2016 750 k oz gold in Mineral Reserves and > 1 M oz gold in Mineral Resources
GEOLOGY AND EXPLORATIONEVOLUTION OF RESERVES & RESOURCES BASE
Proven & Probable : 752,200 oz Au (2,551,000 T @ 9.17 g/t Au)
Measured & Indicated : 91,450 oz Au (479,000 T @ 5.94 g/t Au)
Inferred : 995,700 oz Au (3,042,000 T @ 10.18 g/t Au)
RESERVES AND RESOURCES (31/12/2016)Reserves
Resources

24
0.00
2.00
4.00
6.00
8.00
10.00
12.00
0
200,000
400,000
600,000
800,000
1,000,000
1,200,000
2010 2011 2012 2013 2014 2015 2016 2017 2018 2019
Gra
de (g
/t go
ld)
Res
erve
s/R
esou
rces
(gol
d ou
nces
)
P+P (oz) M+I (oz) INF (oz) P+P (g/t) INF (g/t)
Short-term objective: Total Resourceup to +2 M oz(net of depletion) to create next level of growth
GEOLOGY AND EXPLORATIONEVOLUTION OF RESERVES AND RESOURCES OUNCES AND GRADE PROFILE
NEXT 1-3 YEARS
Refer to the detailed December 31, 2016 Mineral Reserves and Resources tables reported in the press release dated January 31, 2017.
25
0
25,000
50,000
75,000
100,000
125,000
0
200,000
400,000
600,000
800,000
1,000,000
2010 2011 2012 2013 2014 2015 2016 2017E PEA 0-5YEARS
Prod
uced
(gol
d ou
nces
)
Res
erve
s/R
esou
rces
(gol
d ou
nces
)
P+P M+I INF Produced (gold ounces)
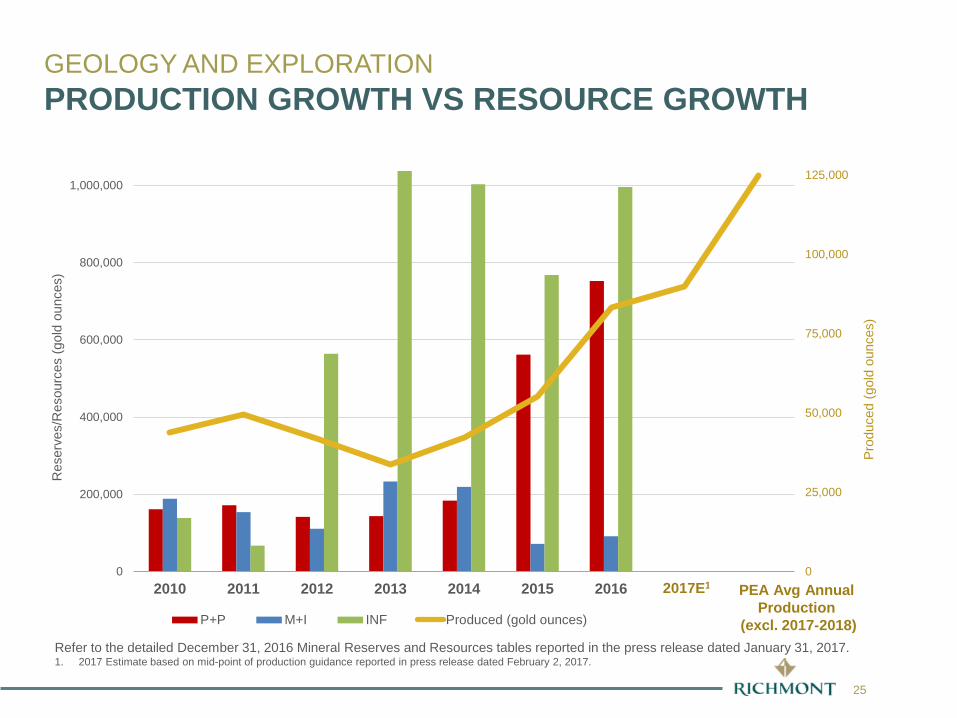
GEOLOGY AND EXPLORATIONPRODUCTION GROWTH VS RESOURCE GROWTH
2017E1 PEA Avg Annual Production
(excl. 2017-2018)Refer to the detailed December 31, 2016 Mineral Reserves and Resources tables reported in the press release dated January 31, 2017. 1. 2017 Estimate based on mid-point of production guidance reported in press release dated February 2, 2017.
26
GEOLOGY AND EXPLORATIONRESERVE CONVERSION
0
100
200
300
400
500
600
700
800
2012 2013 2014 2015 2016
Min
eral
Res
erve
s (0
00’s
oun
ces)
Island Gold Mine
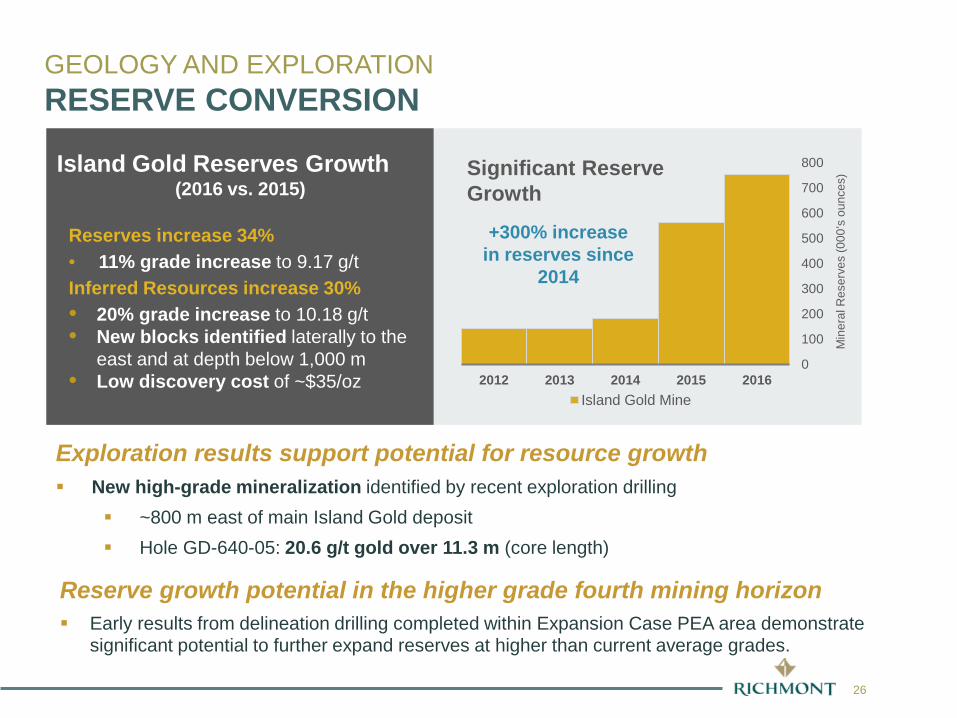
+300% increase in reserves since
2014
Reserves increase 34% • 11% grade increase to 9.17 g/tInferred Resources increase 30%• 20% grade increase to 10.18 g/t• New blocks identified laterally to the
east and at depth below 1,000 m• Low discovery cost of ~$35/oz
Island Gold Reserves Growth(2016 vs. 2015)
Significant Reserve Growth
Exploration results support potential for resource growth New high-grade mineralization identified by recent exploration drilling
~800 m east of main Island Gold deposit Hole GD-640-05: 20.6 g/t gold over 11.3 m (core length)
Reserve growth potential in the higher grade fourth mining horizon Early results from delineation drilling completed within Expansion Case PEA area demonstrate
significant potential to further expand reserves at higher than current average grades.

27RIC: TSX NYSE
27
GEOLOGY AND EXPLORATION2017 DRILLING PROGRAM
620 m Level PlannedExplo. & Delineation Drift
860 m Level PlannedExplo. & Delineation Drift
GOUDREAULOCHALSH ISLAND EXT1 EXT2
- 500 m
- 1.500 m
W E
340 m Level
190 m Level
740 m LevelExplo. & Delineation Drift
- 1.000 m
200 mMineralized trend
2017 DELINEATION DRILLING 30,000 m
2017 DEEP EXPLORATION DRILLING 36,000 m
Proven Reserves
Probable Reserves
Indicated Resources
Inferred Resources
Inferred Resources
(B. D. G. G1 Zones)
Ramps and Actual Development
Mined Out
Planned Development
Legend
**** Mineral Reserves and Resources as of December 31. 2016)
2017 DELINEATION DRILLING 7,000 m
2017 SURFACE/ UNDERGROUNDEXPLORATION DRILLING 30,000 m
450 k oz inferred resources added in 2016 at $35/oz
GD-630-0125.37/3.85
GD-620-0119.74/1.4
NEW DISCOVERYGD-640-05
20.57/11.3 c.l.
Potential Extension
**** Drillhole IntersectionAu (cut 70 g/t) / true thickness (metres)c.l. Core length (metres)

28RIC: TSX NYSE
28
340 m Level
- 500 m
340-588-093.62/2.10
340-588-1110.10/3.0
340-588-1210.24/3.0
340-588-1333.60/2.0
340-588-1410.60/2.0
340-588-1511.44/4.36
GD-640-047.38/3.27
340-588-185.69/2.3
340-588-174.98/3.0
EXPANSION CASE PEA AREA
620 m Level PlannedExplo. & DelineationDrift
860 m Level PlannedExplo. & Delineation Drift
- 1000 m
GD-640-0520.57/11.3 c.l.
340-576-028.50/2.0
340-576-015.17/2.0
340-586-091.73/2.0
340-586-088.38/2.0
340-579-012.69/2.57
340-586-067.63/2.68
340-586-073.16/2.0
340-588-0814.96/2.0
GD-640-05-110.16/5.74 c.l.
GD-620-0119.74/1.4
GD-630-0125.37/3.85 Cross section looking W
GD-640-05-116.10/8.33 c.l.
GD-640-023.66/5.34
GD-640-010.08/4.24
Proven Reserves (2016/12/31)Probable Reserves (2016/12/31)Indicated Resources (2016/12/31)Inferred Resources (2016/12/31)Ramp and Actual DevelopmentMined OutPlanned Development
Intersection not included in Dec. 2016 Reserves & Resources update
340-588-160.93/2.0
100 m
> 308.0 to 30.04.0 to 8.0< 4.0
Drillhole IntersectionAu (cut 70 g/t) / true thickness (metres)c.l. Core length (metres)
Next TargetGeometry of new zone not yet understood.
Directional drilling in progress
GEOLOGY AND EXPLORATIONEASTERN LATERAL EXPLORATION AND INFILL DRILLING
GD-640-05-1
GD-640-05
Cross section looking W

29RIC: TSX NYSE
29
15.5
00 m
E
15.0
00 m
E
Dyke
MH5-1A9.27/5.93
MH5-25.08/4.40
MH4-54.63/2.51
MH2A-74.72/4.80
- 1,500 m
- 1,000 m
100 m
EXPANSION CASE PEA AREA
860 m Level PlannedExplo. & DelineationDrift
MH2A-9B2.66/5.89
MH84.60/2.24
MH5-30.95/3.81
MH60.91/9.44
Drillhole IntersectionAu (cut 225 g/t)
Drillhole IntersectionAu (cut 70 g/t)
PotentialExtension
MH1-1024.54/3.76
MH2A-810.37/9.17
MH2A-106.16/11.58
DEEP DIRECTIONAL DRILLING
Proven Reserves (2016/12/31)
Probable Reserves (2016/12/31)
Indicated Resources (2016/12/31)
Inferred Resources (2016/12/31)
Ramp and Actual Development
Mined Out
Planned Development
> 30
8.0 to 30.0
4.0 to 8.0
< 4.0
Drillhole IntersectionAu cut g/t / true thickness (metres)
Intersection not included in Dec. 2016 Reserves & Resources update
Next Target
MH4-44.10/3.09
GEOLOGY AND EXPLORATIONDEEP DIRECTIONAL EXPLORATION AND INFILL DRILLING

30RIC: TSX NYSE
30
14.5
00 m
E
15.0
00 m
E
Dyke
- 1.000 m
100 m
EXPANSION CASE PEA AREA
860 m Level PlannedExplo. & Delineation
Drift
740-477-4038.62/2.24
740-465-1523.29/3.51
740-465-0338.66/3.68
740-465-0485.33/3.52
740-465-0843.05/5.13
740-477-3060.15/3.29
740-477-4324.21/4.33
820-520-1330.20/3.62
820-520-0853.64/6.53
820-512-0460.16/8.79
820-520-0152.67/3.28
800-511-0123.36/4.72
740-477-3332.47/6.57
740-465-2024.56/3.85
740-483-2134.13/3.53
740-483-2226.37/3.46
740-465-1696.97/5.08
740-465-2350.84/2.03
635 m Level
740 m Level
DRILLING IN PEA
Proven Reserves (2016/12/31)
Probable Reserves (2016/12/31)
Indicated Resources (2016/12/31)
Inferred Resources (2016/12/31)
Ramp and Actual Development
Mined Out
Planned Development
> 30
8.0 to 30.0
4.0 to 8.0
< 4.0
Drillhole IntersectionAu (cut 225 g/t) / true thickness (metres)
Intersection not included in Dec. 2016 Reserves & Resources update
GEOLOGY AND EXPLORATIONEXPANSION CASE PEA DELINEATION& EXPLORATION DRILLING
New high grade intercepts on the western side
31RIC: TSX NYSE
31
W EGOUDREAULOCHALSH ISLAND EXT1 EXT2
- 1 000 m
- 500 m
Crown pillar
- 1 500 m
16 0
00 m
E
620 m Level PlannedExploration drift
Surface
200 m Au Metal FactorGrade (Au g/t, cut) x true width (m)
190 m Level
340 m Level
MH2A-106.16/11.58
GD-640-047.38/3.27
NEW DISCOVERYGD-640-05
20.57/11.3 c.l.
Drillhole IntersectionAu (cut 225 g/t)
Drillhole IntersectionAu (cut 70 g/t)
860 m Level PlannedExploration Drift
Dyk
e
740 m LevelExplo. & DelineationDrift
OPEN
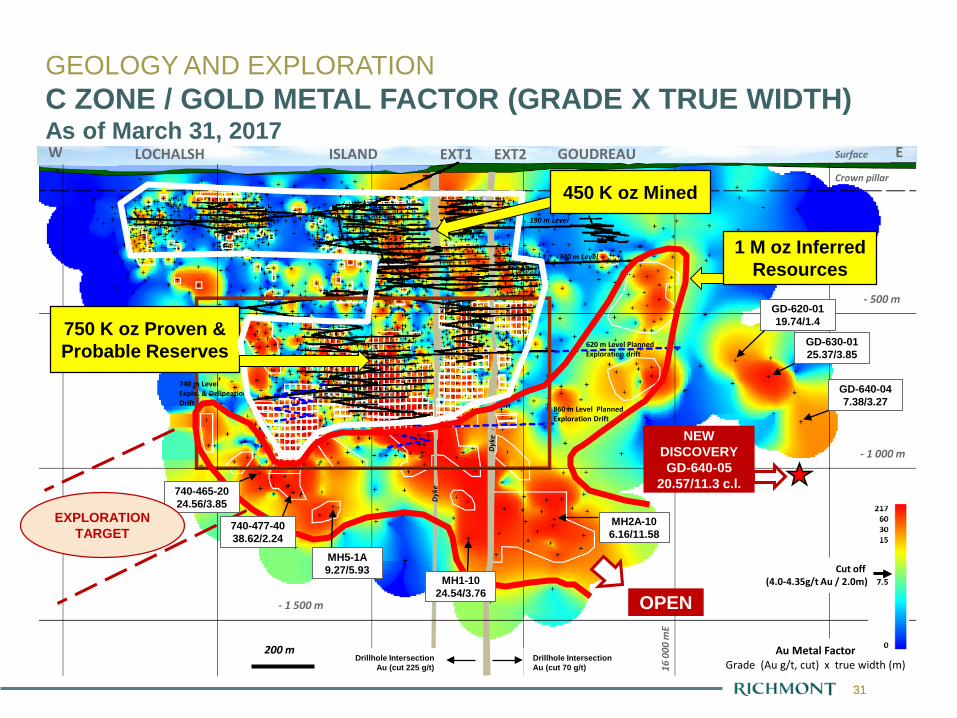
750 K oz Proven & Probable Reserves
1 M oz Inferred Resources
Cut off (4.0-4.35g/t Au / 2.0m)MH1-10
24.54/3.76
740-465-2024.56/3.85
GD-630-0125.37/3.85
740-477-4038.62/2.24
MH5-1A9.27/5.93
GD-620-0119.74/1.4
EXPLORATION TARGET
450 K oz Mined
GEOLOGY AND EXPLORATIONC ZONE / GOLD METAL FACTOR (GRADE X TRUE WIDTH)As of March 31, 2017
32
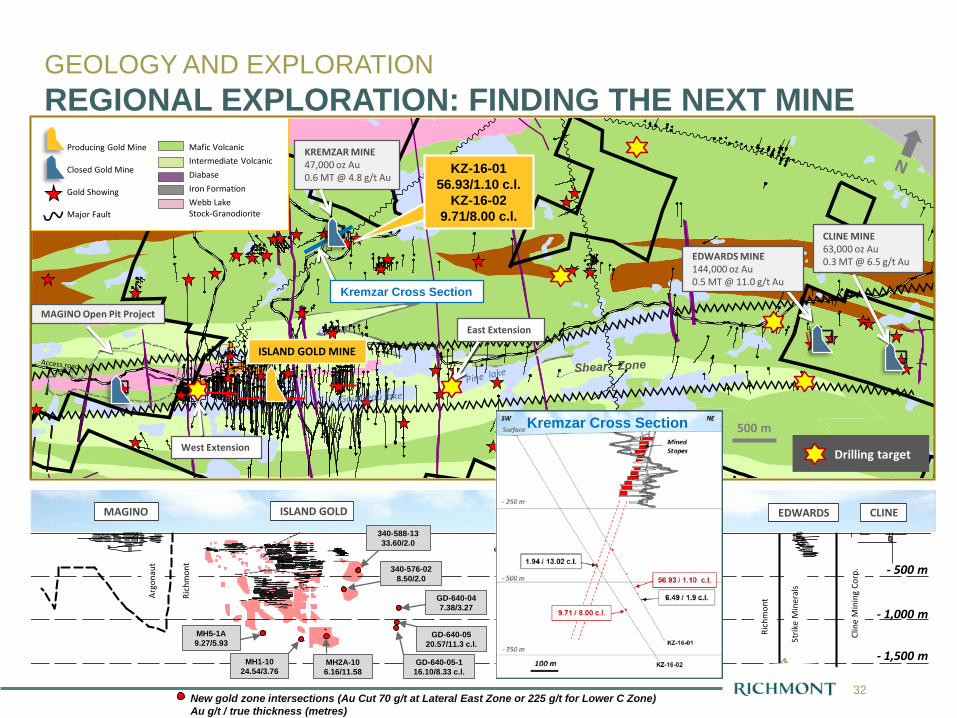
Mill
Maskinongelake
CLINE MINE63,000 oz Au0.3 MT @ 6.5 g/t Au
KREMZAR MINE47,000 oz Au0.6 MT @ 4.8 g/t Au
ISLAND GOLD MINE
East Extension
West Extension Drilling target500 m
- 1,000 m
- 500 m
- 1,500 m
MAGINO ISLAND GOLD EDWARDS CLINE
Rich
mon
tRich
mon
t
Argo
naut
Strik
e M
iner
als
New gold zone intersections (Au Cut 70 g/t at Lateral East Zone or 225 g/t for Lower C Zone)Au g/t / true thickness (metres)
Clin
e M
inin
g Co
rp.
KZ-16-0156.93/1.10 c.l.
KZ-16-029.71/8.00 c.l.
MH1-1024.54/3.76
MH2A-106.16/11.58
MH5-1A9.27/5.93
340-588-1333.60/2.0
340-576-028.50/2.0
MAGINO Open Pit Project
GD-640-047.38/3.27
GD-640-0520.57/11.3 c.l.
GD-640-05-116.10/8.33 c.l.
Producing Gold Mine
Closed Gold Mine
Gold Showing
Major Fault
Mafic VolcanicIntermediate VolcanicDiabaseIron FormationWebb LakeStock-Granodiorite
EDWARDS MINE144,000 oz Au0.5 MT @ 11.0 g/t Au
Kremzar Cross Section
Drilling target
Kremzar Cross Section
GEOLOGY AND EXPLORATIONREGIONAL EXPLORATION: FINDING THE NEXT MINE
33
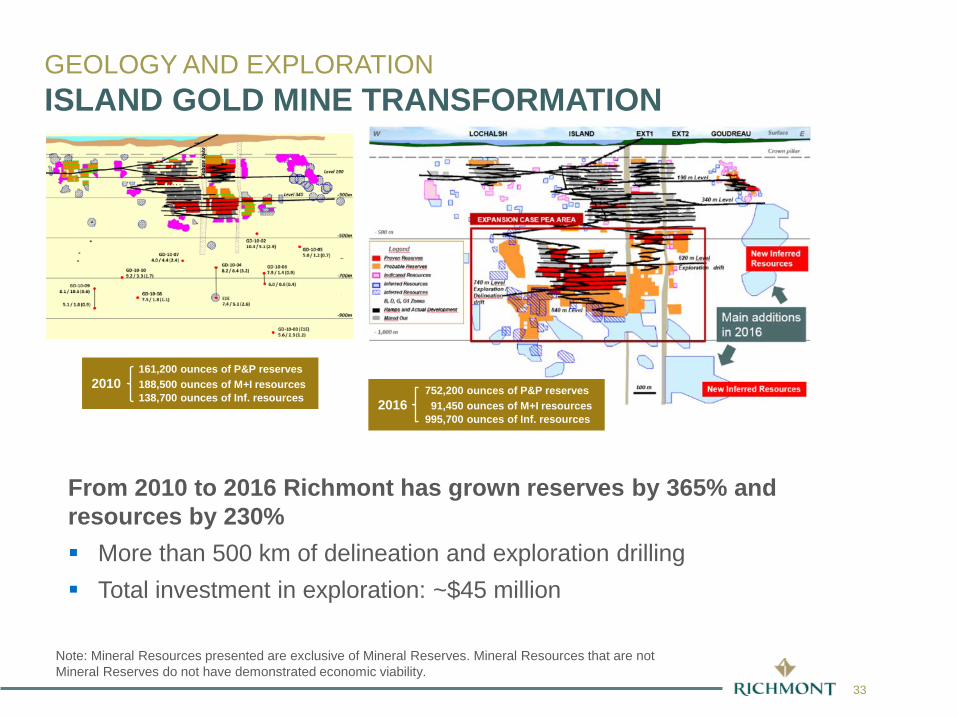
From 2010 to 2016 Richmont has grown reserves by 365% and resources by 230% More than 500 km of delineation and exploration drilling Total investment in exploration: ~$45 million
GEOLOGY AND EXPLORATIONISLAND GOLD MINE TRANSFORMATION
752,200 ounces of P&P reserves2016 91,450 ounces of M+I resources
995,700 ounces of Inf. resources
161,200 ounces of P&P reserves2010 188,500 ounces of M+I resources
138,700 ounces of Inf. resources
Note: Mineral Resources presented are exclusive of Mineral Reserves. Mineral Resources that are not Mineral Reserves do not have demonstrated economic viability.
www.richmont-mines.com
Expansion Case PEA
Cautionary StatementThe production and cost estimates contained in this the Expansion Case PEA arepartly based on Inferred Resources, and are therefore preliminary in nature. InferredResources are considered too geologically speculative to have mining andeconomic parameters applied to them, or to be categorized as Mineral Reserves.There is no certainty that the conversion of Mineral Resources to Mineral Reservesor the production and cost forecasts on which the Expansion Case PEA is based,will be realized. Mineral Resources that are not Mineral Reserves do not havedemonstrated economic viability.
35RIC: TSX NYSE
35
Expansion Case PEA based on the December 31, 2016 Mineral Reserves and Resources
Accelerated development of the dual ramp system to allow multi-stope mining beginning in 2018
Mining by ramp down to 1,000 m level; no additional infrastructure required
Phase-in of higher capacity 42t trucks; supports mining at depth
Alimak mining in the isolated western block by 2020
Minimum mill upgrade required; 1,100 tpd run rate by the latter part of 2018
Actual cost information utilized including mining, milling, site G&A and royalties, as well as underground development and infrastructure capital costs
Future costs were adjusted to reflect economies of scale and decreased productivity as mining operations transition to 1,000 m level
Minimal incremental capital required to increase productivity to 1,100 tpd from 900 tpd
EXPANSION CASE PEAKEY TECHNICAL ASSUMPTIONS

36
All Dec 31, 2016 Reserves (incl. Upper Mine) were used in the Expansion Case PEA. For the purpose of this PEA all Mineral Reserves included in the mine plan were considered at the Measured and Indicated Resource level.
All Dec 31, 2016 M&I Resources were included in the PEA. Only the Dec. 31, 2016 Inferred Resources within the main continuous structure, primarily
located in the fourth mining horizon and to a maximum depth of 1,000 metre level, were incorporated in the PEA.
Total undiluted resources used in the PEA: M&I: 2.6 MT @ 10.65 g/t gold for 0.88 million ounces Inf.: 0.5 MT @ 14.95 g/t gold for 0.24 million ounces
The Dec. 31, 2016 mining dilution, mining recovery and cut-off grade criteria were used to estimate a total mining plan production of 3.1MT @ 9.68 g/t gold used in the PEA.
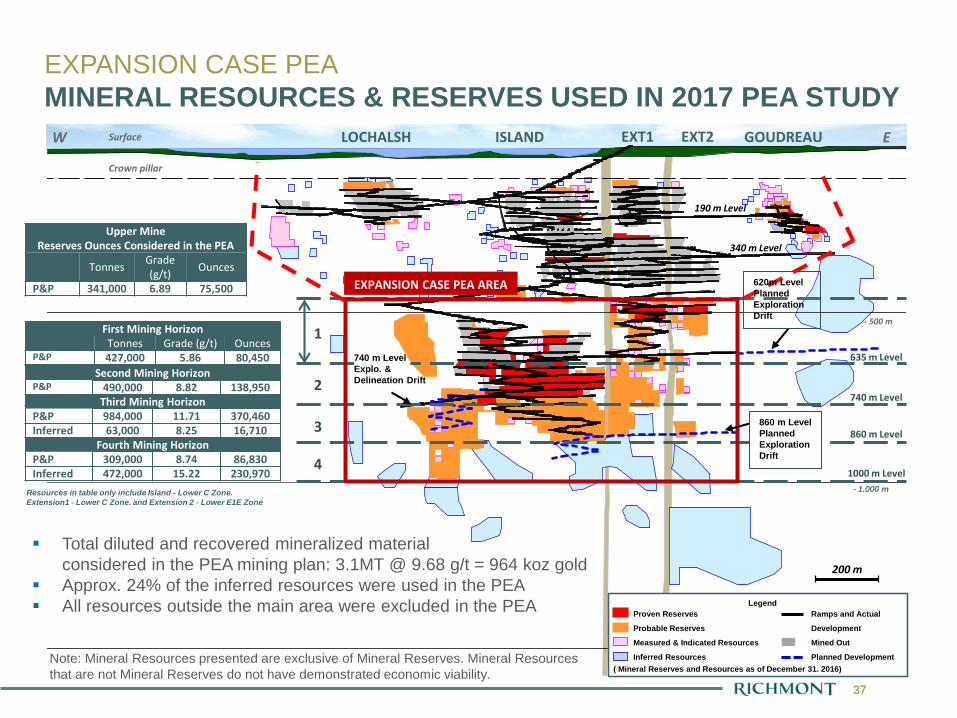
EXPANSION CASE PEAMINERAL RESOURCES & RESERVES USED IN 2017 PEA STUDY
December 31, 2016 Used for Expansion Case PEATonnes Grade g/t Au Gold Ounces Tonnes Grade g/t Au Gold Ounces
ReservesProven 572,762 8.68 159,811
Probable 1,978,243 9.31 592,398
Total Reserves 2,551,006 9.17 752,209
Resources(1,2)
Measured & Indicated 478,811 5.94 91,427 2,565,560 10.65 878,689
Inferred 3,041,836 10.18 995,717 496,258 14.95 238,494 PEA Mining Plan
Production 3,096,800 9.68 964,000(1) Mineral Resources presented are exclusive of Mineral Reserves.(2) Mineral Resources that are not Mineral Reserves do not have
demonstrated economic viability.
37RIC: TSX NYSE
37
GOUDREAULOCHALSH ISLAND EXT1 EXT2
- 500 m
340 m Level
190 m Level
W E
Crown pillar
Surface
EXPANSION CASE PEA AREA
1000 m Level
635 m Level
740 m Level
860 m Level
Second Mining HorizonP&P 490,000 8.82 138,950
Third Mining Horizon P&P 984,000 11.71 370,460Inferred 63,000 8.25 16,710
Fourth Mining Horizon P&P 309,000 8.74 86,830Inferred 472,000 15.22 230,970
- 1.000 m
LegendProven Reserves
Probable Reserves
Measured & Indicated Resources
Inferred Resources
Ramps and Actual
Development
Mined Out
Planned Development
Resources in table only include Island - Lower C Zone. Extension1 - Lower C Zone. and Extension 2 - Lower E1E Zone
200 m
860 m LevelPlannedExploration Drift
( Mineral Reserves and Resources as of December 31. 2016)
First Mining Horizon Tonnes Grade (g/t) Ounces
P&P 427,000 5.86 80,450
1
2
3
4
Upper Mine Reserves Ounces Considered in the PEA
Tonnes Grade (g/t) Ounces
P&P 341,000 6.89 75,500
740 m LevelExplo. & Delineation Drift
Total diluted and recovered mineralized material considered in the PEA mining plan: 3.1MT @ 9.68 g/t = 964 koz gold
Approx. 24% of the inferred resources were used in the PEA All resources outside the main area were excluded in the PEA
620m LevelPlannedExploration Drift
EXPANSION CASE PEAMINERAL RESOURCES & RESERVES USED IN 2017 PEA STUDY
Note: Mineral Resources presented are exclusive of Mineral Reserves. Mineral Resources that are not Mineral Reserves do not have demonstrated economic viability.
38
Received amended permits for processing avg. 1,100 tpd (Dec. 2016)
Main ramp development at target 860 m level
Ore development advancing in higher-grade 3rd mining horizon
Stoping in 3rd horizon in 2017
2015 tailings expansion increased capacity to 2.1 Mt; Expansion Case PEA considers additional capacity of 1.5 Mt in 2020 as sustaining capital
Mill currently operating at base case 900 tpd (Avg. 920 tpd Q1 2017)
Long lead mill equipment being sourced; engineering ongoing
EXPANSION CASE PEAPROGRESS REPORT
www.richmont-mines.com
Mine Plan 1,100 tpd

40
Expanded mining rate of 1,100 tpd via dual ramp system
Accelerated development strategy will support higher mining rates
Development in ore completed in early 2022
Mining over 4 horizons; down to 1,000 metre level
Alimak mining for the western block in 2020
PEA period of 8 years with no need for additional underground infrastructure
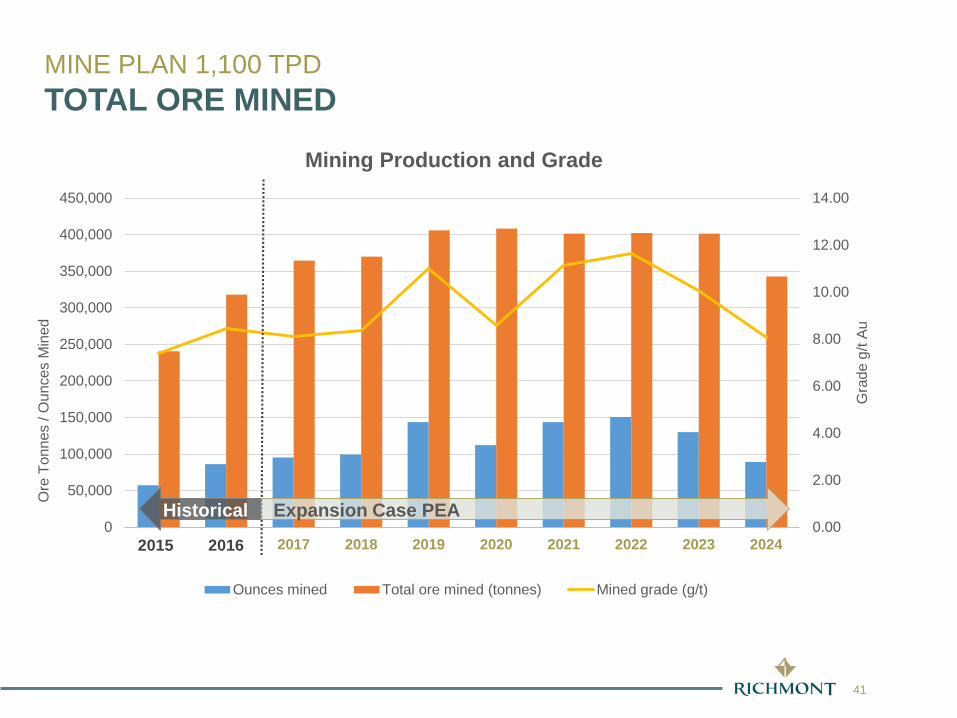
PEA Ore Tonnes2017 2018 2019 2020 2021 2022 2023 2024 Total
Total ore mined (tonnes) 364,600 370,000 405,900 408,100 401,500 402,300 401,500 342,800 3,096,700
Total ore mined (g/t) 8.13 8.35 11.01 8.56 11.12 11.65 10.06 8.09 9.68
Total development ore (tonnes) 134,700 94,400 98,200 83,600 26,900 3,600 - - 441,400
Total development ore (g/t) 9.86 7.59 11.76 8.74 7.82 4.76 - - 9.42
Total stoping ore (tonnes) 229,900 275,600 307,700 324,500 374,600 398,700 401,500 342,800 2,655,300
Total stoping ore (g/t) 7.11 8.61 10.77 8.52 11.36 11.72 10.06 8.09 9.73
Ratio: development/total ore 0.37 0.26 0.24 0.20 0.07 0.01 - - 0.14
Ounces Mined 95,300 99,400 143,600 112,300 143,600 150,700 129,900 89,200 964,000
MINE PLAN 1,100 TPDTOTAL ORE MINED
41
MINE PLAN 1,100 TPDTOTAL ORE MINED
0.00
2.00
4.00
6.00
8.00
10.00
12.00
14.00
0
50,000
100,000
150,000
200,000
250,000
300,000
350,000
400,000
450,000
2015 2016 2017 2018 2019 2020 2021 2022 2023 2024
Gra
de g
/t Au
Ore
Ton
nes
/ Oun
ces
Min
ed
Mining Production and Grade
Ounces mined Total ore mined (tonnes) Mined grade (g/t)
Historical Expansion Case PEA
2015 2016

42
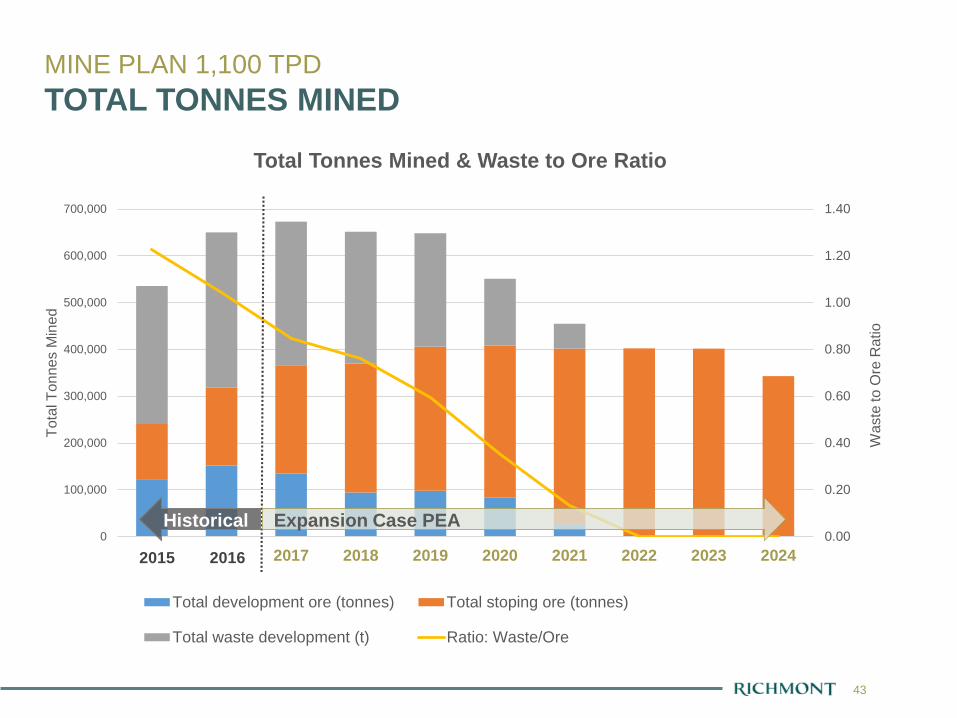
PEA Waste Mined2017 2018 2019 2020 2021 2022 2023 2024 Total
Total waste development (t) 308,600 281,600 242,200 142,800 53,200 - - - 1,028,400Total waste development (tpd) 845 772 664 391 146 - - - 564Total waste development (m) 4,859 4,211 3,762 2,278 883 - - - 15,993Central East (t) 58,400 23,800 48,100 35,400 - - - - 165,700Central East (m) 930 375 774 606 - - - - 2,685Central West (t) 15,300 74,600 72,100 64,500 41,700 - - - 268,200Central West (m) 233 1,173 1,119 1,019 708 - - - 4,251Ramp (t) 72,200 89,000 80,200 42,900 11,500 - - - 295,800Ramp (m) 1,105 1,355 1,221 654 175 - - - 4,510Other (t) 162,700 94,200 41,800 - - - - - 298,700Other (m) 2,591 1,308 649 - - - - - 4,547
Total waste mined (t) 308,600 281,600 242,200 142,800 53,200 - - - 1,028,400Total ore mined (t) 364,600 370,000 405,900 408,100 401,500 402,300 401,500 342,800 3,096,800Total tonnes mined (t) 673,200 651,600 648,100 550,900 454,700 402,300 401,500 342,800 4,125,100Total tonnes mined (tpd) 1,844 1,785 1,776 1,509 1,246 1,102 1,100 1,100 ~1,450Ratio: Waste/Ore 0.85 0.76 0.60 0.35 0.13 - - - 0.33
MINE PLAN 1,100 TPDTOTAL WASTE MINED
Accelerated development of dual ramp system (2017-2018) Sustaining ramp development (2019-2021); Eastern ramp completed to 1,000 m level in 2020;
Western ramp completed to 1,000 m level in 2021
43
0.00
0.20
0.40
0.60
0.80
1.00
1.20
1.40
0
100,000
200,000
300,000
400,000
500,000
600,000
700,000
2015 2016 2017 2018 2019 2020 2021 2022 2023 2024
Was
te to
Ore
Rat
io
Tota
l Ton
nes
Min
ed
Total Tonnes Mined & Waste to Ore Ratio
Total development ore (tonnes) Total stoping ore (tonnes)
Total waste development (t) Ratio: Waste/Ore
MINE PLAN 1,100 TPDTOTAL TONNES MINED
2015 2016
Historical Expansion Case PEA

44RIC: TSX NYSE
44
2017-2019
2018-2020
2020-2021
2021-20222022-2024
2021
2020
2017 2018 2019 2020 2021 2022 2023 2024
2024 2024
MINE PLAN 1,100 TPD MINING SEQUENCE
45
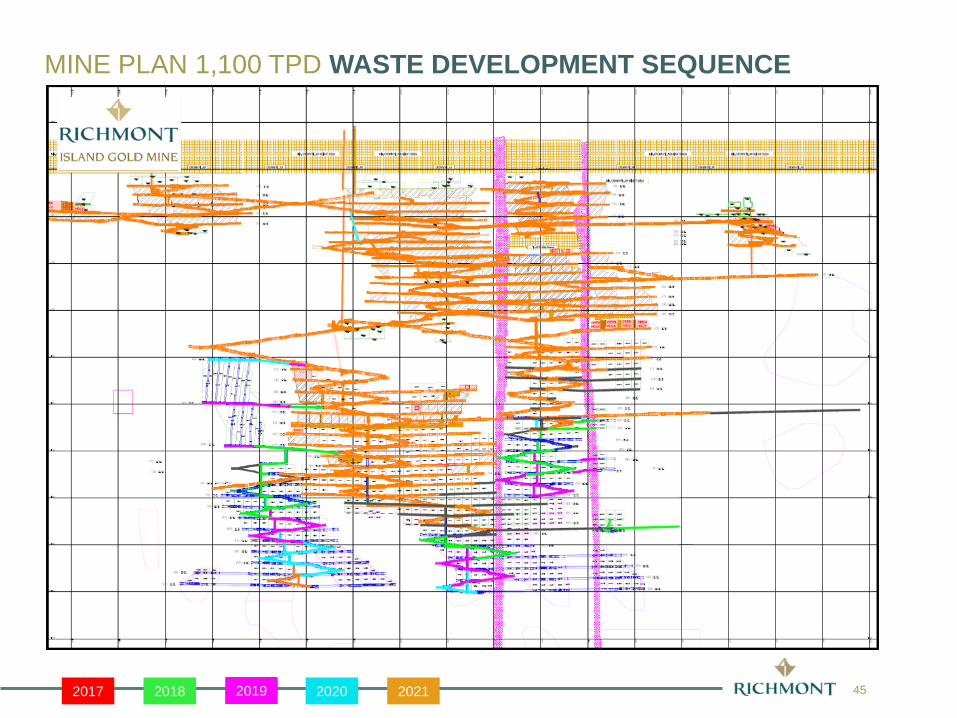
MINE PLAN 1,100 TPD WASTE DEVELOPMENT SEQUENCE
2017 2018 2019 2020 2021
46
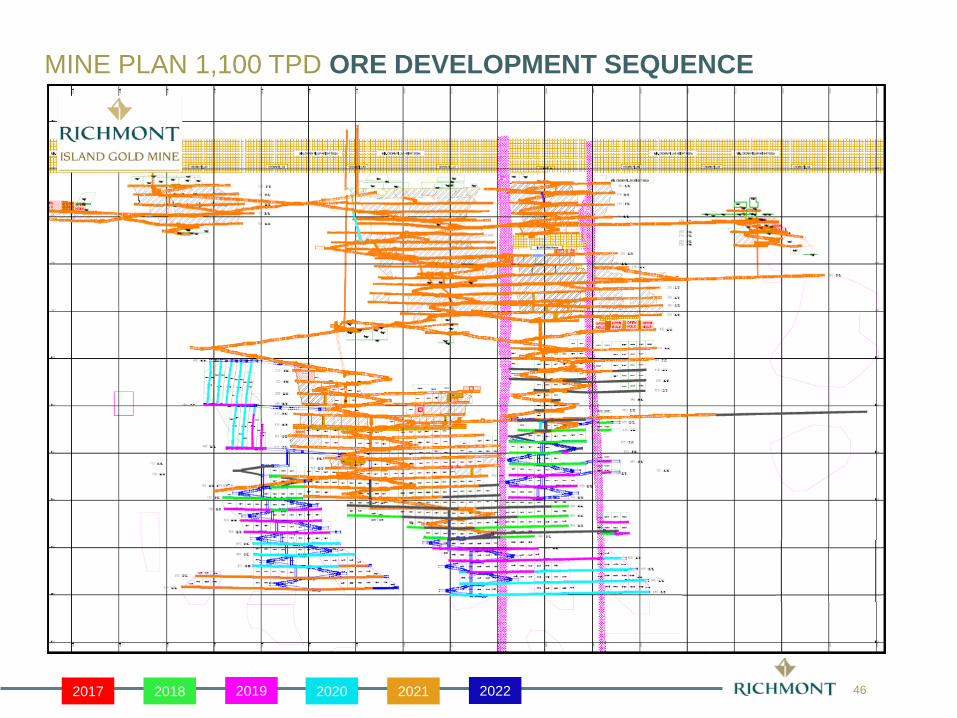
MINE PLAN 1,100 TPD ORE DEVELOPMENT SEQUENCE
2017 2018 2019 2020 2021 2022

47
MINE PLAN 1,100 TPD STOPING SEQUENCE
2017 2018 2019 2020 2021 2022 2023 2024

48
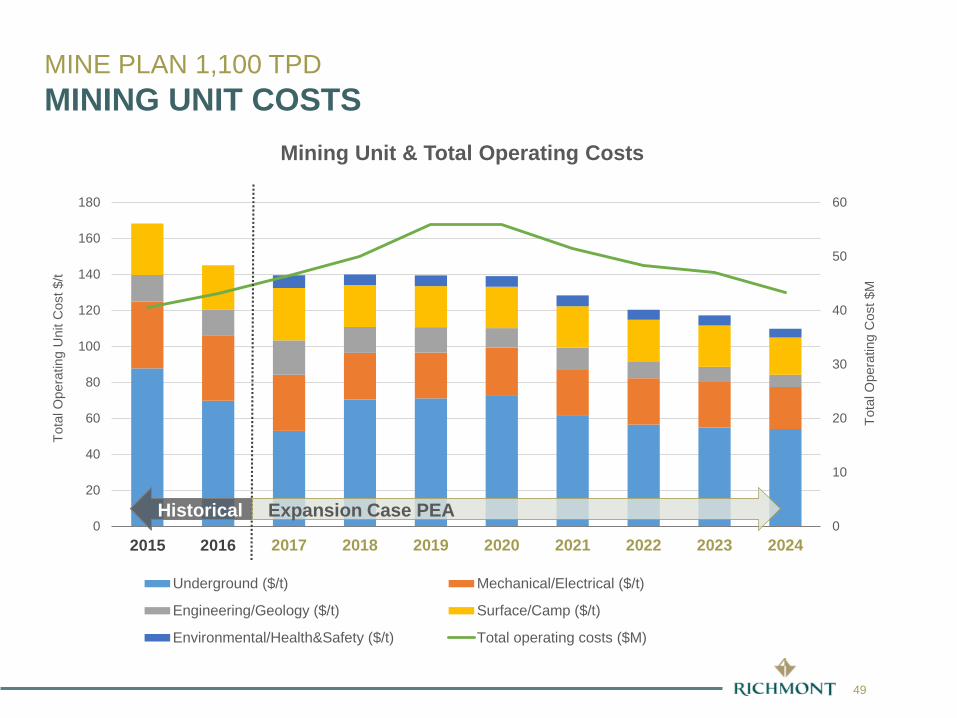
Mining unit costs decline over the PEA period as the proportion of development in ore decreases; partially offset by the decrease in productivities as mining transitions to the fourth mining horizon
Alimak mining in the western block, partially offsets reduction in mining unit costs in 2020
Opportunity to reduce Camp/Transportation costs as focus shifts to hiring local workers
PEA Mining Unit Costs2017 2018 2019 2020 2021 2022 2023 2024 Total
Total operating costs ($M) 46.5 49.9 56.0 56.0 51.5 48.3 47.1 43.3 398.6Underground ($/t) 53.08 70.50 71.16 72.93 61.81 56.50 54.94 54.10 61.97
Mechanical/Electrical ($/t) 31.20 25.91 25.32 26.39 25.56 25.83 25.81 23.38 26.07
Engineering/Geology ($/t) 19.08 14.36 14.25 10.88 12.02 9.39 7.87 6.84 11.65
Surface/Camp ($/t) 29.10 23.29 22.80 22.95 22.91 23.04 23.01 20.58 23.34
Environmental/Health&Safety ($/t) 7.06 5.96 5.88 5.95 6.04 5.63 5.62 4.89 5.85
Total operating costs ($/t) 139.52 140.02 139.41 139.10 128.34 120.39 117.25 109.79 128.88Total operating costs (US$/t) 103.34 103.72 103.27 103.04 95.07 89.18 86.85 81.33 95.44
MINE PLAN 1,100 TPDMINING UNIT COSTS
49
MINE PLAN 1,100 TPDMINING UNIT COSTS
0
10
20
30
40
50
60
0
20
40
60
80
100
120
140
160
180
2015 2016 2017 2018 2019 2020 2021 2022 2023 2024
Tota
l Ope
ratin
g C
ost $
M
Tota
l Ope
ratin
g U
nit C
ost$
/t
Mining Unit & Total Operating Costs
Underground ($/t) Mechanical/Electrical ($/t)
Engineering/Geology ($/t) Surface/Camp ($/t)
Environmental/Health&Safety ($/t) Total operating costs ($M)
Historical Expansion Case PEA
2015 2016
50
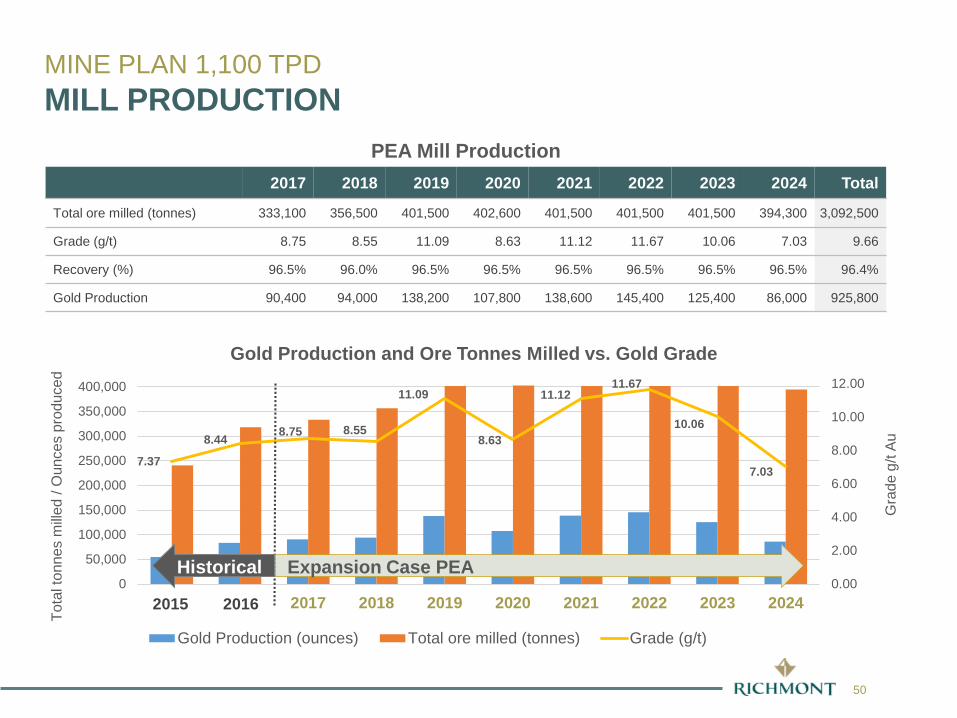
PEA Mill Production2017 2018 2019 2020 2021 2022 2023 2024 Total
Total ore milled (tonnes) 333,100 356,500 401,500 402,600 401,500 401,500 401,500 394,300 3,092,500
Grade (g/t) 8.75 8.55 11.09 8.63 11.12 11.67 10.06 7.03 9.66
Recovery (%) 96.5% 96.0% 96.5% 96.5% 96.5% 96.5% 96.5% 96.5% 96.4%
Gold Production 90,400 94,000 138,200 107,800 138,600 145,400 125,400 86,000 925,800
MINE PLAN 1,100 TPDMILL PRODUCTION
Tota
l ton
nes
mille
d / O
unce
s pr
oduc
ed
7.37
8.44 8.75 8.55
11.09
8.63
11.1211.67
10.06
7.03
0.00
2.00
4.00
6.00
8.00
10.00
12.00
0
50,000
100,000
150,000
200,000
250,000
300,000
350,000
400,000
2015 2016 2017 2018 2019 2020 2021 2022 2023 2024
Gold Production and Ore Tonnes Milled vs. Gold Grade
Gold Production (ounces) Total ore milled (tonnes) Grade (g/t)
Gra
de g
/t Au
Historical Expansion Case PEA
2015 2016
51
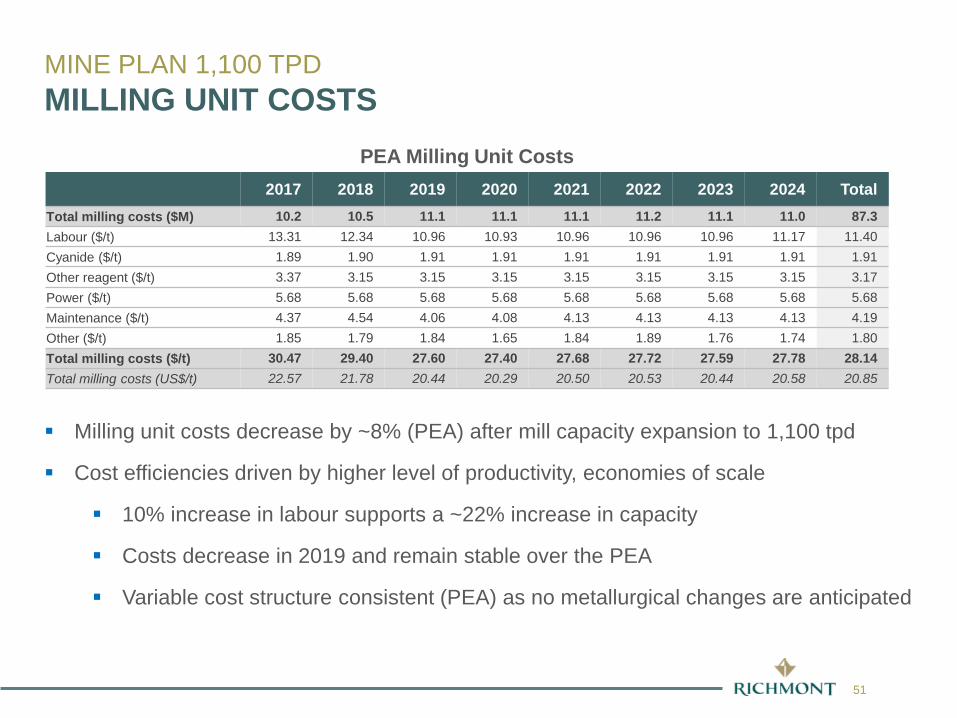
Milling unit costs decrease by ~8% (PEA) after mill capacity expansion to 1,100 tpd
Cost efficiencies driven by higher level of productivity, economies of scale
10% increase in labour supports a ~22% increase in capacity
Costs decrease in 2019 and remain stable over the PEA
Variable cost structure consistent (PEA) as no metallurgical changes are anticipated
PEA Milling Unit Costs2017 2018 2019 2020 2021 2022 2023 2024 Total
Total milling costs ($M) 10.2 10.5 11.1 11.1 11.1 11.2 11.1 11.0 87.3Labour ($/t) 13.31 12.34 10.96 10.93 10.96 10.96 10.96 11.17 11.40Cyanide ($/t) 1.89 1.90 1.91 1.91 1.91 1.91 1.91 1.91 1.91Other reagent ($/t) 3.37 3.15 3.15 3.15 3.15 3.15 3.15 3.15 3.17Power ($/t) 5.68 5.68 5.68 5.68 5.68 5.68 5.68 5.68 5.68Maintenance ($/t) 4.37 4.54 4.06 4.08 4.13 4.13 4.13 4.13 4.19Other ($/t) 1.85 1.79 1.84 1.65 1.84 1.89 1.76 1.74 1.80Total milling costs ($/t) 30.47 29.40 27.60 27.40 27.68 27.72 27.59 27.78 28.14Total milling costs (US$/t) 22.57 21.78 20.44 20.29 20.50 20.53 20.44 20.58 20.85
MINE PLAN 1,100 TPDMILLING UNIT COSTS

52
MINE PLAN 1,100 TPDMILLING UNIT COSTS
0
50,000
100,000
150,000
200,000
250,000
300,000
350,000
400,000
450,000
0
5
10
15
20
25
30
35
2017 2018 2019 2020 2021 2022 2023 2024
Tonn
es M
illed
Milli
ng U
nit C
ost $
/t
Milling Unit Costs & Tonnes Milled
Labour ($/t) Cyanide ($/t) Other reagent ($/t)Power ($/t) Maintenance ($/t) Other ($/t)Total ore milled (tonnes)
In 2016 the mill processed 298k tonnes at unit costs of $35 per tonne

53
Human Resources include all coordinators salaries and hiring fees
IT includes all hardware and software updates
Administration includes all site management and supervisors
PEA G&A Unit Costs2017 2018 2019 2020 2021 2022 2023 2024 Total
Total G&A ($M) 6.4 6.3 6.3 6.3 6.2 6.2 6.2 4.9 48.8
Human Resources 4.52 4.19 3.72 3.70 3.65 3.63 3.63 2.96 3.73
Information Technology (IT) 2.62 2.43 2.16 2.15 2.12 2.11 2.11 1.72 2.16
Administration 12.01 11.14 9.88 9.83 9.69 9.64 9.64 7.85 9.90
Total G&A ($/t) 19.15 17.76 15.76 15.68 15.45 15.38 15.38 12.53 15.79
Total G&A (US$/t) 14.19 13.16 11.67 11.62 11.45 11.39 11.39 9.28 11.70
MINE PLAN 1,100 TPDG&A UNIT COSTS

54RIC: TSX NYSE
54
Total Labour(1)
Island Gold Mine 2017 2018 2019 2020 2021 2022 2023 2024Total Island Gold 338 352 356 339 299 264 263 230
Underground 159 182 186 170 145 125 124 111
Technical Services 54 42 42 42 38 32 32 27
Mechanical/Electrical 72 72 72 72 63 55 55 43
Mill 33 36 36 35 35 35 35 33
G&A 20 20 20 20 18 17 17 16
ContractorsTotal Contractors 122 201 92 166 86 66 67 73
Underground 66 44 34 34 34 21 21 47
Mechanical/Electrical 6 7 8 7 8 6 7 7
Mill 6 106 6 6 6 5 5 4
Site Services 36 36 36 111 30 26 26 7
Other 8 8 8 8 8 8 8 8(1) Excludes exploration drilling.
U/G contractors: Production, definition/delineation drilling and waste development U/G contractors begin to be phased out beginning in 2017; transitioned to internal workforce U/G contractor will be used for Alimak mining in 2020 Mill contractors increase in 2018 for mill expansion Other contractors primarily relate to site security Site services increases in 2020 due to Tailings expansion
MINE PLAN 1,100 TPDLABOUR SUMMARY

55
PEA annual average sustaining capital of ~$21M (~US$15.5M) Key elements of sustaining capital in 2018-2020:
Development of dual ramp system down to 1,000 m level and lateral development for Alimak mining
Infrastructure: Kitchen and camp upgrade, mining services Truck fleet upgrade to 42t trucks
PEA Sustaining Capital ($M)2017 2018 2019 2020 2021 2022 2023 2024 Total
Total Sustaining Capital (C$) 21.8 39.9 41.2 39.0 14.4 5.6 4.2 1.5 167.5Mine Development 3.7 15.8 22.3 14.5 4.6 0.0 0.0 0.0 60.9
Infrastructure 7.4 14.0 11.2 5.3 1.6 0.5 0.4 0.1 40.4
Mill and Environment 1.9 1.6 0.6 12.7 0.5 0.0 0.0 0.0 17.4
Delineation Drilling 3.6 1.2 0.2 0.2 0.2 0.0 0.0 0.0 5.3
Mobile Equipment 5.0 7.3 6.9 6.4 7.4 5.1 3.7 1.4 43.3
Other 0.2 0.0 0.0 0.0 0.0 0.0 0.0 0.0 0.3
Total Sustaining Capital (US$) 16.2 29.6 30.5 28.9 10.7 4.1 3.1 1.1 124.1Mine Development 2.8 11.7 16.5 10.7 3.4 0.0 0.0 0.0 45.1
Infrastructure 5.5 10.4 8.3 3.9 1.2 0.3 0.3 0.0 30.0
Mill and Environment 1.4 1.2 0.5 9.4 0.4 0.0 0.0 0.0 12.9
Delineation Drilling 2.6 0.9 0.1 0.1 0.1 0.0 0.0 0.0 3.9
Mobile Equipment 3.7 5.4 5.1 4.7 5.5 3.8 2.8 1.0 32.0
Other 0.1 0.0 0.0 0.0 0.0 0.0 0.0 0.0 0.2
MINE PLAN 1,100 TPDSUSTAINING CAPITAL
56
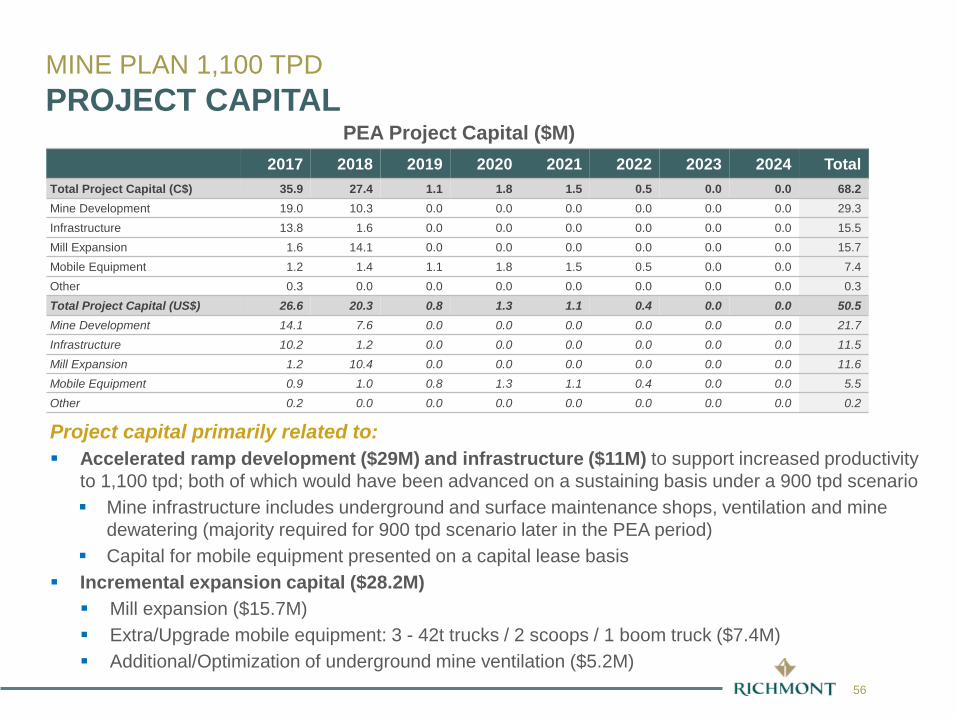
Project capital primarily related to: Accelerated ramp development ($29M) and infrastructure ($11M) to support increased productivity
to 1,100 tpd; both of which would have been advanced on a sustaining basis under a 900 tpd scenario Mine infrastructure includes underground and surface maintenance shops, ventilation and mine
dewatering (majority required for 900 tpd scenario later in the PEA period) Capital for mobile equipment presented on a capital lease basis
Incremental expansion capital ($28.2M) Mill expansion ($15.7M) Extra/Upgrade mobile equipment: 3 - 42t trucks / 2 scoops / 1 boom truck ($7.4M) Additional/Optimization of underground mine ventilation ($5.2M)
PEA Project Capital ($M)2017 2018 2019 2020 2021 2022 2023 2024 Total
Total Project Capital (C$) 35.9 27.4 1.1 1.8 1.5 0.5 0.0 0.0 68.2Mine Development 19.0 10.3 0.0 0.0 0.0 0.0 0.0 0.0 29.3Infrastructure 13.8 1.6 0.0 0.0 0.0 0.0 0.0 0.0 15.5Mill Expansion 1.6 14.1 0.0 0.0 0.0 0.0 0.0 0.0 15.7Mobile Equipment 1.2 1.4 1.1 1.8 1.5 0.5 0.0 0.0 7.4Other 0.3 0.0 0.0 0.0 0.0 0.0 0.0 0.0 0.3Total Project Capital (US$) 26.6 20.3 0.8 1.3 1.1 0.4 0.0 0.0 50.5Mine Development 14.1 7.6 0.0 0.0 0.0 0.0 0.0 0.0 21.7Infrastructure 10.2 1.2 0.0 0.0 0.0 0.0 0.0 0.0 11.5Mill Expansion 1.2 10.4 0.0 0.0 0.0 0.0 0.0 0.0 11.6Mobile Equipment 0.9 1.0 0.8 1.3 1.1 0.4 0.0 0.0 5.5Other 0.2 0.0 0.0 0.0 0.0 0.0 0.0 0.0 0.2
MINE PLAN 1,100 TPDPROJECT CAPITAL
57
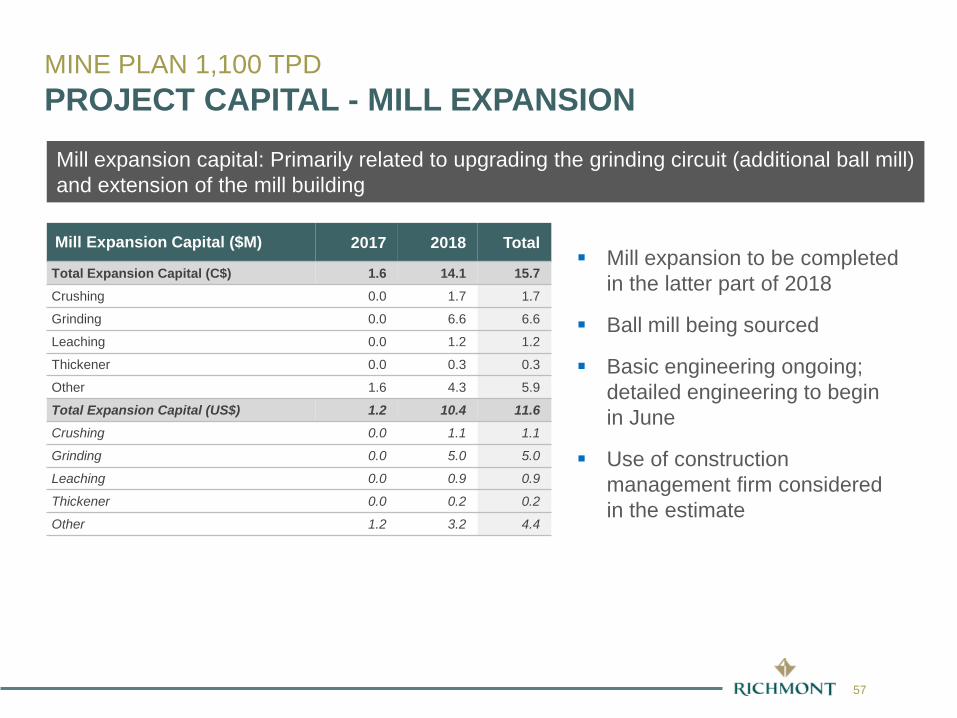
Mill expansion to be completed in the latter part of 2018
Ball mill being sourced
Basic engineering ongoing; detailed engineering to begin in June
Use of construction management firm considered in the estimate
Mill Expansion Capital ($M) 2017 2018 Total
Total Expansion Capital (C$) 1.6 14.1 15.7Crushing 0.0 1.7 1.7
Grinding 0.0 6.6 6.6
Leaching 0.0 1.2 1.2
Thickener 0.0 0.3 0.3
Other 1.6 4.3 5.9
Total Expansion Capital (US$) 1.2 10.4 11.6Crushing 0.0 1.1 1.1
Grinding 0.0 5.0 5.0
Leaching 0.0 0.9 0.9
Thickener 0.0 0.2 0.2
Other 1.2 3.2 4.4
Mill expansion capital: Primarily related to upgrading the grinding circuit (additional ball mill) and extension of the mill building
MINE PLAN 1,100 TPDPROJECT CAPITAL - MILL EXPANSION

58
LegendModified or relocated from existingAdditional at 1,100 tpd
Additional ball mill used as a primary mill Reconfiguration of existing ball mills as secondary mills
Cone head modification (short head to standard)
Increase capacity by opening screen size
Thickener: Retro fit to high capacityunit or additional thickener
Convert Leach #5 in CIL
MINE PLAN 1,100 TPDMILL FLOW SHEET
59
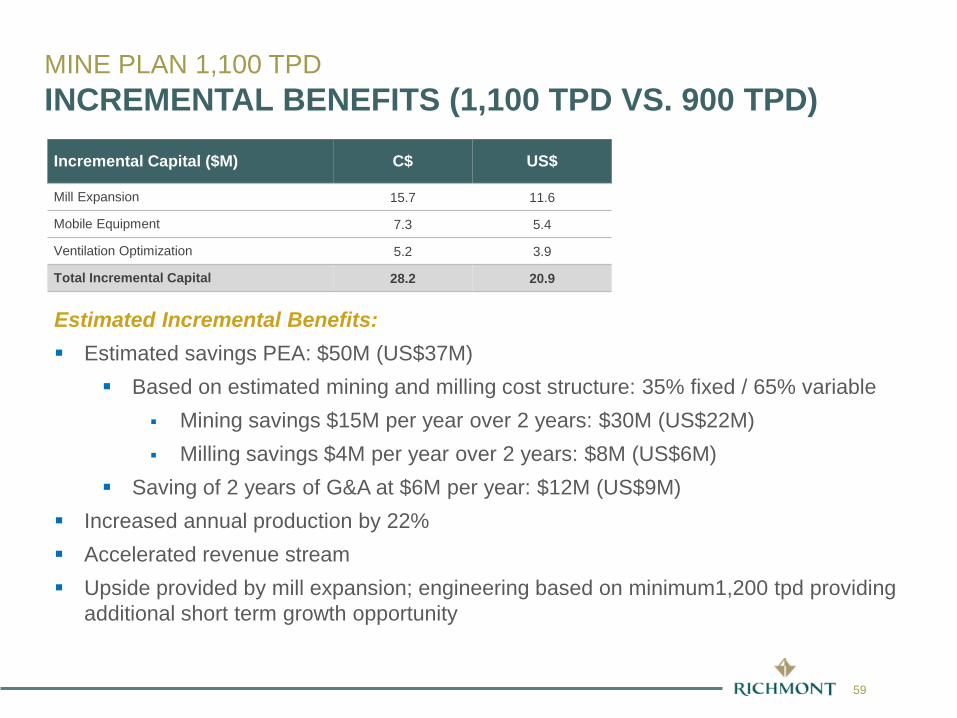
Incremental Capital ($M) C$ US$
Mill Expansion 15.7 11.6
Mobile Equipment 7.3 5.4
Ventilation Optimization 5.2 3.9
Total Incremental Capital 28.2 20.9
Estimated Incremental Benefits: Estimated savings PEA: $50M (US$37M)
Based on estimated mining and milling cost structure: 35% fixed / 65% variable Mining savings $15M per year over 2 years: $30M (US$22M) Milling savings $4M per year over 2 years: $8M (US$6M)
Saving of 2 years of G&A at $6M per year: $12M (US$9M) Increased annual production by 22% Accelerated revenue stream Upside provided by mill expansion; engineering based on minimum1,200 tpd providing
additional short term growth opportunity
MINE PLAN 1,100 TPDINCREMENTAL BENEFITS (1,100 TPD VS. 900 TPD)

www.richmont-mines.com
Financial Analysis
61
FINANCIAL ANALYSISHIGHLIGHTS
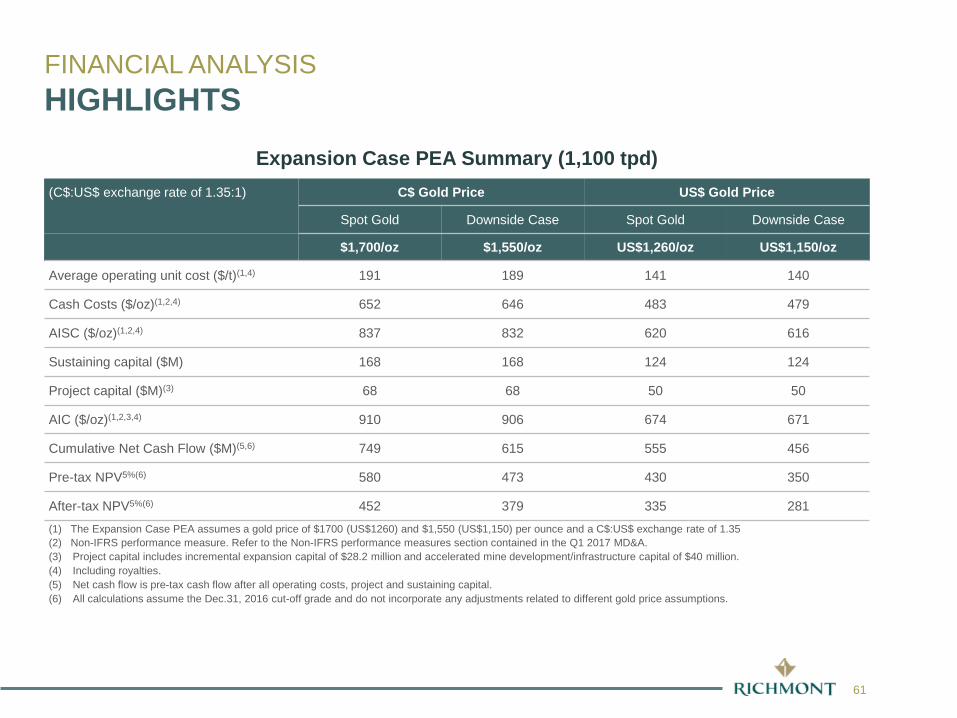
Expansion Case PEA Summary (1,100 tpd)(C$:US$ exchange rate of 1.35:1) C$ Gold Price US$ Gold Price
Spot Gold Downside Case Spot Gold Downside Case
$1,700/oz $1,550/oz US$1,260/oz US$1,150/oz
Average operating unit cost ($/t)(1,4) 191 189 141 140
Cash Costs ($/oz)(1,2,4) 652 646 483 479
AISC ($/oz)(1,2,4) 837 832 620 616
Sustaining capital ($M) 168 168 124 124
Project capital ($M)(3) 68 68 50 50
AIC ($/oz)(1,2,3,4) 910 906 674 671
Cumulative Net Cash Flow ($M)(5,6) 749 615 555 456
Pre-tax NPV5%(6) 580 473 430 350
After-tax NPV5%(6) 452 379 335 281(1) The Expansion Case PEA assumes a gold price of $1700 (US$1260) and $1,550 (US$1,150) per ounce and a C$:US$ exchange rate of 1.35(2) Non-IFRS performance measure. Refer to the Non-IFRS performance measures section contained in the Q1 2017 MD&A.(3) Project capital includes incremental expansion capital of $28.2 million and accelerated mine development/infrastructure capital of $40 million. (4) Including royalties.(5) Net cash flow is pre-tax cash flow after all operating costs, project and sustaining capital.(6) All calculations assume the Dec.31, 2016 cut-off grade and do not incorporate any adjustments related to different gold price assumptions.
62
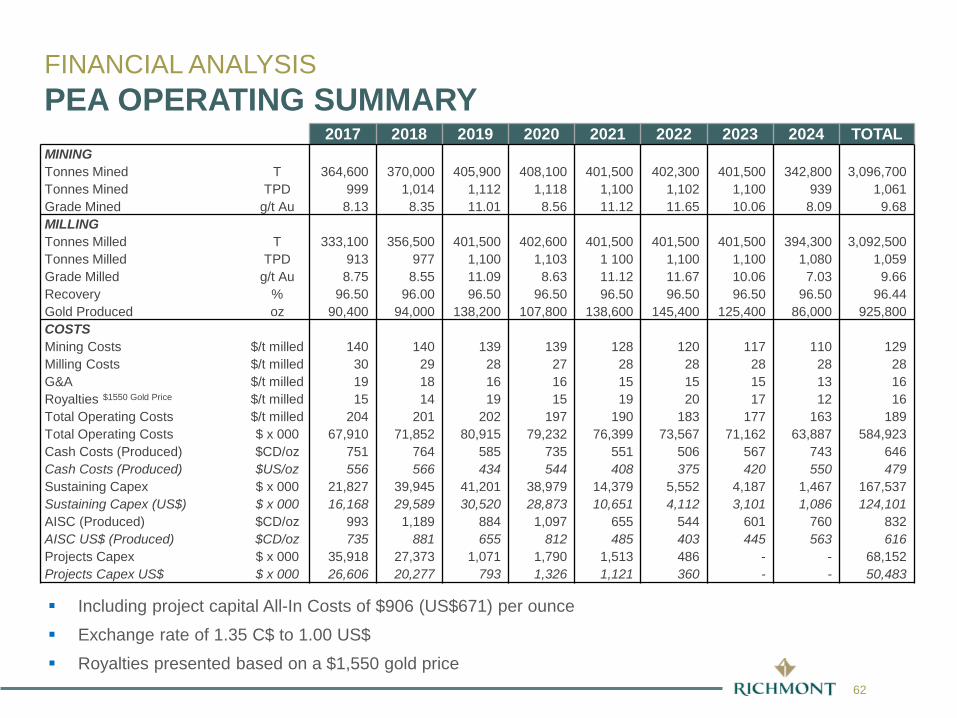
Including project capital All-In Costs of $906 (US$671) per ounce
Exchange rate of 1.35 C$ to 1.00 US$
Royalties presented based on a $1,550 gold price
2017 2018 2019 2020 2021 2022 2023 2024 TOTALMININGTonnes Mined T 364,600 370,000 405,900 408,100 401,500 402,300 401,500 342,800 3,096,700 Tonnes Mined TPD 999 1,014 1,112 1,118 1,100 1,102 1,100 939 1,061 Grade Mined g/t Au 8.13 8.35 11.01 8.56 11.12 11.65 10.06 8.09 9.68 MILLINGTonnes Milled T 333,100 356,500 401,500 402,600 401,500 401,500 401,500 394,300 3,092,500 Tonnes Milled TPD 913 977 1,100 1,103 1 100 1,100 1,100 1,080 1,059 Grade Milled g/t Au 8.75 8.55 11.09 8.63 11.12 11.67 10.06 7.03 9.66 Recovery % 96.50 96.00 96.50 96.50 96.50 96.50 96.50 96.50 96.44Gold Produced oz 90,400 94,000 138,200 107,800 138,600 145,400 125,400 86,000 925,800 COSTSMining Costs $/t milled 140 140 139 139 128 120 117 110 129 Milling Costs $/t milled 30 29 28 27 28 28 28 28 28 G&A $/t milled 19 18 16 16 15 15 15 13 16 Royalties $1550 Gold Price $/t milled 15 14 19 15 19 20 17 12 16 Total Operating Costs $/t milled 204 201 202 197 190 183 177 163 189 Total Operating Costs $ x 000 67,910 71,852 80,915 79,232 76,399 73,567 71,162 63,887 584,923 Cash Costs (Produced) $CD/oz 751 764 585 735 551 506 567 743 646 Cash Costs (Produced) $US/oz 556 566 434 544 408 375 420 550 479 Sustaining Capex $ x 000 21,827 39,945 41,201 38,979 14,379 5,552 4,187 1,467 167,537 Sustaining Capex (US$) $ x 000 16,168 29,589 30,520 28,873 10,651 4,112 3,101 1,086 124,101 AISC (Produced) $CD/oz 993 1,189 884 1,097 655 544 601 760 832 AISC US$ (Produced) $CD/oz 735 881 655 812 485 403 445 563 616 Projects Capex $ x 000 35,918 27,373 1,071 1,790 1,513 486 - - 68,152 Projects Capex US$ $ x 000 26,606 20,277 793 1,326 1,121 360 - - 50,483
FINANCIAL ANALYSISPEA OPERATING SUMMARY

63
Effective tax rate over the PEA period is expected to be approximately 22%
At $1,550/oz: expected income taxes of $89M and Ontario mining taxes of $37M
At $1,700/oz: expected income taxes of $121M and Ontario mining taxes of $48M
PEA Tax EstimatesGold Price C$1,550/oz 2017 2018 2019 2020 2021 2022 2023 2024 Total
Tax Paid ($M) 0.14 0.14 4.18 4.69 30.62 39.22 31.53 15.01 125.52 Tax Paid (US$M) 0.10 0.10 3.09 3.48 22.68 29.05 23.36 11.12 92.98
Gold Price C$1,700/ozTax Paid ($M) 0.14 0.14 14.67 13.60 37.88 46.31 37.54 19.11 169.38 Tax Paid (US$M) 0.10 0.10 10.87 10.07 28.06 34.31 27.81 14.15 125.47
Exchange rate: 1.35 C$ to 1.00 US$
FINANCIAL ANALYSISTAX ESTIMATES

64
FINANCIAL ANALYSISCURRENCY AND GOLD PRICE SENSITIVITIES
Pre-tax Net Cash Flow(1,2) ($M) SensitivityUS$ Gold Price
C$:U
S$
1,000 1,100 1,200 1,300 1,400
1.00 123 212 302 391 481
1.10 212 311 409 507 606
1.20 302 409 516 623 731
1.30 391 507 623 740 856
1.35 436 556 677 798 918
1.40 481 606 731 856 981
1.45 525 655 784 914 1 043
1.50 570 704 838 972 1 106
1.60 659 802 945 1 088 1 231
PEA mine plan generates positive pre-tax net cash flow even at a gold price of US$1,000 per ounce and a C$ to US$ exchange rate at parity
(1) Net cash flow is pre-tax cash flow after all operating costs, project and sustaining capital.(2) All calculations assume the Dec.31, 2016 cut-off grade and do not incorporate any adjustments related to different gold price assumptions.

www.richmont-mines.com
Next Steps
66RIC: TSX NYSE
66
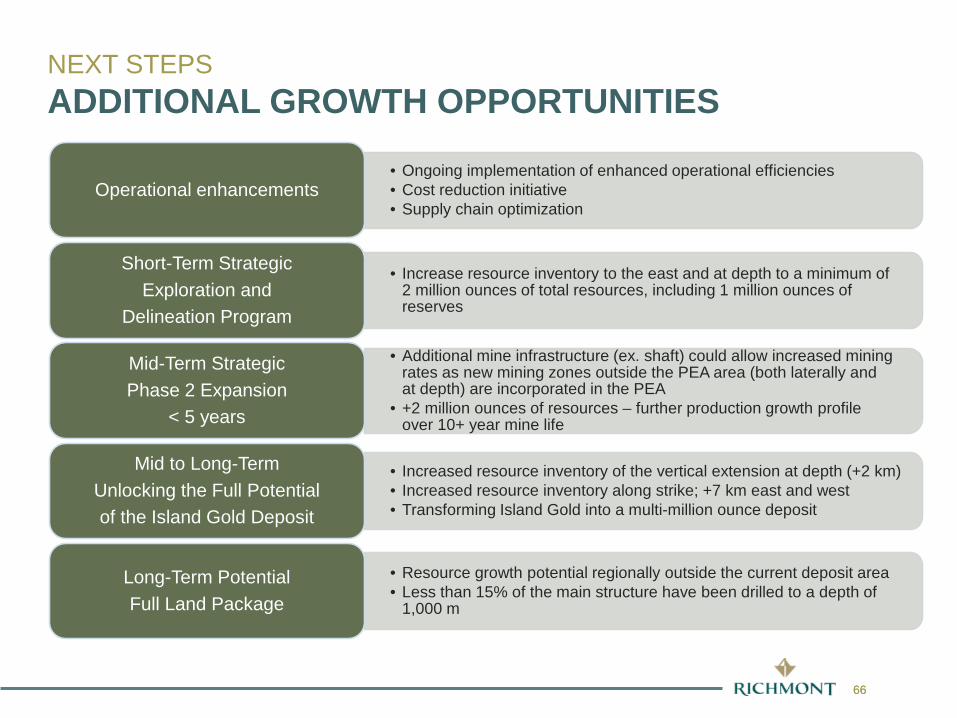
NEXT STEPSADDITIONAL GROWTH OPPORTUNITIES
• Ongoing implementation of enhanced operational efficiencies• Cost reduction initiative• Supply chain optimization
Operational enhancements
• Increase resource inventory to the east and at depth to a minimum of 2 million ounces of total resources, including 1 million ounces of reserves
Short-Term Strategic Exploration and
Delineation Program
• Additional mine infrastructure (ex. shaft) could allow increased mining rates as new mining zones outside the PEA area (both laterally and at depth) are incorporated in the PEA
• +2 million ounces of resources – further production growth profile over 10+ year mine life
Mid-Term StrategicPhase 2 Expansion
< 5 years
• Increased resource inventory of the vertical extension at depth (+2 km)• Increased resource inventory along strike; +7 km east and west• Transforming Island Gold into a multi-million ounce deposit
Mid to Long-TermUnlocking the Full Potential of the Island Gold Deposit
• Resource growth potential regionally outside the current deposit area• Less than 15% of the main structure have been drilled to a depth of
1,000 m
Long-Term PotentialFull Land Package

67RIC: TSX NYSE
67
620 m Level PlannedExplo. & Delineation Drift
860 m Level PlannedExplo. & Delineation Drift
GOUDREAULOCHALSH ISLAND EXT1 EXT2
- 500 m
- 1.500 m
W E
340 m Level
190 m Level
740 m LevelExplo. & Delineation Drift
- 1.000 m
200 m
2017-2018 DEEP EXPLORATION DRILLING
Proven Reserves
Probable Reserves
Indicated Resources
Inferred Resources
Inferred Resources
(B. D. G. G1 Zones)
Ramps and Actual Development
Mined Out
Planned Development
Legend
**** Mineral Reserves and Resources as of December 31. 2016)
GD-630-0125.37/3.85
GD-620-0119.74/1.4
NEW DISCOVERYGD-640-05
20.57/11.3 c.l.
**** Drillhole IntersectionAu (cut 70 g/t) / true thickness (metres)c.l. Core length (metres)
Target
Target
Target
Extension of existing resource blocks + new potential areas
NEXT STEPSSHORT-TERM OBJECTIVE: +2 M OZ (net of depletion) TOTAL RESOURCES
2017-2018 SURFACE/ UNDERGROUNDEXPLORATION DRILLING

68RIC: TSX NYSE
68
NEXT STEPSUNLOCKING THE FULL POTENTIAL OF ISLAND GOLD Potential for new resource blocks inside the main Island Gold mineralized
structure, laterally and at depth. Up to now, more than 2 Moz of gold have been defined over a 2 km strike and we believe that mineralization could extend at least until a 2 km depth
?- 1,000 m
- 500 m
- 1,500 m
MAGINO ISLAND GOLD EDWARDS CLINE
Rich
mon
t
Rich
mon
t
Argo
naut
Strik
e M
iner
als
New Gold Zone Intersections (Au Cut 70 g/t at Lateral East Zone or 225 g/t for Lower C Zone)Au g/t / true thickness (metres)
Clin
e M
inin
g Co
rp,
MH1-1024.54/3.76
GD-640-0520.57/11.3 c.l.
GD-640-05-116.10/8.33 c.l.
- 2,000 m
- 2,500 m
Longitudinal section:
Macassa Mine (Kirkland Lake): 1,768 m Hoyle Pond Mine (Goldcorp): 2,200 m Golden Giant Mine (Barrick): 1,524 m

69RIC: TSX NYSE
69
%%
%%
%%%%
%%
1.5 km
KREMZAR
EGO
Property outline
EMILY BAY
EDWARDS
CLINE
ISLAND GOLD MINE
MAGINO
NEXT STEPSGOLD POTENTIAL ON LARGE PROSPECTIVE PROPERTY
Less than 15% of the main structure have been drilled to a depth of 1,000 m
70
EXPANSION CASE PEA POSITIONING FOR SUSTAINABLE GROWTH
World Class Deposit in Low Risk Jurisdiction; +2M ounces deposit to date and significant exploration potential with more than 450k gold ounces discovered in 2016 @ less than $35/ounce discovery cost
Strong Balance Sheet and Low Share Count; Maximizing per share valuation
Experienced Management and Board
Favorable Currency Exchange
PEA confirms low industry cash costs and a robust cash flow stream over the next eight-year Phase 1 period; Cash flow generated could fund future growth opportunities
Additional opportunities to increase productivity and improve our cost structure beyond the PEA assumptions

www.richmont-mines.com
Questions

72RIC: TSX NYSE
72
MÉLISSA TARDIFLLB
Lawyer and Corporate Secretary
RICHMONT MINESMANAGEMENT TEAM
RENAUD ADAMSP. ENGPresident andChief Executive Officer
STEVE BURLETONCFA. MBA
Vice-President.Business Development
ROB CHAUSSECPA. CA
Chief Financial Officer
CHRISTIAN BOURCIERP. ENGVice-President.Operations
NICOLE VEILLEUXCPA. CAVice-PresidentFinance
ANNE DAYMBA. ICD.DSenior Vice-President.Investor Relations
DANIEL ADAMGEO PHDVice-PresidentExploration

73RIC: TSX NYSE
73
RENÉ MARIONP. ENG
Chairman of the Board and Chair of the Technical and Corporate Responsibility Committee
MICHAEL PESNERCA
Director and Chairof the Audit Committee
RENAUD ADAMSP. ENG
Director. President andChief Executive Officer
PETER BARNESCA
Director and Chair of the Human Resources and Compensation Committee
ELAINE ELLINGHAMP. Geo.. MBA
Director and Chair of the Governance and Nominating Committee
RICHMONT MINESBOARD OF DIRECTORS
www.richmont-mines.com