portland state university human-powered vehicle teamweb.cecs.pdx.edu/~far/past capstone...
TRANSCRIPT

June 7, 2006
Portland State University Human-Powered Vehicle Team
D’Alembert’s Vike Trike
Human Powered Vehicle Design Report
ME 493 Final Report – Year 2006
Tinnesand, Heidi Braun, Kenny Hays, Brian Hertert, Cary Jackson, Rob Dr. Derek Tretheway-Advisor

Executive Summary The 2006 Portland State University human-powered vehicle is a fully-faired,
recumbent tricycle, designed and built to win the overall single rider category at the 2006
ASME West Coast HPV Challenge. Every aspect of this vehicle’s design is original to
this year’s team.
The vehicle has been named D’Alembert’s Vike Trike, to highlight the attention
that has been paid to aerodynamics in its’ concept and fabrication. In an effort to realize
D’Alembert’s paradox, the fairing shape and surface texture were designed and built as to
best achieve steady, uniform flow with minimal drag.
Beneath the carbon fiber composite sits a 4130 steel monotube frame, with two 20
inch wheels in the front, and a single 700C wheel in the rear. Power is delivered through
a Shimano racing transmission, with the addition of a single Terracycle idler gear to
direct the chain path. The cockpit consists of an adjustable, custom-made, carbon fiber
composite seat, protected by a 6061–T6 Aluminum roll bar.
The main subsystems of the vehicle are the frame, fairing, the mechanical
integration, drivetrain, and the rider protection systems. Extensive research, analytical
modeling, and computer-aided design have been performed on multiple aspects of the
vehicle. Wherever possible, the results of these analyses have been verified or compared
to controlled testing, the details of which follow in the body of this report.
The performance of the Vike Trike in competition has served as the ultimate test
of its’ design and functionality. Our team represented Portland State University at the
2006 ASME West Coast Human Powered Vehicle Challenge and proudly pedaled our
way to a third place finish at over 40mph. With the success of this first prototype and the
knowledge gained from testing it, we believe that it will serve as an excellent platform for
future HPV research and development at Portland State.

Table of Contents Page [1] Introduction 1
[2] Mission Statement 1
[3] Major Design Specifications 2 [4] Top Level Design Alternatives 2 [5] Final Design and Evaluations 4
5.1 The Fairing 6 5.2 The Frame 10 5.3 Mechanical Integration 13 5.4 Drive Train 16 5.5 Safety Systems 18
[6] Future Design Considerations 19 [7] Conclusion 20 [8] Appendices 21 8.1 Summary of 2005 Results 21 8.2 Product Design Specifications 22 8.3 Summary of Competition Rules 27 8.4 Internal and External Search Documents 29 8.5 Concept Scoring Matrix 35 8.6 Analysis Based Decision Examples 36 8.7 Climate and Geographic Data for San Luis Obispo 62 8.8 Design Analysis and Testing Details 63 8.9 Vehicle Maintenance Schedule 69 8.10 Vehicle Design Details 72 [9] References 102 [10] Acknowledgements 104

[1] Introduction
Each spring the American Society of Mechanical Engineers (ASME) sponsors a
Human Powered Vehicle (HPV) competition for colligate engineering teams from across
the country. A truly engineering inspired competition, the three vehicle classes and four
events are designed to focus on vehicle design, innovation, and performance rather than
athletic ability. Such a competition structure demands a successful design to be superior
in multiple mechanical disciplines including fluid mechanics, machine design, heat
transfer, and material science.
To test the versatility of the HPVs each competition event is designed to asses a
separate vehicle discipline. The sprint event is designed to test the top speed of the
vehicles by timing them through a 100 meter time trap following a 500 meter run-up.
Vehicle endurance and maneuverability are tested during a 65 kilometer road course in
which teams must switch riders multiple times. The ability of a vehicle to handle utility
tasks is evaluated on an obstacle course on which competitors are required to transport
packages from station to station. Finally, the vehicle design event asses the quality of the
vehicle’s design based on a design report and presentation. After visiting the 2005
competition and finding the design, endurance and sprint events to be the most
competitive, our team set a goal to win these events at the 2006 competition.
To accomplish this, our team set performance targets based on exceeding the
performance of last years winners (see Appendix 8.1 for a summary of 2005 results). We
determined that the vehicle must achieve a maximum velocity greater than or equal to
45mph, and an average endurance speed greater than or equal to 20 mph. We began the
design process with these initial benchmarks.
[2] Mission StatementOur mission is to design and produce a competitive, innovative, and safe human powered
vehicle for entry in the speed and endurance events of the 2006 ASME West Coast
Challenge in April of 2006. We aim to win the overall single rider category by producing
the most efficient vehicle possible, and to fulfill our Portland State University mechanical
engineering senior capstone design sequence requirements.
1

[3] Major Design SpecificationsThe two main customers of the HPV are the race team members who are the end
users of the product, and the ASME judges who determine vehicle scoring at the
competition and inspect the vehicle for compliance with competition rules. Using the
expectations of these two groups as design requirements, the following list of major
design specifications was developed (see Appendix 8.2 for the complete PDS document).
A)The vehicle must be compliant with all competition rules. A number of
rules have been set by the ASME for all vehicles entering the competition, a summary of
which is presented in Appendix 8.3. To be allowed to enter the competition, the vehicle
must meet or exceed these requirements.
B) The vehicle must be light. In order to accelerate and corner faster than our
competition, the weight of the vehicle must be kept as low as possible. With a maximum
weight benchmark set by the 2005 endurance winner of 58lbs, a competitive target
vehicle weight was set at 50lbs.
C) The vehicle must be aerodynamically efficient. At the velocity required to
place first in the ASME sprint event, aerodynamic drag is the largest force resisting
vehicle motion [see Appendix 8.6.1]. Therefore, to achieve the design goal of 45mph,
the power required to overcome aerodynamic drag at this velocity must not exceed the
estimated rider power output of 0.5 hp [Ref. Wilson pg. 44].
D) The vehicle must be safe. Because the vehicle will be operated in a dynamic
racecourse environment, it must be designed such that the riders are protected from
bodily harm regardless of vehicle motion or orientation relative to the road surface.
E) The vehicle must be built within budget. Total vehicle production costs
must not exceed $5,000.
[4] Top Level Design Alternatives
During the design phase we conducted extensive internal and external searches to
develop a list of design options for each system of the vehicle. Condensed versions of
the internal and external search documents appear in Appendix 8.4. Using a concept
scoring matrix (see Appendix 8.5) we made design decisions based on each options
ability to satisfy the requirements of the PDS. Of these design options, three of the most
2

important top level design alternatives are presented in detail here. They are: the fairing
size, number of wheels and frame style.
Competition rules require a fairing covering 1/3 of the vehicle’s frontal area as
shown in figure 4.1, however greater vehicle efficiencies can be achieved by enclosing
the vehicle in a full aerodynamic shell. The drawback to this increase in efficiency is
higher overall weight and cost of the vehicle. A lower weight fairing also reduces the
rolling resistance, but the increase in rolling drag is far outweighed by the reduction in
aerodynamic drag at velocities greater than 35mph (see Appendix 8.6.1). After
researching vehicle aerodynamics and comparing theoretical models of various fairing
sizes, we determined that a full fairing was necessary to obtain the aerodynamic
efficiency goal set by the PDS.
In selecting the number of wheels the vehicle should have, our team considered
two, three and four wheels. Increasing the number of wheels can increase the stability of
the vehicle. However, decreasing the number of wheels in contact with the ground
decreases the rolling resistance of the vehicle, and decreases the rotating mass. The
number and orientation of wheels on the vehicle determines its’ overall size and shape,
which has significant impacts on aerodynamic efficiency [Ref. Tamai, pg 174]. At the
2005 ASME competition, we saw that two wheeled vehicles were often unstable which
caused many of them to crash during cornering. In addition, the two wheeled vehicles
with full fairings experienced difficulties starting and stopping due to their inability to
place their feet on the ground. We determined that two 20in wheels in front and a single
700c wheel in the back (known as a ‘tadpole trike’), would give us the best balance
between aerodynamic efficiency and stability.
Figure 4.1. Example of vehicle with 1/3 frontal area coverage.
3

The selection of frame style was also a major design consideration. For this
decision three major alternatives were considered. The first was a monocoque tub-frame
design in which the bottom shell of the fairing is designed and built using advanced
composite construction techniques. This design reduces overall vehicle weight by
combining two separate parts into a single multipurpose part. While stiff and light, we
determined that a monocoque design was unacceptable due to the cost of manufacturing
several molds which were required for a successful design. The second option was a
tubular space frame design in which small diameter tubing is assembled into a rigid
structure by using multiple triangulated sections. This design requires a frame to be
spatially large in order to achieve the required stiffness, and is therefore unacceptable
from an aerodynamic perspective. The third option, a monotube design uses one main
frame member and can be designed to fit into the bottom of a fairing and consume very
little space. These aerodynamic benefits, as well as ease of manufacture, led to the
decision to use a monotube frame in the vehicle.
[5] Final Design and Evaluations The 2006 Portland State University HPV is an assembly of multiple subsystems,
all of which are unique in function and design. For presentation clarity the vehicle design
has been divided into five sections: fairing, frame, drive train, mechanical integration,
and safety (see figure 5.1). Design summaries for each of these subsystems are
presented in sections 5.1-5.5.
Drive-train
Safety
Frame Mechanical Integration
Fairing
Figure 5.1: Overview of design and subsections
4
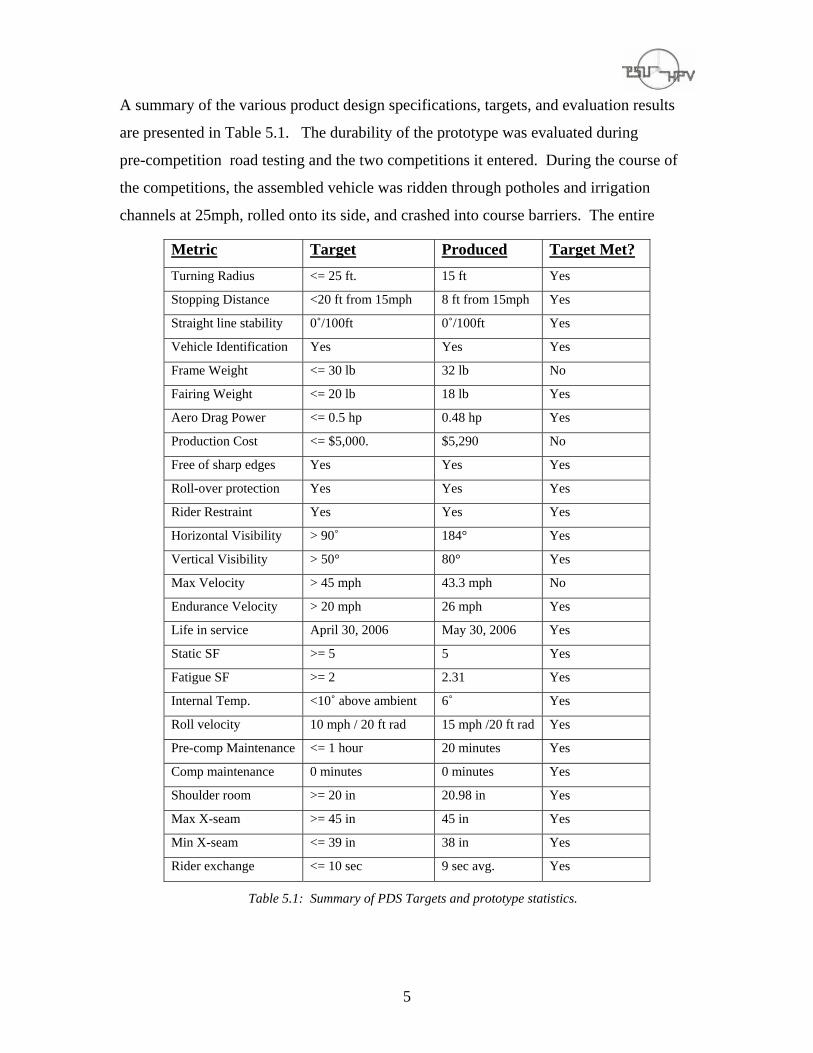
A summary of the various product design specifications, targets, and evaluation results
are presented in Table 5.1. The durability of the prototype was evaluated during
pre-competition road testing and the two competitions it entered. During the course of
the competitions, the assembled vehicle was ridden through potholes and irrigation
channels at 25mph, rolled onto its side, and crashed into course barriers. The entire
Metric Target Produced Target Met?Turning Radius <= 25 ft. 15 ft Yes
Stopping Distance <20 ft from 15mph 8 ft from 15mph Yes
Straight line stability 0˚/100ft 0˚/100ft Yes
Vehicle Identification Yes Yes Yes
Frame Weight <= 30 lb 32 lb No
Fairing Weight <= 20 lb 18 lb Yes
Aero Drag Power <= 0.5 hp 0.48 hp Yes
Production Cost <= $5,000. $5,290 No
Free of sharp edges Yes Yes Yes
Roll-over protection Yes Yes Yes
Rider Restraint Yes Yes Yes
Horizontal Visibility > 90˚ 184° Yes
Vertical Visibility > 50° 80° Yes
Max Velocity > 45 mph 43.3 mph No
Endurance Velocity > 20 mph 26 mph Yes
Life in service April 30, 2006 May 30, 2006 Yes
Static SF >= 5 5 Yes
Fatigue SF >= 2 2.31 Yes
Internal Temp. <10˚ above ambient 6˚ Yes
Roll velocity 10 mph / 20 ft rad 15 mph /20 ft rad Yes
Pre-comp Maintenance <= 1 hour 20 minutes Yes
Comp maintenance 0 minutes 0 minutes Yes
Shoulder room >= 20 in 20.98 in Yes
Max X-seam >= 45 in 45 in Yes
Min X-seam <= 39 in 38 in Yes
Rider exchange <= 10 sec 9 sec avg. Yes
Table 5.1: Summary of PDS Targets and prototype statistics.
5

vehicle was shown to be durable as it continued to function as designed with no
components showing signs of deformation or failure. Detailed evaluations for each
subsystem are included in the following subsections.
[5.1] The Fairing
[5.1.1]Overview
As stated above, a minimum of 33% frontal coverage is required by the
competition, and a full fairing was determined to be necessary to meet the PDS
requirements. Using the PDS requirements for aerodynamics, safety, and weight as the
critical design parameters, the fairing was designed based on the theoretical and
experimental information described below.
[5.1.2]Basic Geometry
Studies of submerged body flow and general aerodynamics indicate that the two
main sources of drag as outlined by most classical fluid dynamics texts are those due to
pressure and viscous effects [Ref. Munson]. While these are the largest contributors to
drag for general submerged flows, in the study of aerodynamics for streamlined vehicles,
Tamai identifies interference and induced drag as two additional sources. To produce the
most efficient design possible, the team considered all four of these sources of drag and
made design decisions based on the greatest overall aerodynamic benefit.
For general submerged flow problems, pressure drag due to high-pressure zones
at the leading surface of the body and low-pressure zones on downstream surfaces is the
largest contributor to drag. Years of research in the fields of fluid dynamics and
aerospace have produced many geometries which successfully address this problem and
achieve almost complete pressure recovery. This nearly eliminates pressure drag.
The National Advisory Committee for Aeronautics (NACA) spent years
developing airfoil geometries which have since been published in the public domain.
These databases were accessed using John Dreese’s Design FOIL software and sized to
fit around the Vike Trike, as detailed in section 5.1.3. The result is a fairing constrained
in plan view by a NACA 4-series airfoil, and a nose constrained on the top and bottom
6

using curves derived from NACA 6-series airfoils. The resulting bulk geometry, shown
in plan and side views, are presented in Figures 5.2 and 5.3, respectively.
The second largest source of drag, is viscous drag. Viscous drag is due to the
shearing of fluid along its interface with the solid as constrained by the no slip condition.
While this cannot be eliminated, the design team attempted to reduce it by two methods.
First, the overall wetted area of the fairing was kept to the minimum possible size by
reducing interior geometrical clearances to the minimum acceptable for comfort and
safety of all riders.
Second, attempts were made in the design to control the state of the boundary
layer along the length of the fairing. As in the highly studied case of the flat plate, there
are three possibilities for the state of the boundary layer. Arranging these cases in order
of increasing drag as stated by Tamai: laminar, turbulent, and separated, the ideal case for
design is clear. While details of boundary layer flows are outside the scope of this paper
[see: Acheson ch.8, Tamai ch.2.2], theory predicts and experiments show that producing
a favorable pressure gradient (-dp/dx along the length of the fairing) extends the length of
the laminar boundary layer. Bernoulli’s equation indicates that this may be accomplished
by increasing the fluid velocity along the length of the surface.
In the design of the PSU Vike Trike, attempts to accomplish laminar boundary
layer flow were made by designing what Tamai calls ‘gentle’ contours to thin the
boundary layer on the nose and other up-stream surfaces, examples of which may be seen
in Figure 5.4. For contours downstream of the maximum width where a favorable
pressure gradient is not possible, we used a maximum body convergence angle of 17
degrees from free stream flow as suggested by Tamai (see Figure 5.5).
Figure 5.2: Side view of bulk geometry Figure 5.3: Plan view of bulk geometry
7

Once the main contributions to drag were mitigated, steps were taken to reduce
Figure 5.4: View of curves used on nose and sides.
Figure 5.5: View of curves used on tail sections.
the other sources of drag as defined by Tamai. Induced drag, that which is inherent in the
produc
techniques to reduce surface abnormalities.
tion of lift or down force, was eliminated by designing the fairing with zero angle
of attack.
Interference drag, due to surface roughness, body seams, etc. was reduced using
fabrication
[5.1.3] Scale Optimization
Once the general airfoil curves had been chosen as detailed in section 5.1.2, the
timized. From data plotted for symmetric airfoils [Ref.
r
n
at the lowest drag on a streamlined body occurs at a length
scaling of the fairing was op
Munson figure 9.16], minimum drag coefficients occur at Reynolds numbers on the orde
of three million. Using a design speed of 45 mph, and fluid properties from Munson
corresponding to climate data for San Luis Obispo [see Appendix 8.7], we determined
that Reynolds numbers on the order of three million could be achieved with fairing
lengths in the 100in range.
Additional research found data from Hoerner, plotted by Wilson [Ref. Wilso
figure 5.9], which suggests th
to thickness ratio of approximately 3.7. Combining these results, along with minimum
interference dimensions, the bulk geometry was constrained to a NACA 4-series airfoil
with a length of 106 inches and a maximum width of 30 inches (see figure 5.6).
8

Figure 5.6: Optimized length and width dimensions of the fairing.
[5.1.4] Determination of Ground Clearance
The development of internal flow, causing high levels of drag between the road
. Because the product design specifications
6.3
and fairing bottom was also a design concern
require the vehicle to be fast as well as agile, the vehicle is required to have a center of
gravity as low as possible without sacrificing aerodynamic integrity. Again studies
presented by Tamai detail that for a Torpedo style shape with a flat bottom, the ratio of
ground clearance to body length is optimized at .03-.05 [Ref. Tamai 3.3.2]. For a 10
inch length, the minimum ground clearance was determined to be 3.2 inches.
[5.1.5] Material Selection
We selected a composite structure of carbon and aramid fibers in an epoxy matrix
ese materials were selected because of their formability to
omple
r
for fairing construction. Th
c x geometries, lightweight construction, resistance to abrasion, and low surface
roughness. While strength predictions for the material are difficult to determine due to
the inconsistencies in the hand lay-up process, testing of initial material samples
consistently showed the final construction using three layers of carbon and a single laye
of aramid to be durable enough for the predicted loadings.
[5.1.6] Fairing Evaluation
The design was analyzed using computational fluid dynamics software to
erodynamic efficiency achieved with our geometry. The
sults that
t, the
determine the theoretical a
re of this analysis, the details of which are presented in Appendix 8.8.1, show
for our frontal area of 886 in2 the drag coefficient is 0.11. Using this drag coefficien
power required to overcome aerodynamic drag at a vehicle velocity of 45mph is
calculated to be 0.49hp, which satisfies the PDS requirement for aerodynamic efficiency.
9

The weight specification for the fairing requires that it have a weight of no
than twenty pounds. This requirement was evaluated by placing each fairing piece on a
more
scale and then summing the measured results. Using this technique, the fairing was
found to meet the weight requirements of the PDS with a total weight of 18.6 lbs.
[5.2] The Frame
[5.2.1] Overview
design was determined to be a monotube recumbent tadpole trike.
metry determined, the final design was produced by creating a frame
geomet g
The frame
With this basic geo
ry which places the rider in the optimum power producing position while fittin
within the fairing as detailed above, and allowing agile maneuvering.
[5.2.2] Frame Geometry
Once the basic configuration had been determined, the frame design was focused
r output. In a study at Colorado State University [Ref. Reiser]
on the e
es
est angle constant while varying hip
ndation
er distance between the seat and the bottom bracket.
Comme
on optimizing rider powe
ffect of backrest angles on recumbent cycling power, it was determined that
backrest angles (BA in figure 5.7) of 30 degrees and 40 degrees produced the greatest
power output for each rider in their study.
In this study the hip orientation (HO in figure 5.7) was held constant at 15 degre
because a previous study had held the backr
orientation, and had determined that a hip orientation of 15 degrees produced maximum
power output [Ref. Reiser]. The combination of these two results formed the fou
for the rider position. A backrest angle of 35 degrees was chosen to optimize the
aerodynamic benefit of a small frontal area, while keeping the bike as short as possible,
with a hip orientation of 15 degrees.
Once rider position had been decided, the industry standard for sizing recumbent
bikes was used to determine the prop
rcially available recumbent bicycles are matched to riders based on their x-seam
measurement [Ref. Coventry], so each of the riders’ x-seams were measured. This
resulted in a team x-seam variation of 6 inches with median x-seam being 40.5 inches.
10

Figure 5.7: Relation of frame geometry to critical rider angles.
The frame was then optimized for the median rider, using the following parameters: 40.5
in. x-seam, 4 in. seat depth (distance between seat and point A) and 172.5 mm cranks.
With these req fit inside
g
the trac
amic
uirements for rider ergonomics, and the requirement to
the fairing, the final frame geometry was determined. The front wheel track was
determined based on a combination of maneuverability requirements. Though widenin
k increases stability while cornering, setting it at 29in meets the PDS requirement
for cornering stability (see Appendix 8.6.4 for details) and maximizes the aerodyn
efficiency by placing the wheels inline with the fairing sides. These geometrical
requirements, when combined, resulted in the frame geometry as shown in figure 5.8.
[5.2.3] Material Selection and Testing
The main options identified for frame tubing were chrome-moly steel, aluminum,
and titanium. After scoring each option, 4130 chrome-moly steel was selected, based
trength. primarily on its cost, weldability, and s
11

Figure 5.8: Detail of monotube design. Industry standards and local recumbent builders were consulted to validate the
theoretical analysis regarding the appropriate tube diameter and wall thickness for the
main frame members. These considerations resulted in the selection of 1.5 in. outside
diameter, 0.049 in. thick tube for the prototype design.
To ensure vehicle strength a specimen of the steel tube used for the base frame
was sent to Koon-Hall-Adrian Metallurgical for testing. The strength of a test weld was
also determined using a crys
.7
tal micrograph analysis, performed by Dr. Jack Devletian of
Portland State University. This testing determined that the strength of the welds far
exceeds the strength of the parent material, and thus the steel tubing yield strength of 58
ksi was used as the governing static strength value in all calculations.
[5.2.4] Frame Testing and Evaluation
Analysis based testing of the frame was used to determine adherence of the design
to PDS requirements for strength safety factors. Finite element analysis of the frame was
conducted to determine the safety factors for each member. The results presente
figure 5.9 show that the lowest safety factor is 5.8, meeting the PDS minimum
requirement of 5. The area with this minimum safety factor is highligh
d in
ted in red in the
gure. To determine the factor of safety against failure due to the oscillating pedal
riment to determine the resulting stresses in the
ame (
igh
fi
forces, we performed a laboratory expe
fr see Appendix 8.8.2 for experimental details). This experiment showed that the
minimum factor of safety in fatigue is 2.3 for 2,000 hours of cycling at a 60 rpm cadence.
This again exceeds the PDS target of 2.
Evaluation of the frames’ compliance to the weight requirement of the PDS was
completed by weighing the welded frame on a scale. The as built rolling frame weighs in
at 32.4 lbs, which is slightly above the PDS requirement which states that it must we
less than 30 lbs.
12

Figure 5.9: Results of FEA showing the areas with highest stress and lowest safety factor
[5.3] Mechanical Integration
[5.3.1] Overview
The vehicle mechanical integration encompasses the seat and the seat adjustment
, and vehicle controls. The design
n include the major design specifications as defined in section 3, as
well as
mechanism, the steering system, the braking system
goals of this sectio
user interface ergonomics, and adjustability. The design methodology for
meeting these criteria, as well as appropriate evaluations are presented here.
[5.3.2] Seat and Seat Adjustability
Rider support is handled by a carbon composite seat which was hand shaped
according to the requirements of the race team. Integrated into the seat base is a steel
lded to the main tube of the frame. The bracket was
TIG welded for strength and punched with a series of holes to reduce weight (see figure
a
bracket which rides on two rails we
5.10). This allows the seat to slide forward to a minimum X-seam of 38in and back to
maximum of 45in.
[5.3.3] Steering and Maneuverability
Steering angles were developed using force balance techniques for each planar
angle: camber, caster and toe. Each steering angle has an advantage and a disadvantage,
the advantages with the disadvantages. We
achieve ch
the design process involved balancing
d this by balancing forces and moments applied to each wheel at its’ contact pat
(see Appendix 8.6.6).
13

Figure 5.10: Seat bracket before integration into seat back.
Camber angles w a variety of
cornering speeds and setting the camber angle such that the resultant cornering force
would
ith
n
ere set by optimizing the resultant force vector for
cross the centroid of the wheel, thereby reducing the thrust loads on the bearings
and bending moment in the steerer tubes. These camber angles were then balanced w
the needed turning radius to achieve a resulting camber angle of 3 degrees from vertical.
Determining the caster angles involved balancing the wheel restoring force, steerer tube
bending moment and turning radius by summing forces. This resulted in a 15 degree
caster angle. We also determined the optimal toe angle theoretically, and confirmed it
empirically to be 1degree in. Centerpoint steering was used to reduce wheel scrubbing
by forcing the contact patch to remain stationary during rotation of the wheel, rather tha
traveling in an arc. This is achieved by bringing the contact patch in line with the
steering axis as shown in figure 5.11.
[5.3.4] Braking
We selected left and right front Avid Ball-Bearing 5® mechanical disc brakes for
ment capability and excellent stopping power. Braking analysis was
comple
their quick adjust
ted by calculating the stopping distance limited by interfacial friction. A second
analysis was also performed to determine the forward tipping tendency during
deceleration using a sum of moments. The stopping distance was found to be limited by
14

Figure 5.11: Illustration of intersection of steering axis with contact patch
the interfacial friction and not the tipping potential with a value of 8 ft from 15 mph,
which meets the PDS requirem
ents (see Appendix 8.6.5 for details).
[5.3.5] Vehicle Controls
A direct under seat steering interface design was selected as being the lightest,
simplest and most adaptable method of steering the trike. Design of the interface was
by rider, frame, seat, and fairing dimensions. Using an under
seat ste
le.
geometrically constrained
ering method allows for riders to quickly enter and exit the vehicle, sweep the
handle bars under the seat, and maintain a comfortable and ergonomic position while
racing. SRAM Rocket-Shorty twist shifters and brake levers placed at the handle bar
position allowed racers to easily access the controls at all times while riding the vehic
[5.3.6] Mechanical Integration Evaluations
The PDS requirements for vehicle turning radius, stopping distance, and stability
were all set by the minimum requirements of the ASME competition rules (see Appendix
were conducted by ASME judges during
the veh
t
be able to fit in the vehicle and reach the vehicle controls with the seat adjusted for their
8.3). Official evaluation of these requirements
icle safety inspection conducted before competition. The inspection confirmed
that the vehicle met and exceeded all of these requirements (see table 5.1 for details).
Requirements for the seat and adjustment system state that all team members mus
15

X-seam. Adherence to this article of the PDS was tested by having each rider move the
seat into their riding position to ensure that it was comfortable for them. This test
confirmed that the six inches of seat adjustment matches the six inch range of rider X-
seams.
[5.4] Drive-Train
[5.4.1] Overview
The drive-train consists of the mechanical components used to transfer rider
ower out-put from the pedals to the road surface. A standard bicycle chain drive system
itial research showing the efficiencies of such systems to be up to
94% for shaft drive and 95% for belt drives [Ref. Burrows]. Due to the
amount ave
to
p
was selected after in
98% compared to
of research and development companies such as Shimano and Campagnolo h
conducted in this area of vehicle and design, as well as the economies of scale associated
with their mass production facilities, it was deemed both impractical and uneconomical
develop custom components. Therefore, this area of vehicle design involved the
selection of off-the-shelf components from various manufactures. The main PDS
requirements governing component selection were weight, cost, and durability.
Appropriate selections were made as described below.
[5.4.2] Component Selection
After reviewing technical specifications and costs from various manufactu
team decided that Shimano components were both the m
res, our
ost economical and available of
the com eting brands. Furthermore, personal experience has shown that all Shimano
s well as higher cost components when new, with
ade
p
components function equally a
increases in cost affecting the long-term durability only. With the relatively short period
of time the vehicle was to be in service, component selection was based solely on the cost
and weight of each piece. Further cost incentives for a number of components were m
available by team sponsors The Bike Gallery, and Chris King. Through these
sponsorships a number of components were made available at discounted or no cost, and
when the available components met the functionality and weight requirements as
described above, they were selected for use.
16

Due to the unique design of the vehicle, a number of components were
ordered from manufacturers. One such item is an under-under chain idler system from
team sponsor Terracycle (see figure 5.12). While the industry standard idler consi
stationary piece of polyethylene which the ch
specially
sts of a
ain runs over causing large amounts of
h
friction, the Terracycle unit uses a geared idler which rotates with the chain on sealed
bearings. This system increases the efficiency of the drive-train and the service life.
Custom cantilevered disk brake hubs were also ordered from team sponsor Phil Wood &
Co. The use of cantilevered front hubs allows for single sided steering knuckles whic
significantly reduces the weight of the vehicle. A summary of the components selected
for the vehicle is presented in Table 5.2.
Figure 5.12. Terracycle geared idler selected to improve drivetrain efficiency [Courtesy Robert Johnson]
Component Model Quantity Cost ea.
Rear Derailleur Shimano 105 1 $0.00
Bottom Bracket Shimano 105 Octalink 1 $0.00
Cranks Shimano Dura Ace 1 $0.00
Chain Shimano Dura Ace 3 $28.99
Pedals Shimano SPD 1 (set) $0.00
Cassette Shimano Ultegra 1 $0.00
Rear Wheel/Hub gra 0 Mavic/Shimano Ulte 1 $190.0
Front Wheel/Hub Mavic/Phil Wood 2 $220.00Ta of drive-train comp
ble 5.2: Summary onents
17

[5.5] Safety Systems
[5.5.1] Overview
Customer requireme rules mandate a number
systems be designed for ety requirements are
etailed in the PDS and table 5.1, the three most important components are detailed here.
nts and competition of safety
the vehicle. While an inclusive list of saf
d
[5.5.2] Roll-bar
Competition rules require all vehicles to have a roll-bar equivalent in streng
1.5in OD 4130 chrome-moly tubing with a 0.049in wall thickness. Our design fulfills
this requirement with the 6061-T6 roll-bar design. In addition to fulfilling the minimum
th to
strength requirement, the aluminum design is 2.1lbs lighter and 12% stronger than a
oly design (see Appendix 8.6.2 for details). similar chrome-m
[5.5.3] Rider Restraint
Competition rules state that all vehicles must have a rider restraint system including both
lap and shoulder restraints. This requirement is met using a four-point automotive ra
harness from Andover automotive. The selected harness is de
cing
signed for quick length
adjustm nts and a single lever action buckle to speed rider exchanges. The purchased
uce weight by converting the bolt on shoulder straps to a loop on
e
unit was modified to red
system. The lap belts are attached to the frame using a grade eight automotive fastener.
[5.5.4] Visibility
Seeing clearly was a major concern of the race team, so we paid attention to
providing ample forward and peripheral visibility. To view all areas of the racecourse a
four window system covers the full range of forward and side visibility. The combined
window system creates a total of 184 degrees of horizontal view and 80 degrees of
figure 5.13). Windows were constructed of 1/32in polycarbonate for
ef.
vertical view (see
its’ excellent optical properties, low weight, and impact strength 250x that of glass [R
Matweb].
18

Figure 5.13: Plan View of vehicle showing distribution of horizontal view.
[5.5.5] Safety Systems Evaluation
The c tisfactory by
the judges during the safety inspection. The function of each system was evaluated
ces in which no riders were injured.
ompliance of the safety systems were evaluated and deemed sa
during multiple competition inciden
[6] Future Design Considerations After testing the prototype in competition the design team concluded that several
design modifications would improve performance. The weight of the frame could be
aterial such as aluminum. The length of pit
dow.
reduced by constructing it using a lighter m
stops could be shortened by designing a new hatch system with a hinge and two simple
latches which could be operated from inside the vehicle. Vehicle stability could be
increased by implementing a headset integrated steering damper to reduce road force
inputs to the rider interface. Finally, wet weather visibility would be improved by
implementing an exterior wiping system and interior resistance heater to the top win
Though the vehicle performs well as designed, these minor modifications would make
the vehicle even more competitive.
19

[7] Conclusion Constructing and testing the prototype has verified many aspects of our design
and shown a few areas for improvement. Of the 26 PDS targets presented in Table 5.1,
23 of them were met or exceeded. By reusing the same fairing molds and constructing a
new light weight frame it is believed that these speed, cost, and weight targets may be
simultaneously met. The vehicle functioned well throughout competition and was able to
obtain a third place finish in the 2006 ASME West Coast competition. More importantly,
the prototype will provide a dynamic laboratory in which data can be collected and new
ideas tested. While not perfect, the 2006 PSU VikeTrike proved to be very competitive
with all other vehicles currently in production.
20

21
[8] Appendices Appendix [8.1] : Summary of 2005 ASME West Coast Results The 2005 ASME West Coast Challenge was held in Fresno, California in April. The following is a summary of the sprint and endurance results printed from www.asme.org/hpv.

22
Appendix [8.2]: Product Design Specifications Scope
This Product Design Specification (PDS) clearly defines the following for the
PSU-HPV:
• The design constraints (metrics and targets)
• The priority of constraints
Customer Identification
External Customers Internal Customers Racing Team, ASME Judges The Race Support Crew ASME Student Section, The Fabrication Crew MME Department, Sponsors The primary customer of the HPV Project is the 2006 Race Team, whose
members are the End Users of the product. The ASME Judges are also considered a
primary external customer, as it is their judgment of the design’s compliance,
performance, and safety that determines the vehicle’s ranking at the competition.
The ASME Student Section benefits from any and all progress which this year’s
team makes towards establishing an HPV team here at Portland State. This year’s
completed product will serve as a foundation for future teams to work from, and the
knowledge gained will provide future design teams a valuable resource from which to
draw. The Department of Mechanical Engineering benefits from the prestige and
positive public relations of fielding a competitive team.
The Fabrication and Race Support Crews are also key internal customers. The
Fabrication Crew has customer needs that include consideration of labor time and effort,
as well as availability of technology required. The Race Support Crew has needs that
pertain to the service and operation of the vehicle during competition.
Customer Feedback Customer feedback for this project comes primarily from discussions with the
PSU-HPV Race Team, as well as consultations with industry experts.

23
Product Design Specifications High Priority
Criterion Performance Requirement Vehicle must be light Primary Customer PSU-HPV 2006 Race Team Metrics & Targets Metric Target Frame weight lbs <= 30 Fairing weight lbs <= 20 Target Basis Power Availability, vehicle weight of 2005 competition winners Verification Method Measurement with scale
Criterion Performance Requirement Aerodynamic efficiency in forward motion Primary Customer PSU-HPV 2006 Race Team Metrics & Targets Metric Target Power to overcome aero drag hp <= .5 Target Basis Theoretical Research of available power [ref. Wilson pg. 44] Verification Method Determination of Drag Coefficient using CFD
Criterion Cost Requirement Must be affordable to produce Primary Customer PSU-HPV 2006 Race Team Metrics & Targets Metric Target Total Fabrication Cost $ < 5000 Target Basis Total Available Funds Verification Method Measurement, Documentation
Criterion Compliance Requirement Must be legal to enter into competition Primary Customer PSU-HPV 2006 Race Team Metrics & Targets Metric Target Turning radius Feet <= 25 Stopping distance Mph, Feet From a speed of 15 mph to 0
mph in 20 feet or less Straight line stability Degrees per foot 0°/100’ Vehicle identification Yes/No Vehicle must be properly
labeled **also see safety criteria Target Basis 2006 Published Rules (See Appendix 8.3) Verification Method Direct Comparison to rule book, judging at competition.

24
Medium Priority
Criterion Documentation Requirement ASME/ Senior Capstone Papers Primary Customer PSU-HPV 2006 Race Team Metrics & Targets Metric Target Documentation of engineering
process Target Basis ME 492/3 Course requirements Verification Method Measurement
Criterion Safety Requirement Rider Safety Primary Customer PSU-HPV Race Team Metrics & Targets Metric Target Safe Operating Conditions Yes/No Free of sharp edges and pinch
points Roll-over protection Yes/No Rider must not touch the
ground in case of roll-over Rider Restraint Yes/No Harness system must hold rider
in vehicle during collision Visibility* Degrees of horizontal and
vertical view Horizontal >90 degrees
Vertical >50 degrees Target Basis Competition Rules, *Survey of rider preferences Verification Method Inspection, Measurement
Criterion Performance Requirement Velocity Primary Customer PSU-HPV 2006 Race Team Metrics & Targets Metric Target Exceed top speed of last year’s winner
Miles per hour > 45
Exceed average speed of last years endurance winner
Miles per hour > 20
Target Basis 2005 Race Results Verification Method Measurement by time trial
Criterion Life in Service Requirement Needs to last through testing, training, competition Primary Customer PSU-HPV 2006 Race Team, Future PSU-HPV Race Teams Metrics & Targets Metric Target End of service date April 30, 2006 Target Basis Budget constraint, purpose of this HPV Verification Method Performance at competition, post race inspection

25
Criterion Aesthetics Requirement Visual Appeal Primary Customer PSU-HPV 2006 Race Team, PSU-HPV Sponsors Metrics & Targets Metric Target Fairing Appearance Unquantifiable – Subject to
judges interpretation Clean lines, Smooth surface of
uniform school colors Frame Appearance Unquantifiable – Subject to
judges interpretation Frame to be powder coated
Target Basis Competition research Verification Method Competition results Low Priority Criterion Documentation Requirement Beginning of a legacy project Primary Customer PSU-HPV 2006 Race Team, Future PSU-HPV Race Teams Metrics & Targets Metric Target Level of documentation Yes/No Documentation of engineering
process for future PSU-HPV Teams
Target Basis Increase PSU MME programs awareness Verification Method Response from 2007 team
Criterion Materials Requirement Adequate Strength against failure Primary Customer PSU-HPV Race Team Metrics & Targets Metric Target Static safety factors Safety Factor (Sy/σy) >=5 Fatigue safety factor SF for 2,000 hours at 60rpm >= 2 Target Basis Industry standard, Engineering Analysis Verification Method Deflection and Strain Testing
Criterion Performance Requirement Stability Primary Customer PSU-HPV 2006 Race Team Metrics & Targets Metric Target Vehicle does not flip under normal turning conditions
Mph / ft radius 10 / 20
Target Basis Performance of 2005 competitors Verification Method Empirical Analysis, Vehicle Testing

26
Criterion Maintenance Requirement Minimal maintenance Primary Customer PSU-HPV 2006 Race Team Metrics & Targets Metric Target Before competition Hours < 1 During competition Minutes 0 Target Basis Comparison to racing vehicles, goals set as ideal Verification Method Measurement
Criterion Rider Comfort Requirement Rider ergonomics Primary Customer PSU-HPV 2006 Race Team Metrics & Targets Metric Target Minimum width of shoulder box Inches >= 20 Maximum x-seam adjustability Inches >= 45 Minimum x-seam adjustability Inches <= 39 Cockpit temperature ˚F above atmospheric <= 10˚ Target Basis Race team measurements Verification Method Measurement
Criterion Performance Requirement Rider exchange time Primary Customer PSU-HPV 2006 Race Team Metrics & Targets Metric Target Time to enter and exit seconds <= 10 Target Basis Research in competitors designs Verification Method Measurement

27
Appendix [8.3]: Summary of 2006 ASME Competition Rules Printed from: http://www.asme.org/hpv/summaryofrules.html Complete rules are available at: http://files.asme.org/asmeorg/Events/Contests/HPV/4781.pdf
Sponsored by the American Society of Mechanical Engineers
ASME sponsors the Human Powered Vehicle Competition in hopes of finding a design that can be used for everyday activities ranging from commuting to and from work to going to the grocery store. Senior engineering students can use this competition for their capstone project and with their efforts design and construct a fast, sleek, and safe vehicle capable of road use.
The competition includes three classes of vehicles.
• Single Rider - operated and powered by a single individual • Multi-rider - operated and powered by two or more individuals • Utility - vehicle designed for every-day transportation for such activities as commuting to
work or school, shopping trips, and general transportation
Single Rider and Multi-rider vehicles will participate in three events: Design, Sprint, and Endurance. Utility vehicles will participate in two events: Design and Utility Endurance.
Fairing All vehicles in all classes of competition are required to have a full or partial aerodynamic fairing. This fairing must cover 1/3 of the frontal area of the vehicle and be built such that it clearly shows the provided number assigned to the vehicle and ASME logo. The number and logo must be displayed on every fairing in front of the rider and must be visible from both sides of the vehicle.
Safety All vehicles and teams in all classes must abide by all the safety requirements.
1. Make a complete stop in a distance of 20 feet or less from a speed of 15 miles per hour 2. Travel is a straight line for 100 feet 3. Negotiate a turn within a 25-foot radius 4. Provide rollover protection for riders and stokers, equivalent to chrome-molybdenum steel tubing with an outer diameter of 1.5 inches and a wall thickness of no less than 0.049 inches 5. Wear helmets that meet given standards 6. Wear seat belts or shoulder harnesses, in accordance to the rulebook 7. Show that all surfaces of the vehicle, both exterior and interior region of the rider(s), are free from sharp edges and protrusions
Vehicles found unsafe during inspection or anytime of the competition will be removed from the competition until the problem has been resolved.

28
Energy Storage The use of energy storage devices by non-utility vehicles is prohibited. Normal operating components involved in the drive train are specifically permitted in as much as their design is not primarily influenced by energy storage considerations. Utility vehicles will be allowed to store regenerative energy. Prior to every event, they must show that their energy-storing device has no initial energy stored. All of the energy stored by the device must be a result of the vehicle being in motion.
Design The design event will include vehicles from all three classes. Judges will consider both the formal written report and the oral presentation when reviewing vehicle designs. There will be an emphasis on originality and the soundness of the design. The focus will be the new work that has been completed in the last year.
Sprint The Sprint event will include Single Rider and Multi-rider vehicles. Approximately four hours of competition will be ran on a single track such that everyone will be capable of obtaining a sprint time. The timed portion of the course is a 100 meter straight a way. There will be a preceding distance of 300 to 400 meters for vehicles to gain speed before entering the timed portion, as well as a minimum of 200 meters at the end for the vehicles to slow down.
Endurance The Endurance event will involve all three categories. Single Rider and Multi-rider vehicles will compete in grand prix style road races of approximately 65 kilometers (40 miles). Vehicles must start the event with female rider(s) who must complete at least 5 kilometers. No individual can compete in the vehicle for more than 20 kilometers, and all laps by any individual must be consecutive. When the lead vehicle crosses the finish line, each team will be allowed to finish the lap it is on to end the competition.
The Utility Endurance event includes Utility vehicles only. The course will be a distance of approximately 10 kilometers and will include obstacles such as a driveway entry ramp, speed bumps, stop signs, and "head in" parking. Along with these obstacles, the rider will be required to dismount his/her vehicle to pick up parcels or packages (29.2 cm x 17.2 cm x 39.3 cm) as well as drop them off. The event is over when all vehicles have completed the course.
The specifications for each event, including the mandatory use of female riders, can be found in the rulebook. How the scores are tallied for each event and vehicle can also be found there. Forms for registration, certifications, and eligibility, along with others are all included in the appendix of the rulebook. To avoid disqualification competing teams are strongly encouraged to become familiar with all the rules and regulations.

29
Appendix [8.4]: Internal and External Search Summaries Internal Search
The internal search process consisted of two months of weekly brainstorming
sessions during which design concepts were generated and refined. Presented here is an
example of the alternative designs generated for the top level decisions of rider position,
fairing type, and wheel configuration.
A delta trike option using rear wheel steering is shown in figure 8.4.1. With a
single front and dual rear wheels, long wheel base delta trikes have increased high speed
stability but are at a significant disadvantage when cornering. This front wheel drive
concept also has increased drive-train efficiency due to its’ short chain path but reduced
aerodynamic efficiency due to its’ maximum width occurring at the tail end.
With a more conventional rider position figure 8.4.2 shows a forward leaning
upright concept. Using only a small front fairing and rear tail-box the design has the
potential to be very lightweight and attractive to riders already comfortable with standard
bicycles. Much of the efficiency of this design is lost however, with the integration of the
required roll-bar and harness system.
Using radical rider positioning for increased road visibility, the prone design
concept of figure 8.4.3 was proposed for its potential to be both efficient and simple.
With the rider’s hands positioned at the front wheel and feet around the rear wheel, this
concept has the potential to use direct drive and steering systems. It was ultimately
rejected due to stability concerns and the required rider support system placing pressure
on the chest and restricting breathing.
Figure 8.4.1. Recumbent Delta trike concept Figure 8.4.2. Upright partially faired concept

30
Chosen as the final design concept, figure 8.4.4 shows a delta trike which places
the rider in a recumbent position. With two wheels in front and a single in the rear,
vehicle stability while cornering is improved over the alternative delta design. The dual
front wheel system is also conducive to aerodynamic design. While not as stable at high
speeds as a delta design, proper steering geometry and rider experience is likely to make
up for this disadvantage.
External Search
As part of the pre-design brainstorming process, the design team conducted an
external search of existing HPVs and similar applicable technologies. Each member
heavily researched technologies in specific components of the project, as well HPVs as a
whole. By conducting a comprehensive search we were able to identify the successful
components of existing designs, as well as possible niches in the market where other
designs have failed to succeed. In order to ensure that our search encompassed all
available technologies, including those outside of the ASME HPV competition, the
design team also researched production bike models and HPVs built by the international
HPV racing community. By including theses three sectors of the market and surveying
all available aspects of the designs, it is believed that we were able to successfully build
Figure 8.4.3 Two wheeled prone concept Figure 8.4.4. Tadpole trike concept used in design

31
off of, and excel past, the performance of existing vehicles. Included below is a sample
of the top vehicles of each of the three categories surveyed.
2005 ASME West Coast Competition
Champions of the ASME West Coast Challenge three years running, Cal-Poly’s
vehicles are highly refined through years of trial an error. Figure 8.4.5 shows their 2005
entry which features a light and strong chassis via a carbon fiber monocoque frame
integrated into its’ full aerodynamic shell. Additional unique features include a front
wheel drive system using an internally geared front hub and a chain path which requires
the chain to flex during turning.
Figure 8.4.5: Cal-Poly, three year ASME West Coast Champion. Second place at the 2005 west coast competition and multiyear champions of the
east coast competitions, the University of Missouri at Rolla 2005 entry is shown in figure
8.4.6. Using carbon fiber wheel disks to complement the full fairing, this vehicle’s focus
on aerodynamic design led it to first and second place finishes in the 2005 east and west
coast competitions respectively. Also note that the top of the fairing is removable to
preserve rider comfort during hot conditions.
The 2005 west coast endurance event was won by a trike produced by Chico State
(see figure 8.4.7). With a vehicle weight of 52lbs and an average speed during the
endurance event of 22mph, this vehicle appeared to excel due its ability to hold speed
through corners. Their excellent visibility also seemed to add to rider confidence.

32
Figure 8.4.6: UM Rolla, second place overall in 2005 ASME west coast comp.
Figure 8.4.7: Chico states’ 2005 West Coast entry, The MochaChico
International Racers
Developed and raced in Australia, the TriSled (see figure 8.4.8) is a tadpole trike
built specifically for racing. With a combination fiberglass and fabric fairing, this
vehicles’ aerodynamic efficiency is likely improvable by adding wheel disks and a hard
top fairing. Of note is the unique fairing attachment system which uses a system of
chrome-moly hoops to produce a rigid attachment and reduce fairing vibration. Holder of
multiple world records including the top speed record, the Varna shown in figure 8.4.9 is
the current bench mark in HPV speed design. With a weight over 80lbs this design
places top priority on stiffness and aerodynamics. Power is transferred

33
Figure 8.4.8: The TriSled, and Australia tadpole trike [Ref. www.recumbents.com]
through a front wheel drive system attached to a steel frame. Lack of adjustability to
rider geometry is a significant drawback to this design.
Production Models:
A highly refined model, the Go-One shown in figure 8.4.10 was developed with
commuting in mind. With a sealed cabin, cargo storage, and blikers, this vehicle is the
current standard in velomobiles. An integrated tub-frame adds to the stiffness and light
weight of this vehicle.
The aluminum space frame of the Catrike Road shown in figure 8.4.11 adjusts to
multiple rider sizes with an adjustable boom to extend the x-seam. Three 20in wheels
produce a compact package and center point steering with Ackerman compensation
produce a stable rider platform.
Figure 8.4.9: The Varna, current world record holder for speed [Ref: Varnahandcycles.com].

34
Figure 8.4.10: The Go-One sets the current standard for velomobiles [ref: www.recumbents.com]
Figure 8.4.11: The Catrike Road uses an adjustable boom.

35
Appendix [8.5]: Concept Scoring Matrix Following is the concept scoring matrix used in evaluation and comparison of various
design alternatives. Those options receiving the highest scores were selected for use in
the 2006 PSU HPV and are highlighted below in yellow.
Scoring System:
5: amazing 4: good 3: average 2: poor 1: terrible 0: not applicable Complia
nce
Weight
Aerody
namic
Benefit
CostEas
e of Fab
ricati
on
Low C
.O.G
.
Comfort
Power O
utput/
Effic
iency
Stability
Ease of O
perat
ion
Total S
core
Subsystem Priority: 0.2 0.18 0.175 0.15 0.15 0.1 0.05 0.05 0.1 0.05Number of Riders 0
single 5 5 4 4 4 3 0 3 4 4 4.825tandem 5 2 2 2 3 3 0 4 3 3 3.4
Frame Material 0Aluminum 3 4 0 3 3 0 0 3 0 0 2.35Steel 4 3 0 5 4 0 0 4 0 0 2.875Titanium 4 5 0 2 2 0 0 4 0 0 2.475Composite 3 5 0 2 2 0 0 3 0 0 2.225
Fairing Material 0Carbon Fiber 3 4 4 3 2 0 3 4 3 3 3.55Fiberglass 3 3 3 3 3 0 3 3 3 3 3.3Corrugated Plastic 3 3 3 3 2 0 3 3 3 3 3.15Frame and Fabri 3 4 3 3 3 0 4 2 3 3 3.475
Drive wheel 0Rear-Wheel 3 3 3 4 4 3 4 3 0 3 3.65Front-Wheel 3 3 3 3 3 3 3 4 0 3 3.35
Drivetrain 0Chain 3 4 4 4 5 3 0 5 0 5 4.15Belt 3 3 3 2 2 3 0 4 0 4 2.95Shaft 3 2 4 2 2 4 0 3 0 3 2.95Direct 3 4 3 2 3 2 0 3 0 2 3.025
Roll Bar 0None 1 5 0 5 5 0 0 0 0 0 2.575CrMo 5 3 0 5 5 3 0 0 0 0 3.325Composite 4 5 0 4 3 4 0 0 0 0 3.125Aluminum 3 4 0 3 3 3 0 0 0 0 2.5

36
Appendix [8.6]: Analysis Based Decision Examples Index of Solutions: Section Solution Page 8.6.1 Percent Fairing Coverage 37 8.6.2 Roll Bar material Selection 41 8.6.3 Tie-Rod optimization 45 8.6.4 Roll-Over Velocity 50 8.6.5 Minimum Stopping Distance 54 8.6.6 Comparison of Steering Angles 57

37
[8.6.1] Percent Fairing Coverage Analysis Summary
The objective of this analysis is to determine the optimum fairing coverage for the
2006 PSU HPV. The competition rules state that a minimum of 33% frontal area
coverage be used (see figure 8.6.1 for an example), but no maximum allowable is set.
While it is known that aerodynamic efficiency increases with increased fairing coverage
[Ref. Wilson pg. 188], rolling resistance also increases with fairing coverage due to the
increased weight.
Upon analyzing the relationship between the two drag forces by comparing two
vehicle models with known properties, it is determined that the increased weight of the
fairing pays off in overall efficiency at all velocities over 35 mph. It is therefore
suggested that for a target velocity of 45mph a full fairing should be used (see figure
8.6.2 for an example).
Figure 8.6.1: Example of vehicle with partial fairing coverage [Courtesy Don Mueller]
Figure 8.6.2: Example of vehicle with full fairing coverage [Ref: www.recumbents.com]

38
Given:
A vehicle fairing is to be designed to cover the PSU HPV. A minimum coverage of 1/3
of the frontal area is set by the competition. The team may however, increase the size of
the fairing to complete coverage is desired. The following data is given by Wilson for
vehicles with 1/3 coverage and full coverage.
Coverage Frontal Area (m2) Vehicle Weight (kg) Cd,fa Cr
1/3 0.40 85 0.52 0.00435
Full 0.42 105 0.11 0.00435
Find: -The percentage of power used to overcome aerodynamic drag for each
configuration at 45mph.
-The difference in power requirement for each vehicle at 45mph.
-Based on these results, recommend a percentage coverage for use on the PSU
HPV.
Assumptions:
-The density of air is 1.225 kg/m3 (see appendix 8.7)
Solution:
-The force produced by aerodynamic drag, as stated by Wilson, is given by:
)21)(( 2VACAeroDrag d ρ= equation 1
-Where Cd is the drag coefficient, A is the appropriate area, ρ is the fluid density,
and V is the velocity of the fluid relative to the vehicle. Similarly the force
produced by rolling resistance is given by Wilson as:
( ) )()110*6.63
51 WV
mphnCgRollingDra rr ⎥
⎦
⎤⎢⎣
⎡⎟⎟⎠
⎞⎜⎜⎝
⎛⎟⎠⎞
⎜⎝⎛+= − equation 2
-Where Crr1 is the zero speed rolling resistance coefficient, n is the number of
wheels, and W is the vehicle weight. Multiplying these equations for drag force
by the vehicle velocity we obtain expressions for the power required to overcome
each component.

39
)21)((Re 3VACquiredAeroPower d ρ= equation 3
( ) ))((110*6.61Re 5 VWVmphn
CquirederRollingPow rr ⎥⎦
⎤⎢⎣
⎡⎟⎟⎠
⎞⎜⎜⎝
⎛⎟⎠⎞
⎜⎝⎛+= − equation 4
-The given values may be plugged into equations 3 and 4 above, with units
converted properly, and solved for a variety of velocities. This was done using
spreadsheet software and is presented in figures 8.6.3 and 8.6.4 below.
1/3 faired Drag Coef. 0.52 Frontal area (m2) 0.4 weight (N) 833 CR* 0.00435 Density (kg/m3) 1.225
Velocity
(mph) (m/s) Aero drag (N) Rolling drag (N) Total Drag (N)Percent Aero Drag Total Drag (W)
4.5 2 0.5 3.8 4.3 11.9 8.5948.9 4 2.0 4.0 6.0 34.0 23.959
13.4 6 4.6 4.1 8.7 52.7 52.21117.9 8 8.2 4.3 12.4 65.6 99.46322.4 10 12.7 4.4 17.2 74.1 171.83226.8 12 18.3 4.6 23.0 79.9 275.43331.3 14 25.0 4.8 29.7 84.0 416.38135.8 16 32.6 4.9 37.5 86.9 600.79140.3 18 41.3 5.1 46.4 89.0 834.77844.7 20 51.0 5.3 56.2 90.6 1124.45849.2 22 61.7 5.4 67.1 91.9 1475.94553.7 24 73.4 5.6 79.0 92.9 1895.35658.2 26 86.1 5.8 91.9 93.7 2388.80562.6 28 99.9 5.9 105.8 94.4 2962.406
Figure 8.6.3. Rolling and aerodynamic drag calculations for a 1/3 faired vehicle

40
Fully faired* Drag Coef. 0.11 Frontal area (m2) 0.42 weight (N) 1029 CR* 0.00435 Density (kg/m3) 1.225
Velocity
(mph) (m/s) Aero drag (N) Rolling drag (N) Total Drag (N)Percent Aero Drag Total Drag (W)
4.5 2 0.1 3.8 3.9 2.9 7.8628.9 4 0.5 4.0 4.4 10.2 17.756
13.4 6 1.0 4.3 5.3 19.3 31.65817.9 8 1.8 4.6 6.4 28.1 51.54522.4 10 2.8 5.1 7.9 35.6 79.39626.8 12 4.1 5.7 9.8 41.7 117.18731.3 14 5.5 6.4 11.9 46.5 166.89535.8 16 7.2 7.2 14.4 50.3 230.49740.3 18 9.2 8.1 17.2 53.2 309.97144.7 20 11.3 9.0 20.4 55.6 407.29449.2 22 13.7 10.1 23.8 57.5 524.44353.7 24 16.3 11.3 27.6 59.0 663.39458.2 26 19.1 12.6 31.8 60.2 826.12662.6 28 22.2 14.1 36.2 61.2 1014.616
Figure 8.6.4. Rolling and aerodynamic drag calculations for a fully faired vehicle Percent aerodynamic drag at 45mph for full fairing = 55.6% Percent aerodynamic drag at 45mph for 1/3 fairing = 90.6% Total drag for full fairing at 45mph = 407.3 W Total drag for 1/3 fairing at 45mph = 1124.5 W Reduction in power requirement using a full fairing = 717.2 W
Conclusion:
The performance of the PSU HPV would be greatly improved by the use of a full
fairing as the reduction in aerodynamic drag more than offsets the increase in rolling
resistance.
41
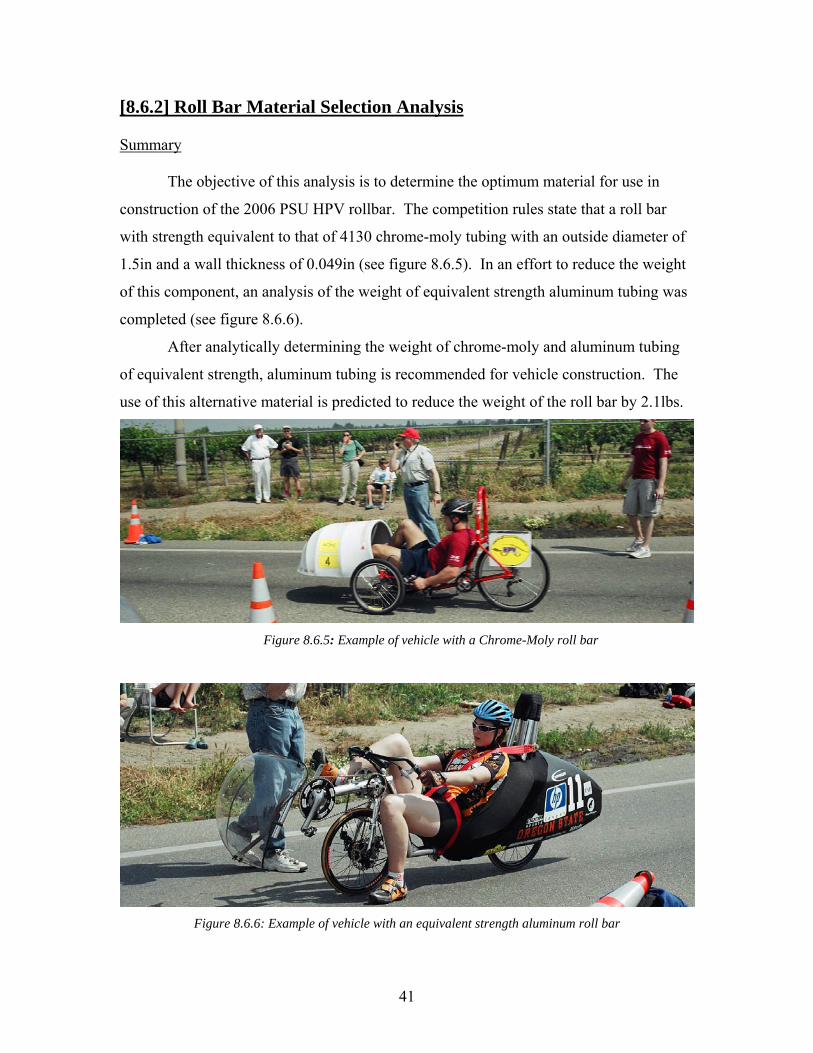
[8.6.2] Roll Bar Material Selection Analysis Summary
The objective of this analysis is to determine the optimum material for use in
construction of the 2006 PSU HPV rollbar. The competition rules state that a roll bar
with strength equivalent to that of 4130 chrome-moly tubing with an outside diameter of
1.5in and a wall thickness of 0.049in (see figure 8.6.5). In an effort to reduce the weight
of this component, an analysis of the weight of equivalent strength aluminum tubing was
completed (see figure 8.6.6).
After analytically determining the weight of chrome-moly and aluminum tubing
of equivalent strength, aluminum tubing is recommended for vehicle construction. The
use of this alternative material is predicted to reduce the weight of the roll bar by 2.1lbs.
Figure 8.6.5: Example of vehicle with a Chrome-Moly roll bar
Figure 8.6.6: Example of vehicle with an equivalent strength aluminum roll bar

42
Given:
Material for the roll-bar of the 2006 PSU HPV is to be sized. Competition rules require
a minimum material strength equivalent to that of 4130 chrome-moly tubing having an
outside diameter of 1.5in and a wall thickness of 0.049in. The current roll-bar design
requires a total of 84in of tubing with multiple mitered and welded joints. Current
material options include: 4130 chrome-moly, 6061-T6 Aluminum, and 6061-T6
Aluminum with post weld heat treating.
Find: -Determine the weight of each option and make a recommendation for material
selection.
Assumptions:
-The primary loading mode is bending.
Solution:
-The material properties of the various options, as are [Ref. AlcoTechnics]:
Material Density
(lb/in3)
Yield
Strength (ksi)
Tensile
Strength (ksi)
4130 0.283 60.5 95
6061-T6 0.0975 19 30
6061-T6
W/PWHT
0.0975 40 45
-Using these material properties, the failure load of the chrome-moly must first be
determined. For strength comparisons, the simple three point bending model will
be used as shown in figure 8.6.7.

43
Figure 8.6.7: Three point bend schematic.
-For the three point bend, the maximum stress is calculated using beam theory as
given in equation 1.
IMy
bending =max,σ (Ref. Gere) equation 1
-Where the maximum moment is given by:
422maxPLLPM =⎟
⎠⎞
⎜⎝⎛
⎟⎠⎞
⎜⎝⎛= (Ref. Gere) equation 2
- Then for a cylindrical tube we can calculate the geometrical properties of the
chrome-moly using:
)( 22
io rrA −= π equation 3
)(64
44ioyx ddII −==
π (Ref Gere) equation 4
- And combining equations 1 and 2 we find the magnitude of the maximum stress
in the three point bend test to be:
IPLy
IMy
bending 4max, ==σ equation 5
-Substituting the geometrical and material properties for the chrome-moly into
equation 5 and solving for the loads at which yielding and failure occurs:
Pmax,yielding = 1584lbs Pmax,failure = 2484lbs
L
P L/2

44
-Plugging these values for the maximum yielding and failure loads back into
equation 5, along with the material properties of each of the two aluminum
options, the minimum moments of inertia required to avoid failure of each
material may be determined. These moments of inertia may then be converted to
required wall thicknesses based on commonly available outside tube diameters.
This process was completed using spreadsheet software and the results are
presented in figures 8.6.8 and 8.6.9.
AL as welded OD (in) Req ID (in) Wall (in) ID (in) Wall (in) Weight (lbf)
UTS (psi) 30000 1.5 1.06 0.22 1 0.25 8.0405137Density (lbf/in3) 0.0975 1.625 1.30 0.16 na na na Load (lbf) 2484.8 1.75 1.49 0.13 1.25 0.25 9.6486164YS (psi) 19000 2 1.82 0.09 1.75 0.125 6.0303853 2.25 2.11 0.07 2 0.125 6.8344366 2.5 2.39 0.05 2.37 0.065 4.0723594 2.75 2.66 0.04 2.62 0.065 4.4904661 3 2.93 0.04 2.87 0.065 4.9085728
Figure 8.6.8: Acceptable options for aluminum tubing in the as welded condition.
AL after HT UTS (psi) 45000 OD (in) Req ID (in) wall (in) ID (in) Wall (in) Weight (lbf)Density (lbf/in3) 0.0975 1.5 1.26 0.12 1.25 0.125 4.4222825Load (lbf) 2484.8 1.625 1.43 0.10 1.375 0.125 4.8243082YS (psi) 40000 1.75 1.59 0.08 1.5 0.125 5.2263339 2 1.88 0.06 1.87 0.065 3.236146 2.25 2.16 0.04 2.12 0.065 3.6542527 2.5 2.43 0.04 2.37 0.065 4.0723594 2.75 2.69 0.03 2.62 0.065 4.4904661 3 2.95 0.02 2.87 0.065 4.9085728
Figure 8.6.9: Acceptable options for aluminum tubing with post weld heat-treatment to T-6 condition.
Weight of chrome-moly option: 5.3lb
Weight of lightest aluminum option: 3.2lb
Associated dimensions of aluminum: 2in OD. with 0.065in wall.
Conclusion:
The weight of the roll-bar may be reduced by 2.1lb by using aluminum
with post weld heat-treatment. In addition the component would achieve a 12% increase
in failure strength.

45
[8.6.3] Tie-Rod Optimization Summary:
The objective of this analysis is to minimize the weight of the tie-rod. The tie-rod
is a simple cylindrical member with threaded ends as shown in figure 8.6.10 below. The
results of this optimization analysis will be manufacturing specifications for the lightest
possible tie-rod meeting the strength requirement. These specifications will include
everything required to manufacture the tie-rod including the outside diameter, wall
thickness, and material composition.
The completed analysis shows that the geometry which is both the lightest and the
cheapest to manufacture is a 6061-T6 aluminum cylinder with an outside diameter of
0.375in and wall thickness of 0.08in. This geometry meets the strength requirements and
may be directly tapped to accept the specified tie-rod ends. In addition, this design is
stronger and lighter than a number of steel tie-rods available in consumer products of
similar function.
Figure 8.6.10. Detail of tie-rod function and location on 2006 PSU HPV
Tie-Rod

46
Given:
A tie rod for the 2006 PSU HPV is to be optimized to be as light as possible
while still withstanding a critical compression loading of 200lbs and a critical tensile
loading of 200lbs. The tie rod is 20.65in long and must have ¼-20 female threads on
each end to accept tie-rod ends. The current project budget makes aluminum and steel
the only material options.
Figure 8.6.11 Tie-rod loading schematic
Find: Determine the lightest possible cross section for the cylindrical tie rod based on
the strength requirements stated above.
Assumptions:
-The member will be loaded only in uni-axial tension and compression.
-The tie rod ends will allow the ends of the member to rotate in any direction and
may be approximated as pinned supports.
-The member must be able to be directly threaded to accept ¼-20 female threads,
or must have hardware added to it which weights approximately 0.15lb
Solution: The member has two possible failure modes, tensile failure due to the tensile
loading at the pinned ends, and buckling failure due to compressive loading on the
pinned ends. The defining equation for the critical tensile loading as defined by
Juvinall is given as:
cs
cr
AP
=maxσ equation 1

47
Where σmax is the maximum allowable stress, Pcr is the associated maximum
tensile load, and Acs is the cross-sectional area. Solving the above equation for the
cross-section gives the minimum allowable member cross-section as:
maxσcr
csP
A = equation 2
The defining equation for critical buckling loading as defined by Juvinall is given
as:
2
2
,e
csncompressiocr L
EIP
π= equation 3
Where Pcr,compression is the maximum allowable compressive loading, E is the
modulus of elasticity of the material, Ics is the moment of inertia of the cross-
section, and Le is the equivalent length of the member given it’s supports and
eccentricity. For the case of two pinned ends Juvinall defines Le as being equal to
the member length L, solving equation 3 with this simplification for the moment
of inertia of the cross-section gives:
ELP
I ncompressiocrcs 2
2,
π= equation 4
For a design to be acceptable, the cross-section must satisfy both equations 2 and
4, given the properties of the material being analyzed. Material properties for the
two acceptable materials, 6061-T6 aluminum and 1018 Steel are given in figure
8.6.12 below.
Material Property 6061-T6 Aluminum 1018 Steel σt (ksi) 45 50 σy (ksi) 40 39.9 E (ksi) 10000 29000 ρ (lb/in3) 0.0975 0.284
Figure 8.6.12. Material properties (Ref. Matweb)

48
Using the material properties given in Figure 8.6.12. and geometrical
requirements given by equations 2 and 4, the required cross-section and moment
of inertia of each material option was calculated for the maximum load of 200lb.
The results are presented below in Figure 8.6.13.
Required geometry of Aluminum Cross-Section Tensile case (in2) 0.005Buckling case (in4) 0.000864 Required properties of Steel Cross-SectionTensile case (in2) 0.005013Buckling case (in4) 0.000298
Figure 8.6.13. Cross-section requirements. Using the information in Table 2, and a list of commonly available outside
dimensions for cylindrical rod stock, a list of acceptable specimens for each
material was created using spreadsheet software. In addition to the acceptable
geometric dimensions, the weight of each option was calculated in order to
determine the lightest possible option. The resulting spreadsheets are presented in
Figures 8.6.14 and 8.6.15 below.
Aluminum do (in) di (in) t (in) I (in4) A (in2) weight (lb)
0.25NA NA NA NA NA 0.375 0.216 0.080 0.0009 0.074 0.1487
0.5 0.460 0.020 0.0009 0.030 0.06030.75 0.739 0.005 0.0009 0.012 0.0251
1 0.996 0.002 0.0009 0.007 0.01401.25 1.247 0.001 0.0010 0.005 0.0101
1.5 1.498 0.001 0.0014 0.005 0.01011.75 1.748 0.001 0.0019 0.005 0.0101
2 1.998 0.001 0.0025 0.005 0.01012.25 2.249 0.001 0.0032 0.005 0.0101
2.5 2.499 0.001 0.0039 0.005 0.01012.75 2.749 0.001 0.0047 0.005 0.0101
3 2.999 0.001 0.0056 0.005 0.0101Figure 8.6.14. Acceptable aluminum cross-sections

49
Steel do (in) di (in) t (in) I (in4) A (in2) weight (lb)
0.25NA NA NA NA NA 0.5 0.487 0.006 0.0003 0.010 0.0573
0.75 0.746 0.002 0.0004 0.005 0.02941 0.997 0.002 0.0006 0.005 0.0294
1.25 1.247 0.001 0.0010 0.005 0.02941.5 1.498 0.001 0.0014 0.005 0.0294
1.75 1.748 0.001 0.0019 0.005 0.02942 1.998 0.001 0.0025 0.005 0.0294
2.25 2.249 0.001 0.0032 0.005 0.02942.5 2.499 0.001 0.0039 0.005 0.0294
2.75 2.749 0.001 0.0047 0.005 0.02943 2.999 0.001 0.0056 0.005 0.0294
Figure 8.6.15. Acceptable steel cross-sections The above tables show that the lightest possible option is an aluminum tie-rod
with outside diameter of 1.25in and wall thickness of 0.001in. However, the
hardware required to allow this geometry to accept the tie-rod ends has a weight
of 0.15 lb, making it considerably heavier. The lightest option is therefore an
aluminum cylinder with outside diameter of 0.375in and wall thickness of 0.08in
which may be directly threaded to accept the tie-rod ends with no additional
hardware.
Conclusion: Optimized tie-rod geometry Length: 20.65in Outside Diameter: 0.375in Wall thickness: 0.08in Material Specification: 6061-T6 Aluminum

50
[8.6.4]: Determination of Roll-Over Velocity Summary
The objective of this analysis is to determine the speed at which the 2006 Portland
State University Human Powered Vehicle will roll over in a turn of a given radius. There
are multiple factors that will affect the roll-over velocity of the HPV, the height of the
center of gravity of the vehicle, the width of the two front wheels (track), and the radius
of the turn. This analysis presents the roll-over velocity (V) of the HPV as a function of
increasing turning radius (ρ) for given track and height of center of gravity.
The results show that the vehicle is able to take a 20ft radius turn at over 15mph
without tipping. This result meets the PDS requirement for vehicle stability.
ρ (ft) _ V(mph) 10 10.62 11 11.14 12 11.64 13 12.11 14 12.57 15 13.01 16 13.44 17 13.85 18 14.25 19 14.64 20 15.03 21 15.40 22 15.76 23 16.11 24 16.46 25 16.80
From the 2006 HPV Challenge (the race) these results are reasonable; the HPV rolled
twice and went up on two of the three wheels once. All three instances were at speeds in
excess of 10 mph and in turns greater than 10 ft in radius.

51
Given:
The 2006 Portland State University Human Powered Vehicle has a mass of 230lbs with a
center of gravity located 20in above the ground and 34in forward of the rear axel. The
front wheel track of the vehicle is 29in and the overall wheel base is 34in.
Find:
Determine the speed at which the 2006 Portland State University Human Powered
Vehicle will roll over in a 20ft radius turn.
Fg= 230 lbf Fn = m*an 20 in 29 in
Figure 8.6.16: Location of vehicle center of gravity.
Solution: From the given information, the location of the center of gravity of the
vehicle can be determined as shown in Figure 8.6.17:

52
∑ == mgxhFM n
19 in
We can find, from basic trig, the distance from the CG out to the wheel edge line as:
x
x = 9.30 in 34 in
Figure 8.6.17: Location of vehicle center of gravity in plan view.
So from the first schematic given we find the variable in the analysis is the normal
force (fn) from the acceleration of a particle in circular motion, which is dependant on the
radius of the turn and the speed at which the turn is taken.
From a sum of moments, and with the distance x as the moment arm, we can
develop the roll-over velocity from the following equations [Ref. Meriam]:
Where: Solving for the velocity we find: Thus the roll-over velocity as a function of the turning radius for turning radii of 10
through 25 ft is:
ρhVmamF nn
2
∗=∗=
hxgV ρ
=
equation 2
equation 1

53
Results:
ρ (ft) _ V(mph) 10 10.62 11 11.14 12 11.64 13 12.11 14 12.57 15 13.01 16 13.44 17 13.85 18 14.25 19 14.64 20 15.03 21 15.40 22 15.76 23 16.11 24 16.46 25 16.80
The results show that a 29in wheel track is wide enough to make a 20ft radius turn at
15mph which meets the requirements of the PDS.

54
[8.6.5]: Analysis of minimum stopping distance
Summary:
The objective of this analysis is to determine the stopping distance of the 2006
PSU HPV. Competition rules state that the vehicle must be able to come to a complete
stop from a speed of 15mph in 20 feet or less. To determine the theoretical stopping
distance of the HPV, two models were built. One model determines the stopping
distance as limited by interfacial friction between the tires and road, and the other model
determines the stopping distance based on forward tipping potential. A picture of the
disk braking system being used is shown in Figure 8.6.18.
The analysis shows that the vehicle stopping distance is limited by interfacial
friction in all cases. For the predicted road conditions the model shows that the vehicle
will be able to come to a complete stop in approximately 8 feet. After constructing the
prototype and testing its’ braking ability, we found this analysis to be accurate to within a
foot for various conditions.
Figure 8.6.18: Disk braking system used in the 2006 PSU HPV

55
Given:
The 2006 PSU HPV is required to stop in less than 20ft from an initial velocity of 15
mph. The center of mass of the vehicle and rider is 20in above the ground and 19in
behind the front wheel axis. The total vehicle and rider weight is 230lb.
Find: -Determine the minimum stopping distance of the vehicle from 15mph.
Assumptions:
-The disk brake system can apply enough force to lock the front wheels.
Solution:
-Two criteria limit the stopping distance of the HPV. The interfacial friction
between the tires and the road, and the tendency for the vehicle to tip forward
during hard braking.
-The minimum braking distance based on friction is given by Wilson as:
int
2
*20 CVS = equation 1
Where V is the initial velocity in meters per second, and Cint is the interfacial
coefficient of friction between the road and tire. A plot of stopping distances,
based on various initial velocities and coefficients of friction, is presented in
Figure 4.5. For an initial velocity of 15 mph, the stopping distance for this model
was determined to be 8 feet.
- To determine the stability of the vehicle during hard braking, a second analysis
was performed. A balance of moments based due to gravity and deceleration
forces is given by equation 2:
0max =−=∑ cgcp hmamgAM equation 2
Where: m = combined mass of vehicle and rider, A=horizontal distance between
front contact patch axis and center of gravity, and hcg = height of center of gravity.
-The results of both of these calculations are presented in figure 8.6.19.

56
050
100150200250300350400450
10 20 30 40 50 60
velocity (mph)
min
imum
theo
retic
al s
topp
ing
dist
ance
(ft)
0.40.50.60.70.80.9tipping limit
Figure 8.6.19: Plot of Stopping distances based on friction and tipping limits.
Conclusion:
-Figure 8.6.19 shows that the stopping distance is limited by the interfacial
friction and not the tipping potential. Further, for predicted competition road conditions
of a standard dry asphalt surface, the theoretical stopping distance is 8ft which meets the
PDS requirements.

57
[8.6.6]: Steering Angle Comparison and Selection Steering geometry is composed of three planar wheel angles commonly referred to as
camber, caster and toe. These three angles dictate road and friction force transmission
and therefore, greatly affect the steering characteristics of the bike.
Camber Definition:
Camber is the angle between wheels as defined by the difference in the distance
between the tops and bottoms of parallel wheels. A zero degree camber angle indicates
that the wheels are totally parallel. A negative angle indicates that the distance from the
tops of the tires (length A in the figure below) is smaller than the distance between the
bottoms of the tires.
Figure 8.6.20: Camber angles as seen from the front of the vehicle. Negative camber indicates
that distance A (top of the tires) is less than distance B (bottom).
Benefits:
Greater camber angles can provide turning stability by increasing the wheel track
and redirecting normal acceleration loads through the centroid of the wheel.
Drawbacks:
Possibility of damage to the wheel. Increased camber causes premature tire wear
by focusing the contact patch to a smaller portion of the tire. Extreme increases in
camber can reduce turning radius by causing out of plane turning. Camber may also
increase wear on wheel bearings by placing constant torque on them as well as placing an
excessive moment on the wheel hubs.

58
Selection method:
Camber angles were chosen as a balance of planar wheel turning radius reduction
and resultant force vector transmission through the centroid of the wheel. Tire and
bearing wear were taken into consideration, as well as minimal increases in wheel track,
but were found to be too small to make a quantified assessment for. Three spreadsheets
were created, one to calculate camber based on the resultant force angle (centripetal force
due to turning and normal force due to gravity). The resultant angle is used to influence
camber angle. By matching these angles, force is transmitted through the wheel in a
compressive manner without generating a moment about the hub of the wheel while
turning. another spreadsheet is used to determine the reduction in steering angle as a
function of an increase in camber angle. A third spreadsheet is used to determine the
moment load on the hub of the wheel and the associated factor of safety as a function of
the camber angle.
V (mph) V (fps) a (ft/s^2) Force (xdir) Force (y dir) Resultant Camber angle
5 7.33 2.15 15.37 230.00 230.51 3.8210 14.67 8.60 61.46 230.00 238.07 14.9615 22.00 19.36 138.29 230.00 268.37 31.0220 29.33 34.42 245.84 230.00 336.66 46.9125 36.67 53.78 384.13 230.00 447.72 59.09
Figure 8.6.21: Camber selection based on resultant vector forces
Figure 8.6.22: Reduction in turning ability as a function of camber angle.
Steering view Camber angle
Percent view reduction
1.74 0.00 0.001.74 1.00 0.021.74 2.00 0.051.73 3.00 0.081.73 5.00 0.241.71 10.00 1.141.68 15.00 1.921.50 30.00 10.341.23 45.00 18.350.00 90.00 100.00
Camber angle Static moment Impact moment Safety factor
1 2.91 29.09 12.032 6.689070201 66.89 5.233 8.72 87.23 4.014 13.3699908 133.70 2.625 14.53 145.26 2.41
10 33.28256739 332.83 1.0590 166.67 1666.67 0.21
Figure 8.6.23: Moment loading on wheel hub as a function of camber angle.

59
Caster
Definition:
Also known as the kingpin angle, caster is the measured angle of the “fork” where
positive caster projects the bottom of the fork forward, in front of the bike.
Figure 8.6.24: Caster angle as measured from steerer tube to vertical axis.
Benefits:
Increasing caster can increase “wheel return” or the tendency for the bike to travel
in a straight line. Caster also helps to transmit road force in to the frame, rather than the
steering interface.
Drawbacks:
Excessive caster can cause understeer, making the vehicle feel unresponsive. Too
much caster can increase bending moment in the steerer tube as well as create excessive
wear in the headset. Caster creates loading in the tie rod and ,similar to the camber angle,
extreme caster angles can reduce the effective turning angle of the wheel.
Selection method:
The method of caster angle selection is dictated by the balance between the wheel
return force and the bending stress in the steerer tube as well as an attempt to minimize
the reduction in realized steering angle.

60
Figure 8.6.25: Wheel return force as a function of caster angle.
Cas
ter
angl
e N
orm
al
forc
e (lb
) W
heel
re
turn
fo
rce
(ft-
lb)
10 76.67 1.0012 76.67 1.2015 76.67 1.4918 76.67 1.7820 76.67 1.97
Figure 8.6.26: Bending stress as a function of caster angle
Cas
ter a
ngle
Sta
tic fo
rce
Ben
ding
st
ress
Com
pres
siv
e st
ress
Saf
ety
fact
or
10 39.94 782.34 28.66 24.6612 47.82 936.71 41.09 20.4515 59.53 1166.06 63.67 16.2618 71.07 1392.22 90.76 13.4920 78.66 1540.91 111.19 12.11
Figure 8.6.27: Reduction in planar
turning as a function of caster
Ste
erin
g vi
ew
Cas
ter
angl
e
Per
cent
vi
ew
redu
ctio
n
1.74 0.00 0.001.74 1.00 0.021.74 2.00 0.051.73 3.00 0.081.73 5.00 0.241.71 10.00 1.141.68 15.00 1.921.50 30.00 10.341.23 45.00 18.350.00 90.00 100.00
Figure 8.6.28: Percent effective steering reduction due to caster angle.
Toe Definition:
Toe is the difference in the distances between the front and the rear of the front
tires, as shown in figure 8.6.29.
Benefits:
Increased toe can reduce the scrubbing effect on tires at specific velocities and also
increase tracking or the tendency to travel in a straight line. Toe can reduce the road
impact felt by the rider and can also increase turning radius.
0.00
2.00
4.00
6.00
8.00
10.00
12.00
0.00 5.00 10.00 15.00 20.00 25.00 30.00 35.00
cast er ang le

61
Figure 8.6.29: Toe angles as seen from the top of the vehicle where “toe in” is defined as
distance A (front of the vehicle) being greater than distance B.
Drawbacks:
Incorrectly adjusted toe can increase tire scrubbing, understeer, oversteer, and
dramatically reduce tire life. Creates loading in the tie rod.
Steering Angle Decision Matrix
Prioritization of steering parameters was needed in addition to quantified results
to compare the results in terms of importance and compliance to competition rules, safety
and performance benefit. A decision matrix was created to narrow these parameters. In
the table below, each decision criteria was given a weight to quantify its importance. The
criteria are scrubbing (corresponds directly to vehicle speed), complexity (translates to
cost and weight), stability (rider safety and rule compliance), turning radius and safety.
Each steering angle was then rated -2…2 with -2 having extreme negative impact, 0
having no impact, and 2 having substantial positive impact. The high and low measures
for each angle were then compared to one another to determine the appropriate solution.
ScrubbingComplexity Stability Turn radius Safety Total Weight 0.25 0.1 0.2 0.2 0.4 1.15high camber(10+) -1 -1 2 1 -1 -0.15low camber (0-5) 0 0 1 1 1 0.8high caster (10-20) 1 -1 2 1 0 0.75low caster (0-10) 1 0 1 1 0 0.65toe in -1 0 1 0 1 0.35toe out -1 0 0 2 0 0.15
Figure 8.6.30: Steering angle decision matrix With these results the steering angles are selected to be: Camber = 3° , Caster = 15° and
Toe = 1°

62
Appendix [8.7]: Climate and Geographic Data for San Luis Obispo
--Climate Data --Weather station Morro bay fire dept, San Luis Obispo county is at about 35.36°N 120.85°W. Height is 35m / 114 feet above sea level. (ref. Worldclimate.com: http://www.worldclimate.com/cgi-bin/data.pl?ref=N35W120+1300+045866C) --April Averages:
Max Temp: 17.4 C 63.3 F
Min Temp: 7.1 C 44.8 F
24hr Average: 12.2 C 54 F --Weather station San Luis Obispo is at about 38.29°N 120.70°W. Height about 91m / 298 feet above sea level. (ref. Worldclimate.com: http://www.worldclimate.com/cgi-bin/data.pl?ref=N38W120+2100+7249204G1) --April Average:
Monthly Rainfall: 41.2mm 1.6 in --Campus Geography: Elevation: 300-1185 ft Average = 742.5 (Ref Calpoly.edu: http://polyland.calpoly.edu/overview/Archives/nieto/study.html) --Atmospheric Properties corresponding to 24hr average temps: For an altitude of 0 ft and temp of 59 F (15C) the properties of the US standard atmosphere are: (ref. Fundamentals of Fluid Mechanics, M.Y.O) Pressure: 14.696 lb/in2 (abs) 101300 N/m2 (abs) Density: .002377 slugs/ft3 1.225 kg/m3
Dynamic Viscosity: 3.737 E –7 lb*s/ft2 1.789 E-5 N*s/m2

63
Appendix [8.8]: Design Analysis and Testing Details Index of Analysis: Section Solution Page 8.8.1 CFD Analysis Overview 64 8.8.2 Strain Testing Overview 67

64
[8.8.1]: Overview of CFD analysis procedure
For validation of the vehicle fairing design a computational fluid dynamics (CFD)
analysis was performed on the geometry. Two separate models were built, one to
determine the properties of the flow under standard riding conditions, and a second to
determine the effects of crosswinds on vehicle stability.
All models were built and meshed in STAR-Design and then exported to STAR
CCM+ for solving and post processing. All solver runs were allowed to iterate until a
minimum convergence level of 0.001 was achieved for all parameters. All presented
solutions include the Reynolds-Averaged Navier-Stokes turbulence model, approximated
using the Jones and Launder κ-ε model [For details see: Ferziger ch 9].
The first model involved cutting the fairing down its’ vertical center plane such
that a symmetry boundary condition could be implemented to conserve computational
resources. A mesh with approximately 250,000 cells (Figure 8.8.1) was then built and
the flow was solved for a variety of free-stream inlet velocities covering the range of
design values.
Figure 8.8.1: Cut view of mesh used in analysis
For each solver run, velocity fields were plotted to visually inspect for flow
abnormalities, pressure and shear force data were used to calculate drag coefficients and
were plotted on the fairing surface (Figures 8.8.2 and 8.8.3). Based on these simulations,
and a model frontal area of 886 square inches, the drag coefficient at 22 mph was
determined to be 0.11.

65
Figure 8.8.2: Pressure distribution on surface for 34mph free stream velocity
Figure 8.8.3: Shear stress on surface for 34mph free stream velocity
A second model was built to simulate the crosswind condition of a vehicle
traveling at 22mph relative to the ground, with a 22 mph wind perpendicular to the
direction of travel (Figure 8.8.4). This model achieved mesh convergence at
approximately 450,000 cells, and was able to produce information on the center of
pressure of the vehicle given the boundary conditions, as well as a total force
perpendicular to the direction of travel due to fluid forces of 53 lbf.
The model predicts that the center of pressure is located approximately 4in behind
and 1in above the center of gravity. Studies cited by Wilson suggest that bicycle stability
is increased by locating the center of pressure in front of the center of gravity, however

66
for vehicles having more than two wheels, Tamai reports that vehicle stability is
enhanced by the opposite condition. Thus the model predicts the Vike Trike fairing
design is likely to mitigate some of the effects of crosswinds on vehicle stability.
Figure 8.8.4: Velocity vector field for model of 22mph vehicle travel in 22mph cross wind.

67
[8.8.2] Overview of Strain Gage Testing and Results
The vehicle was outfitted with a series of strain gages, and was operated on a rear-
wheel treadmill in a lab. For the dynamic testing, the transmission was set at the largest
possible gear ratio, using a 53-tooth drive gear with a 12-tooth rear sprocket for all trials.
Data for each trial was collected at 50 Hz for a total of 20 seconds. Multiple riders were
used in the live pedaling trials, and the pedaling rate was ranged from of 60 to 138 RPM.
The strain gauges were mounted to the vehicle frame as shown in figure 8.8.5.
During testing, it became clear that the mounting system for the seat rail was less than
perfectly rigid. This caused some deviation from the FEA model, which does not allow
for any slippage between the materials.
Figure 8.8.5: Location of Chainstay and Main Tube Strain Gauges
The modified endurance limit (S
e) for the material was calculated using the
appropriate correction factors, and was used in the Goodman Fatigue Criterion (Table
2.4), along with the alternating stress components (σa) and mean stress components (σ
m),
determined from the test data. The inputs for fatigue calculations are listed in Figure
8.8.6.
Figure 8.8.6: Fatigue Equation Inputs and Correction Factors [Ref. Shigley]

68
Although the vehicle is not necessarily expected to see cyclic loading in excess of
2,000 hours of riding, a fatigue factor of safety of 2 has been set as the target. Figure 2.9
shows the difference between mean and alternating stress in the chainstay and main tube
sensor locations. The test rate of 90 RPM is a high rate for cycling a long distance, but is
realistic for short bursts and sprint courses.
The results of the fatigue analysis are presented in figure 8.8.8. The resulting
minimum factor of safety in fatigue of 2.31 meets the PDS requirement of 2.
Figure 8.8.7: Combined Plot of Fluctuating Stresses for 165-lb rider at 90 RPM
Rider Load 165 lb 140 lb Gage Location Main Tube Main Tube RPM 90 138 Static Load (lbf) 166 140 Static Stress (ksi) 16.60 12.56 Max Stress (ksi) 19.23 18.97 Min Stress (ksi) 10.51 5.82 Alternating Stress (ksi) 4.36 6.58 Mean Stress (ksi) 14.87 12.39 Fatigue Safety Factor, n
f2.83 2.31
Figure 8.8.8: Max Dynamic Load Data

69
Appendix [8.9]: Vehicle Maintenance Schedule Every ride check:
• True of wheels
o Spin each wheel and watch the rim. If the rim wobbles, up and down
or from side to side, repair before riding.
• Tire inflation
o Inflate the tire to the pressure recommended on the tire label. Also
inspect the tire for any cuts or abrasions to the contact surfaces or
sidewalls.
• Brakes
o Squeeze each brake lever toward the handlebar to make sure the brake
moves freely and stops the bike. If the brake lever can be pulled to the
handlebar, the brake is too loose. The brake pads should be 0.25 to
0.75 mm away from the disc when the brakes are not applied. If the
pads are too close, the brake is too tight, or misaligned.
o Make sure rotors are free of foreign substances and oils.
• Check chain tension.
o With no force on the pedals the return side of the chain should have
enough tension to cause the chain to be pulled against the bottom of
the return side idler.
• Frame
o Carefully inspect your frame for signs of fatigue:
Scratches
Cracks
Dents
Deformation
Discoloration
o If any part shows signs of damage or fatigue, repair the frame before
riding.

70
Weekly Check:
• For loose spokes
o Make sure there are no loose or damaged spokes.
• Fairing and seat.
o Unlike metal parts, carbon composite parts that have been damaged
may not bend, bulge, or deform. After any high force load, like a
crash or other impact to your HPV, thoroughly inspect all the parts,
and use the following procedures to inspect carbon composite parts
Check for scratches, gouges, or other surface problems.
Check the part for loss of rigidity.
Check the part for delamination.
Monthly Check:
• Attachment of steerer tubes
• The security of the handle bars by attempting to rotate them in the stems. If
the handlebars rotate in the stems don’t ride the HPV
• The cassette and chain
o Check that the chain and cassette are clean, free of rust, and properly
oiled. All links of the chain should pivot smoothly and without
squeaking, and no links of the chain should be deformed.
• Cables. Inspect and lube shifter and brake cables
o SRAM recommends “jonnisnot” or some type of plastic to metal
lubricant
• Check brake pads
o A pad should be replaced when its total thickness is less than 3mm. A
pad wear indicator is at the center of each inboard and outboard red
adjusting knobs. As the knob is turned in, the indicator will retract
deeper into the knob giving a visual indication of approximately how
much the pads have worn.[ref Avid]
• Check wheel bearings
o Check that all hub bearings are properly greased and adjusted. Lift a
wheel off the ground with one hand and attempt to move the rim left to

71
right. Look, feel, and listen for any looseness in the hub bearings. Spin
the wheel, and listen for any grinding or other unusual noises. If the
hub feels loose or makes any noise, the hub needs an adjustment.
Repeat these procedures for the other two wheels.
Every 3 months check:
• That the cassette is tight.
o Attempt to move the largest rear cog from side to side. If there is any
movement, tighten to the torque specifications.
• Check your chain for wear with a chain wear gauge or a ruler.
o Each new chain link measures 1in. If the chain stretched such that 12
links measure more than 12 1/8 inches the chain should be replaced.

72
Appendix [8.10]: Vehicle Detailed Design This section includes a bill of materials and the complete set of drawings required
to construct the vehicle in a well equipped shop. The assembly process involves no
special tools other than a TIG welding machine and an operator with proper training.
[8.10.1] Bill of Materials
Stock Components
Part Manufacturer Quantity Unit 32 Spoke 700C Rear Wheel Mavic rim with Shimano hub 1 ea 28 Spoke 20" Front Wheel Mavic rim with Phil Woods hub 2 ea 700C Racing Tire Bontragger 1 ea 700C Tube Giant 1 ea 20" Racing Tire Continential Grand Prix 2 ea 20" Tube Specialized 2 ea 9-speed Casette Shimano Ultegra 1 ea Cranks with Triple Chainring Shimano Dura Ace 1 ea Bottom Bracket Shimano 1 ea Chain Shimano Dura Ace 3 ea Pedals Shimano SPD 1 set Rear Wheel Dropouts Vanilla Cycles 1 set Chain Idler Terracycle 1 ea Front Disc Brakes Avid 2 ea Brake Levers Shimano XTR 1 set Stem Profile Design BOA 2 ea Headset Chris King 2 ea Shifters SRAM Rocket Shifts 1 ea Shifter Cable Shimano 5 ft Shifter Housing Shimano 5 ft Brake Cable Shimano 2 ft Brake Housing Shimano 2 ft Seatbelt (w/ hardware) Andover Auto 1 ea

73
Tubing
Material ID / Thickness Length Unit 4130 Chro-molly 1.5" / 0.049" 9.5 ft 4130 Chro-molly 1.0" / 0.065" 3 ft A36 Steel 1/16" flatstock 80 in2 6061 T-6 Aluminum 2.0" / 0.065" 5.5 ft 6061 T-6 Aluminum 1.0" / 0.065" 3 ft 6061 T-6 Aluminum 0.0375" solid rod 2 ft 6061 T-6 Aluminum 1/16" flatstock 6 in2 6061 T-6 Aluminum 1 1/4" solid rod 2 ft 6061 T-6 Aluminum 2" x 2", 1/4" angle stock 1 ft 6061 T-6 Aluminum 1", 1/8" thick 1 ft
Hardware
Item Description Quantity Unit Allen Bolts 1/4" - 20, 1 1/2" long 8 ea Nylock Nuts 1/4" - 20 8 ea Nylon Spacers 1/4" bore x 1/4" tall 2 ea Grade 8 Bolts 3/8", 2 1/2" long 2 ea Grade 8 Bolts 3/8", 1/2" long 1 ea Rivets 3/16", 1/2" long 1 box Hose Clamps 3" diameter 6 ea Marine Grade Velcro 1" x 3" 4 ea Tie Rod End 1/4" - 28 right thread 1 ea Tie Rod End 1/4" - 28 left thread 1 ea Hex Nuts 1/4" - 28 2 ea Pipe Insulation 2" diameter 5 ft Pink Foam Insulation 2' x 8' 1 sheet Zip Ties 6" long 10 ea
Fairing Material
Item Description Quantity Unit Carbon Fiber Tape 2" wide 20 yd Carbon Fiber Cloth 10 oz, 12k x 12k weave 30 yd2 Kevlar 5 oz 10 yd2 Resin Marine epoxy A-side resin 314 2 gallon Hardener Slow B-side hardener 109 2 64 oz [8.10.2] Detailed Drawings

30°
40°
30°
2 1345
SHEET 11 OF 1:20 WEIGHT:
REVDWG. NO.
ASIZE
TITLE:
NAME DATE
COMMENTS:
Q.A.
MFG APPR.
ENG APPR.
CHECKED
DRAWN
FINISH
UNLESS OTHERWISE SPECIFIED:
SCALE:
MATERIAL
INTERPRET GEOMETRIC
DO NOT SCALE DRAWING
THREE PLACE DECIMAL
TOLERANCING PER:
DIMENSIONS ARE IN INCHESTOLERANCES:FRACTIONALANGULAR: MACH BEND TWO PLACE DECIMAL
2006 PSU HPV TEAM
90°
13 7/16"
78°
5 3/
4"Rear View
Frame
Notes:
All tubing 1.5" 4130 Chrome-moly unless otherwise stated.
All joints are welded throughout by GTAW
1" Headtube1" 4130 Chro-molly
Top View
Left and Right stock wheel dropouts
90°90°
90°
Side View
Bottom Bracket HousingThreaded for Shimano Bottom Bracket
17 1/16" 15"11 1/16"
R
A36 1/16"
26 13/16"
2 7/8" A36 1/16"
R8 1/2"
21°

1"
2"
2" 6061-T6 tubing unless otherwise statedAll joints are welded throughout
10"
21"
68°
6 5/12"
19 5/12"
68°
10 1
/12"
8 1/
12"
3 1/1" 3 1/3"
112°
1:10 WEIGHT:
COMMENTS:
TWO PLACE DECIMAL
SIZE DWG. NO.
1
Q.A.
MFG APPR.
ENG APPR.
CHECKED
DRAWN
DATENAME
OF 1SHEET
AREV.
MATERIAL
THREE PLACE DECIMAL
DO NOT SCALE DRAWING
FINISH
DIMENSIONS ARE IN INCHESTOLERANCES:FRACTIONALANGULAR: MACH BEND
SCALE:
2006 PSU HPV TEAM
Rollbar

Rounded for aesthetics
1/16" 1/16"
1/4"
13/1
6"
1/2"
1 3/16"
R
11/16"
1/16"
6 ea. to be made from 6061-T6 flatstock
4 ea. to be made from A36 flatstock
Rear Strut Brackets
1 1/
8"
1/16"
3/8"1/4"
1/2"
1 1/
4"
1"
R3/
4"
1
DO NOT SCALE DRAWING
234
1
UNLESS OTHERWISE SPECIFIED:
OF 2:1 WEIGHT:
REVDWG. NO.
ASIZE
TITLE:
NAME DATE
COMMENTS:
Q.A.
MFG APPR.
ENG APPR.
CHECKED
DRAWN
FINISH
MATERIAL
SCALE:
TOLERANCING PER:INTERPRET GEOMETRIC
1SHEET
5
THREE PLACE DECIMAL
DIMENSIONS ARE IN INCHESTOLERANCES:FRACTIONALANGULAR: MACH BEND TWO PLACE DECIMAL
2006 PSU HPV TEAM

Notes:
1/2" square 6061-T6 tubing 1/16" wall thickness
All holes are 1/4" diameterunless otherwise stated.
Forward Strut
1/2"1 5/8"
3/16
"1/
8"
11"
1/2"
16 3/4"
1/2"
13/16"9/16"
Rear Strut: make 2 each
1/2"
1
DO NOT SCALE DRAWING
234
1
UNLESS OTHERWISE SPECIFIED:
OF 1:5 WEIGHT:
REVDWG. NO.
ASIZE
TITLE:
NAME DATE
COMMENTS:
Q.A.
MFG APPR.
ENG APPR.
CHECKED
DRAWN
FINISH
MATERIAL
SCALE:
TOLERANCING PER:INTERPRET GEOMETRIC
1SHEET
5
THREE PLACE DECIMAL
DIMENSIONS ARE IN INCHESTOLERANCES:FRACTIONALANGULAR: MACH BEND TWO PLACE DECIMAL
2006 PSU HPV TEAM

7/8" bore diameter
7/8"
1.25
1 1/4" 6061-T6 roundstockto be turned in lathe to final dimensions
TWO PLACE DECIMAL
WEIGHT:
Steer Tube
PROPRIETARY AND CONFIDENTIAL
SIZE DWG. NO.
AREV.
MATERIAL
FINISH
PROHIBITED.
COMMENTS:
<INSERT COMPANY NAME HERE> IS WITHOUT THE WRITTEN PERMISSION OFREPRODUCTION IN PART OR AS A WHOLE
1
Q.A.
MFG APPR.
ENG APPR.
CHECKED
DRAWN
DATENAME
OF 1SHEET
<INSERT COMPANY NAME HERE>. ANY DRAWING IS THE SOLE PROPERTY OFTHE INFORMATION CONTAINED IN THIS
THREE PLACE DECIMAL
NEXT ASSY USED ON
APPLICATION DO NOT SCALE DRAWING
DIMENSIONS ARE IN INCHESTOLERANCES:FRACTIONALANGULAR: MACH BEND
SCALE:1:5
8.00
1.25
1.043
3/16
"
10 3
/16"
26.50
1.00

1:5 WEIGHT:
COMMENTS:
TWO PLACE DECIMAL
SIZE DWG. NO.
1
Q.A.
MFG APPR.
ENG APPR.
CHECKED
DRAWN
DATENAME
OF 1SHEET
AREV.
MATERIAL
THREE PLACE DECIMAL
DO NOT SCALE DRAWING
FINISH
DIMENSIONS ARE IN INCHESTOLERANCES:FRACTIONALANGULAR: MACH BEND
SCALE:
2006 PSU HPV TEAM
Brake Caliper Mounts
Notes:
Make 2 ea.1/4" 6061-T6 angle stock
1/8"
5/8"
5 1/2"
3/8"
TRUE R
1"
3 3/8"
1 9/16"
1/4"
1/4"1
5/8" 1/2"
2"R
TYP
R 1 1/4"
R 2 1/2"
TYP
R
R
1/4"
3/4"

15°
1/8"
1:5 WEIGHT:
COMMENTS:
TWO PLACE DECIMAL
SIZE DWG. NO.
1
Q.A.
MFG APPR.
ENG APPR.
CHECKED
DRAWN
DATENAME
OF 1SHEET
AREV.
MATERIAL
THREE PLACE DECIMAL
DO NOT SCALE DRAWING
FINISH
DIMENSIONS ARE IN INCHESTOLERANCES:FRACTIONALANGULAR: MACH BEND
SCALE:
2006 PSU HPV TEAM
1/8"
15°
Right Steering Knucle / Brake Caliper Mount
Steering Knucle andBrake Caliper Mount
Left Steering Knuckle / Brake Caliper Mount
All joints are to be welded
1/2"
Steer Tube
- 12 Threaded
81°1 1/4"
Brake CaliperMount
1 1/4"
78°
1/2" - 12 Threaded

Top View
Rider Interface
3 245
THREE PLACE DECIMAL
DO NOT SCALE DRAWING SHEET
INTERPRET GEOMETRIC
1 OF 1:2 WEIGHT:
REVDWG. NO.
ASIZE
TITLE:
NAME DATE
COMMENTS:
Q.A.
MFG APPR.
ENG APPR.
CHECKED
DRAWN
1
UNLESS OTHERWISE SPECIFIED:
FINISH
MATERIAL
1
TOLERANCING PER:
SCALE:
DIMENSIONS ARE IN INCHESTOLERANCES:FRACTIONALANGULAR: MACH BEND TWO PLACE DECIMAL
2006 PSU HPV TEAM
3 1/2"
5 13
/16"
Left Side View
All parts are 6061-T6 Aluminum1" OD, 0.065 wall thickness.
All joints to be welded.112°
Front View
149.59°
6 5/
16"

1.00
35° 15°
9.00
24.00
2.00
R2.00
R
Side View
Carbon Fiber Seat
Final product is to be 60% fiber, 40% resin.
Notes:
Seat is to be fabribated from 5 layers of 10 oz carbon fiber clothin an epoxy-resin wet lay-up process.
Top View
14.0
0
2.00
2.00
7.00
10.0
0
1
DO NOT SCALE DRAWING
234
1
UNLESS OTHERWISE SPECIFIED:
OF 1:10 WEIGHT:
REVDWG. NO.
ASIZE
TITLE:
NAME DATE
COMMENTS:
Q.A.
MFG APPR.
ENG APPR.
CHECKED
DRAWN
FINISH
MATERIAL
SCALE:
TOLERANCING PER:INTERPRET GEOMETRIC
1SHEET
5
THREE PLACE DECIMAL
DIMENSIONS ARE IN INCHESTOLERANCES:FRACTIONALANGULAR: MACH BEND TWO PLACE DECIMAL
2006 PSU HPV TEAM

1 1/4"2 1/2"
5 1/8"
3 245
THREE PLACE DECIMAL
DO NOT SCALE DRAWING SHEET
INTERPRET GEOMETRIC
1 OF 1:2 WEIGHT:
REVDWG. NO.
ASIZE
TITLE:
NAME DATE
COMMENTS:
Q.A.
MFG APPR.
ENG APPR.
CHECKED
DRAWN
1
UNLESS OTHERWISE SPECIFIED:
FINISH
MATERIAL
1
TOLERANCING PER:
SCALE:
DIMENSIONS ARE IN INCHESTOLERANCES:FRACTIONALANGULAR: MACH BEND TWO PLACE DECIMAL
2006 PSU HPV TEAM
All joints to be welded throughout1/16" A36 flatstock
Seat Bracket
5"1"
3/8" 7"
2"
2 1/
2"
2"3/4"
1/2"
1/8" TYP
1/2"
1 1/
4"5/8"
1 1/
8"
1 1/
8"
5/8"
Holes to be added in general configuration for lightening. Dimensional accuracy not required.
Diameter = 3/4"

Seat Rail
16 1/2"
2"
1 1/
2"
1/4"
Tie Rod
20"
6061-T6
Tie Rod and Seat Rail
A36 flatstock unless otherwise notedAll joints are to be welded
1
DO NOT SCALE DRAWING
234
1
UNLESS OTHERWISE SPECIFIED:
OF 1:5 WEIGHT:
REVDWG. NO.
ASIZE
TITLE:
NAME DATE
COMMENTS:
Q.A.
MFG APPR.
ENG APPR.
CHECKED
DRAWN
FINISH
MATERIAL
SCALE:
TOLERANCING PER:INTERPRET GEOMETRIC
1SHEET
5
THREE PLACE DECIMAL
DIMENSIONS ARE IN INCHESTOLERANCES:FRACTIONALANGULAR: MACH BEND TWO PLACE DECIMAL
2006 PSU HPV TEAM
3/8"
1/4" - 20 Threaded

6.00 4.00
Windows
Windows cut from 1/32" polycarbonate.
Top Window
8.00
12.0
0
22.00
DO NOT SCALE DRAWING SHEET 1 OF 1
UNLESS OTHERWISE SPECIFIED:
SCALE: 1:5 WEIGHT:
REVDWG. NO.
ASIZE
TITLE:
NAME DATE
COMMENTS:
Q.A.
MFG APPR.
ENG APPR.
CHECKED
DRAWN
FINISH
MATERIAL
INTERPRET GEOMETRICTOLERANCING PER:
DIMENSIONS ARE IN INCHESTOLERANCES:FRACTIONALANGULAR: MACH BEND TWO PLACE DECIMAL THREE PLACE DECIMAL
5 4 3 2 1
2006 PSU HPV TEAMSide Window: Cut 2 ea.
36.00
10.0
0

Slice 1
Slice 16
82.6091.10
97.60
4.509.00
13.5018.00
22.5029.00
35.5044.00
52.5061.00
65.6074.10
0.50 TYP
1
DO NOT SCALE DRAWING
234
1
UNLESS OTHERWISE SPECIFIED:
OF 1:50 WEIGHT:
REVDWG. NO.
ASIZE
TITLE:
NAME DATE
COMMENTS:
Q.A.
MFG APPR.
ENG APPR.
CHECKED
DRAWN
FINISH
MATERIAL
SCALE:
TOLERANCING PER:INTERPRET GEOMETRIC
1SHEET
5
THREE PLACE DECIMAL
DIMENSIONS ARE IN INCHESTOLERANCES:FRACTIONALANGULAR: MACH BEND TWO PLACE DECIMAL
2006 PSU HPV TEAM
maximum height and width indicated for each section.
Slices increase from right to left.Individual profiles are shown in separate drawings, with
Slice Layout

17 3/8"
16 9
/16"
Slice 1
For fabrication, all slices should allign so that holes match up.
OF
TWO PLACE DECIMAL
1:5 1
AREV.
COMMENTS:
SHEET 1
Q.A.
MFG APPR.
ENG APPR.
CHECKED
DRAWN
SIZE DWG. NO.
WEIGHT:
MATERIAL
FINISH
DO NOT SCALE DRAWING
DATENAME
THREE PLACE DECIMAL
DIMENSIONS ARE IN INCHESTOLERANCES:FRACTIONALANGULAR: MACH BEND
SCALE:
2006 PSU HPV TEAM

23 11/16"
Slice 2
21 7
/8"
1:10 WEIGHT:
COMMENTS:
TWO PLACE DECIMAL
SIZE DWG. NO.
1
Q.A.
MFG APPR.
ENG APPR.
CHECKED
DRAWN
DATENAME
OF 1SHEET
AREV.
MATERIAL
THREE PLACE DECIMAL
DO NOT SCALE DRAWING
FINISH
DIMENSIONS ARE IN INCHESTOLERANCES:FRACTIONALANGULAR: MACH BEND
SCALE:
2006 PSU HPV TEAM

26 13/16"
Slice 3
25 1
/8"
1:10 WEIGHT:
COMMENTS:
TWO PLACE DECIMAL
SIZE DWG. NO.
1
Q.A.
MFG APPR.
ENG APPR.
CHECKED
DRAWN
DATENAME
OF 1SHEET
AREV.
MATERIAL
THREE PLACE DECIMAL
DO NOT SCALE DRAWING
FINISH
DIMENSIONS ARE IN INCHESTOLERANCES:FRACTIONALANGULAR: MACH BEND
SCALE:
2006 PSU HPV TEAM

28 5/16"
27 3
/8"
1:10 WEIGHT:
COMMENTS:
TWO PLACE DECIMAL
SIZE DWG. NO.
1
Q.A.
MFG APPR.
ENG APPR.
CHECKED
DRAWN
DATENAME
OF 1SHEET
AREV.
MATERIAL
THREE PLACE DECIMAL
DO NOT SCALE DRAWING
FINISH
DIMENSIONS ARE IN INCHESTOLERANCES:FRACTIONALANGULAR: MACH BEND
SCALE:
2006 PSU HPV TEAM
Slice 4

29 1/4"
1:10 WEIGHT:
COMMENTS:
TWO PLACE DECIMAL
SIZE DWG. NO.
1
Q.A.
MFG APPR.
ENG APPR.
CHECKED
DRAWN
DATENAME
OF 1SHEET
AREV.
MATERIAL
THREE PLACE DECIMAL
DO NOT SCALE DRAWING
FINISH
DIMENSIONS ARE IN INCHESTOLERANCES:FRACTIONALANGULAR: MACH BEND
SCALE:
2006 PSU HPV TEAM
28 1
3/16
"
Slice 5

30 1/16"
1:10 WEIGHT:
COMMENTS:
TWO PLACE DECIMAL
SIZE DWG. NO.
1
Q.A.
MFG APPR.
ENG APPR.
CHECKED
DRAWN
DATENAME
OF 1SHEET
AREV.
MATERIAL
THREE PLACE DECIMAL
DO NOT SCALE DRAWING
FINISH
DIMENSIONS ARE IN INCHESTOLERANCES:FRACTIONALANGULAR: MACH BEND
SCALE:
2006 PSU HPV TEAM
Slice 6
29 7
/16"

31 1/4"
1:10 WEIGHT:
COMMENTS:
TWO PLACE DECIMAL
SIZE DWG. NO.
1
Q.A.
MFG APPR.
ENG APPR.
CHECKED
DRAWN
DATENAME
OF 1SHEET
AREV.
MATERIAL
THREE PLACE DECIMAL
DO NOT SCALE DRAWING
FINISH
DIMENSIONS ARE IN INCHESTOLERANCES:FRACTIONALANGULAR: MACH BEND
SCALE:
2006 PSU HPV TEAM
29 1
1/16
"
Slice 7

32 7/15"
Slice 8
29 5
/15"
1:10 WEIGHT:
COMMENTS:
TWO PLACE DECIMAL
SIZE DWG. NO.
1
Q.A.
MFG APPR.
ENG APPR.
CHECKED
DRAWN
DATENAME
OF 1SHEET
AREV.
MATERIAL
THREE PLACE DECIMAL
DO NOT SCALE DRAWING
FINISH
DIMENSIONS ARE IN INCHESTOLERANCES:FRACTIONALANGULAR: MACH BEND
SCALE:
2006 PSU HPV TEAM

34 1/16"
1:10 WEIGHT:
COMMENTS:
TWO PLACE DECIMAL
SIZE DWG. NO.
1
Q.A.
MFG APPR.
ENG APPR.
CHECKED
DRAWN
DATENAME
OF 1SHEET
AREV.
MATERIAL
THREE PLACE DECIMAL
DO NOT SCALE DRAWING
FINISH
DIMENSIONS ARE IN INCHESTOLERANCES:FRACTIONALANGULAR: MACH BEND
SCALE:
2006 PSU HPV TEAM
28"
Slice 9

35 5/8"
1:10 WEIGHT:
COMMENTS:
TWO PLACE DECIMAL
SIZE DWG. NO.
1
Q.A.
MFG APPR.
ENG APPR.
CHECKED
DRAWN
DATENAME
OF 1SHEET
AREV.
MATERIAL
THREE PLACE DECIMAL
DO NOT SCALE DRAWING
FINISH
DIMENSIONS ARE IN INCHESTOLERANCES:FRACTIONALANGULAR: MACH BEND
SCALE:
2006 PSU HPV TEAM
Slice 10
25 7
/8"

36 9/16"
1
DO NOT SCALE DRAWING
234
1
UNLESS OTHERWISE SPECIFIED:
OF 1:10 WEIGHT:
REVDWG. NO.
ASIZE
TITLE:
NAME DATE
COMMENTS:
Q.A.
MFG APPR.
ENG APPR.
CHECKED
DRAWN
FINISH
MATERIAL
SCALE:
TOLERANCING PER:INTERPRET GEOMETRIC
1SHEET
5
THREE PLACE DECIMAL
DIMENSIONS ARE IN INCHESTOLERANCES:FRACTIONALANGULAR: MACH BEND TWO PLACE DECIMAL
2006 PSU HPV TEAM
Slice 11
22 1
5/16
"

36 11/16"
Slice 12
21 1
/16"
1
DO NOT SCALE DRAWING
234
1
UNLESS OTHERWISE SPECIFIED:
OF 1:10 WEIGHT:
REVDWG. NO.
ASIZE
TITLE:
NAME DATE
COMMENTS:
Q.A.
MFG APPR.
ENG APPR.
CHECKED
DRAWN
FINISH
MATERIAL
SCALE:
TOLERANCING PER:INTERPRET GEOMETRIC
1SHEET
5
THREE PLACE DECIMAL
DIMENSIONS ARE IN INCHESTOLERANCES:FRACTIONALANGULAR: MACH BEND TWO PLACE DECIMAL
2006 PSU HPV TEAM

36 3/16"
Slice 13
1
DO NOT SCALE DRAWING
234
1
UNLESS OTHERWISE SPECIFIED:
OF 1:10 WEIGHT:
REVDWG. NO.
ASIZE
TITLE:
NAME DATE
COMMENTS:
Q.A.
MFG APPR.
ENG APPR.
CHECKED
DRAWN
FINISH
MATERIAL
SCALE:
TOLERANCING PER:INTERPRET GEOMETRIC
1SHEET
5
THREE PLACE DECIMAL
DIMENSIONS ARE IN INCHESTOLERANCES:FRACTIONALANGULAR: MACH BEND TWO PLACE DECIMAL
2006 PSU HPV TEAM
17 1
/8"

34 5/8"
1
DO NOT SCALE DRAWING
234
1
UNLESS OTHERWISE SPECIFIED:
OF 1:5 WEIGHT:
REVDWG. NO.
ASIZE
TITLE:
NAME DATE
COMMENTS:
Q.A.
MFG APPR.
ENG APPR.
CHECKED
DRAWN
FINISH
MATERIAL
SCALE:
TOLERANCING PER:INTERPRET GEOMETRIC
1SHEET
5
THREE PLACE DECIMAL
DIMENSIONS ARE IN INCHESTOLERANCES:FRACTIONALANGULAR: MACH BEND TWO PLACE DECIMAL
2006 PSU HPV TEAM
12 5
/8"
Slice 14

32 3/8"
1
DO NOT SCALE DRAWING
234
1
UNLESS OTHERWISE SPECIFIED:
OF 1:5 WEIGHT:
REVDWG. NO.
ASIZE
TITLE:
NAME DATE
COMMENTS:
Q.A.
MFG APPR.
ENG APPR.
CHECKED
DRAWN
FINISH
MATERIAL
SCALE:
TOLERANCING PER:INTERPRET GEOMETRIC
1SHEET
5
THREE PLACE DECIMAL
DIMENSIONS ARE IN INCHESTOLERANCES:FRACTIONALANGULAR: MACH BEND TWO PLACE DECIMAL
2006 PSU HPV TEAM
7 11
/16"
Slice 15

30 5/16"
1
DO NOT SCALE DRAWING
234
1
UNLESS OTHERWISE SPECIFIED:
OF 1:2 WEIGHT:
REVDWG. NO.
ASIZE
TITLE:
NAME DATE
COMMENTS:
Q.A.
MFG APPR.
ENG APPR.
CHECKED
DRAWN
FINISH
MATERIAL
SCALE:
TOLERANCING PER:INTERPRET GEOMETRIC
1SHEET
5
THREE PLACE DECIMAL
DIMENSIONS ARE IN INCHESTOLERANCES:FRACTIONALANGULAR: MACH BEND TWO PLACE DECIMAL
2006 PSU HPV TEAM
3 5/
8"
Slice 16

[9] References Acheson, D.J. Elementary Fluid Dynamics. Oxford University Press Inc. New York.
1990 AlcoTechnics Wire Corporation, Traverse City, MI. Alloy 5356 Weld Data Sheet. via
www.alcotec.com Burrows, Mike. Bicycle Design, Towards the Perfect Machine. AlpenBook Press.
Mukilteo, WA. 2000. Callister, Williams D., Materials Science and Engineering An Introduction, John Wiley,
Hoboken, NJ, 2003. Coventry, Sherman. Interview with Coventry Cycles Owner. Conducted 9/15/2005
“X-seam is defined as the length between the wall and the bottom of the foot if a rider sits on the floor, against the wall with legs extended straight forward”
Ferziger, J.H. Peric, M. Computational Methods for Fluid Dynamics. Third Edition.
Springer, Berlin. 2002. Gere, James M. Mechanics of Materials. Brooks/Cole. Pacific Grove, CA, 2001 J.L. Meriam, L.G. Kraige: Engineering Mechanics, Volume 2 Dynamics, 5th edition, John
Wiley and Sons, 2002 Juvinall, Robert C. Fundamentals of Machine Component Design John Wiley & Sons,
New York, 1983. MatWeb, Material Property Data. www.Matweb.com. Accessed 2/12/2006. Munson, Bruce. Okiishi, Theodore. Young, Donald. A Brief Introduction To Fluid
Mechanics. Third Edition. John Wiley & Sons. Hoboken, NJ. 2004 Recktenwald, Gerald. The κ-ε Turbulence Model. Portland State University Mechanical
and Materials Engineering Department. Portland, Or. 2006. Reiser, Peterson . Backrest Angle Influence on Recumbent Cycling Power Output, Colorado State University Mechanical Engineering Dept. 1993 Shigley, Mischhke. Mechanical Engineering Design. Fifth Edition. McGraw Hill,
Madison, WI. 2002 Spicer, J.B, Richardson, J.K, Ehrlich, M, Bernstein, J. On The Efficiency of Bicycle
Chain Drives. From: “Human Power, Technical Journal of the IHPVA” Issue #50. pp3-9 The John Hopkins University
104

Tamai, Goro. The Leading Edge, Aerodynamic Design of Ultra-Streamlined Land
Vehicles. Robert Bentley Publishers. Cambridge, Ma. 1999 Wilson, David Gordon. Bicycling Science. Third Edition. The MIT Press. Cambridge,
Ma. 2004 World Climate data courtesy of: Worldclimate.com: Accessed via:
http://www.worldclimate.com/cgi-bin/data.pl?ref=N35W120+1300+045866C) Accessed 11/18/2005
105

[10] Acknowledgements The 2006 Portland State HPV team would like to thank the following people and sponsors for their generous assistance and donations. Without their support, this project would not have been possible.
The Maseeh College of Engineering and Computer Science, PSU The Department of Mechanical and Materials Engineering, PSU Tony & Tracy Braun
Michael & Annie Tinnesand Craig LeDoux, Northwest Thermal Systems Robert Johnson , TerraCycle
Dave Roper, ATK Systems King Cycle Group The Bike Gallery Jay Burke, BMWC Constructors Red Bull Gary and Gary Mike the Machinist Dr. Derek Tretheway Dr. Jack Devletian, Portland State University Dr. David Turcic, Portland State University Dr. Hormoz Zareh, Portland State University Dr. Gerry Recktenwald, Portland State University Dr. Faryar Etesami, Portland State University Dr. Graig Spolek, Portland State University
106