portfolio management tools why and when are they used? · portfolio management tools portfolio...
TRANSCRIPT
Joe Tidd and John Bessant http://www.innovation-‐portal.info/ John Wiley and Sons Ltd
Portfolio management tools Portfolio Management (PM) techniques are systematic ways of looking at a set of projects or activities or even business units, in order to reach an optimum balance between risks and returns, stability and growth, attractions and drawbacks in general, by making the best use of usually limited resources.
Why and when are they used? The motivation for a company to have several projects at a time can be of very different nature. In many organizations, the uncertainty surrounding individual projects leads them to place considerable emphasis on the development of a portfolio of activities which is aimed to balancing risk and reward in such a way as to reduce the overall uncertainty. One useful approach to this task is to consider the innovation process from idea to implementation alongside certain variables, such as future cash flow projections and resource requirements.
The starting point for this analysis is the recognition that the innovative process within most organisations is likely to be a multi stage one which can be slowed down, accelerated or discontinued as circumstances dictate. Some organisations consider their portfolio as being similar to a funnel which they need to keep topping up in order to ensure the flow through is strong enough and the outputs are sufficient to meet their needs. Diagrammatically it might be portrayed as in figure 1.
Figure 1 Flow of ideas/projects in comparison with resource requirements

Joe Tidd and John Bessant http://www.innovation-‐portal.info/ John Wiley and Sons Ltd
In general, separate analysis of projects is unlikely to ensure the most productive use of limited resources at any time, something which PM provides. Of particular importance is also the need to ensure that RTD plans are consistent with business strategy. Comparable problems of fit with strategy and selection of appropriate investments within constraints are to be found in most aspects of business management, and are commonly dealt with using PM techniques.
Several techniques dealing with PM can be mentioned. In general, all of them have certain common aspects:
• A portfolio involves balancing the results of assessing the individual projects which comprise it. In this way PM could be combined with appropriate single project evaluation techniques. In fact, when used to assess and select projects, PM partially or totally uses the outcomes of the analysis undertaken for the evaluation of individual projects. One issue to be dealt with when applying PM is that projects do not normally occur over the same period of time, which imply some discontinuities. In fact, having the timely balance of projects in terms of costs and returns over time is one of the typical uses of PM.
• Every project should be examined in the same way, in order so ensure the consistency and validity of the input data. Otherwise, comparison, hence balancing, between projects is not sufficiently reliable. A common vocabulary has to be established.
The level of analysis might differ to suit how the company organizes the RTD activities. In that sense, although in the explanation of this tool it is often referred to a portfolio of projects, in the same way, depending on specific techniques, the tool can be applied to look at a set of programmes (which in themselves are made up of a set of projects), or technologies, or even at different business units. In any case, one important issue is that PM is in itself a strategic exercise used to look at the whole set of RTD activities.
Specific techniques

Joe Tidd and John Bessant http://www.innovation-‐portal.info/ John Wiley and Sons Ltd
Many project evaluation techniques can in fact be used as portfolio evaluation techniques, just by directly comparing the results of the assessment of individual projects. On the other hand, there are other types of techniques specially suited for PM, at the strategic and operational level. A classification of distinct types of PM techniques is shown in table 1.
Table 1 Types of Portfolio Management techniques
Techniques Short description
2D and 3D matrices • Based on a graphical representation of several variables in 2 or 3 dimensional matrices
• Preference is given to those variables most important to the decision maker
• Foster discussion in order to arrive at the decision
Mathematical programming
• Based on complex mathematical algorithms aimed at optimising the portfolio
• Need computer support • Mostly company specific, difficult to adapt to
different companies and situations • They usually choose the solution (eg which are
the projects to invest in)
Others (typical of project evaluation)
• Methods like decision trees and others
The techniques based on 2D and 3D matrices are considered the most interesting ones for they are suitable for any company and context, as well as being quite easily implementable and usable compared with other techniques. They are described in more detail below.
These matrices provide a framework for examination of several parameters, and some experimentation is needed by the company who wants to apply them in order to find the appropriate combinations. These matrices, in any case, do not avoid the need for judgement although these judgements will be well supported through the use of these techniques.
2D and 3D matrices These are matrices used to analyze and represent the situation of RTD projects or activities, or even business units, according to 2 or 3 meaningful variables. All those matrices are grouped together in this section because they can be regarded as mostly

Joe Tidd and John Bessant http://www.innovation-‐portal.info/ John Wiley and Sons Ltd
complementary and require a similar process for analysing the data and for taking decisions.
To analyze the portfolio, business and RTD managers first examine each individual project, then place each project within portfolio structures (matrices) that accommodate the strategic elements most critical to the specific company and its industry.
In most cases, the qualitative nature of many of the human judgments necessary to assess all variables implies that the projects can only be assessed on a relative rather than an absolute basis (i.e. better or worse rather than correct or incorrect). In general, preference is given to those variables easily understandable and of critical meaning to the decision maker.
One common characteristic of the 3D matrices is that one of the variables usually represent the size of the project measured in financial terms (eg the amount of funding invested in a specific project or technology, or the revenues being generated by a business unit). This factor stresses the importance given to the resource issue.
In what follows, several matrices are explained in terms of its specific objectives, what they represent and the discussion they should imply. In general terms these matrices are useful for projects, businesses, technologies and other kinds of applications. The matrices shown are identified by the variables which are being assessed and discussed
Matrix: expected value x probability of success
Joe Tidd and John Bessant http://www.innovation-‐portal.info/ John Wiley and Sons Ltd
Variables
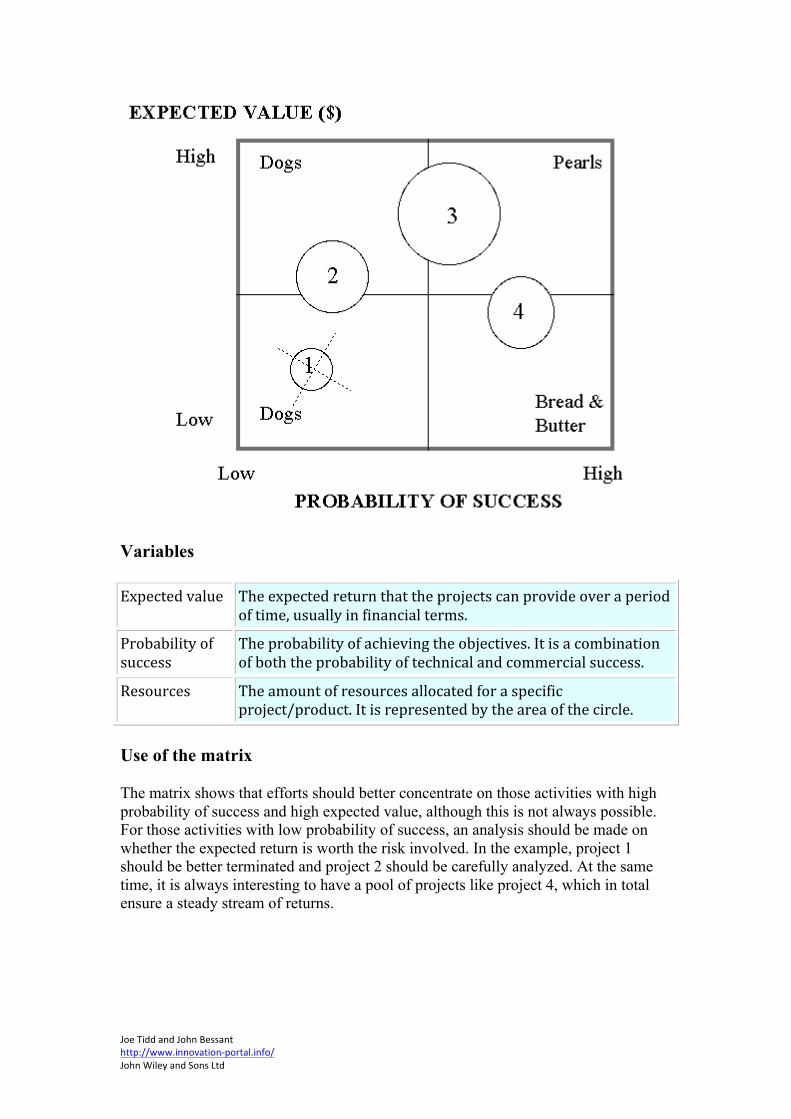
Expected value The expected return that the projects can provide over a period of time, usually in financial terms.
Probability of success
The probability of achieving the objectives. It is a combination of both the probability of technical and commercial success.
Resources The amount of resources allocated for a specific project/product. It is represented by the area of the circle.
Use of the matrix
The matrix shows that efforts should better concentrate on those activities with high probability of success and high expected value, although this is not always possible. For those activities with low probability of success, an analysis should be made on whether the expected return is worth the risk involved. In the example, project 1 should be better terminated and project 2 should be carefully analyzed. At the same time, it is always interesting to have a pool of projects like project 4, which in total ensure a steady stream of returns.

Joe Tidd and John Bessant http://www.innovation-‐portal.info/ John Wiley and Sons Ltd
Matrix:impact of R&D on competitive position x familiarity of market
Variables
Impact of R&D on competitive position
How the specific projects could impact on the company's competitive position. High means that in case the project succeeds the company's competitiveness will dramatically increase
Markets (familiarity)
The company's knowledge on both the market and the factors affecting the market
Resources The amount of resources allocated to a specific business/project. It is represented by the area of the circle
Use of the matrix
This matrix gives a clear understanding of risk by examining the portfolio with respect to market familiarity and impact on competitive position. The example shows the portfolio of a company chiefly concerned to protect its position in existing markets but, at the same time having two R&D projects (1 and 2) intended to gain advantage, for instance through exploiting new technologies, one of which

Joe Tidd and John Bessant http://www.innovation-‐portal.info/ John Wiley and Sons Ltd
compounds the risk by aiming at a new market. By drawing attention to this, the evaluation will prompt discussion of the risks involved.
In summary, the company, while securing the position on current markets with several projects, it is also aiming at new growth opportunities, either coming from new markets or from strengthening the current position in new markets.

Joe Tidd and John Bessant http://www.innovation-‐portal.info/ John Wiley and Sons Ltd
Matrix: market (knowledge) x technology (knowledge)
Variables
Market knowledge
The company's knowledge of both the market and the factors affecting it. It also involves assessing whether the market is known by the competitors
Technology knowledge
The company's knowledge of both the technology and the factors affecting it. It also involves assessing whether the technology is known by the competitors
Resources The amount of resources allocated to a specific business/project. It is represented by the area of the circle
Use of the matrix
This matrix gives an understanding of the situation of a company's portfolio with respect to technology and market. It is remarkable that both technology and market are divided according to company's knowledge in three groups, and uncertainty increases on those technologies and markets that are new. This matrix also gives information about the risks involved (higher uncertainty, higher risks). Experience says that those projects using unknown technologies and directed towards unknown markets (projects 11 and 12) are likely to run into problems. On the other hand, if successful, rewards might be huge.
Matrix: technological competitive position x industry maturity
Joe Tidd and John Bessant http://www.innovation-‐portal.info/ John Wiley and Sons Ltd
Variables
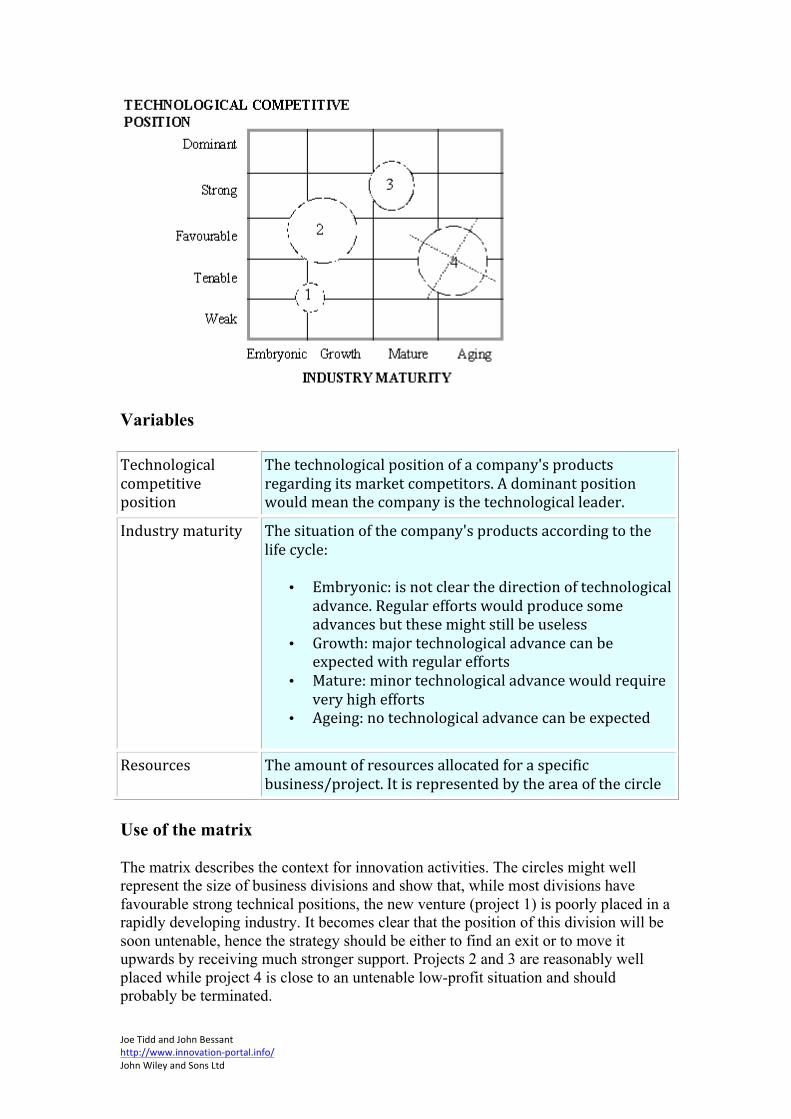
Technological competitive position
The technological position of a company's products regarding its market competitors. A dominant position would mean the company is the technological leader.
Industry maturity The situation of the company's products according to the life cycle:
• Embryonic: is not clear the direction of technological advance. Regular efforts would produce some advances but these might still be useless
• Growth: major technological advance can be expected with regular efforts
• Mature: minor technological advance would require very high efforts
• Ageing: no technological advance can be expected
Resources The amount of resources allocated for a specific business/project. It is represented by the area of the circle
Use of the matrix
The matrix describes the context for innovation activities. The circles might well represent the size of business divisions and show that, while most divisions have favourable strong technical positions, the new venture (project 1) is poorly placed in a rapidly developing industry. It becomes clear that the position of this division will be soon untenable, hence the strategy should be either to find an exit or to move it upwards by receiving much stronger support. Projects 2 and 3 are reasonably well placed while project 4 is close to an untenable low-profit situation and should probably be terminated.

Joe Tidd and John Bessant http://www.innovation-‐portal.info/ John Wiley and Sons Ltd
If the company only bets on projects aiming at mature technologies, the growth opportunities could be low.

Joe Tidd and John Bessant http://www.innovation-‐portal.info/ John Wiley and Sons Ltd
Matrix: annual budget x competitive impact of technologies
Variables
Competitive impact of technologies
The technological position of the company's technologies regarding its market competitors
• Embryonic: very new technology, on its infancy • Pacing: potential to change the basis of
technological competition • Key: embodied in products and processes,
differentiated in leading companies • Base: essential, buy known to and practiced by
all competitors
Budget The amount of resources allocated for each type of technology, normally on an annual basis
Use of the matrix
The matrix gives a view of the situation of a company's portfolio (products 1 to 14) according to its annual budget. It is remarkable that as the technologies are more unknown the budget involved for a product or project increases in a great amount.
With the current portfolio the company is not probably securing its current position as the budget devoted to key technologies is very distributed among a set of small

Joe Tidd and John Bessant http://www.innovation-‐portal.info/ John Wiley and Sons Ltd
projects, while betting too much on new technologies. A redistribution of resources among technologies is probably the most logical approach.
References for further information
Roussel, Philip A, Saad, Kamal N and Erikson, Tamara J (1991): Third Generation R&D: Managing the Link to Corporate Strategy. Harvard Business School Press.
This book describes in detail several portfolio management approaches and how they are integrated in the overall R&D management of a company. The book can be used to learn how to apply some specific techniques in a certain context.
Websites: http://www.npd-‐solutions.com/portfolio.html