portfolio information as of june 30, 2017 - blackrock · schedule of investments (continued) active...
TRANSCRIPT

Portfolio Information as of June 30, 2017
Ten Largest HoldingsPercent ofNet Assets
Apple, Inc. . . . . . . . . . . . . . . . . . . . . . . . . . . . . . . . . . . . . . . . . 1%Tencent Holdings Ltd. . . . . . . . . . . . . . . . . . . . . . . . . . . . . . . . . 1Samsung Electronics Co. Ltd. . . . . . . . . . . . . . . . . . . . . . . . . . . 1Alphabet, Inc., Class A . . . . . . . . . . . . . . . . . . . . . . . . . . . . . . . 1Johnson & Johnson . . . . . . . . . . . . . . . . . . . . . . . . . . . . . . . . . 1Microsoft Corp. . . . . . . . . . . . . . . . . . . . . . . . . . . . . . . . . . . . . 1Bank of America Corp. . . . . . . . . . . . . . . . . . . . . . . . . . . . . . . . 1Exxon Mobil Corp. . . . . . . . . . . . . . . . . . . . . . . . . . . . . . . . . . . . 1Amazon.com, Inc. . . . . . . . . . . . . . . . . . . . . . . . . . . . . . . . . . . . 1Hon Hai Precision Industry Co. Ltd. . . . . . . . . . . . . . . . . . . . . . . 1
Sector AllocationPercent ofNet Assets
Information Technology . . . . . . . . . . . . . . . . . . . . . . . . . . . . . . . 22%Financials . . . . . . . . . . . . . . . . . . . . . . . . . . . . . . . . . . . . . . . . 16Consumer Discretionary . . . . . . . . . . . . . . . . . . . . . . . . . . . . . . 11Health Care . . . . . . . . . . . . . . . . . . . . . . . . . . . . . . . . . . . . . . . 10Industrials . . . . . . . . . . . . . . . . . . . . . . . . . . . . . . . . . . . . . . . . 10Consumer Staples . . . . . . . . . . . . . . . . . . . . . . . . . . . . . . . . . . 6Materials . . . . . . . . . . . . . . . . . . . . . . . . . . . . . . . . . . . . . . . . . 5Energy . . . . . . . . . . . . . . . . . . . . . . . . . . . . . . . . . . . . . . . . . . . 5Real Estate . . . . . . . . . . . . . . . . . . . . . . . . . . . . . . . . . . . . . . . 3Telecommunication Services . . . . . . . . . . . . . . . . . . . . . . . . . . . 3Utilities . . . . . . . . . . . . . . . . . . . . . . . . . . . . . . . . . . . . . . . . . . 2Short-Term Securities . . . . . . . . . . . . . . . . . . . . . . . . . . . . . . . . 11Liabilities in Excess of Other Assets . . . . . . . . . . . . . . . . . . . . . . (4)
For Master Portfolio compliance purposes, the Master Portfolio’s sector classi-fications refer to one or more of the sector sub-classifications used by one ormore widely recognized market indexes or ratings group indexes, and/or asdefined by the investment adviser. These definitions may not apply for purposes ofthis report, which may combine sector sub-classifications for reporting ease.
Derivative Financial Instruments
Active Stock Master Portfolio (the “Master Portfolio”) may invest in various derivative financial instruments. These instruments are used to obtain exposureto a security, commodity, index, market, and/or other asset without owning or taking physical custody of securities, commodities and/or other referencedassets or to manage market, equity, credit, interest rate, foreign currency exchange rate, commodity and/or other risks. Derivative financial instrumentsmay give rise to a form of economic leverage and involve risks, including the imperfect correlation between the value of a derivative financial instrumentand the underlying asset, possible default of the counterparty to the transaction or illiquidity of the instrument. The Master Portfolio’s successful use of aderivative financial instrument depends on the investment adviser’s ability to predict pertinent market movements accurately, which cannot be assured.The use of these instruments may result in losses greater than if they had not been used, may limit the amount of appreciation the Master Portfolio canrealize on an investment and/or may result in lower distributions paid to shareholders. The Master Portfolio’s investments in these instruments, if any, arediscussed in detail in the Notes to Financial Statements.
ACTIVE STOCK MASTER PORTFOLIO JUNE 30, 2017 1

Schedule of Investments (Unaudited) Active Stock Master Portfolio(Percentages shown are based on Net Assets)
Common Stocks Shares Value
Aerospace & Defense — 1.0%Boeing Co. 11,455 $ 2,265,226DigitalGlobe, Inc. (a) 3,568 118,814Engility Holdings, Inc. (a) 11,597 329,355HEICO Corp. (b) 111 7,974HEICO Corp., Class A 218 13,527Hexcel Corp. 423 22,330KLX, Inc. (a) 5,508 275,400Lockheed Martin Corp. 165 45,806Orbital ATK, Inc. 266 26,164Raytheon Co. 10,641 1,718,309Spirit Aerosystems Holdings, Inc., Class A 556 32,215United Technologies Corp. 2,937 358,637
5,213,757
Air Freight & Logistics — 0.5%Expeditors International of Washington, Inc. 7,019 396,433FedEx Corp. 1,307 284,050Hub Group, Inc., Class A (a) 15,835 607,272Radiant Logistics, Inc. (a) 33,620 180,876United Parcel Service, Inc., Class B 3,436 379,987XPO Logistics, Inc. (a)(b) 8,618 556,982
2,405,600
Airlines — 0.5%Aeroflot — Russian Airlines OJSC (a) 338,700 1,119,045Alaska Air Group, Inc. 546 49,009American Airlines Group, Inc. 4,350 218,892Copa Holdings SA, Class A 142 16,614Delta Air Lines, Inc. 7,795 418,903Hawaiian Holdings, Inc. (a) 12,845 603,073JetBlue Airways Corp. (a) 1,471 33,583Southwest Airlines Co. 1,619 100,605Spirit Airlines, Inc. (a) 326 16,838United Continental Holdings, Inc. (a) 1,365 102,716
2,679,278
Auto Components — 0.9%Adient PLC 419 27,394Allison Transmission Holdings, Inc. 578 21,681Autoliv, Inc. (b) 289 31,732BorgWarner, Inc. (b) 7,215 305,627Cooper-Standard Holding, Inc. (a) 2,404 242,491Delphi Automotive PLC 4,227 370,497Gentex Corp. 1,294 24,547Goodyear Tire & Rubber Co. 4,183 146,238Johnson Controls International PLC 9,647 418,294LCI Industries (b) 749 76,698Lear Corp. 5,633 800,337Tenneco, Inc. 28,743 1,662,208Tower International, Inc. 23,096 518,505Visteon Corp. (a) 156 15,921
4,662,170
Automobiles — 0.7%BAIC Motor Corp. Ltd. (c) 98,500 95,524Geely Automobile Holdings Ltd. 210,000 452,611General Motors Co. 2,541 88,757Hero MotoCorp Ltd. 14,663 839,005Kia Motors Corp. 7,758 259,083
Common Stocks Shares Value
Automobiles (continued)Mahindra & Mahindra Ltd. 9,550 $ 199,237Maruti Suzuki India Ltd. 8,915 994,723Thor Industries, Inc. (b) 3,505 366,343
3,295,283
Banks — 9.0%Akbank TAS 223,726 623,170Associated Banc-Corp 681 17,161Axis Bank Ltd. 44,738 357,761Banco Bradesco SA — ADR (b) 145,362 1,235,578Banco Bradesco SA, Preference Shares 98,190 834,329Bank of America Corp. 165,233 4,008,553Bank of China Ltd., Class H 1,365,000 669,350Bank of Hawaii Corp. (b) 194 16,096Bank of the Ozarks, Inc. 17,245 808,273Bank Rakyat Indonesia Persero Tbk PT 69,500 79,302BankUnited, Inc. 453 15,271Banner Corp. 6,843 386,698BOK Financial Corp. 117 9,843Cadence BanCorp (a)(b) 6,929 151,607Capital Bank Financial Corp., Class A 11,460 436,626Capital City Bank Group, Inc. 1,320 26,954Carolina Financial Corp. (b) 2,226 71,944Cathay General Bancorp 19,700 747,615Central Pacific Financial Corp. 33,089 1,041,311China Construction Bank Corp., Class H 3,625,000 2,818,965China Merchants Bank Co., Class H 239,000 720,198China Minsheng Banking Corp. Ltd., Class H 149,500 149,112CIMB Group Holdings Bhd 466,000 714,271Citigroup, Inc. 13,967 934,113Citizens Financial Group, Inc. 46,476 1,658,264Civista Bancshares, Inc. 1,083 22,613Columbia Banking System, Inc. (b) 10,565 421,015Commerce Bancshares, Inc. 398 22,618CTBC Financial Holding Co. Ltd. 3,878,000 2,541,896Cullen/Frost Bankers, Inc. (b) 242 22,726Dubai Islamic Bank PJSC 32,718 50,638Eagle Bancorp, Inc. (a) 7,550 477,915FCB Financial Holdings, Inc., Class A (a) 2,200 105,050First BanCorp, Puerto Rico (a) 24,086 139,458First Connecticut Bancorp, Inc. 4,863 124,736First Financial Holding Co. Ltd. 173,000 115,679First Financial Northwest, Inc. 5,884 94,909First Hawaiian, Inc. 111 3,399First Horizon National Corp. 35,278 614,543First Interstate Bancsystem, Inc., Class A 7,175 266,910First Merchants Corp. 31,636 1,269,869First Midwest Bancorp, Inc. 17,908 417,435First Republic Bank (b) 11,907 1,191,891Glacier Bancorp, Inc. (b) 25,923 949,041Hana Financial Group, Inc. 3,794 149,835HDFC Bank Ltd. — ADR 3,535 307,439Heritage Commerce Corp. 1,666 22,957Home BancShares, Inc. (b) 19,248 479,275Independent Bank Corp. 10,764 234,117IndusInd Bank Ltd. 18,423 421,204Industrial & Commercial Bank of China Ltd.,
Class H 1,919,000 1,295,099Itau Unibanco Holding SA, Preference Shares 113,200 1,255,728
Portfolio Abbreviations
ADR American Depositary ReceiptsGDR Global Depositary ReceiptNVDR Non-voting Depository ReceiptsPCL Public Company LimitedREIT Real Estate Investment Trust
See Notes to Financial Statements.
2 ACTIVE STOCK MASTER PORTFOLIO JUNE 30, 2017

Schedule of Investments (continued) Active Stock Master Portfolio
Common Stocks Shares Value
Banks (continued)Itau Unibanco Holding SA, Preference
Shares — ADR 145,824 $ 1,611,355JPMorgan Chase & Co. 23,143 2,115,270Lakeland Financial Corp. (b) 301 13,810Macatawa Bank Corp. 1,408 13,432Malayan Banking Bhd 296,500 665,081Mercantile Bank Corp. 889 27,986MutualFirst Financial, Inc. 343 12,245National Bank Holdings Corp., Class A 6,447 213,460PacWest Bancorp 542 25,311Popular, Inc. 468 19,520QCR Holdings, Inc. 2,094 99,256Regions Financial Corp. 3,541 51,840Republic Bancorp, Inc., Class A 1,720 61,404Sandy Spring Bancorp, Inc. 6,956 282,831Seacoast Banking Corp. of Florida (a) 14,827 357,331ServisFirst Bancshares, Inc. (b) 2,851 105,173Shinhan Financial Group Co. Ltd. 7,193 310,343South State Corp. (b) 6,084 521,399Standard Bank Group Ltd. 67,316 741,328SunTrust Banks, Inc. 813 46,113Synovus Financial Corp. 6,857 303,354TCF Financial Corp. 717 11,429Thanachart Capital PCL 140,400 189,947Turkiye Is Bankasi, Class C 1,092,406 2,313,164U.S. Bancorp 5,278 274,034Union Bankshares Corp. 13,934 472,363United Community Banks, Inc. (b) 24,379 677,736Webster Financial Corp. 373 19,478Wells Fargo & Co. 17,965 995,441Western Alliance Bancorp (a) 426 20,959Wintrust Financial Corp. 18,121 1,385,169
45,507,922
Beverages — 0.9%Brown-Forman Corp., Class A 248 12,226Coca-Cola Co. 22,088 990,647Dr. Pepper Snapple Group, Inc. (b) 16,922 1,541,764Molson Coors Brewing Co., Class B (b) 2,371 204,712PepsiCo, Inc. 13,643 1,575,630
4,324,979
Biotechnology — 2.8%AbbVie, Inc. 8,223 596,250ACADIA Pharmaceuticals, Inc. (a) 437 12,188Acorda Therapeutics, Inc. (a)(b) 5,300 104,410Agios Pharmaceuticals, Inc. (a) 161 8,283Akebia Therapeutics, Inc. (a) 965 13,867Alnylam Pharmaceuticals, Inc. (a) 342 27,278Amgen, Inc. 12,666 2,181,465AnaptysBio, Inc. (a) 3,404 81,458Applied Genetic Technologies Corp. (a) 7,310 37,281AquaBounty Technologies, Inc. (a) 3 24Arena Pharmaceuticals, Inc. (a) 11,521 194,359BioCryst Pharmaceuticals, Inc. (a) 8,171 45,431Biogen, Inc. (a) 4,520 1,226,547Bioverativ, Inc. (a) 501 30,145Bluebird Bio, Inc. (a)(b) 968 101,688Calithera Biosciences, Inc. (a)(b) 5,265 78,185Cascadian Therapeutics, Inc. (a)(b) 7,385 27,435Celgene Corp. (a)(b) 18,646 2,421,556ChemoCentryx, Inc. (a) 23,807 222,834China Biologic Products, Inc. (a) 1,951 220,658Clovis Oncology, Inc. (a) 692 64,792Conatus Pharmaceuticals, Inc. (a) 4,184 24,100Cytokinetics, Inc. (a) 7,843 94,900CytomX Therapeutics, Inc. (a) 16,647 258,029
Common Stocks Shares Value
Biotechnology (continued)Dimension Therapeutics, Inc. (a) 6,690 $ 9,701Emergent Biosolutions, Inc. (a)(b) 8,711 295,390Exact Sciences Corp. (a) 1,705 60,306Exelixis, Inc. (a) 9,188 226,300FibroGen, Inc. (a) 10,261 331,430Genomic Health, Inc. (a) 7,911 257,503Gilead Sciences, Inc. 36,518 2,584,744Halozyme Therapeutics, Inc. (a) 8,141 104,368Immune Design Corp. (a) 17,579 171,395Innoviva, Inc. (a)(b) 13,811 176,781Intellia Therapeutics, Inc. (a) 14,497 231,952Intercept Pharmaceuticals, Inc. (a) 75 9,080Intrexon Corp. (a)(b) 253 6,095Ionis Pharmaceuticals, Inc. (a) 550 27,979Ironwood Pharmaceuticals, Inc. (a) 19,037 359,419Jounce Therapeutics, Inc. (a)(b) 3,524 49,442Juno Therapeutics, Inc. (a) 287 8,578Kite Pharma, Inc. (a) 1,176 121,916Neurocrine Biosciences, Inc. (a) 392 18,032OPKO Health, Inc. (a)(b) 1,469 9,666PDL BioPharma, Inc. 9,000 22,230Pfenex, Inc. (a) 29,775 119,398Puma Biotechnology, Inc. (a) 1,816 158,718Ra Pharmaceuticals, Inc. (a)(b) 1,954 36,618Recro Pharma, Inc. (a) 16,974 119,327Retrophin, Inc. (a) 13,966 270,801Spectrum Pharmaceuticals, Inc. (a) 4,457 33,205United Therapeutics Corp. (a) 296 38,400Vanda Pharmaceuticals, Inc. (a) 16,273 265,250Vertex Pharmaceuticals, Inc. (a) 144 18,557Xencor, Inc. (a) 6,563 138,545
14,354,289
Building Products — 0.9%Apogee Enterprises, Inc. (b) 7,771 441,704Armstrong World Industries, Inc. (a) 212 9,752Builders FirstSource, Inc. (a) 758 11,613Fortune Brands Home & Security, Inc. 9,166 597,990Masco Corp. 40,999 1,566,572NCI Building Systems, Inc. (a) 2,555 42,668Owens Corning 523 34,999Ply Gem Holdings, Inc. (a) 17,551 315,040Universal Forest Products, Inc. 14,288 1,247,485USG Corp. (a)(b) 398 11,550
4,279,373
Capital Markets — 1.4%Ameriprise Financial, Inc. 1,596 203,155Artisan Partners Asset Management, Inc.,
Class A (b) 193 5,925Bank of New York Mellon Corp. 7,864 401,221BGC Partners, Inc., Class A 8,008 101,221Charles Schwab Corp. 5,342 229,493CME Group, Inc. 3,660 458,379Donnelley Financial Solutions, Inc. (a)(b) 119 2,732Eaton Vance Corp. 227 10,742Evercore Partners, Inc., Class A (b) 29,102 2,051,691Franklin Resources, Inc. 20,056 898,308Gain Capital Holdings, Inc. (b) 6,734 41,953Goldman Sachs Group, Inc. 2,395 531,451Hamilton Lane, Inc., Class A 5,681 124,925Houlihan Lokey, Inc. 17,098 596,720Invesco Ltd. 1,106 38,920Lazard Ltd., Class A 582 26,964Legg Mason, Inc. 444 16,943LPL Financial Holdings, Inc. 392 16,644Moelis & Co., Class A 17,441 677,583
See Notes to Financial Statements.
ACTIVE STOCK MASTER PORTFOLIO JUNE 30, 2017 3

Schedule of Investments (continued) Active Stock Master Portfolio
Common Stocks Shares Value
Capital Markets (continued)Morgan Stanley 4,095 $ 182,473Northern Trust Corp. 1,459 141,830SEI Investments Co. 2,899 155,908State Street Corp. 3,507 314,683TD Ameritrade Holding Corp. 671 28,846
7,258,710
Chemicals — 2.2%AdvanSix, Inc. (a) 1,863 58,200Air Products & Chemicals, Inc. 519 74,248Ashland Global Holdings, Inc. 283 18,652Axalta Coating Systems Ltd. (a) 1,443 46,234Cabot Corp. 25,345 1,354,183Celanese Corp., Series A 4,604 437,104Chemours Co. 2,354 89,264Dow Chemical Co. 8,039 507,020E.I. du Pont de Nemours & Co. 4,630 373,687Eastman Chemical Co. 17,947 1,507,368Ferro Corp. (a) 813 14,870FMC Corp. 875 63,919Hanwha Corp. 10,147 420,503Huntsman Corp. 905 23,385Innophos Holdings, Inc. 2,532 111,003Innospec, Inc. 4,882 320,015International Flavors & Fragrances, Inc. 1,400 189,000LyondellBasell Industries NV, Class A 6,871 579,844Monsanto Co. 2,256 267,020Mosaic Co. 1,726 39,405NewMarket Corp. 34 15,656Petronas Chemicals Group Bhd 237,900 393,484Platform Specialty Products Corp. (a)(b) 889 11,272PolyOne Corp. 19,047 737,881PPG Industries, Inc. 2,198 241,692Praxair, Inc. 1,707 226,263PTT Global Chemical PCL — NVDR 879,400 1,772,215RPM International, Inc. 595 32,457Scotts Miracle-Gro Co., Class A (b) 206 18,429Sensient Technologies Corp. 1,005 80,933Sinopec Shanghai Petrochemical Co. Ltd., — ADR 4,890 261,664Sinopec Shanghai Petrochemical Co. Ltd., Class H 122,000 65,286Stepan Co. 3,329 290,089Trinseo SA 2,781 191,055Valhi, Inc. 3,122 9,304Valvoline, Inc. 936 22,202Versum Materials, Inc. 448 14,560Westlake Chemical Corp. 173 11,454WR Grace & Co. 1,894 136,387
11,027,207
Commercial Services & Supplies — 0.7%ACCO Brands Corp. (a) 24,823 289,188ARC Document Solutions, Inc. (a) 40,688 169,262Brink’s Co. 5,212 349,204Casella Waste Systems, Inc., Class A (a) 12,243 200,908Ceco Environmental Corp. 11,361 104,294Clean Harbors, Inc. (a) 239 13,343Copart, Inc. (a) 893 28,389Covanta Holding Corp. (b) 532 7,023InnerWorkings, Inc. (a)(b) 20,792 241,187KAR Auction Services, Inc. 628 26,357Kimball International, Inc., Class B 13,806 230,422LSC Communications, Inc. (b) 9,748 208,607Pitney Bowes, Inc. 862 13,016Quad/Graphics, Inc. 6,859 157,208RR Donnelley & Sons Co. (b) 1,437 18,020Steelcase, Inc., Class A (b) 23,974 335,636Tetra Tech, Inc. 26,350 1,205,513
3,597,577
Common Stocks Shares Value
Communications Equipment — 0.6%Applied Optoelectronics, Inc. (a)(b) 733 $ 45,292ARRIS International PLC (a) 861 24,125Black Box Corp. 19,899 170,136Brocade Communications Systems, Inc. 1,829 23,064BYD Electronic International Co. Ltd. 92,000 182,366Calix, Inc. (a) 7,481 51,245Ciena Corp. (a) 16,955 424,214Cisco Systems, Inc. 34,482 1,079,287EchoStar Corp., Class A (a) 207 12,565Extreme Networks, Inc. (a) 10,214 94,173F5 Networks, Inc. (a) 765 97,201InterDigital, Inc. 8,263 638,730Juniper Networks, Inc. 3,572 99,587Motorola Solutions, Inc. 2,549 221,100NETGEAR, Inc. (a) 448 19,309Tessco Technologies, Inc. 885 11,771
3,194,165
Construction & Engineering — 0.7%AECOM (a) 696 22,502Chicago Bridge & Iron Co. NV 476 9,391China Communications Construction Co. Ltd.,
Class H 333,000 428,923China Railway Construction Corp. Ltd., Class H 120,000 156,435China Railway Group Ltd., Class H 1,040,000 819,109Comfort Systems USA, Inc. 10,762 399,270Hyundai Development Co-Engineering &
Construction 20,359 836,180KBR, Inc. (b) 651 9,908MasTec, Inc. (a) 18,659 842,454Metallurgical Corp. of China Ltd. 93,000 31,448MYR Group, Inc. (a) 498 15,448Quanta Services, Inc. (a) 658 21,661Tekfen Holding 25,596 63,441
3,656,170
Construction Materials — 0.6%Eagle Materials, Inc. 213 19,685Grasim Industries Ltd. 19,732 378,857Siam Cement PCL — NVDR 152,700 2,264,714UltraTech Cement Ltd. 1,561 95,562US Concrete, Inc. (a) 2,070 162,599
2,921,417
Consumer Discretionary — 0.0%SP Plus Corp. (a) 6,563 200,500
Consumer Finance — 0.3%American Express Co. 3,924 330,558Credit Acceptance Corp. (a)(b) 38 9,771Discover Financial Services 1,313 81,655Elevate Credit, Inc. (a)(b) 24,315 192,575Enova International, Inc. (a) 23,425 347,861Green Dot Corp., Class A (a) 3,695 142,368Navient Corp. 9,214 153,413OneMain Holdings, Inc. (a)(b) 242 5,951Santander Consumer USA Holdings, Inc. (a) 482 6,150SLM Corp. (a) 1,945 22,368Synchrony Financial 535 15,954
1,308,624
Containers & Packaging — 0.4%Aptargroup, Inc. 283 24,581Avery Dennison Corp. 5,175 457,315Bemis Co., Inc. 431 19,934Berry Global Group, Inc. (a) 575 32,781Crown Holdings, Inc. (a) 6,138 366,193Graphic Packaging Holding Co. 1,456 20,064
See Notes to Financial Statements.
4 ACTIVE STOCK MASTER PORTFOLIO JUNE 30, 2017

Schedule of Investments (continued) Active Stock Master Portfolio
Common Stocks Shares Value
Containers & Packaging (continued)Owens-Illinois, Inc. (a) 736 $ 17,605Packaging Corp. of America 4,225 470,623Silgan Holdings, Inc. (b) 4,649 147,745Sonoco Products Co. 453 23,293WestRock Co. 10,327 585,128
2,165,262
Distributors — 0.0%LKQ Corp. (a) 630 20,758Pool Corp. 184 21,633
42,391
Diversified Consumer Services — 0.3%Ascent Capital Group, Inc., Class A (a) 7,084 108,810Bridgepoint Education, Inc. (a) 8,427 124,383Capella Education Co. 3,619 309,786Graham Holdings Co., Class B 20 11,993Grand Canyon Education, Inc. (a) 1,667 130,709Regis Corp. (a) 38,460 394,984Service Corp. International 857 28,667ServiceMaster Global Holdings, Inc. (a) 619 24,259Weight Watchers International, Inc. (a)(b) 3,959 132,310
1,265,901
Diversified Financial Services — 1.5%Ayala Corp. 26,040 438,923Berkshire Hathaway, Inc., Class B (a) 10,987 1,860,868FactSet Research Systems, Inc. 183 30,411Interactive Brokers Group, Inc., Class A (b) 289 10,814Intercontinental Exchange, Inc. 26,309 1,734,289Kotak Mahindra Bank Ltd. 26,893 397,390MarketAxess Holdings, Inc. 167 33,584Moody’s Corp. (b) 3,764 458,003Morningstar, Inc. 82 6,424MSCI, Inc. 346 35,635Power Finance Corp. Ltd. 107,164 203,190Reliance Capital Ltd. 18,117 180,404S&P Global, Inc. 14,873 2,171,309Voya Financial, Inc. 254 9,370
7,570,614
Diversified Telecommunication Services — 1.6%AT&T, Inc. (b) 28,421 1,072,324CenturyLink, Inc. (b) 1,859 44,393China Communications Services Corp. Ltd., Class H 1,242,000 715,427China Telecom Corp. Ltd., Class H 1,058,000 502,405Chunghwa Telecom Co. Ltd. 38,000 134,805Cogent Communications Holdings, Inc. 11,568 463,877Fairpoint Communications, Inc. (a) 1,242 19,437Frontier Communications Corp. (b) 226,461 262,695Level 3 Communications, Inc. (a) 1,663 98,616LG Uplus Corp. 27,254 371,683Ooma, Inc. (a) 10,736 85,888Telefonica Brasil SA, Preference Shares 11,700 158,571Telekomunikasi Indonesia Persero Tbk PT 4,953,900 1,682,301Telekomunikasi Indonesia Persero Tbk PT — ADR 37,263 1,254,645Telkom SA SOC Ltd. 37,349 175,718Verizon Communications, Inc. 17,500 781,550Windstream Holdings, Inc. (b) 13,537 52,523
7,876,858
Electric Utilities — 0.8%American Electric Power Co., Inc. 2,078 144,359Avangrid, Inc. 257 11,346Duke Energy Corp. 3,530 295,073Edison International 1,586 124,009Eletropaulo Metropolitana Eletricidade de Sao
Paulo SA, Preference Shares 7,625 29,115
Common Stocks Shares Value
Electric Utilities (continued)Entergy Corp. 1,783 $ 136,881Exelon Corp. 6,347 228,936FirstEnergy Corp. 4,277 124,717Great Plains Energy, Inc. 983 28,782Hawaiian Electric Industries, Inc. 490 15,866Korea Electric Power Corp. 6,985 249,083NextEra Energy, Inc. 1,045 146,436Portland General Electric Co. 6,805 310,920Southern Co. 503 24,084Tenaga Nasional Bhd 169,700 559,088Transmissora Alianca de Energia Eletrica SA 2,299 15,295Westar Energy, Inc. 28,303 1,500,625Xcel Energy, Inc. 737 33,814
3,978,429
Electrical Equipment — 0.5%ABB India Ltd. 10,324 231,474Eaton Corp. PLC 2,692 209,518Emerson Electric Co. 4,484 267,336Hubbell, Inc. 251 28,406LS Corp. 1,698 108,246Regal-Beloit Corp. 203 16,555Rockwell Automation, Inc. (b) 11,312 1,832,092
2,693,627
Electronic Equipment, Instruments & Components — 2.5%Anixter International, Inc. (a) 1,878 146,860AU Optronics Corp. 188,000 85,811Benchmark Electronics, Inc. (a) 9,063 292,735CDW Corp. 1,979 123,747Cognex Corp. 371 31,498Dolby Laboratories, Inc., Class A 5,548 271,630Fitbit, Inc., Series A (a)(b) 576 3,058Flex Ltd. (a) 17,866 291,394Hon Hai Precision Industry Co. Ltd. 848,000 3,259,702Hon Hai Precision Industry Co. Ltd. — GDR 23,972 184,853Innolux Corp. 3,130,000 1,634,223Insight Enterprises, Inc. (a) 7,388 295,446IPG Photonics Corp. (a) 161 23,361Jabil, Inc. 854 24,928Kemet Corp. (a)(b) 23,754 304,051Keysight Technologies, Inc. (a) 844 32,857LG Display Co. Ltd. 5,280 170,766National Instruments Corp. (b) 472 18,984PC Connection, Inc. 2,496 67,542PCM, Inc. (a) 4,968 93,150Redington India Ltd. 61,526 124,610Sanmina Corp. (a) 37,667 1,435,113SYNNEX Corp. 3,836 460,166TE Connectivity Ltd. 10,532 828,658Tech Data Corp. (a) 17,895 1,807,395VeriFone Systems, Inc. (a) 500 9,050Zebra Technologies Corp., Class A (a) 8,459 850,299
12,871,887
Energy Equipment & Services — 0.5%Archrock, Inc. 15,694 178,912Baker Hughes, Inc. 3,271 178,302C&J Energy Services, Inc. (a) 3,666 125,634Core Laboratories NV 941 95,295Diamond Offshore Drilling, Inc. (a)(b) 11,800 127,794Dril-Quip, Inc. (a) 173 8,442Ensco PLC, Class A 1,377 7,105Exterran Corp. (a) 2,380 63,546Frank’s International NV 161 1,335Halliburton Co. 2,847 121,595Keane Group, Inc. (a)(b) 4,065 65,040
See Notes to Financial Statements.
ACTIVE STOCK MASTER PORTFOLIO JUNE 30, 2017 5

Schedule of Investments (continued) Active Stock Master Portfolio
Common Stocks Shares Value
Energy Equipment & Services (continued)Mammoth Energy Services, Inc. (a)(b) 8,895 $ 165,447Nabors Industries Ltd. 1,258 10,240NCS Multistage Holdings, Inc. (a)(b) 214 5,389Noble Corp. PLC (b) 37,216 134,722Oceaneering International, Inc. 447 10,209Patterson-UTI Energy, Inc. 744 15,021Pioneer Energy Services Corp. (a) 36,114 74,034Rowan Cos. PLC, Class A (a) 11,662 119,419RPC, Inc. 266 5,376Schlumberger Ltd. 8,927 587,754SEACOR Marine Holdings, Inc. (a)(b) 4,720 96,099Select Energy Services, Inc. (a) 2,831 34,397Solaris Oilfield Infrastructure, Inc., Class A (a)(b) 2,161 24,916Superior Energy Services, Inc. (a)(b) 12,060 125,786TechnipFMC PLC (a) 2,784 75,725TETRA Technologies, Inc. (a)(b) 20,781 57,979Transocean Ltd. (a) 1,576 12,970
2,528,483
Food & Staples Retailing — 1.1%Bid Corp. Ltd. 18,063 412,619BIM Birlesik Magazalar AS 4,212 78,093Casey’s General Stores, Inc. (b) 178 19,066Cia Brasileira de Distribuicao Grupo Pao de Acucar,
Preference Shares (a) 3,800 74,729Costco Wholesale Corp. 695 111,151CVS Health Corp. 2,970 238,966Diplomat Pharmacy, Inc. (a) 3,904 57,779Kroger Co. 3,823 89,152Performance Food Group Co. (a) 15,906 435,824President Chain Store Corp. 41,000 368,395Rite Aid Corp. (a) 4,692 13,841Sprouts Farmers Market, Inc. (a) 602 13,647Sysco Corp. 544 27,380U.S. Foods Holding Corp. (a) 204 5,553Wal-Mart de Mexico SAB de CV 168,459 391,056Wal-Mart Stores, Inc. 36,054 2,728,567Walgreens Boots Alliance, Inc. 4,050 317,156Whole Foods Market, Inc. 768 32,340
5,415,314
Food Products — 1.4%Archer-Daniels-Midland Co. 39,952 1,653,214Blue Buffalo Pet Products, Inc. (a) 272 6,204China Agri-Industries Holdings Ltd. 214,000 88,766Dean Foods Co. 26,406 448,902Flowers Foods, Inc. (b) 789 13,658Fresh Del Monte Produce, Inc. (b) 2,799 142,497General Mills, Inc. 52 2,881Hain Celestial Group, Inc. (a) 465 18,051Hershey Co. 5,648 606,426Indofood Sukses Makmur Tbk PT 60,300 38,934Ingredion, Inc. 7,313 871,783JBS SA 241,347 475,715Kellogg Co. 5,433 377,376Lamb Weston Holdings, Inc. 666 29,331M Dias Branco SA 20,500 305,065McCormick & Co., Inc. 670 65,332Mondelez International, Inc., Class A 11,832 511,024Pilgrim’s Pride Corp. (a) 270 5,918Pinnacle Foods, Inc. 527 31,304Post Holdings, Inc. (a) 293 22,751Tiger Brands Ltd. 17,912 503,605TreeHouse Foods, Inc. (a) 250 20,422Tyson Foods, Inc., Class A 888 55,615Uni-President Enterprises Corp. 272,000 545,179
6,839,953
Common Stocks Shares Value
Gas Utilities — 0.3%National Fuel Gas Co. (b) 336 $ 18,762ONE Gas, Inc. 1,046 73,021Southwest Gas Holdings, Inc. 15,414 1,126,147UGI Corp. 10,904 527,863
1,745,793
Health Care Equipment & Supplies — 1.9%ABIOMED, Inc. (a) 181 25,937Accuray, Inc. (a) 8,208 38,988Alere, Inc. (a) 761 38,195AngioDynamics, Inc. (a) 9,717 157,513Baxter International, Inc. 18,875 1,142,693Becton Dickinson & Co. 1,572 306,713Boston Scientific Corp. (a) 9,200 255,024C.R. Bard, Inc. 890 281,338Cantel Medical Corp. 5,353 417,052Cooper Cos., Inc. 432 103,429Cutera, Inc. (a) 13,079 338,746Danaher Corp. 3,812 321,695Edwards Lifesciences Corp. (a) 1,286 152,057Exactech, Inc. (a) 430 12,814Hill-Rom Holdings, Inc. 299 23,803IDEXX Laboratories, Inc. (a) 7,753 1,251,489Inogen, Inc. (a) 4,517 431,012K2M Group Holdings, Inc. (a) 730 17,783LeMaitre Vascular, Inc. 4,520 141,114Masimo Corp. (a) 30,420 2,773,696Medtronic PLC 5,479 486,261ResMed, Inc. (b) 200 15,574SeaSpine Holdings Corp. (a) 7,067 81,412Stryker Corp. 1,122 155,711SurModics, Inc. (a) 923 25,982Teleflex, Inc. 724 150,418Varex Imaging Corp. (a)(b) 175 5,915Varian Medical Systems, Inc. (a) 2,230 230,114West Pharmaceutical Services, Inc. 2,157 203,880Zimmer Biomet Holdings, Inc. 1,125 144,450
9,730,808
Health Care Providers & Services — 1.6%Acadia Healthcare Co., Inc. (a)(b) 333 16,444Aetna, Inc. 891 135,280AmerisourceBergen Corp. 5,193 490,894Anthem, Inc. 855 160,851Brookdale Senior Living, Inc. (a) 841 12,371Cigna Corp. 422 70,639Ensign Group, Inc. (b) 3,156 68,706Express Scripts Holding Co. (a) 7,571 483,333Five Star Senior Living, Inc. (a) 6,221 9,331Fleury SA 68,800 556,564HCA Holdings, Inc. (a) 6,514 568,021Henry Schein, Inc. (a) 183 33,493Humana, Inc. 288 69,299LHC Group, Inc. (a) 10,533 715,085LifePoint Health, Inc. (a) 170 11,415McKesson Corp. (b) 4,216 693,701National Research Corp., Class A (b) 2,146 57,727Netcare Ltd. 67,891 133,509Premier, Inc., Class A (a) 209 7,524Providence Service Corp. (a) 5,346 270,561Shanghai Pharmaceuticals Holding Co. Ltd.,
Class H 89,700 267,150Sinopharm Group Co. Ltd., Class H 30,000 135,537Tenet Healthcare Corp. (a) 366 7,078UnitedHealth Group, Inc. 14,949 2,771,844VCA, Inc. (a) 434 40,063WellCare Health Plans, Inc. (a) 202 36,271
7,822,691
See Notes to Financial Statements.
6 ACTIVE STOCK MASTER PORTFOLIO JUNE 30, 2017

Schedule of Investments (continued) Active Stock Master Portfolio
Common Stocks Shares Value
Health Care Technology — 0.3%athenahealth, Inc. (a) 178 $ 25,018Inovalon Holdings, Inc., Class A (a) 269 3,537Medidata Solutions, Inc. (a)(b) 12,164 951,225Quality Systems, Inc. (a) 1,770 30,462Veeva Systems, Inc., Class A (a) 7,732 474,049Vocera Communications, Inc. (a) 7,036 185,891
1,670,182
Hotels, Restaurants & Leisure — 1.8%Bloomin’ Brands, Inc. (b) 22,452 476,656Brinker International, Inc. (b) 225 8,573Caesars Entertainment Corp. (a)(b) 25,294 303,528Carnival Corp. 9,391 615,768Century Casinos, Inc. (a) 13,586 100,129Choice Hotels International, Inc. 10,874 698,655Domino’s Pizza, Inc. 608 128,610Dunkin’ Brands Group, Inc. 419 23,095Extended Stay America, Inc. 46,232 895,052Genting Bhd 232,700 510,097Hilton Grand Vacations, Inc. (a) 3,302 119,070Hyatt Hotels Corp., Class A (a) 149 8,375International Game Technology PLC 6,636 121,439La Quinta Holdings, Inc. (a) 1,991 29,407McDonald’s Corp. 16,840 2,579,214Monarch Casino & Resort, Inc. (a) 5,124 155,001Panera Bread Co., Class A (a) 102 32,093Papa John’s International, Inc. (b) 11,693 839,090Pinnacle Entertainment, Inc. (a) 6,920 136,739Royal Caribbean Cruises Ltd. 1,037 113,272Ruth’s Hospitality Group, Inc. 14,003 304,565Six Flags Entertainment Corp. (b) 327 19,492Starbucks Corp. 7,675 447,529Texas Roadhouse, Inc. (b) 1,685 85,851Wendy’s Co. 886 13,742Wyndham Worldwide Corp. 828 83,139Yum China Holdings, Inc. (a) 1,590 62,694Yum! Brands, Inc. 2,235 164,854
9,075,729
Household Durables — 1.5%Arcelik AS 76,829 568,912Beazer Homes USA, Inc. (a) 7,879 108,100CalAtlantic Group, Inc. 341 12,054Century Communities, Inc. (a) 22,647 561,645D.R. Horton, Inc. 10,907 377,055Garmin Ltd. (b) 1,220 62,257Haier Electronics Group Co. Ltd. (a) 462,000 1,201,155Hooker Furniture Corp. 638 26,254iRobot Corp. (a)(b) 9,387 789,822Leggett & Platt, Inc. 1,770 92,978Lennar Corp., Class B (b) 45 2,024LG Electronics, Inc. 31,545 2,213,053Lifetime Brands, Inc. 649 11,779M/I Homes, Inc. (a) 2,969 84,765Mohawk Industries, Inc. (a) 42 10,151Taylor Morrison Home Corp., Class A (a) 35,374 849,330Tempur Sealy International, Inc. (a) 215 11,479TopBuild Corp. (a) 1,985 105,344Tupperware Brands Corp. 229 16,083UCP, Inc., Class A (a) 10,647 116,585Whirlpool Corp. 748 143,332
7,364,157
Household Products — 1.2%Central Garden & Pet Co. (a) 5,112 162,510Central Garden & Pet Co., Class A (a) 1,805 54,186Colgate-Palmolive Co. 8,148 604,011
Common Stocks Shares Value
Household Products (continued)Energizer Holdings, Inc. 23,731 $ 1,139,563Hindustan Unilever Ltd. 146,883 2,452,486Procter & Gamble Co. 14,720 1,282,848Unilever Indonesia Tbk PT 97,700 357,739
6,053,343
Independent Power and Renewable Electricity Producers — 0.3%AES Corp. 32,266 358,475Engie Brasil Energia SA 44,400 454,601Glow Energy PCL — NVDR 128,200 297,097NRG Energy, Inc. 1,438 24,762NRG Yield, Inc., Class A 15,208 259,448Ormat Technologies, Inc. 5,132 301,146
1,695,529
Industrial Conglomerates — 1.1%3M Co. 14,800 3,081,212Alliance Global Group, Inc. 622,800 176,432BWX Technologies, Inc. 426 20,768Carlisle Cos., Inc. 286 27,284General Electric Co. 39,765 1,074,053Honeywell International, Inc. 4,322 576,079KOC Holding AS 57,330 263,560Raven Industries, Inc. 11,058 368,231
5,587,619
Insurance — 3.0%Aflac, Inc. 17,663 1,372,062Allied World Assurance Co. Holdings AG 399 21,107Allstate Corp. 1,045 92,420American International Group, Inc. 7,727 483,092American National Insurance Co. 33 3,844AmTrust Financial Services, Inc. (b) 400 6,056Aon PLC 3,762 500,158Argo Group International Holdings Ltd. 6,045 366,327Aspen Insurance Holdings Ltd. 274 13,659Assurant, Inc. 960 99,542Assured Guaranty Ltd. 565 23,583Athene Holding Ltd., Class A (a)(b) 198 9,823Axis Capital Holdings Ltd. 40 2,586Baldwin & Lyons, Inc., Class B 6,759 165,596Brown & Brown, Inc. 531 22,870Cathay Financial Holding Co. Ltd. 237,000 390,108CNA Financial Corp. 124 6,045Erie Indemnity Co., Class A 111 13,883First American Financial Corp. 19,197 857,914FNF Group 2,840 127,317Hanover Insurance Group, Inc. 193 17,106Hyundai Marine & Fire Insurance Co. Ltd. 2,038 70,097Infinity Property & Casualty Corp. 4,866 457,404James River Group Holdings Ltd. 13,035 517,881Lincoln National Corp. 20,541 1,388,161Marsh & McLennan Cos., Inc. 22,625 1,763,845Mercury General Corp. (b) 124 6,696MetLife, Inc. 5,061 278,051Old Republic International Corp. 1,104 21,561Ping An Insurance Group Co. of China Ltd., Class H 279,500 1,841,177Principal Financial Group, Inc. 54 3,460ProAssurance Corp. 240 14,592Prudential Financial, Inc. 22,431 2,425,688Reinsurance Group of America, Inc. 124 15,920Sanlam Ltd. 25,229 124,956Selective Insurance Group, Inc. 8,346 417,717Travelers Cos., Inc. 1,674 211,811Unum Group 3,485 162,506Validus Holdings Ltd. 343 17,826White Mountains Insurance Group Ltd. 19 16,504
See Notes to Financial Statements.
ACTIVE STOCK MASTER PORTFOLIO JUNE 30, 2017 7

Schedule of Investments (continued) Active Stock Master Portfolio
Common Stocks Shares Value
Insurance (continued)Willis Towers Watson PLC 617 $ 89,749XL Group Ltd. 12,329 540,010
14,980,710
Internet & Direct Marketing Retail — 1.5%Alibaba Group Holding Ltd. — ADR (a)(b) 22,404 3,156,723Amazon.com, Inc. (a) 3,719 3,599,992Blue Apron Holdings, Inc. (a) 20,022 187,005Expedia, Inc. 365 54,367Groupon, Inc. (a)(b) 1,672 6,420Liberty Expedia Holdings, Inc., Class A (a) 243 13,127Liberty Ventures, Series A (a) 365 19,086Netflix, Inc. (a) 1,275 190,498Overstock.com, Inc. (a) 19,229 313,433Priceline Group, Inc. (a) 69 129,066U.S. Auto Parts Network, Inc. (a) 2,909 9,396
7,679,113
Internet Software & Services — 5.0%Alphabet, Inc., Class A (a) 4,696 4,365,777Alphabet, Inc., Class C (a) 2,478 2,251,833Appfolio, Inc., Class A (a) 823 26,830Autohome, Inc. — ADR (a) 18,913 857,894Bankrate, Inc. (a) 21,737 279,320Box, Inc., Class A (a) 9,021 164,543Care.com, Inc. (a) 8,815 133,106Cars.com, Inc. (a) 331 8,815CommerceHub, Inc., Series A (a) 58 1,010CommerceHub, Inc., Series C (a) 128 2,232Cornerstone OnDemand, Inc. (a) 15,463 552,802DHI Group, Inc. (a) 8,808 25,103eBay, Inc. (a) 8,402 293,398Endurance International Group Holdings, Inc. (a) 12,467 104,099Facebook, Inc., Class A (a) 19,754 2,982,459Five9, Inc. (a) 5,712 122,922GoDaddy, Inc., Class A (a) 213 9,035Gogo, Inc. (a)(b) 5,084 58,618GrubHub, Inc. (a) 925 40,330IAC/InterActiveCorp (a) 321 33,140Limelight Networks, Inc. (a) 19,980 57,742LivePerson, Inc. (a) 9,019 99,209Match Group, Inc. (a)(b) 132 2,294MercadoLibre, Inc. 709 177,874NetEase, Inc. — ADR (b) 8,957 2,692,743New Relic, Inc. (a) 889 38,236NIC, Inc. (b) 15,585 295,336Nutanix, Inc., Class A (a)(b) 6,141 123,741Pandora Media, Inc. (a)(b) 1,005 8,965Tencent Holdings Ltd. 181,700 6,518,476Trade Desk, Inc., Class A (a)(b) 911 45,650Twilio, Inc. (a)(b) 89 2,591VeriSign, Inc. (a)(b) 8,679 806,800Yandex NV, Class A (a) 71,687 1,881,067Yelp, Inc. (a)(b) 6,280 188,526YuMe, Inc. 47,711 224,242Zillow Group, Inc., Class A (a) 234 11,429
25,488,187
IT Services — 2.9%Accenture PLC, Class A 14,991 1,854,087Acxiom Corp. (a) 6,220 161,596Amdocs Ltd. 676 43,575Black Knight Financial Services, Inc., Class A (a) 106 4,341Booz Allen Hamilton Holding Corp. 23,540 765,992Conduent, Inc. (a) 919 14,649Convergys Corp. (b) 28,797 684,793CoreLogic, Inc. (a) 383 16,614
Common Stocks Shares Value
IT Services (continued)CSG Systems International, Inc. 23,963 $ 972,418CSRA, Inc. 747 23,717DST Systems, Inc. 284 17,523DXC Technology Co. 1,414 108,482Euronet Worldwide, Inc. (a) 228 19,920Everi Holdings, Inc. (a) 20,577 149,801Fidelity National Information Services, Inc. 13,048 1,114,299FleetCor Technologies, Inc. (a) 90 12,979Forrester Research, Inc. 515 20,162Genpact Ltd. 48,276 1,343,521Hackett Group, Inc. 26,016 403,248HCL Technologies Ltd. 6,188 81,452International Business Machines Corp. 6,162 947,900Mantech International Corp., Class A 7,342 303,812Mastercard, Inc., Class A 24,446 2,968,967PayPal Holdings, Inc. (a) 2,185 117,269SK Holdings Co. Ltd. 645 156,780Square, Inc., Class A (a) 236 5,537Tata Consultancy Services Ltd. 29,168 1,065,389Tech Mahindra Ltd. 16,181 95,565Teradata Corp. (a) 592 17,458Travelport Worldwide Ltd. 10,964 150,865Unisys Corp. (a) 23,819 304,883Visa, Inc., Class A 4,543 426,042Western Union Co. 18,196 346,634WEX, Inc. (a) 176 18,351
14,738,621
Leisure Products — 0.5%Brunswick Corp. 413 25,907Hasbro, Inc. 15,690 1,749,592Malibu Boats, Inc. (a)(b) 10,362 268,065MCBC Holdings, Inc. (a) 13,942 272,566Vista Outdoor, Inc. (a) 260 5,853
2,321,983
Life Sciences Tools & Services — 0.6%Agilent Technologies, Inc. 2,749 163,043Bio-Rad Laboratories, Inc., Class A (a) 95 21,499Bio-Techne Corp. 168 19,740Bruker Corp. 478 13,786Cambrex Corp. (a) 4,711 281,482Charles River Laboratories International, Inc. (a) 213 21,545Enzo Biochem, Inc. (a) 22,682 250,409Harvard Bioscience, Inc. (a) 20,250 51,638INC Research Holdings, Inc., Class A (a) 6,765 395,753Luminex Corp. 12,871 271,836Mettler-Toledo International, Inc. (a) 526 309,572NanoString Technologies, Inc. (a) 5,086 84,122PAREXEL International Corp. (a) 2,899 251,952Patheon NV (a) 147 5,127PerkinElmer, Inc. 495 33,729PRA Health Sciences, Inc. (a) 5,179 388,477QIAGEN NV (a) 1,002 33,597Thermo Fisher Scientific, Inc. 1,286 224,368VWR Corp. (a) 356 11,752Waters Corp. (a) 861 158,286
2,991,713
Machinery — 2.2%AGCO Corp. 6,425 432,981Alamo Group, Inc. 4,549 413,095Barnes Group, Inc. 8,170 478,190Briggs & Stratton Corp. 25,380 611,658Caterpillar, Inc. 1,979 212,663Chart Industries, Inc. (a) 2,503 86,929Colfax Corp. (a) 449 17,677
See Notes to Financial Statements.
8 ACTIVE STOCK MASTER PORTFOLIO JUNE 30, 2017

Schedule of Investments (continued) Active Stock Master Portfolio
Common Stocks Shares Value
Machinery (continued)Commercial Vehicle Group, Inc. (a)(b) 8,444 $ 71,352Crane Co. 222 17,622Cummins India Ltd. 8,763 124,678Cummins, Inc. 1,075 174,387Deere & Co. 63 7,786Donaldson Co., Inc. 579 26,368Dover Corp. 872 69,952Flowserve Corp. (b) 1,095 50,841Fortive Corp. 1,298 82,228Global Brass & Copper Holdings, Inc. 1,590 48,575Graco, Inc. 252 27,539Harsco Corp. (a) 20,186 324,995Hyundai Heavy Industries Co. Ltd. (a) 360 55,659IDEX Corp. 217 24,523Illinois Tool Works, Inc. 10,684 1,530,483Ingersoll-Rand PLC 15,924 1,455,294ITT, Inc. 412 16,554Kadant, Inc. 4,526 340,355Lincoln Electric Holdings, Inc. 279 25,693Miller Industries, Inc. 821 20,402Mueller Water Products, Inc., Series A 93,185 1,088,401Nordson Corp. 260 31,543Oshkosh Corp. 332 22,868PACCAR, Inc. 17,220 1,137,209Stanley Black & Decker, Inc. 3,395 477,778Terex Corp. 457 17,138Timken Co. 321 14,846Toro Co. 488 33,814Trinity Industries, Inc. 682 19,116Valmont Industries, Inc. 101 15,110WABCO Holdings, Inc. (a) 4,186 533,757Weichai Power Co. Ltd., Class H 378,000 330,332Welbilt, Inc. (a)(b) 577 10,876Woodward, Inc. 3,273 221,189Xylem, Inc. 4,196 232,584
10,935,040
Marine — 0.0%Kirby Corp. (a) 241 16,111
Media — 1.8%AH Belo Corp., Class A 9,597 52,784AMC Networks, Inc., Class A (a) 250 13,353Astro Malaysia Holdings Bhd 246,500 145,282Cable One, Inc. 21 14,929CBS Corp., Class B 690 44,008Charter Communications, Inc., Class A (a) 31 10,442Cinemark Holdings, Inc. (b) 484 18,803Clear Channel Outdoor Holdings, Inc., Class A 159 771Comcast Corp., Class A 71,535 2,784,142Discovery Communications, Inc., Class A (a) 8,538 220,537Discovery Communications, Inc., Class C (a) 1,185 29,874Eros International PLC (a)(b) 3,954 45,273Hemisphere Media Group, Inc. (a) 3,076 36,451Interpublic Group of Cos., Inc. 39,247 965,476John Wiley & Sons, Inc., Class A 203 10,708Lee Enterprises, Inc. (a)(b) 16,285 30,942Liberty Broadband Corp., Class A (a) 116 9,952Liberty Global PLC, Class A (a) 11,620 373,234Lions Gate Entertainment Corp., Class A (a) 214 6,039Lions Gate Entertainment Corp., Class B (a) 475 12,483Live Nation Entertainment, Inc. (a) 599 20,875Madison Square Garden Co., Class A (a) 88 17,327McClatchy Co., Class A (a) 3,438 32,111Meredith Corp. (b) 16,843 1,001,316Naspers Ltd., Class N 2,472 486,818New Media Investment Group, Inc. (b) 2,658 35,830News Corp., Class B 555 7,853
Common Stocks Shares Value
Media (continued)Omnicom Group, Inc. (b) 2,911 $ 241,322Regal Entertainment Group, Class A (b) 369 7,550Scripps Networks Interactive, Inc., Class A (b) 6,323 431,924Smiles SA 12,723 231,886TEGNA, Inc. 993 14,309Thomson Reuters Corp. 1,371 63,464Time Warner, Inc. 9,637 967,651Tribune Media Co., Class A 334 13,617Twenty-First Century Fox, Inc., Class A 2,268 64,275Viacom, Inc., Class A 46 1,750Viacom, Inc., Class B 1,559 52,336Walt Disney Co. 5,960 633,250
9,150,947
Metals & Mining — 1.5%Alcoa Corp. 669 21,843Alrosa PJSC 292,100 428,851Anglo American PLC (a) 43,911 588,334AngloGold Ashanti Ltd. 28,131 274,671AngloGold Ashanti Ltd., — ADR 29,522 286,954Carpenter Technology Corp. 3,627 135,759Compass Minerals International, Inc. (b) 154 10,056Eregli Demir ve Celik Fabrikalari TAS 237,768 476,300Gold Fields Ltd. 34,082 117,206Gold Fields Ltd. — ADR 68,368 237,921Harmony Gold Mining Co. Ltd. 37,870 62,580Harmony Gold Mining Co. Ltd. — ADR 13,217 21,808Highland Gold Mining Ltd. 40,833 75,307Industrias Penoles SAB de CV 13,865 312,866Magnitogorsk Iron & Steel Works OJSC 514,600 290,853Newmont Mining Corp. 20,445 662,214Polymetal International PLC 28,393 318,408Poongsan Corp. 10,359 389,267POSCO 1,950 488,459Real Industry, Inc. (a) 12,849 37,262Reliance Steel & Aluminum Co. 596 43,395Royal Gold, Inc. 297 23,216Ryerson Holding Corp. (a) 6,279 62,162Schnitzer Steel Industries, Inc., Class A 34,514 869,753Severstal PJSC 5,570 72,998Southern Copper Corp. (b) 382 13,229SunCoke Energy, Inc. (a) 1,808 19,707Tahoe Resources, Inc. 1,373 11,835United States Steel Corp. 703 15,564Vale SA, Preference Shares 57,600 467,873Vedanta Ltd. 16,454 63,256Worthington Industries, Inc. 14,452 725,779
7,625,686
Multi-Utilities — 1.0%Ameren Corp. 1,617 88,401Avista Corp. 10,629 451,307CenterPoint Energy, Inc. 4,828 132,191CMS Energy Corp. 33,265 1,538,506Consolidated Edison, Inc. 1,270 102,642DTE Energy Co. 490 51,837MDU Resources Group, Inc. 886 23,213NorthWestern Corp. 24,706 1,507,560PG&E Corp. 1,297 86,082Public Service Enterprise Group, Inc. 2,240 96,342Sempra Energy 4,141 466,898Vectren Corp. 4,874 284,837
4,829,816
Multiline Retail — 0.7%Big Lots, Inc. (b) 19,297 932,045Burlington Stores, Inc. (a) 321 29,529Dillard’s, Inc., Class A (b) 76 4,385
See Notes to Financial Statements.
ACTIVE STOCK MASTER PORTFOLIO JUNE 30, 2017 9

Schedule of Investments (continued) Active Stock Master Portfolio
Common Stocks Shares Value
Multiline Retail (continued)Dollar General Corp. 504 $ 36,333JC Penney Co., Inc. (a)(b) 1,405 6,533Macy’s, Inc. 3,870 89,939Matahari Department Store Tbk PT 685,300 728,797Nordstrom, Inc. (b) 2,222 106,278Target Corp. 29,684 1,552,176
3,486,015
Oil & Gas Exploration & Production — 0.1%Carrizo Oil & Gas, Inc. (a) 23,957 417,331
Oil, Gas & Consumable Fuels — 4.1%Abraxas Petroleum Corp. (a) 13,009 21,075Alon USA Energy, Inc. 3,323 44,262Anadarko Petroleum Corp. 18,939 858,694Apache Corp. (b) 1,198 57,420Approach Resources, Inc. (a)(b) 17,222 58,038Bill Barrett Corp. (a)(b) 56,147 172,371Chesapeake Energy Corp. (a)(b) 2,779 13,812Chevron Corp. 11,875 1,238,919China Petroleum & Chemical Corp., — ADR 23,493 1,846,550China Petroleum & Chemical Corp., Class H 3,050,000 2,388,155China Shenhua Energy Co. Ltd., Class H 55,500 123,480Cimarex Energy Co. 38 3,572CNOOC Ltd. (b) 625,000 685,775ConocoPhillips 44,732 1,966,419CONSOL Energy, Inc. (a) 1,036 15,478Continental Resources, Inc. (a)(b) 6,686 216,158Devon Energy Corp. 22,797 728,820Eclipse Resources Corp. (a) 49,750 142,285Energen Corp. (a) 443 21,871Energy XXI Gulf Coast, Inc. (a)(b) 1,080 20,056EOG Resources, Inc. 652 59,019EP Energy Corp., Class A (a)(b) 23,334 85,402Evolution Petroleum Corp. 3,566 28,885Extraction Oil & Gas, Inc. (a) 197 2,650Exxon Mobil Corp. 45,561 3,678,140Gulfport Energy Corp. (a) 726 10,709Halcon Resources Corp. (a) 6,133 27,844Hess Corp. (b) 624 27,375Kosmos Energy Ltd. (a) 717 4,596Laredo Petroleum, Inc. (a) 656 6,901Linn Energy, Inc. (a)(b) 2,640 80,626Marathon Oil Corp. (b) 420 4,977Marathon Petroleum Corp. 2,043 106,910Murphy USA, Inc. (a) 158 11,709Noble Energy, Inc. 5,115 144,755Northern Oil and Gas, Inc. (a)(b) 49,334 69,068Oil & Natural Gas Corp. Ltd. 57,009 138,655Overseas Shipholding Group, Inc., Class A (a)(b) 54,841 145,877Pacific Ethanol, Inc. (a)(b) 37,761 236,006PBF Energy, Inc., Class A (b) 497 11,063Petroleo Brasileiro SA, Preference Shares (a) 26,900 100,442Petronet LNG Ltd. 12,386 82,713Phillips 66 5,352 442,557Polski Koncern Naftowy ORLEN SA 15,675 473,476PTT PCL — NVDR 80,300 873,874QEP Resources, Inc. (a) 1,091 11,019Renewable Energy Group, Inc. (a)(b) 18,191 235,573REX American Resources Corp. (a) 323 31,189SK Innovation Co. Ltd. 2,095 290,150SM Energy Co. (b) 441 7,290Southwestern Energy Co. (a) 2,235 13,589Star Petroleum Refining PCL 896,900 385,237Tellurian, Inc. (a)(b) 2,174 21,805Tesoro Corp. 440 41,184Thai Oil PCL — NVDR 162,500 377,734Ultra Petroleum Corp. (a) 11,062 120,023
Common Stocks Shares Value
Oil, Gas & Consumable Fuels (continued)Valero Energy Corp. 26,527 $ 1,789,511Whiting Petroleum Corp. (a)(b) 920 5,069Williams Cos., Inc. 1,612 48,811World Fuel Services Corp. 316 12,150WPX Energy, Inc. (a) 1,755 16,953
20,884,726
Paper & Forest Products — 0.6%Boise Cascade Co. (a) 7,421 225,598Domtar Corp. (b) 2,515 96,626Mondi Ltd. 42,658 1,104,779Nine Dragons Paper Holdings Ltd. 253,000 336,917Sappi Ltd. 187,616 1,248,544
3,012,464
Personal Products — 0.9%Edgewell Personal Care Co. (a)(b) 269 20,449Estee Lauder Cos., Inc., Class A 13,871 1,331,339Godrej Consumer Products Ltd. 16,401 245,457Herbalife Ltd. (a)(b) 778 55,495Hypermarcas SA 258,700 2,170,865Inter Parfums, Inc. 12,582 461,130Marico Ltd. 28,881 140,356Natural Health Trends Corp. (b) 427 11,892Nu Skin Enterprises, Inc., Class A 237 14,893
4,451,876
Pharmaceuticals — 2.7%Akorn, Inc. (a) 383 12,846Aurobindo Pharma Ltd. 29,957 317,061Bristol-Myers Squibb Co. 17,727 987,748Cadila Healthcare Ltd. 8,508 69,073Catalent, Inc. (a) 32,668 1,146,647Corcept Therapeutics, Inc. (a) 32,563 384,243Eli Lilly & Co. 5,787 476,270Endo International PLC (a) 935 10,444Heska Corp. (a) 2,395 244,458Johnson & Johnson 31,663 4,188,698Merck & Co., Inc. 24,962 1,599,815Mylan NV (a) 133 5,163Pfizer Ltd. (a) 2,143 59,906Pfizer, Inc. 38,747 1,301,512Phibro Animal Health Corp., Class A 4,587 169,948Prestige Brands Holdings, Inc. (a) 19,290 1,018,705Supernus Pharmaceuticals, Inc. (a) 4,016 173,090Zoetis, Inc. 27,328 1,704,721
13,870,348
Professional Services — 0.6%Dun & Bradstreet Corp. 166 17,953Insperity, Inc. 16,984 1,205,864ManpowerGroup, Inc. (b) 13,928 1,555,061Nielsen Holdings PLC 57 2,204Paylocity Holding Corp. (a) 5,412 244,514Robert Half International, Inc. 343 16,440TransUnion (a) 242 10,481
3,052,517
Real Estate Investment Trusts (REITs) — 3.1%American Campus Communities, Inc. 597 28,238American Homes 4 Rent, Class A 812 18,327American Tower Corp. 4,145 548,466Apartment Investment & Management Co., Class A 711 30,552Apple Hospitality REIT, Inc. 750 14,032Arbor Realty Trust, Inc. 49,255 410,787Ares Commercial Real Estate Corp. 3,428 44,873Armada Hoffler Properties, Inc. 5,261 68,130Ashford Hospitality Prime, Inc. 27,220 280,094
See Notes to Financial Statements.
10 ACTIVE STOCK MASTER PORTFOLIO JUNE 30, 2017

Schedule of Investments (continued) Active Stock Master Portfolio
Common Stocks Shares Value
Real Estate Investment Trusts (REITs) (continued)Brandywine Realty Trust 785 $ 13,761Brixmor Property Group, Inc. 63,258 1,131,053Care Capital Properties, Inc. 383 10,226Catchmark Timber Trust, Inc., Class A 12,505 142,182Cherry Hill Mortgage Investment Corp. (b) 695 12,837Chimera Investment Corp. 856 15,947Columbia Property Trust, Inc. 565 12,645CoreCivic, Inc. 533 14,700Coresite Realty Corp. 4,866 503,777Corporate Office Properties Trust 431 15,098CubeSmart 810 19,472CyrusOne, Inc. 356 19,847DCT Industrial Trust, Inc. 411 21,964DDR Corp. 1,405 12,743DiamondRock Hospitality Co. (b) 31,714 347,268Douglas Emmett, Inc. 638 24,378DuPont Fabros Technology, Inc. 799 48,867Easterly Government Properties, Inc. 2,740 57,403Empire State Realty Trust, Inc., Class A 554 11,507EPR Properties 288 20,699Equinix, Inc. 453 194,409Equity Lifestyle Properties, Inc. 349 30,133Equity Residential 725 47,727First Industrial Realty Trust, Inc. 10,952 313,446Forest City Realty Trust, Inc., Class A 1,043 25,209Gaming and Leisure Properties, Inc. 6,920 260,676Healthcare Trust of America, Inc., Class A 617 19,195Hersha Hospitality Trust (b) 9,313 172,384Highwoods Properties, Inc. 437 22,160Host Hotels & Resorts, Inc. 11,245 205,446Invitation Homes, Inc. 406 8,782Kilroy Realty Corp. 437 32,841Lamar Advertising Co., Class A 374 27,515Life Storage, Inc. 209 15,487MFA Financial, Inc. 1,689 14,171New Residential Investment Corp. 2,257 35,119Omega Healthcare Investors, Inc. (b) 841 27,770One Liberty Properties, Inc. 7,524 176,287Outfront Media, Inc. 17,307 400,138Paramount Group, Inc. 823 13,168Park Hotels & Resorts, Inc. 519 13,992Piedmont Office Realty Trust, Inc., Class A 661 13,934Preferred Apartment Communities, Inc., Class A 4,736 74,592Prologis, Inc. 2,323 136,221PS Business Parks, Inc. 11,711 1,550,419Public Storage 518 108,019QTS Realty Trust, Inc., Class A 14,847 776,943Quality Care Properties, Inc. (a) 425 7,782Ramco-Gershenson Properties Trust 87,025 1,122,622Rayonier, Inc. 560 16,111Retail Opportunity Investments Corp. 14,093 270,445Retail Properties of America, Inc., Class A 1,084 13,236RLJ Lodging Trust 20,896 415,203Ryman Hospitality Properties, Inc. 11,980 766,840Simon Property Group, Inc. 861 139,275Spirit Realty Capital, Inc. 2,190 16,228Starwood Property Trust, Inc. 1,142 25,569STORE Capital Corp. 777 17,444Summit Hotel Properties, Inc. 35,374 659,725Sun Communities, Inc. 306 26,833Tanger Factory Outlet Centers, Inc. 426 11,067Taubman Centers, Inc. 267 15,900Terreno Realty Corp. 33,600 1,130,976Two Harbors Investment Corp. 1,579 15,648Uniti Group, Inc. 558 14,028Urban Edge Properties 6,566 155,811Ventas, Inc. 22,627 1,572,124
Common Stocks Shares Value
Real Estate Investment Trusts (REITs) (continued)Weingarten Realty Investors 27,181 $ 818,148WP Carey, Inc. 473 31,223
15,878,294
Real Estate Management & Development — 0.6%Ayala Land, Inc. 84,100 66,256CBRE Group, Inc., Class A (a) 7,112 258,877China Overseas Land & Investment Ltd. 284,000 831,146China Resources Land Ltd. 262,000 763,276China Vanke Co. Ltd., Class H 139,900 395,718Emaar Properties PJSC 92,335 194,778Howard Hughes Corp. (a) 165 20,269Jones Lang LaSalle, Inc. 700 87,500KWG Property Holding Ltd. 115,000 77,035Realogy Holdings Corp. 660 21,417Sino-Ocean Land Holdings Ltd. 372,500 182,198Yuexiu Property Co. Ltd. 1,094,000 186,280
3,084,750
Road & Rail — 0.3%ArcBest Corp. 6,083 125,310Avis Budget Group, Inc. (a) 355 9,681CSX Corp. 146 7,966Genesee & Wyoming, Inc., Class A (a) 277 18,944Hertz Global Holdings, Inc. (a) 330 3,795Kansas City Southern 793 82,987Landstar System, Inc. 193 16,521Norfolk Southern Corp. 768 93,466Old Dominion Freight Line, Inc. 308 29,334Ryder System, Inc. 244 17,563Union Pacific Corp. 8,300 903,953USA Truck, Inc. (a) 10,299 89,189
1,398,709
Semiconductors & Semiconductor Equipment — 3.2%Advanced Energy Industries, Inc. (a) 9,297 601,423Alpha & Omega Semiconductor Ltd. (a) 14,727 245,499Amkor Technology, Inc. (a) 10,587 103,435Analog Devices, Inc. 2,228 173,338Applied Materials, Inc. 6,172 254,965Broadcom Ltd. 213 49,640Brooks Automation, Inc. 11,963 259,478Cabot Microelectronics Corp. 3,789 279,742Cree, Inc. (a) 454 11,191Cypress Semiconductor Corp. (b) 1,423 19,424Diodes, Inc. (a) 2,780 66,803Entegris, Inc. (a) 50,500 1,108,475First Solar, Inc. (a) 346 13,799Intel Corp. (b) 23,430 790,528IXYS Corp. 19,153 315,067KLA-Tencor Corp. 12,314 1,126,854Lam Research Corp. (b) 954 134,924Maxim Integrated Products, Inc. 29,442 1,321,946Microchip Technology, Inc. (b) 5,811 448,493Microsemi Corp. (a) 9,161 428,735NVIDIA Corp. 1,286 185,904ON Semiconductor Corp. (a) 1,883 26,437Qorvo, Inc. (a) 3,204 202,877QUALCOMM, Inc. 2,657 146,720Semtech Corp. (a) 3,437 122,873SK Hynix, Inc. 34,096 2,007,561SunPower Corp. (a)(b) 263 2,456Taiwan Semiconductor Manufacturing Co. Ltd. 396,000 2,705,556Teradyne, Inc. 927 27,838Texas Instruments, Inc. 29,116 2,239,894Ultra Clean Holdings, Inc. (a) 12,300 230,625Xcerra Corp. (a) 3,098 30,268
See Notes to Financial Statements.
ACTIVE STOCK MASTER PORTFOLIO JUNE 30, 2017 11

Schedule of Investments (continued) Active Stock Master Portfolio
Common Stocks Shares Value
Semiconductors & Semiconductor Equipment (continued)Xilinx, Inc. (b) 6,809 $ 437,955
16,120,723
Software — 3.2%A10 Networks, Inc. (a) 23,715 200,155Activision Blizzard, Inc. 3,679 211,800Adobe Systems, Inc. (a) 16,506 2,334,609Allscripts Healthcare Solutions, Inc. (a) 852 10,872American Software, Inc., Class A 7,994 82,258ANSYS, Inc. (a) 2,593 315,516Atlassian Corp. PLC, Class A (a) 119 4,186Autodesk, Inc. (a) 1,743 175,729Barracuda Networks, Inc. (a) 6,688 154,225Bottomline Technologies, Inc. (a) 18,762 481,996Cadence Design Systems, Inc. (a) 7,617 255,093Check Point Software Technologies Ltd. (a) 1,067 116,388Citrix Systems, Inc. (a) 1,373 109,263Dell Technologies, Inc., Class V (a) 7,547 461,197Electronic Arts, Inc. (a) 1,708 180,570FireEye, Inc. (a) 691 10,510Fortinet, Inc. (a) 403 15,088Guidewire Software, Inc. (a) 330 22,674HubSpot, Inc. (a) 869 57,137Imperva, Inc. (a) 6,335 303,130KPIT Technologies Ltd. 62,003 117,643Manhattan Associates, Inc. (a) 327 15,716Microsoft Corp. 59,302 4,087,687MicroStrategy, Inc., Class A (a) 4,731 906,791MobileIron, Inc. (a) 5,963 36,076NIIT Technologies Ltd. 58,796 524,827Oracle Corp. 17,063 855,539Paycom Software, Inc. (a)(b) 2,012 137,641Proofpoint, Inc. (a)(b) 11,044 958,951PTC, Inc. (a) 520 28,662SS&C Technologies Holdings, Inc. 768 29,499Symantec Corp. 2,343 66,190Synopsys, Inc. (a) 10,887 793,989Tableau Software, Inc., Class A (a) 251 15,379Tyler Technologies, Inc. (a) 151 26,526Ultimate Software Group, Inc. (a) 125 26,258Varonis Systems, Inc. (a) 7,651 284,617Verint Systems, Inc. (a) 5,426 220,838VMware, Inc., Class A (a)(b) 16,226 1,418,639Zendesk, Inc. (a) 2,346 65,172Zix Corp. (a) 4,196 23,875Zynga, Inc., Class A (a) 3,312 12,056
16,154,967
Specialty Retail — 1.7%Aaron’s, Inc. (b) 18,039 701,717Asbury Automotive Group, Inc. (a) 12,594 712,191AutoZone, Inc. (a) 21 11,980Bed Bath & Beyond, Inc. 3,258 99,043Best Buy Co., Inc. 6,585 377,518Big 5 Sporting Goods Corp. (b) 35,363 461,487Cabela’s, Inc. (a) 229 13,607Children’s Place, Inc. 178 18,174Citi Trends, Inc. (b) 2,372 50,334Dick’s Sporting Goods, Inc. 133 5,297Foot Locker, Inc. 3,433 169,178GameStop Corp., Class A 467 10,092Gap, Inc. (b) 6,890 151,511GNC Holdings, Inc., Class A (b) 1,939 16,346Haverty Furniture Cos., Inc. 1,666 41,817Home Depot, Inc. 15,360 2,356,224Kirkland’s, Inc. (a) 5,052 51,935LOTTE Himart Co. Ltd. 6,669 406,849
Common Stocks Shares Value
Specialty Retail (continued)Lowe’s Cos., Inc. 27,743 $ 2,150,915Michaels Cos., Inc. (a) 386 7,149Penske Automotive Group, Inc. (b) 175 7,684Pier 1 Imports, Inc. (b) 11,727 60,863Ross Stores, Inc. 390 22,515Sally Beauty Holdings, Inc. (a)(b) 668 13,527Select Comfort Corp. (a) 6,779 240,587Staples, Inc. 9,702 97,699Tiffany & Co. 1,017 95,466TJX Cos., Inc. 1,162 83,861Urban Outfitters, Inc. (a) 408 7,564West Marine, Inc. 1,074 13,801Williams-Sonoma, Inc. 404 19,594Zhongsheng Group Holdings Ltd. 57,000 106,295
8,582,820
Technology Hardware, Storage & Peripherals — 3.5%Apple, Inc. 46,348 6,675,039Asustek Computer, Inc. 81,000 765,024Compal Electronics, Inc. 39,000 26,275Hewlett Packard Enterprise Co. 20,514 340,327HP, Inc. 46,938 820,476Lite-On Technology Corp. 171,000 280,684NCR Corp. (a) 13,024 531,900NetApp, Inc. 2,767 110,818Pegatron Corp. 321,000 1,004,156Quantum Corp. (a) 10,681 83,419Samsung Electronics Co. Ltd. 3,050 6,352,602Synaptics, Inc. (a) 7,291 377,018Western Digital Corp. 1,379 122,179
17,489,917
Textiles, Apparel & Luxury Goods — 0.3%Carter’s, Inc. 229 20,370Kate Spade & Co. (a) 584 10,798Michael Kors Holdings Ltd. (a) 762 27,623NIKE, Inc., Class B 12,606 743,754Perry Ellis International, Inc. (a) 17,633 343,138PVH Corp. 657 75,226Ralph Lauren Corp. (b) 1,574 116,161Skechers U.S.A., Inc., Class A (a) 595 17,553Titan Co. Ltd. (a) 17,471 141,678VF Corp. (b) 1,095 63,072
1,559,373
Thrifts & Mortgage Finance — 0.8%Charter Financial Corp. 2,076 37,368Essent Group Ltd. (a) 12,887 478,623Federal Agricultural Mortgage Corp., Class C 2,589 167,508First Defiance Financial Corp. 5,477 288,528Flagstar Bancorp, Inc. (a) 804 24,779Housing Development Finance Corp. 78,876 1,969,849LendingTree, Inc. (a) 400 68,880LIC Housing Finance Ltd. 16,246 186,394MGIC Investment Corp. (a) 11,063 123,906Radian Group, Inc. 5,805 94,912Riverview Bancorp, Inc. 5,255 34,893TFS Financial Corp. (b) 261 4,038United Community Financial Corp. 4,138 34,387Walker & Dunlop, Inc. (a) 6,055 295,666
3,809,731
Tobacco — 0.7%Altria Group, Inc. 15,918 1,185,413Philip Morris International, Inc. 14,260 1,674,837Reynolds American, Inc. 5,930 385,687Universal Corp. (b) 4,755 307,649
3,553,586
See Notes to Financial Statements.
12 ACTIVE STOCK MASTER PORTFOLIO JUNE 30, 2017

Schedule of Investments (continued) Active Stock Master Portfolio
Common Stocks Shares Value
Trading Companies & Distributors — 0.8%Air Lease Corp. (b) 440 $ 16,438Applied Industrial Technologies, Inc. 23,304 1,376,101Barloworld Ltd. 99,340 826,157DXP Enterprises, Inc. (a) 360 12,420GMS, Inc. (a) 7,751 217,803Herc Holdings, Inc. (a)(b) 109 4,286LG International Corp. 25,166 683,287MRC Global, Inc. (a) 39,594 654,093MSC Industrial Direct Co., Inc., Class A 201 17,278NOW, Inc. (a)(b) 8,567 137,757Titan Machinery, Inc. (a) 1,374 24,705Univar, Inc. (a) 4,680 136,656Watsco, Inc. 119 18,350WESCO International, Inc. (a) 221 12,663
4,137,994
Transportation Infrastructure — 0.0%Zhejiang Expressway Co. Ltd., Class H 86,000 112,337
Water Utilities — 0.1%Aqua America, Inc. 811 27,006Cia de Saneamento Basico do Estado de Sao
Paulo — ADR 20,516 195,313Companhia de Saneamento Basico do Estado de
Sao Paulo 22,800 217,890SJW Corp. 1,557 76,573
516,782
Wireless Telecommunication Services — 1.3%America Movil SAB de CV, Series L 897,688 722,157Bharti Infratel Ltd. 119,186 690,416
Common Stocks Shares Value
Wireless Telecommunication Services (continued)Boingo Wireless, Inc. (a) 16,385 $ 245,120China Mobile Ltd. 164,000 1,738,696RingCentral, Inc., Class A (a) 10,326 377,415SK Telecom Co. Ltd. 758 176,225SK Telecom Co. Ltd., ADR 23,846 612,127T-Mobile U.S., Inc. (a) 6,890 417,672Telephone & Data Systems, Inc. 45,615 1,265,816Tim Participacoes SA 29,206 86,307Tim Participacoes SA, ADR 20,387 301,728United States Cellular Corp. (a) 2,323 89,017
6,722,696
Total Long-Term Investments(Cost — $440,625,906) — 93.6% 472,937,474
Short-Term Securities
BlackRock Cash Funds: Institutional, SL AgencyShares, 1.29% (d)(e)(f) 33,473,281 33,483,323
BlackRock Cash Funds: Treasury, SL AgencyShares, 0.93% (d)(e) 20,669,306 20,669,306
Total Short-Term Securities(Cost — $54,154,186) — 10.7% 54,152,629
Total Investments (Cost — $494,780,092) — 104.3% 527,090,103
Liabilities in Excess of Other Assets — (4.3)% (21,508,096)
Net Assets — 100.0% $ 505,582,007
Notes to Schedule of Investments
(a) Non-income producing security.
(b) Security, or a portion of the security, is on loan.
(c) Security exempt from registration pursuant to Rule 144A under the Securities Act of 1933, as amended. These securities may be resold in transactions exempt from registration toqualified institutional investors.
(d) During the six months ended June 30, 2017, investments in issuers considered to be affiliates of the Master Portfolio for purposes of Section 2(a)(3) of the Investment CompanyAct of 1940, as amended, were as follows:
Affiliate
SharesHeld at
December 31,2016
NetActivity
SharesHeld atJune 30,
2017
Value atJune 30,
2017 IncomeNet RealizedGain (Loss)
Change inUnrealized
Appreciation(Depreciation)
BlackRock Cash Funds: Institutional,SL Agency Shares . . . . . . . . . . . . . . . 14,810,719 18,662,562 33,473,281 $33,483,323 $ 39,7211 $749 $(2,117)
BlackRock Cash Funds: Treasury,SL Agency Shares . . . . . . . . . . . . . . . 285,459,557 (264,790,251) 20,669,306 20,669,306 154,879 — —
Total $54,152,629 $194,600 $749 $(2,117)
1 Represents securities lending income earned from the reinvestment of cash collateral from loaned securities, net of fees and collateral investment expenses, and otherpayments to and from borrowers of securities.
(e) Current yield as of period end.
(f) All or a portion of security was purchased with the cash collateral from loaned securities.
For Master Portfolio compliance purposes, the Master Portfolio’s industry classifications refer to one or more of the industry sub-classifications used by one or more widely recog-nized market indexes or ratings group indexes, and/or as defined by the investment adviser. These definitions may not apply for purposes of this report, which may combine suchindustry sub-classifications for reporting ease.
See Notes to Financial Statements.
ACTIVE STOCK MASTER PORTFOLIO JUNE 30, 2017 13

Schedule of Investments (continued) Active Stock Master Portfolio
Derivative Financial Instruments Outstanding as of Period End
Futures Contracts
ContractsLong (Short) Issue Expiration
NotionalValue
UnrealizedAppreciation
(Depreciation)
(2,514) MSCI Emerging Markets E-Mini Index September 2017 $126,743,310 $(680,667)58 MSCI Emerging Markets E-Mini Index September 2017 $ 2,924,070 (4,475)
(1,358) Russell 2000 Mini Index September 2017 $ 96,030,970 551,34113 Russell 2000 Mini Index September 2017 $ 919,295 (7,448)
2,060 S&P 500 E-Mini Index September 2017 $249,352,700 (566,360)
Total $(707,609)
Derivative Financial Instruments Categorized by Risk Exposure
As of period end, the fair values of derivative financial instruments located in the Statement of Assets and Liabilities were as follows:
Assets — Derivative Financial InstrumentsCommodityContracts
CreditContracts
EquityContracts
ForeignCurrencyExchangeContracts
InterestRate
ContractsOther
Contracts Total
Futures contracts . . . . . . . . . . . . . . . . . . . . . . . . Net unrealized appreciation1 — — $ 551,341 — — — $ 551,341
Liabilities — Derivative Financial Instruments
Futures contracts . . . . . . . . . . . . . . . . . . . . . . . . Net unrealized depreciation1 — — $1,258,950 — — — $1,258,950
1 Includes cumulative appreciation (depreciation) on futures contracts, if any, as reported in the Schedule of Investments. Only current day’s variation margin is reportedwithin the Statement of Assets and Liabilities.
For the six month ended June 30, 2017, the effect of derivative financial instruments in the Statement of Operation was as follows:
Net Realized Gain (Loss) from:
Futures contracts . . . . . . . . . . . . . . . . . . . . . . . . . . . . . . . . . . . . . . . . . . . . . . . . . . . . . . — — $2,453,814 — — — $2,453,814
Net Change in Unrealized Appreciation (Depreciation) on:
Futures contracts . . . . . . . . . . . . . . . . . . . . . . . . . . . . . . . . . . . . . . . . . . . . . . . . . . . . . . — — $1,391,005 — — — $1,391,005
Average Quarterly Balances of Outstanding Derivative Financial Instruments
Futures contracts:Average notional value of contracts — long . . . . . . . . . . . . . . . . . . . . . . . . . . . . . . . . . . . . . . . . . . . . . . . . . . . . . . . . . . . . . . . . . . . . . . . . . . . . . . . . . . . . . . . . $258,152,138Average notional value of contracts — short . . . . . . . . . . . . . . . . . . . . . . . . . . . . . . . . . . . . . . . . . . . . . . . . . . . . . . . . . . . . . . . . . . . . . . . . . . . . . . . . . . . . . . . . $217,898,180
For more information about the Master Portfolio’s investment risks regarding derivative financial instruments, refer to the Notes to Financial Statements.
Fair Value Hierarchy as of Period End
Various inputs are used in determining the fair value of investments and derivative financial instruments. For information about the Master Portfolio’s policy regarding valuation ofinvestments and derivative financial instruments, refer to the Notes to Financial Statements.
The following tables summarize the Master Portfolio’s investments and derivative financial instruments categorized in the disclosure hierarchy:
Level 1 Level 2 Level 3 Total
Assets:Investments:
Common Stocks:Aerospace & Defense . . . . . . . . . . . . . . . . . . . . . . . . . . . . . . . . . . . . . . . . . . . . . . . . . . . . . . . . . . . . . . . . . . . . . . . . $ 5,213,757 — — $ 5,213,757Air Freight & Logistics . . . . . . . . . . . . . . . . . . . . . . . . . . . . . . . . . . . . . . . . . . . . . . . . . . . . . . . . . . . . . . . . . . . . . . . . 2,405,600 — — 2,405,600Airlines . . . . . . . . . . . . . . . . . . . . . . . . . . . . . . . . . . . . . . . . . . . . . . . . . . . . . . . . . . . . . . . . . . . . . . . . . . . . . . . . . . 2,679,278 — — 2,679,278Auto Components . . . . . . . . . . . . . . . . . . . . . . . . . . . . . . . . . . . . . . . . . . . . . . . . . . . . . . . . . . . . . . . . . . . . . . . . . . 4,662,170 — — 4,662,170Automobiles . . . . . . . . . . . . . . . . . . . . . . . . . . . . . . . . . . . . . . . . . . . . . . . . . . . . . . . . . . . . . . . . . . . . . . . . . . . . . . 455,100 $ 2,840,183 — 3,295,283Banks . . . . . . . . . . . . . . . . . . . . . . . . . . . . . . . . . . . . . . . . . . . . . . . . . . . . . . . . . . . . . . . . . . . . . . . . . . . . . . . . . . . 30,581,579 14,926,343 — 45,507,922Beverages . . . . . . . . . . . . . . . . . . . . . . . . . . . . . . . . . . . . . . . . . . . . . . . . . . . . . . . . . . . . . . . . . . . . . . . . . . . . . . . . 4,324,979 — — 4,324,979Biotechnology . . . . . . . . . . . . . . . . . . . . . . . . . . . . . . . . . . . . . . . . . . . . . . . . . . . . . . . . . . . . . . . . . . . . . . . . . . . . . 14,354,289 — — 14,354,289
See Notes to Financial Statements.
14 ACTIVE STOCK MASTER PORTFOLIO JUNE 30, 2017

Schedule of Investments (continued) Active Stock Master Portfolio
Fair Value Hierarchy as of Period End (continued)
Level 1 Level 2 Level 3 Total
Building Products . . . . . . . . . . . . . . . . . . . . . . . . . . . . . . . . . . . . . . . . . . . . . . . . . . . . . . . . . . . . . . . . . . . . . . . . . $ 4,279,373 — — $ 4,279,373Capital Markets . . . . . . . . . . . . . . . . . . . . . . . . . . . . . . . . . . . . . . . . . . . . . . . . . . . . . . . . . . . . . . . . . . . . . . . . . . 7,258,710 — — 7,258,710Chemicals . . . . . . . . . . . . . . . . . . . . . . . . . . . . . . . . . . . . . . . . . . . . . . . . . . . . . . . . . . . . . . . . . . . . . . . . . . . . . . 8,769,203 $ 2,258,004 — 11,027,207Commercial Services & Supplies . . . . . . . . . . . . . . . . . . . . . . . . . . . . . . . . . . . . . . . . . . . . . . . . . . . . . . . . . . . . . . 3,597,577 — — 3,597,577Communications Equipment . . . . . . . . . . . . . . . . . . . . . . . . . . . . . . . . . . . . . . . . . . . . . . . . . . . . . . . . . . . . . . . . . 3,011,799 182,366 — 3,194,165Construction & Engineering . . . . . . . . . . . . . . . . . . . . . . . . . . . . . . . . . . . . . . . . . . . . . . . . . . . . . . . . . . . . . . . . . . 1,320,634 2,335,536 — 3,656,170Construction Materials . . . . . . . . . . . . . . . . . . . . . . . . . . . . . . . . . . . . . . . . . . . . . . . . . . . . . . . . . . . . . . . . . . . . . 182,284 2,739,133 — 2,921,417Consumer Discretionary . . . . . . . . . . . . . . . . . . . . . . . . . . . . . . . . . . . . . . . . . . . . . . . . . . . . . . . . . . . . . . . . . . . . 200,500 — — 200,500Consumer Finance . . . . . . . . . . . . . . . . . . . . . . . . . . . . . . . . . . . . . . . . . . . . . . . . . . . . . . . . . . . . . . . . . . . . . . . . 1,308,624 — — 1,308,624Containers & Packaging . . . . . . . . . . . . . . . . . . . . . . . . . . . . . . . . . . . . . . . . . . . . . . . . . . . . . . . . . . . . . . . . . . . . 2,165,262 — — 2,165,262Distributors . . . . . . . . . . . . . . . . . . . . . . . . . . . . . . . . . . . . . . . . . . . . . . . . . . . . . . . . . . . . . . . . . . . . . . . . . . . . . 42,391 — — 42,391Diversified Consumer Services . . . . . . . . . . . . . . . . . . . . . . . . . . . . . . . . . . . . . . . . . . . . . . . . . . . . . . . . . . . . . . . . 1,265,901 — — 1,265,901Diversified Financial Services . . . . . . . . . . . . . . . . . . . . . . . . . . . . . . . . . . . . . . . . . . . . . . . . . . . . . . . . . . . . . . . . . 6,350,707 1,219,907 — 7,570,614Diversified Telecommunication Services . . . . . . . . . . . . . . . . . . . . . . . . . . . . . . . . . . . . . . . . . . . . . . . . . . . . . . . . . 4,470,237 3,406,621 — 7,876,858Electric Utilities . . . . . . . . . . . . . . . . . . . . . . . . . . . . . . . . . . . . . . . . . . . . . . . . . . . . . . . . . . . . . . . . . . . . . . . . . . 3,170,258 808,171 — 3,978,429Electrical Equipment . . . . . . . . . . . . . . . . . . . . . . . . . . . . . . . . . . . . . . . . . . . . . . . . . . . . . . . . . . . . . . . . . . . . . . . 2,353,907 339,720 — 2,693,627Electronic Equipment, Instruments & Components . . . . . . . . . . . . . . . . . . . . . . . . . . . . . . . . . . . . . . . . . . . . . . . . . 7,411,922 5,459,965 — 12,871,887Energy Equipment & Services . . . . . . . . . . . . . . . . . . . . . . . . . . . . . . . . . . . . . . . . . . . . . . . . . . . . . . . . . . . . . . . . 2,528,483 — — 2,528,483Food & Staples Retailing . . . . . . . . . . . . . . . . . . . . . . . . . . . . . . . . . . . . . . . . . . . . . . . . . . . . . . . . . . . . . . . . . . . . 4,556,207 859,107 — 5,415,314Food Products . . . . . . . . . . . . . . . . . . . . . . . . . . . . . . . . . . . . . . . . . . . . . . . . . . . . . . . . . . . . . . . . . . . . . . . . . . . 5,663,469 1,176,484 — 6,839,953Gas Utilities . . . . . . . . . . . . . . . . . . . . . . . . . . . . . . . . . . . . . . . . . . . . . . . . . . . . . . . . . . . . . . . . . . . . . . . . . . . . . 1,745,793 — — 1,745,793Health Care Equipment & Supplies . . . . . . . . . . . . . . . . . . . . . . . . . . . . . . . . . . . . . . . . . . . . . . . . . . . . . . . . . . . . 9,730,808 — — 9,730,808Health Care Providers & Services . . . . . . . . . . . . . . . . . . . . . . . . . . . . . . . . . . . . . . . . . . . . . . . . . . . . . . . . . . . . . . 7,286,495 536,196 — 7,822,691Health Care Technology . . . . . . . . . . . . . . . . . . . . . . . . . . . . . . . . . . . . . . . . . . . . . . . . . . . . . . . . . . . . . . . . . . . . 1,670,182 — — 1,670,182Hotels, Restaurants & Leisure . . . . . . . . . . . . . . . . . . . . . . . . . . . . . . . . . . . . . . . . . . . . . . . . . . . . . . . . . . . . . . . . 8,565,632 510,097 — 9,075,729Household Durables . . . . . . . . . . . . . . . . . . . . . . . . . . . . . . . . . . . . . . . . . . . . . . . . . . . . . . . . . . . . . . . . . . . . . . . 3,381,037 3,983,120 — 7,364,157Household Products . . . . . . . . . . . . . . . . . . . . . . . . . . . . . . . . . . . . . . . . . . . . . . . . . . . . . . . . . . . . . . . . . . . . . . . 3,600,857 2,452,486 — 6,053,343IT Services . . . . . . . . . . . . . . . . . . . . . . . . . . . . . . . . . . . . . . . . . . . . . . . . . . . . . . . . . . . . . . . . . . . . . . . . . . . . . . 13,339,435 1,399,186 — 14,738,621Independent Power and Renewable Electricity Producers . . . . . . . . . . . . . . . . . . . . . . . . . . . . . . . . . . . . . . . . . . . . . 1,398,432 297,097 — 1,695,529Industrial Conglomerates . . . . . . . . . . . . . . . . . . . . . . . . . . . . . . . . . . . . . . . . . . . . . . . . . . . . . . . . . . . . . . . . . . . 5,147,627 439,992 — 5,587,619Insurance . . . . . . . . . . . . . . . . . . . . . . . . . . . . . . . . . . . . . . . . . . . . . . . . . . . . . . . . . . . . . . . . . . . . . . . . . . . . . . 12,554,372 2,426,338 — 14,980,710Internet & Direct Marketing Retail . . . . . . . . . . . . . . . . . . . . . . . . . . . . . . . . . . . . . . . . . . . . . . . . . . . . . . . . . . . . . 7,679,113 — — 7,679,113Internet Software & Services . . . . . . . . . . . . . . . . . . . . . . . . . . . . . . . . . . . . . . . . . . . . . . . . . . . . . . . . . . . . . . . . . 18,969,711 6,518,476 — 25,488,187Leisure Products . . . . . . . . . . . . . . . . . . . . . . . . . . . . . . . . . . . . . . . . . . . . . . . . . . . . . . . . . . . . . . . . . . . . . . . . . 2,321,983 — — 2,321,983Life Sciences Tools & Services . . . . . . . . . . . . . . . . . . . . . . . . . . . . . . . . . . . . . . . . . . . . . . . . . . . . . . . . . . . . . . . . 2,991,713 — — 2,991,713Machinery . . . . . . . . . . . . . . . . . . . . . . . . . . . . . . . . . . . . . . . . . . . . . . . . . . . . . . . . . . . . . . . . . . . . . . . . . . . . . . 10,424,371 510,669 — 10,935,040Marine . . . . . . . . . . . . . . . . . . . . . . . . . . . . . . . . . . . . . . . . . . . . . . . . . . . . . . . . . . . . . . . . . . . . . . . . . . . . . . . . 16,111 — — 16,111Media . . . . . . . . . . . . . . . . . . . . . . . . . . . . . . . . . . . . . . . . . . . . . . . . . . . . . . . . . . . . . . . . . . . . . . . . . . . . . . . . . 8,664,129 486,818 — 9,150,947Metals & Mining . . . . . . . . . . . . . . . . . . . . . . . . . . . . . . . . . . . . . . . . . . . . . . . . . . . . . . . . . . . . . . . . . . . . . . . . . . 3,979,196 3,646,490 — 7,625,686Multi-Utilities . . . . . . . . . . . . . . . . . . . . . . . . . . . . . . . . . . . . . . . . . . . . . . . . . . . . . . . . . . . . . . . . . . . . . . . . . . . . 4,829,816 — — 4,829,816Multiline Retail . . . . . . . . . . . . . . . . . . . . . . . . . . . . . . . . . . . . . . . . . . . . . . . . . . . . . . . . . . . . . . . . . . . . . . . . . . . 2,757,218 728,797 — 3,486,015Oil & Gas Exploration & Production . . . . . . . . . . . . . . . . . . . . . . . . . . . . . . . . . . . . . . . . . . . . . . . . . . . . . . . . . . . . 417,331 — — 417,331Oil, Gas & Consumable Fuels . . . . . . . . . . . . . . . . . . . . . . . . . . . . . . . . . . . . . . . . . . . . . . . . . . . . . . . . . . . . . . . . 15,065,477 5,819,249 — 20,884,726Paper & Forest Products . . . . . . . . . . . . . . . . . . . . . . . . . . . . . . . . . . . . . . . . . . . . . . . . . . . . . . . . . . . . . . . . . . . . 322,224 2,690,240 — 3,012,464Personal Products . . . . . . . . . . . . . . . . . . . . . . . . . . . . . . . . . . . . . . . . . . . . . . . . . . . . . . . . . . . . . . . . . . . . . . . . 4,066,063 385,813 — 4,451,876Pharmaceuticals . . . . . . . . . . . . . . . . . . . . . . . . . . . . . . . . . . . . . . . . . . . . . . . . . . . . . . . . . . . . . . . . . . . . . . . . . 13,484,214 386,134 — 13,870,348Professional Services . . . . . . . . . . . . . . . . . . . . . . . . . . . . . . . . . . . . . . . . . . . . . . . . . . . . . . . . . . . . . . . . . . . . . . 3,052,517 — — 3,052,517Real Estate Investment Trusts (REITs) . . . . . . . . . . . . . . . . . . . . . . . . . . . . . . . . . . . . . . . . . . . . . . . . . . . . . . . . . . . 15,878,294 — — 15,878,294Real Estate Management & Development . . . . . . . . . . . . . . . . . . . . . . . . . . . . . . . . . . . . . . . . . . . . . . . . . . . . . . . . 388,063 2,696,687 — 3,084,750Road & Rail . . . . . . . . . . . . . . . . . . . . . . . . . . . . . . . . . . . . . . . . . . . . . . . . . . . . . . . . . . . . . . . . . . . . . . . . . . . . . 1,398,709 — — 1,398,709Semiconductors & Semiconductor Equipment . . . . . . . . . . . . . . . . . . . . . . . . . . . . . . . . . . . . . . . . . . . . . . . . . . . . 11,407,606 4,713,117 — 16,120,723Software . . . . . . . . . . . . . . . . . . . . . . . . . . . . . . . . . . . . . . . . . . . . . . . . . . . . . . . . . . . . . . . . . . . . . . . . . . . . . . . 15,512,497 642,470 — 16,154,967Specialty Retail . . . . . . . . . . . . . . . . . . . . . . . . . . . . . . . . . . . . . . . . . . . . . . . . . . . . . . . . . . . . . . . . . . . . . . . . . . 8,476,525 106,295 — 8,582,820Technology Hardware, Storage & Peripherals . . . . . . . . . . . . . . . . . . . . . . . . . . . . . . . . . . . . . . . . . . . . . . . . . . . . . 9,061,176 8,428,741 — 17,489,917Textiles, Apparel & Luxury Goods . . . . . . . . . . . . . . . . . . . . . . . . . . . . . . . . . . . . . . . . . . . . . . . . . . . . . . . . . . . . . . 1,417,695 141,678 — 1,559,373Thrifts & Mortgage Finance . . . . . . . . . . . . . . . . . . . . . . . . . . . . . . . . . . . . . . . . . . . . . . . . . . . . . . . . . . . . . . . . . . 1,653,488 2,156,243 — 3,809,731Tobacco . . . . . . . . . . . . . . . . . . . . . . . . . . . . . . . . . . . . . . . . . . . . . . . . . . . . . . . . . . . . . . . . . . . . . . . . . . . . . . . 3,553,586 — — 3,553,586Trading Companies & Distributors . . . . . . . . . . . . . . . . . . . . . . . . . . . . . . . . . . . . . . . . . . . . . . . . . . . . . . . . . . . . . 3,454,707 683,287 — 4,137,994Transportation Infrastructure . . . . . . . . . . . . . . . . . . . . . . . . . . . . . . . . . . . . . . . . . . . . . . . . . . . . . . . . . . . . . . . . . — 112,337 — 112,337Water Utilities . . . . . . . . . . . . . . . . . . . . . . . . . . . . . . . . . . . . . . . . . . . . . . . . . . . . . . . . . . . . . . . . . . . . . . . . . . . 516,782 — — 516,782Wireless Telecommunication Services . . . . . . . . . . . . . . . . . . . . . . . . . . . . . . . . . . . . . . . . . . . . . . . . . . . . . . . . . . . 4,293,584 2,429,112 — 6,722,696
Short-Term Securities . . . . . . . . . . . . . . . . . . . . . . . . . . . . . . . . . . . . . . . . . . . . . . . . . . . . . . . . . . . . . . . . . . . . . . . . 54,152,629 — — 54,152,629
Total $433,211,398 $93,878,705 — $527,090,103
See Notes to Financial Statements.
ACTIVE STOCK MASTER PORTFOLIO JUNE 30, 2017 15

Schedule of Investments (concluded) Active Stock Master Portfolio
Fair Value Hierarchy as of Period End (continued)
Level 1 Level 2 Level 3 Total
Derivative Financial Instruments1
Assets:Equity Contracts . . . . . . . . . . . . . . . . . . . . . . . . . . . . . . . . . . . . . . . . . . . . . . . . . . . . . . . . . . . . . . . . . . . . . . . . . . . . . . . . . . . . $ 551,341 — — $ 551,341
Liabilities:Equity Contracts . . . . . . . . . . . . . . . . . . . . . . . . . . . . . . . . . . . . . . . . . . . . . . . . . . . . . . . . . . . . . . . . . . . . . . . . . . . . . . . . . . . . (1,258,950) — — (1,258,950)
Total $ (707,609) — — $ (707,609)
1 Derivative financial instruments are futures contracts, which are valued at the unrealized appreciation (depreciation) on the instrument.
During the six months ended June 30, 2017, there were no transfers between levels.
See Notes to Financial Statements.
16 ACTIVE STOCK MASTER PORTFOLIO JUNE 30, 2017

Statement of Assets and Liabilities Active Stock Master Portfolio
June 30, 2017 (Unaudited)
Assets
Investments at value — unaffiliated (including securities loaned at value of $32,491,394) (cost — $440,625,906) . . . . . . . . . . . . . . . . . . . . . . . . . . . . . . . . . . . . . . . . . . $472,937,474Investments at value — affiliated (cost — $54,154,186) . . . . . . . . . . . . . . . . . . . . . . . . . . . . . . . . . . . . . . . . . . . . . . . . . . . . . . . . . . . . . . . . . . . . . . . . . . . . . . . . . . . . 54,152,629Cash . . . . . . . . . . . . . . . . . . . . . . . . . . . . . . . . . . . . . . . . . . . . . . . . . . . . . . . . . . . . . . . . . . . . . . . . . . . . . . . . . . . . . . . . . . . . . . . . . . . . . . . . . . . . . . . . . . . . . . . . 6,527Cash pledged for futures contracts . . . . . . . . . . . . . . . . . . . . . . . . . . . . . . . . . . . . . . . . . . . . . . . . . . . . . . . . . . . . . . . . . . . . . . . . . . . . . . . . . . . . . . . . . . . . . . . . . . . 21,288,000Foreign currency at value (cost — $1,146,472) . . . . . . . . . . . . . . . . . . . . . . . . . . . . . . . . . . . . . . . . . . . . . . . . . . . . . . . . . . . . . . . . . . . . . . . . . . . . . . . . . . . . . . . . . . 1,152,938Receivables:
Investments sold . . . . . . . . . . . . . . . . . . . . . . . . . . . . . . . . . . . . . . . . . . . . . . . . . . . . . . . . . . . . . . . . . . . . . . . . . . . . . . . . . . . . . . . . . . . . . . . . . . . . . . . . . . . . . . 4,065,580Dividends — unaffiliated . . . . . . . . . . . . . . . . . . . . . . . . . . . . . . . . . . . . . . . . . . . . . . . . . . . . . . . . . . . . . . . . . . . . . . . . . . . . . . . . . . . . . . . . . . . . . . . . . . . . . . . . . 953,860Dividends — affiliated . . . . . . . . . . . . . . . . . . . . . . . . . . . . . . . . . . . . . . . . . . . . . . . . . . . . . . . . . . . . . . . . . . . . . . . . . . . . . . . . . . . . . . . . . . . . . . . . . . . . . . . . . . 13,842Securities lending income — affiliated . . . . . . . . . . . . . . . . . . . . . . . . . . . . . . . . . . . . . . . . . . . . . . . . . . . . . . . . . . . . . . . . . . . . . . . . . . . . . . . . . . . . . . . . . . . . . . . 8,863
Prepaid expenses . . . . . . . . . . . . . . . . . . . . . . . . . . . . . . . . . . . . . . . . . . . . . . . . . . . . . . . . . . . . . . . . . . . . . . . . . . . . . . . . . . . . . . . . . . . . . . . . . . . . . . . . . . . . . . . 3,916
Total assets . . . . . . . . . . . . . . . . . . . . . . . . . . . . . . . . . . . . . . . . . . . . . . . . . . . . . . . . . . . . . . . . . . . . . . . . . . . . . . . . . . . . . . . . . . . . . . . . . . . . . . . . . . . . . . . . . . . 554,583,629
Liabilities
Cash collateral on securities loaned at value . . . . . . . . . . . . . . . . . . . . . . . . . . . . . . . . . . . . . . . . . . . . . . . . . . . . . . . . . . . . . . . . . . . . . . . . . . . . . . . . . . . . . . . . . . . . 33,482,890Payables:
Withdrawals to investors . . . . . . . . . . . . . . . . . . . . . . . . . . . . . . . . . . . . . . . . . . . . . . . . . . . . . . . . . . . . . . . . . . . . . . . . . . . . . . . . . . . . . . . . . . . . . . . . . . . . . . . . 9,858,704Investments purchased . . . . . . . . . . . . . . . . . . . . . . . . . . . . . . . . . . . . . . . . . . . . . . . . . . . . . . . . . . . . . . . . . . . . . . . . . . . . . . . . . . . . . . . . . . . . . . . . . . . . . . . . . 5,081,530Variation margin on futures contracts . . . . . . . . . . . . . . . . . . . . . . . . . . . . . . . . . . . . . . . . . . . . . . . . . . . . . . . . . . . . . . . . . . . . . . . . . . . . . . . . . . . . . . . . . . . . . . . 393,404Deferred foreign capital gain tax . . . . . . . . . . . . . . . . . . . . . . . . . . . . . . . . . . . . . . . . . . . . . . . . . . . . . . . . . . . . . . . . . . . . . . . . . . . . . . . . . . . . . . . . . . . . . . . . . . . 102,253Investment advisory fees . . . . . . . . . . . . . . . . . . . . . . . . . . . . . . . . . . . . . . . . . . . . . . . . . . . . . . . . . . . . . . . . . . . . . . . . . . . . . . . . . . . . . . . . . . . . . . . . . . . . . . . . 64,687Trustees’ fees . . . . . . . . . . . . . . . . . . . . . . . . . . . . . . . . . . . . . . . . . . . . . . . . . . . . . . . . . . . . . . . . . . . . . . . . . . . . . . . . . . . . . . . . . . . . . . . . . . . . . . . . . . . . . . . . 4,021Other accrued expenses . . . . . . . . . . . . . . . . . . . . . . . . . . . . . . . . . . . . . . . . . . . . . . . . . . . . . . . . . . . . . . . . . . . . . . . . . . . . . . . . . . . . . . . . . . . . . . . . . . . . . . . . . 14,133
Total liabilities . . . . . . . . . . . . . . . . . . . . . . . . . . . . . . . . . . . . . . . . . . . . . . . . . . . . . . . . . . . . . . . . . . . . . . . . . . . . . . . . . . . . . . . . . . . . . . . . . . . . . . . . . . . . . . . . . . 49,001,622
Net Assets . . . . . . . . . . . . . . . . . . . . . . . . . . . . . . . . . . . . . . . . . . . . . . . . . . . . . . . . . . . . . . . . . . . . . . . . . . . . . . . . . . . . . . . . . . . . . . . . . . . . . . . . . . . . . . . . . . . . $505,582,007
Net Assets Consist of
Investors’ capital . . . . . . . . . . . . . . . . . . . . . . . . . . . . . . . . . . . . . . . . . . . . . . . . . . . . . . . . . . . . . . . . . . . . . . . . . . . . . . . . . . . . . . . . . . . . . . . . . . . . . . . . . . . . . . . . $474,074,619Net unrealized appreciation (depreciation) . . . . . . . . . . . . . . . . . . . . . . . . . . . . . . . . . . . . . . . . . . . . . . . . . . . . . . . . . . . . . . . . . . . . . . . . . . . . . . . . . . . . . . . . . . . . . . 31,507,388
Net Assets . . . . . . . . . . . . . . . . . . . . . . . . . . . . . . . . . . . . . . . . . . . . . . . . . . . . . . . . . . . . . . . . . . . . . . . . . . . . . . . . . . . . . . . . . . . . . . . . . . . . . . . . . . . . . . . . . . . . $505,582,007
See Notes to Financial Statements.
ACTIVE STOCK MASTER PORTFOLIO JUNE 30, 2017 17

Statement of Operations Active Stock Master Portfolio
Six Months Ended June 30, 2017 (Unaudited)
Investment Income
Dividends — unaffiliated . . . . . . . . . . . . . . . . . . . . . . . . . . . . . . . . . . . . . . . . . . . . . . . . . . . . . . . . . . . . . . . . . . . . . . . . . . . . . . . . . . . . . . . . . . . . . . . . . . . . . . . . . . . . $ 4,328,993Dividends — affiliated . . . . . . . . . . . . . . . . . . . . . . . . . . . . . . . . . . . . . . . . . . . . . . . . . . . . . . . . . . . . . . . . . . . . . . . . . . . . . . . . . . . . . . . . . . . . . . . . . . . . . . . . . . . . . 154,879Securities lending income — affiliated — net . . . . . . . . . . . . . . . . . . . . . . . . . . . . . . . . . . . . . . . . . . . . . . . . . . . . . . . . . . . . . . . . . . . . . . . . . . . . . . . . . . . . . . . . . . . . . . 39,721Foreign taxes withheld . . . . . . . . . . . . . . . . . . . . . . . . . . . . . . . . . . . . . . . . . . . . . . . . . . . . . . . . . . . . . . . . . . . . . . . . . . . . . . . . . . . . . . . . . . . . . . . . . . . . . . . . . . . . . (156,077)
Total investment income . . . . . . . . . . . . . . . . . . . . . . . . . . . . . . . . . . . . . . . . . . . . . . . . . . . . . . . . . . . . . . . . . . . . . . . . . . . . . . . . . . . . . . . . . . . . . . . . . . . . . . . . . . . 4,367,516
Expenses
Investment advisory . . . . . . . . . . . . . . . . . . . . . . . . . . . . . . . . . . . . . . . . . . . . . . . . . . . . . . . . . . . . . . . . . . . . . . . . . . . . . . . . . . . . . . . . . . . . . . . . . . . . . . . . . . . . . . . 633,725Administration . . . . . . . . . . . . . . . . . . . . . . . . . . . . . . . . . . . . . . . . . . . . . . . . . . . . . . . . . . . . . . . . . . . . . . . . . . . . . . . . . . . . . . . . . . . . . . . . . . . . . . . . . . . . . . . . . . 253,490Professional . . . . . . . . . . . . . . . . . . . . . . . . . . . . . . . . . . . . . . . . . . . . . . . . . . . . . . . . . . . . . . . . . . . . . . . . . . . . . . . . . . . . . . . . . . . . . . . . . . . . . . . . . . . . . . . . . . . . 11,913Trustees . . . . . . . . . . . . . . . . . . . . . . . . . . . . . . . . . . . . . . . . . . . . . . . . . . . . . . . . . . . . . . . . . . . . . . . . . . . . . . . . . . . . . . . . . . . . . . . . . . . . . . . . . . . . . . . . . . . . . . . 9,657
Total expenses . . . . . . . . . . . . . . . . . . . . . . . . . . . . . . . . . . . . . . . . . . . . . . . . . . . . . . . . . . . . . . . . . . . . . . . . . . . . . . . . . . . . . . . . . . . . . . . . . . . . . . . . . . . . . . . . . . 908,785Less:
Fees waived by the Manager . . . . . . . . . . . . . . . . . . . . . . . . . . . . . . . . . . . . . . . . . . . . . . . . . . . . . . . . . . . . . . . . . . . . . . . . . . . . . . . . . . . . . . . . . . . . . . . . . . . . . . (282,019)Fees waived by the Administrator . . . . . . . . . . . . . . . . . . . . . . . . . . . . . . . . . . . . . . . . . . . . . . . . . . . . . . . . . . . . . . . . . . . . . . . . . . . . . . . . . . . . . . . . . . . . . . . . . . . (253,490)
Total expenses after fees waived . . . . . . . . . . . . . . . . . . . . . . . . . . . . . . . . . . . . . . . . . . . . . . . . . . . . . . . . . . . . . . . . . . . . . . . . . . . . . . . . . . . . . . . . . . . . . . . . . . . . . . 373,276
Net investment income . . . . . . . . . . . . . . . . . . . . . . . . . . . . . . . . . . . . . . . . . . . . . . . . . . . . . . . . . . . . . . . . . . . . . . . . . . . . . . . . . . . . . . . . . . . . . . . . . . . . . . . . . . . . 3,994,240
Realized and Unrealized Gain (Loss)
Net realized gain (loss) from:Investments — unaffiliated (including $10,019 foreign capital gain tax) . . . . . . . . . . . . . . . . . . . . . . . . . . . . . . . . . . . . . . . . . . . . . . . . . . . . . . . . . . . . . . . . . . . . . . . . 24,374,811Investments — affiliated . . . . . . . . . . . . . . . . . . . . . . . . . . . . . . . . . . . . . . . . . . . . . . . . . . . . . . . . . . . . . . . . . . . . . . . . . . . . . . . . . . . . . . . . . . . . . . . . . . . . . . . . . . 749Futures contracts . . . . . . . . . . . . . . . . . . . . . . . . . . . . . . . . . . . . . . . . . . . . . . . . . . . . . . . . . . . . . . . . . . . . . . . . . . . . . . . . . . . . . . . . . . . . . . . . . . . . . . . . . . . . . . 2,453,814Foreign currency transactions . . . . . . . . . . . . . . . . . . . . . . . . . . . . . . . . . . . . . . . . . . . . . . . . . . . . . . . . . . . . . . . . . . . . . . . . . . . . . . . . . . . . . . . . . . . . . . . . . . . . . . (132,008)
26,697,366
Net change in unrealized appreciation (depreciation) on:Investments — unaffiliated (including $102,253 foreign capital gain tax) . . . . . . . . . . . . . . . . . . . . . . . . . . . . . . . . . . . . . . . . . . . . . . . . . . . . . . . . . . . . . . . . . . . . . . . 13,183,612Investments — affiliated . . . . . . . . . . . . . . . . . . . . . . . . . . . . . . . . . . . . . . . . . . . . . . . . . . . . . . . . . . . . . . . . . . . . . . . . . . . . . . . . . . . . . . . . . . . . . . . . . . . . . . . . . . (2,117)Futures contracts . . . . . . . . . . . . . . . . . . . . . . . . . . . . . . . . . . . . . . . . . . . . . . . . . . . . . . . . . . . . . . . . . . . . . . . . . . . . . . . . . . . . . . . . . . . . . . . . . . . . . . . . . . . . . . 1,391,005Foreign currency translations . . . . . . . . . . . . . . . . . . . . . . . . . . . . . . . . . . . . . . . . . . . . . . . . . . . . . . . . . . . . . . . . . . . . . . . . . . . . . . . . . . . . . . . . . . . . . . . . . . . . . . 7,239
14,579,739
Net realized and unrealized gain . . . . . . . . . . . . . . . . . . . . . . . . . . . . . . . . . . . . . . . . . . . . . . . . . . . . . . . . . . . . . . . . . . . . . . . . . . . . . . . . . . . . . . . . . . . . . . . . . . . . . . 41,277,105
Net Increase in Net Assets Resulting from Operations . . . . . . . . . . . . . . . . . . . . . . . . . . . . . . . . . . . . . . . . . . . . . . . . . . . . . . . . . . . . . . . . . . . . . . . . . . . . . . . . . . . . . $45,271,345
See Notes to Financial Statements.
18 ACTIVE STOCK MASTER PORTFOLIO JUNE 30, 2017
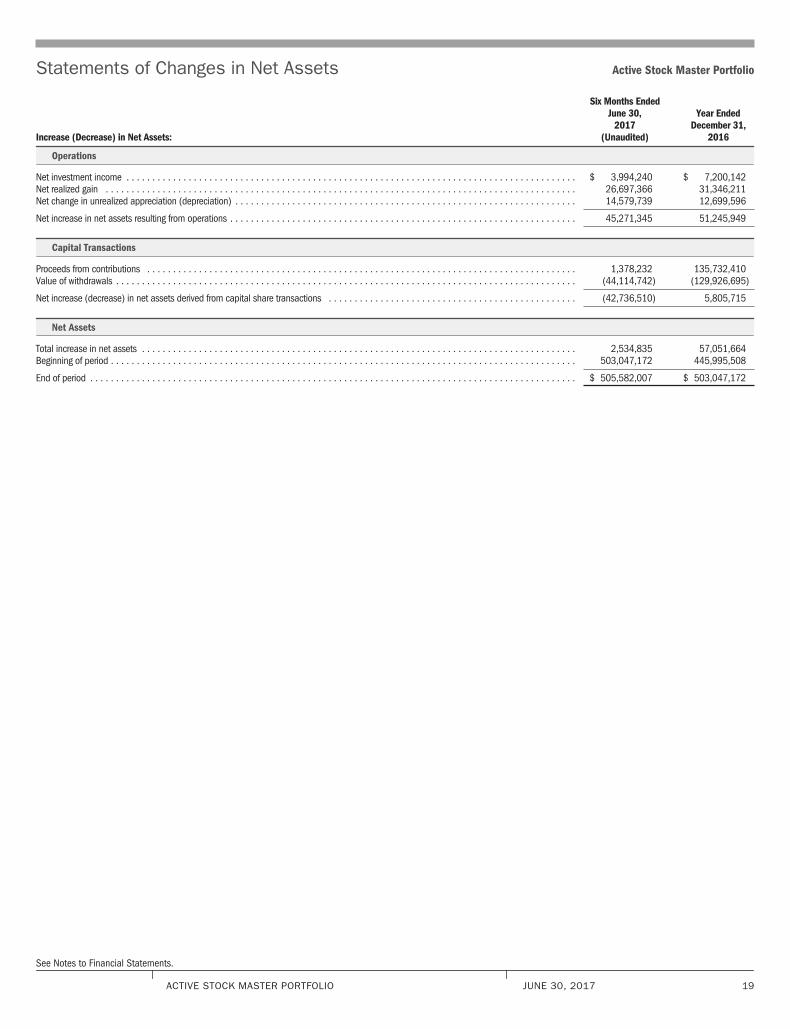
Statements of Changes in Net Assets Active Stock Master Portfolio
Increase (Decrease) in Net Assets:
Six Months EndedJune 30,
2017(Unaudited)
Year EndedDecember 31,
2016
Operations
Net investment income . . . . . . . . . . . . . . . . . . . . . . . . . . . . . . . . . . . . . . . . . . . . . . . . . . . . . . . . . . . . . . . . . . . . . . . . . . . . . . . . . . . . . . . $ 3,994,240 $ 7,200,142Net realized gain . . . . . . . . . . . . . . . . . . . . . . . . . . . . . . . . . . . . . . . . . . . . . . . . . . . . . . . . . . . . . . . . . . . . . . . . . . . . . . . . . . . . . . . . . . . 26,697,366 31,346,211Net change in unrealized appreciation (depreciation) . . . . . . . . . . . . . . . . . . . . . . . . . . . . . . . . . . . . . . . . . . . . . . . . . . . . . . . . . . . . . . . . . . 14,579,739 12,699,596
Net increase in net assets resulting from operations . . . . . . . . . . . . . . . . . . . . . . . . . . . . . . . . . . . . . . . . . . . . . . . . . . . . . . . . . . . . . . . . . . . 45,271,345 51,245,949
Capital Transactions
Proceeds from contributions . . . . . . . . . . . . . . . . . . . . . . . . . . . . . . . . . . . . . . . . . . . . . . . . . . . . . . . . . . . . . . . . . . . . . . . . . . . . . . . . . . . 1,378,232 135,732,410Value of withdrawals . . . . . . . . . . . . . . . . . . . . . . . . . . . . . . . . . . . . . . . . . . . . . . . . . . . . . . . . . . . . . . . . . . . . . . . . . . . . . . . . . . . . . . . . . (44,114,742) (129,926,695)
Net increase (decrease) in net assets derived from capital share transactions . . . . . . . . . . . . . . . . . . . . . . . . . . . . . . . . . . . . . . . . . . . . . . . . (42,736,510) 5,805,715
Net Assets
Total increase in net assets . . . . . . . . . . . . . . . . . . . . . . . . . . . . . . . . . . . . . . . . . . . . . . . . . . . . . . . . . . . . . . . . . . . . . . . . . . . . . . . . . . . . 2,534,835 57,051,664Beginning of period . . . . . . . . . . . . . . . . . . . . . . . . . . . . . . . . . . . . . . . . . . . . . . . . . . . . . . . . . . . . . . . . . . . . . . . . . . . . . . . . . . . . . . . . . . 503,047,172 445,995,508
End of period . . . . . . . . . . . . . . . . . . . . . . . . . . . . . . . . . . . . . . . . . . . . . . . . . . . . . . . . . . . . . . . . . . . . . . . . . . . . . . . . . . . . . . . . . . . . . . $ 505,582,007 $ 503,047,172
See Notes to Financial Statements.
ACTIVE STOCK MASTER PORTFOLIO JUNE 30, 2017 19

Financial Highlights Active Stock Master Portfolio
Six Months EndedJune 30,
2017(Unaudited)
Year Ended December 31,
2016 2015 2014 2013 2012
Total Return
Total return . . . . . . . . . . . . . . . . . . . . . . . . . . . . . . . . . . . . . . . . . . . . . . . . . . . . . . . . . . 9.33%1 12.45% (1.20)% 11.74% 34.02% 15.55%
Ratios to Average Net Assets
Total expenses . . . . . . . . . . . . . . . . . . . . . . . . . . . . . . . . . . . . . . . . . . . . . . . . . . . . . . . . 0.36%2 0.36% 0.35% 0.35% 0.35% 0.35%
Total expenses after fees waived . . . . . . . . . . . . . . . . . . . . . . . . . . . . . . . . . . . . . . . . . . . 0.15%2 0.15% 0.15% 0.17% 0.23% 0.26%
Net investment income . . . . . . . . . . . . . . . . . . . . . . . . . . . . . . . . . . . . . . . . . . . . . . . . . . 1.58%2 1.66% 1.65% 1.56% 1.55% 2.03%
Supplemental Data
Net assets, end of period (000) . . . . . . . . . . . . . . . . . . . . . . . . . . . . . . . . . . . . . . . . . . . $ 505,582 $ 503,047 $ 445,996 $ 2,434,426 $ 2,940,543 $ 2,792,818
Portfolio turnover rate . . . . . . . . . . . . . . . . . . . . . . . . . . . . . . . . . . . . . . . . . . . . . . . . . . . 96% 115% 132% 119% 153% 120%
1 Aggregate total return.2 Annualized.
See Notes to Financial Statements.
20 ACTIVE STOCK MASTER PORTFOLIO JUNE 30, 2017
Notes to Financial Statements (Unaudited)
1. Organization:
Master Investment Portfolio (“MIP”) is registered under the Investment Company Act of 1940, as amended (the “1940 Act”), as an open-end managementinvestment company. Active Stock Master Portfolio (the “Master Portfolio”) is a series of MIP. The Master Portfolio is classified as diversified. MIP isorganized as a Delaware statutory trust.
The Master Portfolio, together with certain other registered investment companies advised by BlackRock Fund Advisors (“BFA” or the “Manager”) or its affili-ates, is included in a complex of open-end funds referred to as the Equity-Liquidity Complex.
2. Significant Accounting Policies:
The financial statements are prepared in conformity with accounting principles generally accepted in the United States of America (“U.S. GAAP”), whichmay require management to make estimates and assumptions that affect the reported amounts of assets and liabilities in the financial statements, dis-closure of contingent assets and liabilities at the date of the financial statements and the reported amounts of increases and decreases in net assets fromoperations during the reporting period. Actual results could differ from those estimates. The Master Portfolio is considered an investment company underU.S. GAAP and follows the accounting and reporting guidance applicable to investment companies. Below is a summary of significant accounting policies:
Investment Transactions and Income Recognition: For financial reporting purposes, investment transactions are recorded on the dates the transactions areentered into (the “trade dates”). Realized gains and losses on investment transactions are determined on the identified cost basis. Dividend income isrecorded on the ex-dividend date. Dividends from foreign securities where the ex-dividend date may have passed are subsequently recorded when theMaster Portfolio is informed of the ex-dividend date. Under the applicable foreign tax laws, a withholding tax at various rates may be imposed on capitalgains, dividends and interest. Upon notification from issuers, some of the dividend income received from a real estate investment trust may beredesignated as a reduction of cost of the related investment and/or realized gain.
Foreign Currency Translation: The Master Portfolio’s books and records are maintained in U.S. dollars. Securities and other assets and liabilities denomi-nated in foreign currencies are translated into U.S. dollars using exchange rates determined as of the close of trading on the NYSE. Purchases and sales ofinvestments are recorded at the rates of exchange prevailing on the respective dates of such transactions. Generally, when the U.S. dollar rises in valueagainst a foreign currency, the investments denominated in that currency will lose value; the opposite effect occurs if the U.S. dollar falls in relative value.
The Master Portfolio does not isolate the portion of the results of operations arising as a result of changes in the exchange rates from the changes in themarket prices of investments held or sold for financial reporting purposes. Accordingly, the effects of changes in exchange rates on investments are notsegregated in the Statement of Operations from the effects of changes in market prices of those investments, but are included as a component of net real-ized and unrealized gain (loss) from investments.
The Master Portfolio reports realized currency gains (losses) on foreign currency related transactions as components of net realized gain (loss) for financialreporting purposes, whereas such components are generally treated as ordinary income for U.S. federal income tax purposes.
Segregation and Collateralization: In cases where the Master Portfolio enters into certain investments (e.g., futures contracts) that would be treated as“senior securities” for 1940 Act purposes, the Master Portfolio may segregate or designate on its books and records cash or liquid assets having a marketvalue at least equal to the amount of its future obligations under such investments. Doing so allows the investment to be excluded from treatment as a“senior security.” Furthermore, if required by an exchange or counterparty agreement, the Master Portfolio may be required to deliver/deposit cash and/orsecurities to/with an exchange, or broker-dealer or custodian as collateral for certain investments or obligations.
SEC Reporting Modernization: The U.S. Securities and Exchange Commission (“SEC”) adopted new rules and forms and amended other rules to enhancethe reporting and disclosure of information by registered investment companies. As part of these changes, the SEC amended Regulation S-X to standardizeand enhance disclosures in investment company financial statements. The compliance date for implementing the new or amended rules is August 1, 2017.
Indemnifications: In the normal course of business, the Master Portfolio enters into contracts that contain a variety of representations that provide generalindemnification. The Master Portfolio’s maximum exposure under these arrangements is unknown because it involves future potential claims against theMaster Portfolio, which cannot be predicted with any certainty.
Other: Expenses directly related to the Master Portfolio are charged to the Master Portfolio. Other operating expenses shared by several funds, includingother funds managed by the Manager, are prorated among those funds on the basis of relative net assets or other appropriate methods.
Through May 31, 2016, the Master Portfolio had an arrangement with its custodian whereby credits were earned on uninvested cash balances, which couldbe used to reduce custody fees and/or overdraft charges. Credits previously earned have been utilized until December 31, 2016. Under current arrange-ments effective June 1, 2016, the Master Portfolio no longer earns credits on uninvested cash, and may incur charges on uninvested cash balances andoverdrafts, subject to certain conditions.
ACTIVE STOCK MASTER PORTFOLIO JUNE 30, 2017 21

Notes to Financial Statements (continued)
3. Investment Valuation and Fair Value Measurements:
Investment Valuation Policies: The Master Portfolio’s investments are valued at fair value (also referred to as “market value” within the financial state-ments) as of the close of trading on the New York Stock Exchange (“NYSE”) (generally 4:00 p.m., Eastern time). U.S. GAAP defines fair value as the pricethe Master Portfolio would receive to sell an asset or pay to transfer a liability in an orderly transaction between market participants at the measurementdate. The Master Portfolio determines the fair values of its financial instruments using various independent dealers or pricing services under policiesapproved by the Board of Trustees of MIP (the “Board”). The BlackRock Global Valuation Methodologies Committee (the “Global Valuation Committee”) isthe committee formed by management to develop global pricing policies and procedures and to oversee the pricing function for all financial instruments.
Fair Value Inputs and Methodologies: The following methods and inputs are used to establish the fair value of the Master Portfolio’s assets and liabilities:
‰ Equity investments traded on a recognized securities exchange are valued at the official closing price each day, if available. For equity investmentstraded on more than one exchange, the official closing price on the exchange where the stock is primarily traded is used. Equity investments traded ona recognized exchange for which there were no sales on that day may be valued at the last available bid (long positions) or ask (short positions) price.
Generally, trading in foreign instruments is substantially completed each day at various times prior to the close of trading on the NYSE. Occasionally,events affecting the values of such instruments may occur between the foreign market close and the close of trading on the NYSE that may not bereflected in the computation of the Master Portfolio’s net assets. Each business day, the Master Portfolio uses a pricing service to assist with the valu-ation of certain foreign exchange-traded equity securities and foreign exchange-traded and over-the-counter (“OTC”) options (the “Systematic Fair ValuePrice”). Using current market factors, the Systematic Fair Value Price is designed to value such foreign securities and foreign options at fair value as ofthe close of trading on the NYSE, which follows the close of the local markets.
‰ Investments in open-end U.S. mutual funds are valued at net asset value (“NAV”) each business day.
‰ Futures contracts traded on exchanges are valued at their last sale price.
If events (e.g., a company announcement, market volatility or a natural disaster) occur that are expected to materially affect the value of such investments,or in the event that the application of these methods of valuation results in a price for an investment that is deemed not to be representative of the marketvalue of such investment, or if a price is not available, the investment will be valued by the Global Valuation Committee, or its delegate, in accordance witha policy approved by the Board as reflecting fair value (“Fair Valued Investments”). The fair valuation approaches that may be used by the Global ValuationCommittee include Market approach, Income approach and Cost approach. Valuation techniques such as discounted cash flow, use of market com-parables and matrix pricing are types of valuation approaches and typically used in determining fair value. When determining the price for Fair ValuedInvestments, the Global Valuation Committee, or its delegate, seeks to determine the price that the Master Portfolio might reasonably expect to receive orpay from the current sale or purchase of that asset or liability in an arm’s-length transaction. Fair value determinations shall be based upon all availablefactors that the Global Valuation Committee, or its delegate, deems relevant and consistent with the principles of fair value measurement. The pricing of allFair Valued Investments is subsequently reported to the Board or a committee thereof on a quarterly basis.
Fair Value Hierarchy: Various inputs are used in determining the fair value of investments and derivative financial instruments. These inputs to valuationtechniques are categorized into a fair value hierarchy consisting of three broad levels for financial statement purposes as follows:
‰ Level 1 — Unadjusted price quotations in active markets/exchanges for identical assets or liabilities that the Master Portfolio has the ability to access
‰ Level 2 — Other observable inputs (including, but not limited to, quoted prices for similar assets or liabilities in markets that are active, quoted pricesfor identical or similar assets or liabilities in markets that are not active, inputs other than quoted prices that are observable for the assets or liabilities(such as interest rates, yield curves, volatilities, prepayment speeds, loss severities, credit risks and default rates) or other market–corroborated inputs)
‰ Level 3 — Unobservable inputs based on the best information available in the circumstances, to the extent observable inputs are not available(including the Master Portfolio’s own assumptions used in determining the fair value of investments and derivative financial instruments)
The hierarchy gives the highest priority to unadjusted quoted prices in active markets for identical assets or liabilities (Level 1 measurements) and thelowest priority to unobservable inputs (Level 3 measurements). Accordingly, the degree of judgment exercised in determining fair value is greatest forinstruments categorized in Level 3. The inputs used to measure fair value may fall into different levels of the fair value hierarchy. In such cases, for dis-closure purposes, the fair value hierarchy classification is determined based on the lowest level input that is significant to the fair value measurement in itsentirety. Investments classified within Level 3 have significant unobservable inputs used by the Global Valuation Committee in determining the price for FairValued Investments. Level 3 investments include equity or debt issued by privately-held companies or funds. There may not be a secondary market, and/orthere are a limited number of investors. Level 3 investments may also be adjusted to reflect illiquidity and/or non-transferability, with the amount of suchdiscount estimated by the Global Valuation Committee in the absence of market information.
Changes in valuation techniques may result in transfers into or out of an assigned level within the hierarchy. In accordance with the Master Portfolio’spolicy, transfers between different levels of the fair value hierarchy are deemed to have occurred as of the beginning of the reporting period. The
22 ACTIVE STOCK MASTER PORTFOLIO JUNE 30, 2017

Notes to Financial Statements (continued)
categorization of a value determined for investments and derivative financial instruments is based on the pricing transparency of the investments andderivative financial instruments and is not necessarily an indication of the risks associated with investing in those securities.
4. Securities and Other Investments:
Securities Lending: The Master Portfolio may lend its securities to approved borrowers, such as brokers, dealers and other financial institutions. The bor-rower pledges and maintains with the Master Portfolio collateral consisting of cash, an irrevocable letter of credit issued by a bank, or securities issued orguaranteed by the U.S. Government. The initial collateral received by the Master Portfolio is required to have a value of at least 102% of the current valueof the loaned securities for securities traded on U.S. exchanges and a value of at least 105% for all other securities. The collateral is maintained thereafterat a value equal to at least 100% of the current market value of the securities on loan. The market value of the loaned securities is determined at the closeof each business day of the Master Portfolio and any additional required collateral is delivered to the Master Portfolio, or excess collateral returned by theMaster Portfolio, on the next business day. During the term of the loan, the Master Portfolio is entitled to all distributions made on or in respect of theloaned securities but does not receive interest income on securities received as collateral. Loans of securities are terminable at any time and the borrower,after notice, is required to return borrowed securities within the standard time period for settlement of securities transactions.
The market value of any securities on loan, all of which were classified as common stocks/corporate bonds/investment companies in the Master Portfolio’sSchedule of Investments, and the value of any related collateral are shown separately in the Statement of Assets and Liabilities as a component of invest-ments at value-unaffiliated, and collateral on securities loaned at value, respectively. As of period end, any securities on loan were collateralized by cashand/or U.S. Government obligations. Cash collateral invested by the securities lending agent, BlackRock Institutional Trust Company, N.A. (“BTC”), if any, isdisclosed in the Schedule of Investments.
Securities lending transactions are entered into by the Master Portfolio under Master Securities Lending Agreements (each, an “MSLA”), which provide theright, in the event of default (including bankruptcy or insolvency), for the non-defaulting party to liquidate the collateral and calculate a net exposure to thedefaulting party or request additional collateral. In the event that a borrower defaults, the Master Portfolio, as lender, would offset the market value of thecollateral received against the market value of the securities loaned. When the value of the collateral is greater than that of the market value of the secu-rities loaned, the lender is left with a net amount payable to the defaulting party. However, bankruptcy or insolvency laws of a particular jurisdiction mayimpose restrictions on or prohibitions against such a right of offset in the event of an MSLA counterparty’s bankruptcy or insolvency. Under the MSLA,absent an event of default, the borrower can resell or re-pledge the loaned securities, and the Master Portfolio can reinvest cash collateral received inconnection with loaned securities. Upon an event of default, the parties’ obligations to return the securities or collateral to the other party are extinguished,and the parties can resell or re-pledge the loaned securities or the collateral received in connection with the loaned securities in order to satisfy thedefaulting party’s net payment obligation for all transactions under the MSLA. The defaulting party remains liable for any deficiency.
As of period end, the following table is a summary of the Master Portfolio’s securities lending agreements by counterparty which are subject to offset underan MSLA:
Counterparty
SecuritiesLoaned at
Value
CashCollateralReceived1
NetAmount
Citigroup Global Markets, Inc. . . . . . . . . . . . . . . . . . . . . . . . . . . . . . . . . . . . . . . . . . . . . . . . . . . . . . . . . . . . . . . . . . . . . . . . . . . . $ 126,900 $ (126,900) —Credit Suisse Securities (USA) LLC . . . . . . . . . . . . . . . . . . . . . . . . . . . . . . . . . . . . . . . . . . . . . . . . . . . . . . . . . . . . . . . . . . . . . . . 3,511,912 (3,511,912) —Goldman Sachs & Co. . . . . . . . . . . . . . . . . . . . . . . . . . . . . . . . . . . . . . . . . . . . . . . . . . . . . . . . . . . . . . . . . . . . . . . . . . . . . . . . . 651,618 (651,618) —Jeffries LLC . . . . . . . . . . . . . . . . . . . . . . . . . . . . . . . . . . . . . . . . . . . . . . . . . . . . . . . . . . . . . . . . . . . . . . . . . . . . . . . . . . . . . . . . 2,127,114 (2,127,114) —JPMorgan Securities LLC . . . . . . . . . . . . . . . . . . . . . . . . . . . . . . . . . . . . . . . . . . . . . . . . . . . . . . . . . . . . . . . . . . . . . . . . . . . . . . . 11,734,570 (11,734,570) —Merrill Lynch, Pierce, Fenner & Smith Inc. . . . . . . . . . . . . . . . . . . . . . . . . . . . . . . . . . . . . . . . . . . . . . . . . . . . . . . . . . . . . . . . . . . . 1,698,940 (1,698,940) —Morgan Stanley & Co. LLC . . . . . . . . . . . . . . . . . . . . . . . . . . . . . . . . . . . . . . . . . . . . . . . . . . . . . . . . . . . . . . . . . . . . . . . . . . . . . 12,396,760 (12,396,760) —Wells Fargo Securities, LLC . . . . . . . . . . . . . . . . . . . . . . . . . . . . . . . . . . . . . . . . . . . . . . . . . . . . . . . . . . . . . . . . . . . . . . . . . . . . . 243,580 (243,580) —
Total $32,491,394 $(32,491,394) —
1 Cash collateral with a value of $33,482,890 has been received in connection with securities lending agreements. Collateral received in excess of the value of securities loanedfrom the individual counterparty is not shown for financial reporting purposes.
The risks of securities lending include the risk that the borrower may not provide additional collateral when required or may not return the securities whendue. To mitigate these risks, the Master Portfolio benefits from a borrower default indemnity provided by BlackRock, Inc. (“BlackRock”). BlackRock’sindemnity allows for full replacement of the securities loaned if the collateral received does not cover the value on the securities loaned in the event ofborrower default. The Master Portfolio could incur a loss if the value of an investment purchased with cash collateral falls below the market value of loanedsecurities or if the value of an investment purchased with cash collateral falls below the value of the original cash collateral received.
5. Derivative Financial Instruments:
The Master Portfolio engages in various portfolio investment strategies using derivative contracts both to increase the returns of the Master Portfolio and/orto manage its exposure to certain risks such as credit risk, equity risk, interest rate risk, foreign currency exchange rate risk, commodity price risk or other
ACTIVE STOCK MASTER PORTFOLIO JUNE 30, 2017 23

Notes to Financial Statements (continued)
risks (e.g., inflation risk). Derivative financial instruments categorized by risk exposure are included in the Schedule of Investments. These contracts may betransacted on an exchange or OTC.
Futures Contracts: Futures contracts are purchased or sold to gain exposure to, or manage exposure to, changes in interest rates (interest rate risk),changes in the value of equity securities (equity risk) or foreign currencies (foreign currency exchange rate risk).
Futures contracts are agreements between the Master Portfolio and a counterparty to buy or sell a specific quantity of an underlying instrument at a speci-fied price and on a specified date. Depending on the terms of a contract, it is settled either through physical delivery of the underlying instrument on thesettlement date or by payment of a cash amount on the settlement date. Upon entering into a futures contract, the Master Portfolio is required to depositinitial margin with the broker in the form of cash or securities in an amount that varies depending on a contract’s size and risk profile. The initial margindeposit must then be maintained at an established level over the life of the contract.
Securities deposited as initial margin are designated in the Schedule of Investments and cash deposited, if any, is shown as cash pledged for futurescontracts in the Statement of Assets and Liabilities. Pursuant to the contract, the Master Portfolio agrees to receive from or pay to the broker an amount ofcash equal to the daily fluctuation in market value of the contract (“variation margin”). Variation margin is recorded as unrealized appreciation(depreciation) and, if any, shown as variation margin receivable (or payable) on futures contracts in the Statement of Assets and Liabilities. When thecontract is closed, a realized gain or loss is recorded in the Statement of Operations equal to the difference between the value of the contract at the time itwas opened and the value at the time it was closed. The use of futures contracts involves the risk of an imperfect correlation in the movements in the priceof futures contracts and interest, foreign currency exchange rates or underlying assets.
6. Investment Advisory Agreement and Other Transactions with Affiliates:
The PNC Financial Services Group, Inc. is the largest stockholder and an affiliate of BlackRock for 1940 Act purposes.
Investment Advisory: MIP, on behalf of the Master Portfolio, entered into an Investment Advisory Agreement with the Manager, the Master Portfolio’sinvestment adviser, an indirect, wholly-owned subsidiary of BlackRock, to provide investment advisory services. The Manager is responsible for themanagement of the Master Portfolio’s portfolio and provides the personnel, facilities, equipment and certain other services necessary to the operations ofthe Master Portfolio.
For such services, the Master Portfolio pays the Manager a monthly fee at an annual rate equal to the following percentages of the average daily value ofthe Master Portfolio’s net assets:
Average Daily Net Assets Investment Advisory Fee
First $1 Billion . . . . . . . . . . . . . . . . . . . . . . . . . . . . . . . . . . . . . . . . . . . . . . . . . . . . . . . . . . . . . . . . . . . . . . . . . . . . . . . . . . . . . . . . . . . . . . . . . . . . . . . . . . 0.25%$1 Billion — $3 Billion . . . . . . . . . . . . . . . . . . . . . . . . . . . . . . . . . . . . . . . . . . . . . . . . . . . . . . . . . . . . . . . . . . . . . . . . . . . . . . . . . . . . . . . . . . . . . . . . . . . . . 0.24%$3 Billion — $5 Billion . . . . . . . . . . . . . . . . . . . . . . . . . . . . . . . . . . . . . . . . . . . . . . . . . . . . . . . . . . . . . . . . . . . . . . . . . . . . . . . . . . . . . . . . . . . . . . . . . . . . . 0.23%$5 Billion — $10 Billion . . . . . . . . . . . . . . . . . . . . . . . . . . . . . . . . . . . . . . . . . . . . . . . . . . . . . . . . . . . . . . . . . . . . . . . . . . . . . . . . . . . . . . . . . . . . . . . . . . . . 0.22%Greater than $10 Billion . . . . . . . . . . . . . . . . . . . . . . . . . . . . . . . . . . . . . . . . . . . . . . . . . . . . . . . . . . . . . . . . . . . . . . . . . . . . . . . . . . . . . . . . . . . . . . . . . . . 0.21%
Administration: MIP, on behalf of the Master Portfolio, entered into an Administration Agreement with BlackRock Advisors, LLC (“BAL”), which has agreedto provide general administration services (other than investment advice and related portfolio activities). BAL, in consideration thereof, has agreed to bearall of the Master Portfolio’s ordinary operating expenses, excluding, generally, investment advisory fees, distribution fees, brokerage and other expensesrelated to the execution of portfolio transactions, extraordinary expenses and certain other expenses which are borne by the Master Portfolio. BAL is entitledto receive for these administration services an annual fee of 0.10% based on the average daily net assets of the Master Portfolio.
From time to time, BAL may waive such fees in whole or in part. Any such waiver will reduce the expenses of the Master Portfolio and, accordingly, have afavorable impact on its performance. BAL may delegate certain of its administration duties to sub-administrators. For the six months ended June 30, 2017,BAL waived $253,490.
Expense Waivers: The Manager has voluntarily agreed to waive 0.095% of its investment advisory fees payable by the Master Portfolio. This voluntarywaiver may be terminated at any time. This amount is included in fees waived by the Manager in the Statement of Operations. For the six months endedJune 30, 2017, the Manager waived $240,815 pursuant to this arrangement.
With respect to the Master Portfolio, the Manager voluntarily agreed to waive its investment advisory fees by the amount of investment advisory fees theMaster Portfolio pays to the Manager indirectly through its investment in affiliated money market funds (the “affiliated money market fund waiver”). Thisamount is included in fees waived by the Manager in the Statement of Operations. The amount of waivers and/or reimbursements of fees and expensesmade pursuant to the expense limitation caps, as applicable, will be reduced by the amount of the affiliated money market fund waiver. For the six monthsended June 30, 2017, the amount waived was $19,634.
Securities Lending: The SEC has issued an exemptive order which permits BTC, an affiliate of the Manager, to serve as securities lending agent for theMaster Portfolio, subject to applicable conditions. As securities lending agent, BTC bears all operational costs directly related to securities lending. The
24 ACTIVE STOCK MASTER PORTFOLIO JUNE 30, 2017
Notes to Financial Statements (continued)
Master Portfolio is responsible for fees in connection with the investment of cash collateral received for securities on loan in a money market fundmanaged by the Manager or its affiliates, however, BTC has agreed to reduce the amount of securities lending income it receives in order to effectively limitthe collateral investment fees the Master Portfolio bears to an annual rate of 0.04% (the “collateral investment fees”). The money market fund in which thecash collateral has been invested may, under certain circumstances, impose a liquidity fee of up to 2% on the value redeemed or temporarily restrictredemptions for up to 10 business days during a 90 day period, in the event that the money market fund’s weekly liquid assets fall below certain thresholds.
Securities lending income is equal to the total of income earned from the reinvestment of cash collateral, net of fees and other payments to and fromborrowers of securities, and less the collateral investment fees. The Master Portfolio retains a portion of securities lending income and remits a remainingportion to BTC as compensation for its services as securities lending agent.
Pursuant to a securities lending agreement, the Master Portfolio retains 71.5% of securities lending income, and this amount retained can never be lessthan 65% of the total of securities lending income plus the collateral investment fees. In addition, commencing the business day following the date thatthe aggregate securities lending income earned across certain funds in the Equity-Liquidity Complex in a calendar year exceeds a specified threshold, theMaster Portfolio, pursuant to the securities lending agreement, will retain for the remainder of the calendar year securities lending income in an amountequal to 75% of securities lending income, and this amount retained can never be less than 65% of the total of securities lending income plus thecollateral investment fees.
The share of securities lending income earned by the Master Portfolio is shown as securities lending income — affiliated — net in the Statement of Operations.For the six months ended June 30, 2017, the Master Portfolio paid BTC $15,791 in total for securities lending agent services and collateral investment fees.
Interfund Lending: In accordance with an exemptive order (the “Order”) from the SEC, the Master Portfolio may participate in a joint lending and borrowingfacility for temporary purposes (the “Interfund Lending Program”), subject to compliance with the terms and conditions of the Order, and to the extentpermitted by the Master Portfolio’s investment policies and restrictions. The Master Portfolio is currently permitted to borrow and lend under the InterfundLending Program.
A lending BlackRock fund may lend in aggregate up to 15% of its net assets, but may not lend more than 5% of its net assets to any one borrowing fundthrough the Interfund Lending Program. A borrowing BlackRock fund may not borrow through the Interfund Lending Program or from any other source morethan 331⁄3% of its total assets (or any lower threshold provided for by the fund’s investment restrictions). If a borrowing BlackRock fund’s total outstandingborrowings exceed 10% of its total assets, each of its outstanding interfund loans will be subject to collateralization of at least 102% of the outstandingprincipal value of the loan. All interfund loans are for temporary or emergency purposes and the interest rate to be charged will be the average of thehighest current overnight repurchase agreement rate available to a lending fund and the bank loan rate, as calculated according to a formula establishedby the Board.
During the period ended June 30, 2017, the Master Portfolio did not participate in the Interfund Lending Program.
Officers and Trustees: The fees and expenses of the MIP trustees who are not “interested persons” of MIP, as defined in the 1940 Act (“IndependentTrustees”), counsel to the Independent Trustees and the Trust’s independent registered public accounting firm (together, the “independent expenses”) arepaid directly by the Master Portfolio. BAL and BFA have contractually agreed to reimburse MIP or provide an offsetting credit against the administrationfees paid by the Master Portfolio in an amount equal to these independent expenses through April 30, 2018. This amount is included in fees waived by theManager in the Statement of Operations. For the six months ended June 30, 2017, the amount waived was $21,570.
Certain officers and/or trustees of MIP are officers and/or trustees of BlackRock or its affiliates.
7. Purchases and Sales:
For the six months ended June 30, 2017, purchases and sales of investments, excluding short-term securities, were $639,089,010 and $407,891,611,respectively.
8. Income Tax Information:
The Master Portfolio is classified as a partnership for U.S. federal income tax purposes. As such, each investor in the Master Portfolio is treated as theowner of its proportionate share of net assets, income, expenses and realized and unrealized gains and losses of the Master Portfolio. Therefore, no U.S.federal income tax provision is required. It is intended that the Master Portfolio’s assets will be managed so an investor in the Master Portfolio can satisfythe requirements of Subchapter M of the Internal Revenue Code of 1986, as amended.
The Master Portfolio files U.S. federal and various state and local tax returns. No income tax returns are currently under examination. The statute of limi-tations on the Master Portfolio’s U.S. federal tax returns generally remains open for each of the four years ended December 31, 2016. The statutes oflimitations on the Master Portfolio’s state and local tax returns may remain open for an additional year depending upon the jurisdiction.
Management has analyzed tax laws and regulations and their application to the Master Portfolio as of June 30, 2017, inclusive of the open tax returnyears, and does not believe that there are any uncertain tax positions that require recognition of a tax liability in the Master Portfolio’s financial statements.
ACTIVE STOCK MASTER PORTFOLIO JUNE 30, 2017 25
Notes to Financial Statements (continued)
As of June 30, 2017, gross unrealized appreciation and depreciation based on cost for U.S. federal income tax purposes were as follows:
Tax cost . . . . . . . . . . . . . . . . . . . . . . . . . . . . . . . . . . . . . . . . . . . . . . . . . . . . . . . . . . . . . . . . . . . . . . . . . . . . . . . . . . . . . . . . . . . . . . . . . . . . . . . . . . . . . . . . . . . . . . $497,708,885
Gross unrealized appreciation . . . . . . . . . . . . . . . . . . . . . . . . . . . . . . . . . . . . . . . . . . . . . . . . . . . . . . . . . . . . . . . . . . . . . . . . . . . . . . . . . . . . . . . . . . . . . . . . . . . . . . . $ 42,915,015Gross unrealized depreciation . . . . . . . . . . . . . . . . . . . . . . . . . . . . . . . . . . . . . . . . . . . . . . . . . . . . . . . . . . . . . . . . . . . . . . . . . . . . . . . . . . . . . . . . . . . . . . . . . . . . . . . (13,533,797)
Net unrealized appreciation . . . . . . . . . . . . . . . . . . . . . . . . . . . . . . . . . . . . . . . . . . . . . . . . . . . . . . . . . . . . . . . . . . . . . . . . . . . . . . . . . . . . . . . . . . . . . . . . . . . . . . . . $ 29,381,218
9. Bank Borrowings:
MIP, on behalf of the Master Portfolio, along with certain other funds managed by the Manager and its affiliates (“Participating Funds”), is a party to a364-day, $2.1 billion credit agreement with a group of lenders. Under this agreement, the Master Portfolio may borrow to fund shareholder redemptions.Excluding commitments designated for certain individual funds, the Participating Funds, including the Master Portfolio, can borrow up to an aggregatecommitment amount of $1.6 billion at any time outstanding, subject to asset coverage and other limitations as specified in the agreement. The creditagreement has the following terms: a fee of 0.12% per annum on unused commitment amounts and interest at a rate equal to the higher of (a) one-monthLIBOR (but, in any event, not less than 0.00%) on the date the loan is made plus 0.80% per annum or (b) the Fed Funds rate (but, in any event, not lessthan 0.00%) in effect from time to time plus 0.80% per annum on amounts borrowed. The agreement expires in April 2018 unless extended or renewed.
Participating Funds paid administration, legal and arrangement fees, which, if applicable, are included in miscellaneous expenses in the Statement ofOperations. These fees were allocated among such funds based upon portions of the aggregate commitment available to them and relative net assets ofParticipating Funds.
During the six months ended June 30, 2017, the Master Portfolio did not borrow under the credit agreement.
10. Principal Risks:
In the normal course of business, the Master Portfolio invests in securities and enters into transactions where risks exist due to fluctuations in the market(market risk) or failure of the issuer to meet all its obligations, including the ability to pay principal and interest when due (issuer credit risk). The value ofsecurities held by the Master Portfolio may decline in response to certain events, including those directly involving the issuers of securities owned by theMaster Portfolio.
Investments in the securities of issuers domiciled in countries with emerging capital markets involve certain additional risks that do not generally apply toinvestments in securities of issuers in more developed capital markets, such as (i) low or nonexistent trading volume, resulting in a lack of liquidity andincreased volatility in prices for such securities; (ii) uncertain national policies and social, political and economic instability, increasing the potential forexpropriation of assets, confiscatory taxation, high rates of inflation or unfavorable diplomatic developments; and (iii) possible fluctuations in exchangerates, differing legal systems and the existence or possible imposition of exchange controls, custodial restrictions or other foreign or U.S. governmental lawsor restrictions applicable to such investments.
Changes arising from the general economy, the overall market and local, regional or global political and/or social instability, as well as currency, interestrate and price fluctuations, may also affect the securities’ value.
The Master Portfolio may be exposed to prepayment risk, which is the risk that borrowers may exercise their option to prepay principal earlier than sched-uled during periods of declining interest rates, which would force the Master Portfolio to reinvest in lower yielding securities. The Master Portfolio may alsobe exposed to reinvestment risk, which is the risk that income from the Master Portfolio’s portfolio will decline if the Master Portfolio invests the proceedsfrom matured, traded or called fixed-income securities at market interest rates that are below the Master Portfolio portfolio’s current earnings rate.
On October 11, 2016, BlackRock implemented certain changes required by amendments to Rule 2a-7 under the 1940 Act, which governs the operationsof U.S. money market funds. The Master Portfolio may be exposed to additional risks when reinvesting cash collateral in money market funds that do notseek to maintain a stable NAV per share of $1.00 and which may be subject to redemption gates or liquidity fees under certain circumstances.
Valuation Risk: The market values of equities, such as common stocks and preferred securities or equity related investments, such as futures and options,may decline due to general market conditions which are not specifically related to a particular company. They may also decline due to factors which affecta particular industry or industries. The Master Portfolio may invest in illiquid investments and may experience difficulty in selling those investments in atimely manner at the price that it believes the investments are worth. Prices may fluctuate widely over short or extended periods in response to company,market or economic news. Markets also tend to move in cycles, with periods of rising and falling prices. This volatility may cause the Master Portfolio’s NAVto experience significant increases or decreases over short periods of time. If there is a general decline in the securities and other markets, the NAV of theMaster Portfolio may lose value, regardless of the individual results of the securities and other instruments in which the Master Portfolio invests.
The price the Master Portfolio could receive upon the sale of any particular portfolio investment may differ from the Master Portfolio’s valuation of theinvestment, particularly for securities that trade in thin or volatile markets or that are valued using a fair valuation technique or a price provided by anindependent pricing service. Changes to significant unobservable inputs and assumptions (i.e., publicly traded company multiples, growth rate, time to
26 ACTIVE STOCK MASTER PORTFOLIO JUNE 30, 2017
Notes to Financial Statements (concluded)
exit) due to the lack of observable inputs may significantly impact the resulting fair value and therefore the Master Portfolio’s results of operations. As aresult, the price received upon the sale of an investment may be less than the value ascribed by the Master Portfolio, and the Master Portfolio could realizea greater than expected loss or lesser than expected gain upon the sale of the investment. The Master Portfolio’s ability to value its investments may alsobe impacted by technological issues and/or errors by pricing services or other third party service providers.
Counterparty Credit Risk: Similar to issuer credit risk, the Master Portfolio may be exposed to counterparty credit risk, or the risk that an entity may fail toor be unable to perform on its commitments related to unsettled or open transactions. The Master Portfolio manages counterparty credit risk by enteringinto transactions only with counterparties that the Manager believes have the financial resources to honor their obligations and by monitoring the financialstability of those counterparties. Financial assets, which potentially expose the Master Portfolio to market, issuer and counterparty credit risks, consistprincipally of financial instruments and receivables due from counterparties. The extent of the Master Portfolio’s exposure to market, issuer and counter-party credit risks with respect to these financial assets is approximately their value recorded in the Statement of Assets and Liabilities, less any collateralheld by the Master Portfolio.
A derivative contract may suffer a mark-to-market loss if the value of the contract decreases due to an unfavorable change in the market rates or values ofthe underlying instrument. Losses can also occur if the counterparty does not perform under the contract.
With exchange-traded futures, there is less counterparty credit risk to the Master Portfolio since the exchange or clearinghouse, as counterparty to suchinstruments, guarantees against a possible default. The clearinghouse stands between the buyer and the seller of the contract; therefore, credit risk islimited to failure of the clearinghouse. While offset rights may exist under applicable law, the Master Portfolio does not have a contractual right of offsetagainst a clearing broker or clearinghouse in the event of a default (including the bankruptcy or insolvency). Additionally, credit risk exists in exchange-traded futures with respect to initial and variation margin that is held in a clearing broker’s customer accounts. While clearing brokers are required tosegregate customer margin from their own assets, in the event that a clearing broker becomes insolvent or goes into bankruptcy and at that time there is ashortfall in the aggregate amount of margin held by the clearing broker for all its clients, typically the shortfall would be allocated on a pro rata basisacross all the clearing broker’s customers, potentially resulting in losses to the Master Portfolio.
11. Subsequent Events:
Management has evaluated the impact of all subsequent events on the Master Portfolio through the date the financial statements were issued and hasdetermined that there were no subsequent events requiring adjustment or additional disclosure in the financial statements.
ACTIVE STOCK MASTER PORTFOLIO JUNE 30, 2017 27

Disclosure of Investment Advisory Agreement
The Board of Trustees (the “Board,” the members of which are referred to as “Board Members”) of Master Investment Portfolio (the “Master Fund”) met inperson on April 20, 2017 (the “April Meeting”) and May 24-25, 2017 (the “May Meeting”) to consider the approval of the investment advisory agreement(the “Agreement”) between the Master Fund, on behalf of Active Stock Master Portfolio (the “Portfolio”), a series of the Master Fund, and BlackRock FundAdvisors (the “Manager” or “BlackRock”), the Master Fund’s investment advisor.
Activities and Composition of the Board
On the date of the May Meeting, the Board consisted of thirteen individuals, eleven of whom were not “interested persons” of the Master Fund as definedin the Investment Company Act of 1940, as amended (the “1940 Act”) (the “Independent Board Members”). The Board Members are responsible for theoversight of the operations of the Master Fund and perform the various duties imposed on the directors of investment companies by the 1940 Act. TheIndependent Board Members have retained independent legal counsel to assist them in connection with their duties. The Chair of the Board is anIndependent Board Member. The Board has established five standing committees: an Audit Committee, a Governance and Nominating Committee, aCompliance Committee, a Performance Oversight and Contract Committee and an Executive Committee, each of which is chaired by an Independent BoardMember and composed of Independent Board Members (except for the Executive Committee, which also has one interested Board Member).
The Agreement
Pursuant to the 1940 Act, the Board is required to consider the continuation of the Agreement on an annual basis. The Board has four quarterly meetingsper year, each extending over two days, a fifth one-day meeting to consider specific information surrounding the consideration of renewing the Agreementand additional in-person and telephonic meetings as needed. In connection with this year-long deliberative process, the Board assessed, among otherthings, the nature, extent and quality of the services provided to the Portfolio by BlackRock, BlackRock’s personnel and affiliates, including (as applicable):investment management; administrative and shareholder services; the oversight of fund service providers; marketing; risk oversight; compliance; and abilityto meet applicable legal and regulatory requirements.
The Board, acting directly and through its committees, considers at each of its meetings, and from time to time as appropriate, factors that are relevant toits annual consideration of the renewal of the Agreement, including the services and support provided by BlackRock to the Portfolio and its interest holders.BlackRock also furnished additional information to the Board in response to specific questions from the Board. This additional information is discussedfurther below in the section titled “Board Considerations in Approving the Agreement.” Among the matters the Board considered were: (a) investment per-formance for one-year, three-year, five-year, ten-year, and/or since inception periods, as applicable, against peer funds, applicable benchmark, and per-formance metrics, as applicable, as well as senior management’s and portfolio managers’ analysis of the reasons for any over-performance orunderperformance relative to its peers, benchmarks, and other performance metrics, as applicable; (b) fees, including advisory, administration, if appli-cable, and other amounts paid to BlackRock and its affiliates by the Portfolio for services; (c) Portfolio operating expenses and how BlackRock allocatesexpenses to the Portfolio; (d) the resources devoted to, risk oversight of, and compliance reports relating to, implementation of the Portfolio’s investmentobjective(s), policies and restrictions, and meeting regulatory requirements; (e) the Master Fund’s adherence to its compliance policies and procedures;(f) the nature, cost and character of non-investment management services provided by BlackRock and its affiliates; (g) BlackRock’s and other serviceproviders’ internal controls and risk and compliance oversight mechanisms; (h) BlackRock’s implementation of the proxy voting policies approved by theBoard; (i) the use of brokerage commissions and execution quality of portfolio transactions; (j) BlackRock’s implementation of the Master Fund’s valuationand liquidity procedures; (k) an analysis of management fees for products with similar investment mandates across the open-end fund, exchange-tradedfund (“ETF”), closed-end fund, sub-advised mutual fund, separately managed account, collective investment trust, and institutional separate accountproduct channels, as applicable, and the similarities and differences between these products and the services provided as compared to the Portfolio;(l) BlackRock’s compensation methodology for its investment professionals and the incentives and accountability it creates, along with investment pro-fessionals’ investments in the fund(s) they manage; and (m) periodic updates on BlackRock’s business.
Board Considerations in Approving the Agreement
The Approval Process: Prior to the April Meeting, the Board requested and received materials specifically relating to the Agreement. The Board is con-tinuously engaged in a process with its independent legal counsel and BlackRock to review the nature and scope of the information provided to betterassist its deliberations. The materials provided in connection with the April Meeting included (a) information independently compiled and prepared byBroadridge Financial Solutions, Inc. (“Broadridge”) on Portfolio fees and expenses as compared with a peer group of funds as determined by Broadridge(“Expense Peers”) and the investment performance of the Portfolio as compared with a peer group of funds as determined by Broadridge1; (b) informationon the profits realized by BlackRock and its affiliates pursuant to the Agreement and a discussion of fall-out benefits to BlackRock and its affiliates; (c) ageneral analysis provided by BlackRock concerning investment management fees charged to other clients, such as institutional clients, sub-advised mutualfunds, ETFs, closed-end funds, and separately managed accounts under similar investment mandates, as well as the performance of such other clients, asapplicable; (d) review of non-management fees; (e) the existence, impact and sharing of potential economies of scale; (f) a summary of aggregateamounts paid by the Portfolio to BlackRock; and (g) sales and redemption data regarding the Portfolio’s interests.
1 Funds are ranked by Broadridge in quartiles, ranging from first to fourth, where first is the most desirable quartile position and fourth is the least desirable.
28 ACTIVE STOCK MASTER PORTFOLIO JUNE 30, 2017

Disclosure of Investment Advisory Agreement (continued)
At the April Meeting, the Board reviewed materials relating to its consideration of the Agreement. As a result of the discussions that occurred during theApril Meeting, and as a culmination of the Board’s year-long deliberative process, the Board presented BlackRock with questions and requests for addi-tional information. BlackRock responded to these requests with additional written information in advance of the May Meeting.
At the May Meeting, the Board, including the Independent Board Members, approved the continuation of the Agreement between the Manager and theMaster Fund with respect to the Portfolio for a one-year term ending June 30, 2018. In approving the continuation of the Agreement, the Board considered:(a) the nature, extent and quality of the services provided by BlackRock; (b) the investment performance of the Portfolio; (c) the advisory fee and the costof the services and profits to be realized by BlackRock and its affiliates from their relationship with the Portfolio; (d) the Portfolio’s costs to investorscompared to the costs of Expense Peers and performance compared to the relevant performance metrics as previously discussed; (e) the sharing of poten-tial economies of scale; (f) fall-out benefits to BlackRock and its affiliates as a result of its relationship with the Portfolio; and (g) other factors deemedrelevant by the Board Members.
The Board also considered other matters it deemed important to the approval process, such as other payments made to BlackRock or its affiliates, secu-rities lending and cash management, services related to the valuation and pricing of portfolio holdings of the Portfolio, and advice from independent legalcounsel with respect to the review process and materials submitted for the Board’s review. The Board noted the willingness of BlackRock personnel toengage in open, candid discussions with the Board. The Board did not identify any particular information as determinative, and each Board Member mayhave attributed different weights to the various items considered.
A. Nature, Extent and Quality of the Services Provided by BlackRock: The Board, including the Independent Board Members, reviewed the nature, extentand quality of services provided by BlackRock, including the investment advisory services and the resulting performance of the Portfolio. Throughout theyear, the Board compared Portfolio performance to the performance of a comparable group of mutual funds, relevant benchmark, and performance met-rics, as applicable. The Board met with BlackRock’s senior management personnel responsible for investment activities, including the senior investmentofficers. The Board also reviewed the materials provided by the Portfolio’s portfolio management team discussing the Portfolio’s performance and thePortfolio’s investment objective(s), strategies and outlook.
The Board considered, among other factors, with respect to BlackRock: the number, education and experience of investment personnel generally and thePortfolio’s portfolio management team; BlackRock’s research capabilities; investments by portfolio managers in the funds they manage; portfolio tradingcapabilities; use of technology; commitment to compliance; credit analysis capabilities; risk analysis and oversight capabilities; and the approach totraining and retaining portfolio managers and other research, advisory and management personnel. The Board engaged in a review of BlackRock’scompensation structure with respect to the Portfolio’s portfolio management team and BlackRock’s ability to attract and retain high-quality talent andcreate performance incentives.
In addition to investment advisory services, the Board considered the quality of the administrative and other non-investment advisory services provided tothe Portfolio. BlackRock and its affiliates provide the Portfolio with certain administrative, shareholder and other services (in addition to any such servicesprovided to the Portfolio by third parties) and officers and other personnel as are necessary for the operations of the Portfolio. In particular, BlackRock andits affiliates provide the Portfolio with administrative services including, among others: (i) preparing disclosure documents, such as the prospectus, thesummary prospectus (as applicable), the statement of additional information and periodic shareholder reports; (ii) oversight of daily accounting andpricing; (iii) preparing periodic filings with regulators; (iv) overseeing and coordinating the activities of other service providers; (v) organizing Board meet-ings and preparing the materials for such Board meetings; (vi) providing legal and compliance support; (vii) furnishing analytical and other support toassist the Board in its consideration of strategic issues such as the merger, consolidation or repurposing of certain open-end funds; and (viii) performingother administrative functions necessary for the operation of the Portfolio, such as tax reporting, fulfilling regulatory filing requirements and call centerservices. The Board reviewed the structure and duties of BlackRock’s fund administration, shareholder services, and legal & compliance departments andconsidered BlackRock’s policies and procedures for assuring compliance with applicable laws and regulations.
B. The Investment Performance of the Portfolio and BlackRock: The Board, including the Independent Board Members, also reviewed and considered theperformance history of the Portfolio. In preparation for the April Meeting, the Board was provided with reports independently prepared by Broadridge, whichincluded a comprehensive analysis of the Portfolio’s performance. The Board also reviewed a narrative and statistical analysis of the Broadridge data thatwas prepared by BlackRock. In connection with its review, the Board received and reviewed information regarding the investment performance of thePortfolio as compared to other funds in its applicable Broadridge category. The Board was provided with a description of the methodology used by Broad-ridge to select peer funds and periodically meets with Broadridge representatives to review its methodology. The Board was provided with information onthe composition of the Broadridge performance universes and expense universes. The Board and its Performance Oversight and Contract Committee regu-larly review, and meet with Portfolio management to discuss, the performance of the Portfolio throughout the year.
In evaluating performance, the Board recognized that the performance data reflects a snapshot of a period as of a particular date and that selecting adifferent performance period could produce significantly different results. Further, the Board recognized that it is possible that long-term performance canbe adversely affected by even one period of significant underperformance so that a single investment decision or theme has the ability to affect long-termperformance disproportionately.
ACTIVE STOCK MASTER PORTFOLIO JUNE 30, 2017 29

Disclosure of Investment Advisory Agreement (continued)
The Board noted that for the one-, three- and five-year periods reported, the Portfolio ranked in the first, second, and second quartiles, respectively, againstits Broadridge Performance Universe.
C. Consideration of the Advisory/Management Fees and the Cost of the Services and Profits to be Realized by BlackRock and its Affiliates from theirRelationship with the Portfolio: The Board, including the Independent Board Members, reviewed the Portfolio’s contractual advisory fee rate compared withthe other funds in its Broadridge category. The contractual advisory fee rate is shown before taking into account any reimbursements or fee waivers. TheBoard also compared the Portfolio’s total expense ratio, as well as its actual advisory fee rate, to those of other funds in its Broadridge category. The totalexpense ratio represents a fund’s total net operating expenses, including any 12b-1 or non 12b-1 service fees. The total expense ratio gives effect to anyexpense reimbursements or fee waivers that benefit a fund, and the actual advisory fee rate gives effect to any advisory fee reimbursements or waivers thatbenefit a fund. The Board considered the services provided and the fees charged by BlackRock and its affiliates to other types of clients with similarinvestment mandates, as applicable, including institutional accounts and sub-advised mutual funds (including mutual funds sponsored by third parties).
The Board received and reviewed statements relating to BlackRock’s financial condition. The Board reviewed BlackRock’s profitability methodology and wasalso provided with a profitability analysis that detailed the revenues earned and the expenses incurred by BlackRock for services provided to the Portfolio.The Board reviewed BlackRock’s profitability with respect to the Portfolio and other funds the Board currently oversees for the year ended December 31,2015 compared to available aggregate profitability data provided for the prior two years. The Board reviewed BlackRock’s profitability with respect to cer-tain other U.S. fund complexes managed by the Manager and/or its affiliates. The Board reviewed BlackRock’s assumptions and methodology of allocatingexpenses in the profitability analysis, noting the inherent limitations in allocating costs among various advisory products. The Board recognized that profit-ability may be affected by numerous factors including, among other things, fee waivers and expense reimbursements by the Manager, the types of fundsmanaged, precision of expense allocations and business mix. As a result, calculating and comparing profitability at individual fund levels is difficult.
The Board noted that, in general, individual fund or product line profitability of other advisors is not publicly available. The Board reviewed BlackRock’soverall operating margin, in general, compared to that of certain other publicly-traded asset management firms. The Board considered the differencesbetween BlackRock and these other firms, including the contribution of technology at BlackRock, BlackRock’s expense management, and the relativeproduct mix.
In addition, the Board considered the cost of the services provided to the Portfolio by BlackRock, and BlackRock’s and its affiliates’ profits relating to themanagement and distribution of the Portfolio and the other funds advised by BlackRock and its affiliates. As part of its analysis, the Board reviewed Black-Rock’s methodology in allocating its costs of managing the Portfolio, to the Portfolio. The Board may receive and review information from independent thirdparties as part of its annual evaluation. The Board considered whether BlackRock has the financial resources necessary to attract and retain high qualityinvestment management personnel to perform its obligations under the Agreement and to continue to provide the high quality of services that is expectedby the Board. The Board further considered factors including but not limited to BlackRock’s commitment of time, assumption of risk, and liability profile inservicing the Portfolio in contrast to what is required of BlackRock with respect to other products with similar investment mandates across the open-endfund, ETF, closed-end fund, sub-advised mutual fund, separately managed account, collective investment trust, and institutional separate account productchannels, as applicable.
The Board noted that the Portfolio’s contractual advisory fee rate ranked in the first quartile, and that the actual advisory fee rate and total expense ratioeach ranked in the first quartile, relative to the Portfolio’s Expense Peers. The Board also noted that the Portfolio has an advisory fee arrangement thatincludes breakpoints that adjust the fee rate downward as the size of the Portfolio increases above certain contractually specified levels. The Board addi-tionally noted that BlackRock has voluntarily agreed to waive a portion of its administration and advisory fees payable by the Portfolio. This waiver may bediscontinued at any time without notice. The Board further noted that BlackRock and its affiliates have contractually agreed to reimburse or otherwisecompensate the Portfolio for the fees and expenses of the Independent Board Members, counsel to the Independent Board Members and the Portfolio’sindependent registered public accounting firm.
D. Economies of Scale: The Board, including the Independent Board Members, considered the extent to which economies of scale might be realized as theassets of the Portfolio increase, as well as the existence of expense caps, as applicable. The Board also considered the extent to which the Portfolio bene-fits from such economies in a variety of ways and whether there should be changes in the advisory fee rate or breakpoint structure in order to enable thePortfolio to more fully participate in these economies of scale. The Board considered the Portfolio’s asset levels and whether the current fee schedule wasappropriate.
E. Other Factors Deemed Relevant by the Board Members: The Board, including the Independent Board Members, also took into account other ancillary or“fall-out” benefits that BlackRock or its affiliates may derive from their respective relationships with the Portfolio, both tangible and intangible, such asBlackRock’s ability to leverage its investment professionals who manage other portfolios and risk management personnel, an increase in BlackRock’s pro-file in the investment advisory community, and the engagement of BlackRock’s affiliates as service providers to the Portfolio, including for administrative,distribution, securities lending and cash management services. The Board also considered BlackRock’s overall operations and its efforts to expand thescale of, and improve the quality of, its operations. The Board also noted that BlackRock may use and benefit from third party research obtained by softdollars generated by certain registered fund transactions to assist in managing all or a number of its other client accounts.
30 ACTIVE STOCK MASTER PORTFOLIO JUNE 30, 2017

Disclosure of Investment Advisory Agreement (concluded)
In connection with its consideration of the Agreement, the Board also received information regarding BlackRock’s brokerage and soft dollar practices. TheBoard received reports from BlackRock which included information on brokerage commissions and trade execution practices throughout the year.
Conclusion
The Board, including the Independent Board Members, approved the continuation of the Agreement between the Manager and the Master Fund withrespect to the Portfolio for a one-year term ending June 30, 2018. Based upon its evaluation of all of the aforementioned factors in their totality, as well asother information, the Board, including the Independent Board Members, was satisfied that the terms of the Agreement were fair and reasonable and in thebest interest of the Portfolio and its interest holders. In arriving at its decision to approve the Agreement, the Board did not identify any single factor orgroup of factors as all-important or controlling, but considered all factors together, and different Board Members may have attributed different weights tothe various factors considered. The Independent Board Members were also assisted by the advice of independent legal counsel in making this determi-nation. The contractual fee arrangements for the Portfolio reflect the results of several years of review by the Board Members and predecessor BoardMembers, and discussions between such Board Members (and predecessor Board Members) and BlackRock. As a result, the Board Members’ conclusionsmay be based in part on their consideration of these arrangements in prior years.
ACTIVE STOCK MASTER PORTFOLIO JUNE 30, 2017 31
Officers and Trustees
Rodney D. Johnson, Chair of the Board and TrusteeSusan J. Carter, TrusteeCollette Chilton, TrusteeNeil A. Cotty, TrusteeCynthia A. Montgomery, TrusteeJoseph P. Platt, TrusteeRobert C. Robb, Jr., TrusteeMark Stalnecker, TrusteeKenneth L. Urish, TrusteeClaire A. Walton, TrusteeFrederick W. Winter, TrusteeBarbara G. Novick, TrusteeJohn M. Perlowski, Trustee, President and Chief Executive OfficerThomas Callahan, Vice PresidentJennifer McGovern, Vice PresidentNeal J. Andrews, Chief Financial OfficerJay M. Fife, TreasurerCharles Park, Chief Compliance OfficerFernanda Piedra, Anti-Money Laundering Compliance OfficerBenjamin Archibald, Secretary
Investment AdviserBlackRock Fund AdvisorsSan Francisco, CA 94105
Accounting Agent and CustodianState Street Bank and Trust CompanyBoston, MA 02111
Legal CounselSidley Austin LLPNew York, NY 10019
AdministratorBlackRock Advisors, LLCWilmington, DE 19809
Independent Registered PublicAccounting FirmPricewaterhouseCoopers LLPPhiladelphia, PA 19103
Address of MIP400 Howard StreetSan Francisco, CA 94105
32 ACTIVE STOCK MASTER PORTFOLIO JUNE 30, 2017

Additional Information
Availability of Quarterly Schedule of Investments
The Master Portfolio files its complete schedule of portfolio holdings with the SEC for the first and third quarters of each fiscal year on Form N-Q. The MasterPortfolio’s Forms N-Q are available on the SEC’s website at http://www.sec.gov and may also be reviewed and copied at the SEC’s Public Reference Roomin Washington, D.C. Information on the operation of the Public Reference Room or how to access documents on the SEC’s website without charge may beobtained by calling (800) SEC-0330. The Master Portfolio’s Forms N-Q may also be obtained upon request and without charge by calling (800) 441-7762.
Availability of Proxy Voting Policies and Procedures
A description of the policies and procedures that the Master Portfolio uses to determine how to vote proxies relating to portfolio securities is available uponrequest and without charge (1) by calling (800) 441-7762; (2) at http://www.blackrock.com; and (3) on the SEC’s website at http://www.sec.gov.
Availability of Proxy Voting Record
Information about how the Master Portfolio voted proxies relating to securities held in the Master Portfolio’s portfolio during the most recent 12-monthperiod ended June 30 is available upon request and without charge (1) at http://www.blackrock.com or by calling (800) 441-7762 and (2) on the SEC’swebsite at http://www.sec.gov.
ACTIVE STOCK MASTER PORTFOLIO JUNE 30, 2017 33