portfolio and economic commentary - altrius · 2016-02-06 · small gains while international,...
TRANSCRIPT

Portfolio and Economic Commentary4th Quarter 2015

For the U.S. economy, 2015 was a decent year. RealGDP (inflation-adjusted) grew at a 2.2% annual rate(year over year through the third quarter)—nothing towrite home about but still better than most other majoreconomies which continue to struggle to recover fromthe financial crisis. Both the Eurozone and Japan grewby less than 2%. Emerging-market economies grew atan approximate 4% rate, but that has come down fromcloser to 8% prior to the financial crisis. Overall globalGDP growth last year was about 3%, well below the3.5% average global growth rate of the past 35 years,according to Ned Davis Research.
The U.S. labor market continued to strengthen duringthe year—the unemployment rate fell from 5.8% to5%, new job growth creation averaged a healthy210,000 per month (nonfarm payrolls), and wagegrowth ticked higher to 2.3% (average hourly workerearnings, year over year through November).Meanwhile, inflation remained subdued. The core CPIrate did rise to 2% in November, its highest since July2012. However, the Federal Reserve’s preferredinflation measure, the core PCE rate, remained stuck ataround 1.3%, well below the Fed’s 2% inflationobjective.
Nonetheless, the economic tea leaves were strongenough in December for the Fed to initiate its long-anticipated first interest rate increase since 2006, afterhaving cut the Federal Funds rate to near 0% in late2008. On December 16, it raised the Fed Funds rate by0.25%, to a target range of 0.25%–0.5%. Investors hadbeen expecting this, and global stock markets signaledtheir immediate approval by moving higher on the day.However, stocks fell back sharply over the followingdays with broader market indices ending the year withsmall gains while international, small and mid capindices all yielded negative returns.
More important than the impact of a 25-basis-pointincrease, the Fed emphasized it expects the pace of
future rate increases to likely be very gradual, given theirexpectation of continued restrained inflation.Specifically, the median Federal Open MarketCommittee participant forecast is for the Fed Funds rateto rise one percentage point, to 1.375% by the end of2016, and then to 2.375% by the end of 2017. Thisimplies four quarter-point rate increases each year, amuch shallower path than has historically been the caseonce the Fed embarks on a tightening of monetarypolicy. Meanwhile, the bond markets are discounting aneven slower and shallower path, along the lines of justtwo 25-bps rate hikes next year. It will be interesting tosee how that expectations gap between the Fed and themarket adjusts. If the Fed actually ends up raising ratesfour times next year, financial markets may not respondpositively.Meanwhile, despite the improvements on themacroeconomic front, the U.S. stock market was slightlypositive, posting its worst return since 2008. This is notnecessarily surprising, as the economic cycle and thestock market cycle do not move in lockstep. At this pointin the market cycle, good news for Main Street (i.e.stronger wage growth due to a to a tighter labor market)is not necessarily good news for Wall Street (corporate
MARKET AND ECONOMIC OUTLOOK
Portfolio and Economic Commentary
2
4th Quarter 2015
www.altriuscapital.com
profit margins are hurt when wages rise), at least overthe shorter term.
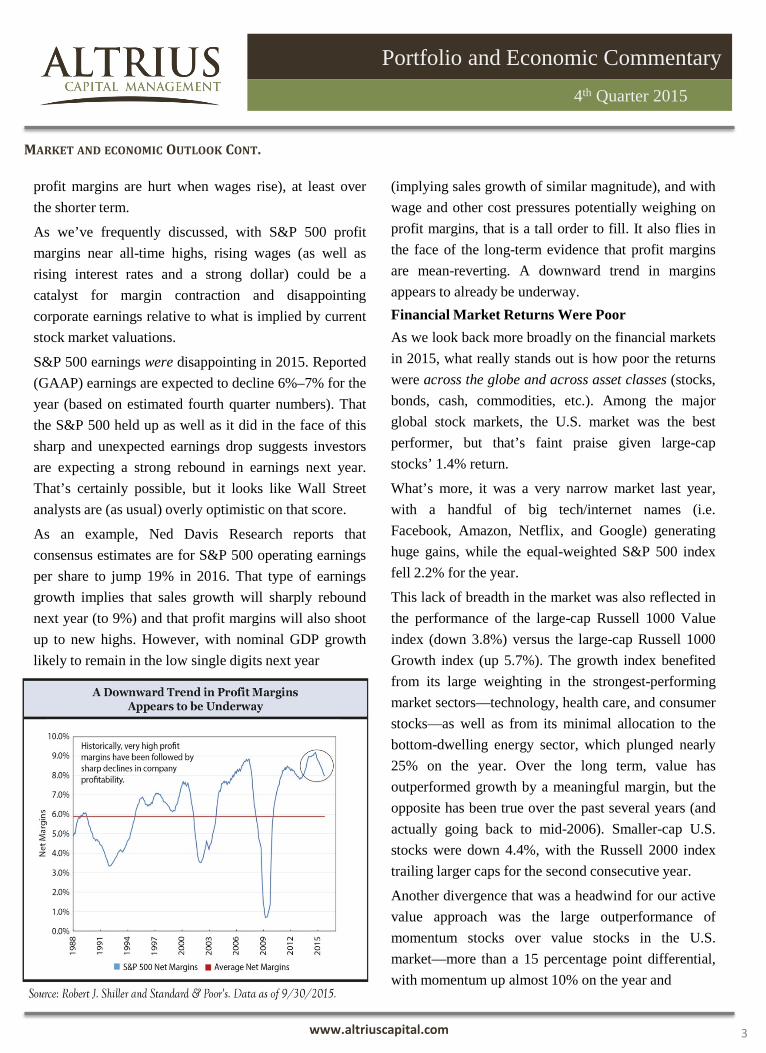
As we’ve frequently discussed, with S&P 500 profitmargins near all-time highs, rising wages (as well asrising interest rates and a strong dollar) could be acatalyst for margin contraction and disappointingcorporate earnings relative to what is implied by currentstock market valuations.
S&P 500 earnings were disappointing in 2015. Reported(GAAP) earnings are expected to decline 6%–7% for theyear (based on estimated fourth quarter numbers). Thatthe S&P 500 held up as well as it did in the face of thissharp and unexpected earnings drop suggests investorsare expecting a strong rebound in earnings next year.That’s certainly possible, but it looks like Wall Streetanalysts are (as usual) overly optimistic on that score.
As an example, Ned Davis Research reports thatconsensus estimates are for S&P 500 operating earningsper share to jump 19% in 2016. That type of earningsgrowth implies that sales growth will sharply reboundnext year (to 9%) and that profit margins will also shootup to new highs. However, with nominal GDP growthlikely to remain in the low single digits next year
(implying sales growth of similar magnitude), and withwage and other cost pressures potentially weighing onprofit margins, that is a tall order to fill. It also flies inthe face of the long-term evidence that profit marginsare mean-reverting. A downward trend in marginsappears to already be underway.Financial Market Returns Were PoorAs we look back more broadly on the financial marketsin 2015, what really stands out is how poor the returnswere across the globe and across asset classes (stocks,bonds, cash, commodities, etc.). Among the majorglobal stock markets, the U.S. market was the bestperformer, but that’s faint praise given large-capstocks’ 1.4% return.
What’s more, it was a very narrow market last year,with a handful of big tech/internet names (i.e.Facebook, Amazon, Netflix, and Google) generatinghuge gains, while the equal-weighted S&P 500 indexfell 2.2% for the year.
This lack of breadth in the market was also reflected inthe performance of the large-cap Russell 1000 Valueindex (down 3.8%) versus the large-cap Russell 1000Growth index (up 5.7%). The growth index benefitedfrom its large weighting in the strongest-performingmarket sectors—technology, health care, and consumerstocks—as well as from its minimal allocation to thebottom-dwelling energy sector, which plunged nearly25% on the year. Over the long term, value hasoutperformed growth by a meaningful margin, but theopposite has been true over the past several years (andactually going back to mid-2006). Smaller-cap U.S.stocks were down 4.4%, with the Russell 2000 indextrailing larger caps for the second consecutive year.
Another divergence that was a headwind for our activevalue approach was the large outperformance ofmomentum stocks over value stocks in the U.S.market—more than a 15 percentage point differential,with momentum up almost 10% on the year and
MARKET AND ECONOMIC OUTLOOK CONT.
Portfolio and Economic Commentary
3
4th Quarter 2015
www.altriuscapital.com
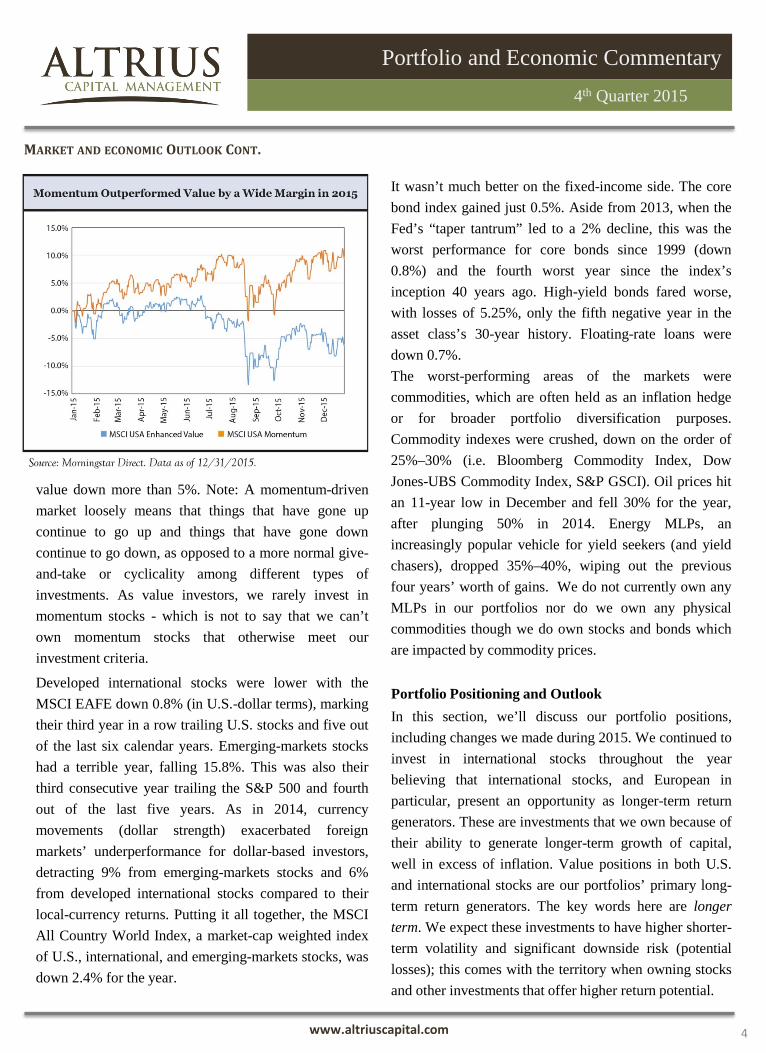
value down more than 5%. Note: A momentum-drivenmarket loosely means that things that have gone upcontinue to go up and things that have gone downcontinue to go down, as opposed to a more normal give-and-take or cyclicality among different types ofinvestments. As value investors, we rarely invest inmomentum stocks - which is not to say that we can’town momentum stocks that otherwise meet ourinvestment criteria.
Developed international stocks were lower with theMSCI EAFE down 0.8% (in U.S.-dollar terms), markingtheir third year in a row trailing U.S. stocks and five outof the last six calendar years. Emerging-markets stockshad a terrible year, falling 15.8%. This was also theirthird consecutive year trailing the S&P 500 and fourthout of the last five years. As in 2014, currencymovements (dollar strength) exacerbated foreignmarkets’ underperformance for dollar-based investors,detracting 9% from emerging-markets stocks and 6%from developed international stocks compared to theirlocal-currency returns. Putting it all together, the MSCIAll Country World Index, a market-cap weighted indexof U.S., international, and emerging-markets stocks, wasdown 2.4% for the year.
It wasn’t much better on the fixed-income side. The corebond index gained just 0.5%. Aside from 2013, when theFed’s “taper tantrum” led to a 2% decline, this was theworst performance for core bonds since 1999 (down0.8%) and the fourth worst year since the index’sinception 40 years ago. High-yield bonds fared worse,with losses of 5.25%, only the fifth negative year in theasset class’s 30-year history. Floating-rate loans weredown 0.7%.The worst-performing areas of the markets werecommodities, which are often held as an inflation hedgeor for broader portfolio diversification purposes.Commodity indexes were crushed, down on the order of25%–30% (i.e. Bloomberg Commodity Index, DowJones-UBS Commodity Index, S&P GSCI). Oil prices hitan 11-year low in December and fell 30% for the year,after plunging 50% in 2014. Energy MLPs, anincreasingly popular vehicle for yield seekers (and yieldchasers), dropped 35%–40%, wiping out the previousfour years’ worth of gains. We do not currently own anyMLPs in our portfolios nor do we own any physicalcommodities though we do own stocks and bonds whichare impacted by commodity prices.
Portfolio Positioning and OutlookIn this section, we’ll discuss our portfolio positions,including changes we made during 2015. We continued toinvest in international stocks throughout the yearbelieving that international stocks, and European inparticular, present an opportunity as longer-term returngenerators. These are investments that we own because oftheir ability to generate longer-term growth of capital,well in excess of inflation. Value positions in both U.S.and international stocks are our portfolios’ primary long-term return generators. The key words here are longerterm. We expect these investments to have higher shorter-term volatility and significant downside risk (potentiallosses); this comes with the territory when owning stocksand other investments that offer higher return potential.
MARKET AND ECONOMIC OUTLOOK CONT.
Portfolio and Economic Commentary
4
4th Quarter 2015
www.altriuscapital.com
We often write about how our tactical asset allocationinvestment process seeks to use shorter-term marketprice volatility to our long-term advantage—how weview volatility as creating investment opportunity in thecontext of our long-term investment approach.
Of course, while it is easy enough to say volatilitycreates opportunity, the reality is that volatility can bestressful and painful when you are actually experiencingit in your portfolio. While we don’t manage ourportfolios to specific volatility targets, we do managethem around defined 12-month downside lossthresholds, which vary depending on a client’s risktolerance. Therefore, as we invest in more volatile buthigher-returning asset classes and strategies, we are alsoincreasing the portfolio’s downside risk exposure, atleast over the shorter-term. Therefore, we are alwaysweighing and balancing an investment’s potentialcontribution to our portfolios’ short-term downside riskagainst our assessment of its longer-term returnprospects. Unfortunately, there is usually no free lunchin this regard: asset classes, individual stocks and bondsthat have higher long-term expected returns typicallycome with more volatility and short-term risk.
It is therefore critical that a stock investor has the abilityto withstand meaningful market volatility and shorter-
term losses in the pursuit of superior longer-terminvestment returns. This is precisely why our moreconservative risk-averse portfolios have lowerallocations to stocks, and we also make an effort tomoderate the risks of specific types of stocks byensuring we don’t have too much exposure to any onecompany and through a strategic beta, equal weightapproach.
Over the last few years, we’ve experienced more of thenegative effects of risk assets with our investments innon-U.S. stocks and high-yield bonds. However, withprospective returns in the low double digits in our basecase five-year scenario for European stocks, and highsingle digits for high yield (junk) bonds, we believe weare being well compensated for their risk and thatexposure to these sectors will pay off over time. Henceour decision to modestly increase our allocations toboth in 2015.
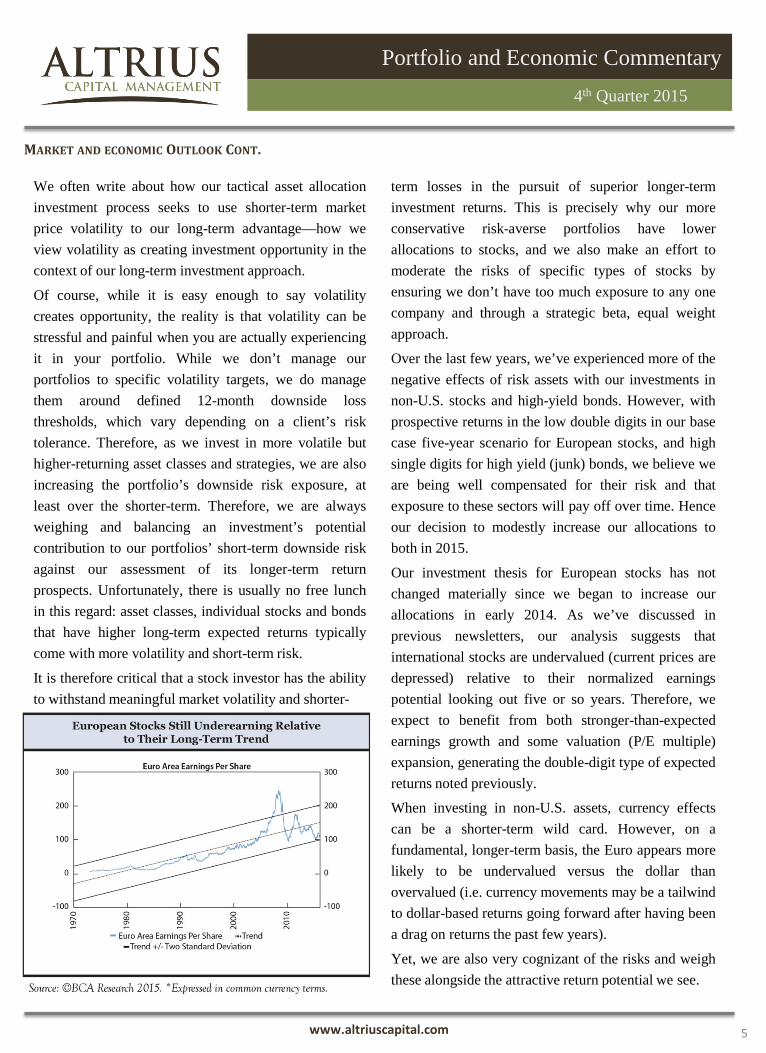
Our investment thesis for European stocks has notchanged materially since we began to increase ourallocations in early 2014. As we’ve discussed inprevious newsletters, our analysis suggests thatinternational stocks are undervalued (current prices aredepressed) relative to their normalized earningspotential looking out five or so years. Therefore, weexpect to benefit from both stronger-than-expectedearnings growth and some valuation (P/E multiple)expansion, generating the double-digit type of expectedreturns noted previously.
When investing in non-U.S. assets, currency effectscan be a shorter-term wild card. However, on afundamental, longer-term basis, the Euro appears morelikely to be undervalued versus the dollar thanovervalued (i.e. currency movements may be a tailwindto dollar-based returns going forward after having beena drag on returns the past few years).
Yet, we are also very cognizant of the risks and weighthese alongside the attractive return potential we see.
MARKET AND ECONOMIC OUTLOOK CONT.
Portfolio and Economic Commentary
5
4th Quarter 2015
www.altriuscapital.com
Consequently, we have been cautious in establishing thepositions in international stocks and still maintain amuch greater allocation to dividend paying U.S. largecap stocks. Given the ongoing volatility in internationalstocks in particular, this has been a wise approach.Ultimately, we expect our clients to be rewarded bythese holdings, but we also want our clients to becognizant of (and prepared for) potentially moredownside, despite already having suffered through alarge drop. The larger dividend from internationalstocks does at least pay us to be patient.
We are confident we will be rewarded for our currentallocations to international companies though we don’tknow precisely when those markets will turn around. Asthe old saying goes, “They don’t ring a bell at thebottom of the market” (or the top for that matter). Itrequires patience—another core element of ourinvestment process—to hold onto (and potentially addmore to) these long-term return generators during theperiods when they seem only to be downside-riskgenerators.
Conversely, when it comes to U.S. stocks, which havebeen the star performer over the past five-plus years, ourtactical outlook over the coming five years is much lesspositive compared to international stocks. Unlike theinternational market, our analysis suggests U.S.valuations – particularly for momentum/growth stocks -are high. Further, with U.S. corporate profit marginsalso above normal, we see potential for disappointingearnings growth and valuation multiple contraction. Asnoted earlier, earnings growth has disappointed recently,but multiples have risen. Our base case scenario resultsin low single digit expected returns for the S&P 500. Itis well below the upper-single-digit-type returns we arelooking for, at a minimum, from our long-term returngenerators. Therefore, we are tactically under-allocatedto U.S. stocks in our portfolios though continuing to findopportunities among lower P/E, dividend paying stocks.
Again, our positions are not based on a short-term view
.
of the market, or a prediction that a drop in U.S. stocksis imminent, or even that U.S. stocks will necessarilytrail non-U.S. stocks in 2016 (although it is verytempting to say they are due!). Financial market historyis a history of cycles (or like the swings of apendulum), moving from one extreme to another.Market history teaches us that undervalued assets canget even cheaper (fall further), and overvalued marketscan overshoot even further on the upside. That issimply the reality that comes with being a long-termequity investor. Valuation is a very poor short-termmarket indicator. However, over the longer term andover full market cycles (five to 10-plus years),valuation is a powerful driver of returns. Buyingundervalued assets pays off over time, but you need towithstand the discomfort that typically accompanies itas you wait for markets to turn in your favor.
Given the very low current yield on core bonds, theirpotential return is lower than in previous periods whenthe yield was much higher, while the short-termdownside risk for equities remains as high as it hasever been. (For example, we assume 12-month declinesof 25%–30% for global stocks in our “severe stresstest” scenario.) Thus, even though core bonds maymitigate some of the shorter-term downside risk fromstocks in our portfolios, the degree to which they coulddo so is more limited in the current market cycle. Thispast year was a good example of this, with core bondsbarely positive while global stocks were negative.
Moreover, looking out over our tactical five-year timehorizon, expected returns for core bonds are very low,in the 0%–2% range. That is a high price to pay (interms of low longer-term returns) for the risk-reductionbenefits of core bonds, even as valuable as thosebenefits may be for our balanced portfolios. For thisreason, we find it more attractive to maintain positionsin high yield bonds though additional short term lossesare certainly possible in unstable economic conditions.
MARKET AND ECONOMIC OUTLOOK CONT.
Portfolio and Economic Commentary
6
4th Quarter 2015
www.altriuscapital.com
Conclusion
We aren’t sad to say goodbye to 2015. While the globaleconomy trudged ahead, it was a crummy year for mostmajor asset classes and financial markets. While therewere some pockets of outperformance, we aredisappointed in our portfolios’ overall performance.However, we’d reiterate that it is in the nature of ourlong-term, fundamental, valuation-driven investmentapproach to go through periods of subpar performance,particularly when momentum is driving markets, whichhas been the case the past couple of years. Even themost skilled investors suffer multiyear periods ofunderperformance. It is exactly during these challengingperiods that it is most critical, but also of course mostdifficult, for an investor to stick with his or her approachand remain disciplined in order to ultimately harvest thelong-term rewards.
When executed with discipline and patience, ourinvestment process has proven its worth over multiplemarket cycles since our firm’s founding almost 20 yearsago. It is fundamentally long-term in structure and basedon a full-cycle analytical framework. Moreover, one ofthe tenets of our process (and the aspect that hasn’tworked as well in recent years) is the idea of buyingunderpriced investments that can be expected torebound. This is essentially value investing, which has atrack record of success that goes back many, manydecades, well before our founding.
.
We’re confident that the fundamental drivers of long-term investment returns have not changed. Whenshorter-term market movements become more at oddswith longer-term outcomes, there will be compellinglonger-term investment opportunities for us and ourclients. As discussed previously, we have a number ofsuch positions currently in our portfolio. We may evenget the opportunity to add to them or establish someothers before this cycle turns. In other words, we thinkit is prudent to be prepared for potentially increasedmarket volatility and shorter-term downside risk (aswell as positive returns), while maintaining the healthypatience, perspective, and discipline necessary forlong-term investment and financial success.
As always, we appreciate your continued trust andconfidence. Should you have questions regarding oureconomic and market outlook, our investment processor if your personal financial circumstances or risktolerance has changed, please don’t hesitate to contactus. We wish you and your families a happy, healthyand prosperous New Year!
MARKET AND ECONOMIC OUTLOOK CONT.
Portfolio and Economic Commentary
7
4th Quarter 2015
www.altriuscapital.com

• We dig deep for value often viewing crisis as anopportunity. We believe that fundamental research andpatience are critical to long term success and that overtime, the price of a company will rise to reflect thevalue of the underlying firm viewing each purchase asif were buying a piece of a business – not simply astock certificate.
• We believe that global revenue generation is a keycomponent to growth and sustainability and invest incompanies with global growth opportunities. We areunafraid to take contrarian positions, but remaindiligent about the risks of a global economy.
Our investment philosophy is predicated on a time-tested, three pronged approach providing solid riskadjusted returns to our investors for well over a decade.
• We believe in the importance of getting paidimmediately for the risks which are taken and focus onbusinesses which compensate our clients withdividends and above average interest. We believethis income stream, coupled with capital appreciation, isa vital aspect of total return.
GLOBAL INCOME STRATEGY COMMENTARY
Portfolio and Economic Commentary
8
The Global Income strategy finished 2015 with a 7.96%loss versus a gain of 0.59% for the blended balancedbenchmark. The trailing 10-year returns for the strategyare 5.29% versus 6.02% for the blended benchmark.The twelve month trailing yield for the Global Incomestrategy stands at 5.44% versus 1.71% for the VanguardBalanced index fund (VBINX).
During the year, we continued to trim back our exposureto domestic equities, feeling market valuations hadbecome somewhat inflated. At the same time valuationsin the high yield fixed income market are returning tomore rational levels, of which we have begun to allocatemore funds to the purchase of ‘higher quality’ non-investment grade issues. The recent market selloffpresents opportunities both domestically and abroad andour portfolio has a more attractive price to earnings ratioof 15.07 which is far less than the broader marketindices – most of which currently maintain multiples inexcess of 18. Our focus continues to emphasize theimportance of immediate income to our investorsparticularly in this volatile, low interest rateenvironment, which we believe will persist for longerthan most economists. In the fixed income sector, ouremphasis remains on high yield bonds, which we believemore adequately compensates our investors for creditrisk, while providing better protection in a potentiallyrising interest rate environment.
PERFORMANCE COMMENTARY
Top Five Equity Holdings Weight
Phillips 66 1.38%
Microsoft 1.27%
McDonalds Corp. 1.26%
General Motors 1.26%
Mattel 1.17%
Top Five Fixed Income Holdings Weight
International Game Technology 0.60%
Rent-A-Center 0.59%
Cooper Tire & Rubber 0.59%
Icahn Enterprises 0.55%
Credit Acceptance Corp. 0.54%
4th Quarter 2015
38%
20%
38%
2% 1%
U.S. Large Cap DividendIncome
International ADRDividend Income
Unconstrained FixedIncome
Cash
Other
Sector Allocation
www.altriuscapital.com

Classic value stocks sell at attractive valuations andprovide above-average dividend yields and growth.Persistent earners are companies which have steadyand predictable earnings and that are selling belowtheir historic valuation. The distressed/contrariancategory refers to stocks that are out of favor due towhat we perceive to be temporary factors and are likelyto appreciate substantially as the temporarilydistressing factor recedes. Typically the distressedcategory is the smallest in the portfolio.
As value investors, we constantly focus on our duty toprotect the principal of our investments even as we lookfor ways to grow them over time as well. As economists,we remain alert to trends taking place in the largerglobal economy. As analysts, we seek to invest insecurities priced with a margin of safety in order toaccount for their near term volatility and our uncertaintyabout what the future holds. With this in mind, we lookfor opportunities in three specific categories: classicvalue, persistent earners, and distressed or contrarian.
US LARGE CAP DIVIDEND INCOME STRATEGY COMMENTARY
Portfolio and Economic Commentary
9
The U.S. Large Cap Dividend Income strategy had a solidquarter gaining 5.58% for the quarter though finishing 2015lower with a loss of 3.18%. Our strategy outpaced theRussell 1000 Value index for the year as the index fell3.38% during 2015. The strategy has produced sound tenyear risk adjusted returns roundly besting its indices andpeer group for the period. The trailing annualized ten yearreturns were 7.54% for the strategy, 6.16% for the Russell1000 Value index and 6.50% for the Dow Jones US SelectDividend index.
Our stock selection had a positive impact on relativeperformance; however, our sector allocation weightingsdetracted slightly from our relative performance during2015. The consumer defensive, consumer cyclical andtechnology sectors were our largest attributors to relativeperformance while basic materials and industrials were thelargest detractors. Though maintaining a focus ondividends, we believe the utility and real estate sectorsremain overvalued and will perform poorly in a risinginterest rate environment; thus, we do not have any positionsin the sectors. The top performers for the year were Chubb(30.8%), McDonald’s (30.4%), Darden Restaurants (25.8%),Eli Lilly (23.8%) and Microsoft (22.7%). The bottomperformers were Freeport-McMoRan (-70.1%), MarathonOil (-54.2%), ConocoPhillips (-29.0%). KKR & Co. (-27.9%) and International Paper (-27.2%).
PERFORMANCE COMMENTARY
Top Ten Holdings Weight
Phillips 66 3.57%
Microsoft 3.29%
McDonalds 3.26%
General Motors 3.26%
Mattel 3.04%
Intel 3.02%
Kellogg 2.96%
Pepsico 2.93%
JPMorgan Chase & Co. 2.92%
Philip Morris 2.90%
4th Quarter 2015
Sector Allocation (Morningstar)
22%
18%
16%
12%
10%
9%
6%6%
2%Financial Services
Consumer Cyclical
Energy
Technology
Industrials
Consumer Defensive
Healthcare
Communications Services
Basic Materials
www.altriuscapital.com

As one may recognize from the below chart, our firmhas consistently provided a steady stream of income toour clients in the form of dividends. It is our assertionthat this income stream has not only reduced the risk ofour portfolio, but also provided a large part of the totalreturn thereby leading to our performance success overthis past tumultuous decade plus.
We believe that dividends allow our investors to “getpaid to wait” while patiently working through volatilebusiness and market cycles. This strategy providesemotional support during difficult cycles enablinginvestors to weather turbulent periods utilizingdividend income for personal needs or to reinvest cashat lower valuations. Our strategy is not only groundedin psychological and behavioral finance concepts, butis also supported by empirical evidence outperformingin both negative and full market cycles.
Dividends also act to align the interests of corporationsand shareholders in helping to eliminate the agencyeffect. Corporate boards have recognized the value ofdividends in stabilizing their stock price andencouraging investment during both high and lower taxregimes. In supporting and increasing dividends overtime, managers are compelled to maintain a reliablestream of cash flows to shareholders rather than wastecapital on those expenses adding little to corporaterevenue including executive perks, pet projects, and ill-timed, unwise acquisitions. It appears a paradox;however, our experience and academic studies havedisplayed that sufficient investment for a good businesscan still occur in conjunction with dividends asmanagers are forced to invest cash flow more prudentlyand only in those capital investments in which they havethe highest conviction in adding to corporate revenueparticularly since stocks buybacks are often ill-timed.
US LARGE CAP DIVIDEND INCOME STRATEGY COMMENTARY
Portfolio and Economic Commentary
10
ALTRIUS: TWELVE YEARS OF CONSISTENT DIVIDENDS
4th Quarter 2015
Source: Standard and Poor's
The Altrius Large cap Dividend strategy has consistently delivered a higher dividend yield than the S&P 500 since inception.
www.altriuscapital.com
0.00%
0.50%
1.00%
1.50%
2.00%
2.50%
3.00%
3.50%
4.00%
4.50%
Altrius Large Caend Income vs S&P 500 Dividend Yield
Altrius LC S&P 500

US LARGE CAP DIVIDEND INCOME STRATEGY OVERVIEW
Portfolio and Economic Commentary
11
Though we were busy last quarter adding and subtracting from companies which have both declined and appreciatedin price, we made no new additions to our portfolio.
CHANGES TO OUR PORTFOLIOS
4th Quarter 2015
www.altriuscapital.com
Classic value stocks sell at attractive valuations andprovide above-average dividend yields and growth.Persistent earners are companies which have steadyand predictable earnings and that are selling belowtheir historic valuation. The distressed/contrariancategory refers to stocks that are out of favor due towhat we perceive to be temporary factors and are likelyto appreciate substantially as the temporarilydistressing factor recedes. Typically the distressedcategory is the smallest in the portfolio.
As value investors, we constantly focus on our duty toprotect the principal of our investments even as we lookfor ways to grow them over time as well. As economists,we remain alert to trends taking place in the largerglobal economy. As analysts, we seek to invest insecurities priced with a margin of safety in order toaccount for their near term volatility and our uncertaintyabout what the future holds. With this in mind, we lookfor opportunities in three specific categories: classicvalue, persistent earners, and distressed or contrarian.
INTERNATIONAL ADR DIVIDEND INCOME STRATEGY COMMENTARY
Portfolio and Economic Commentary
12
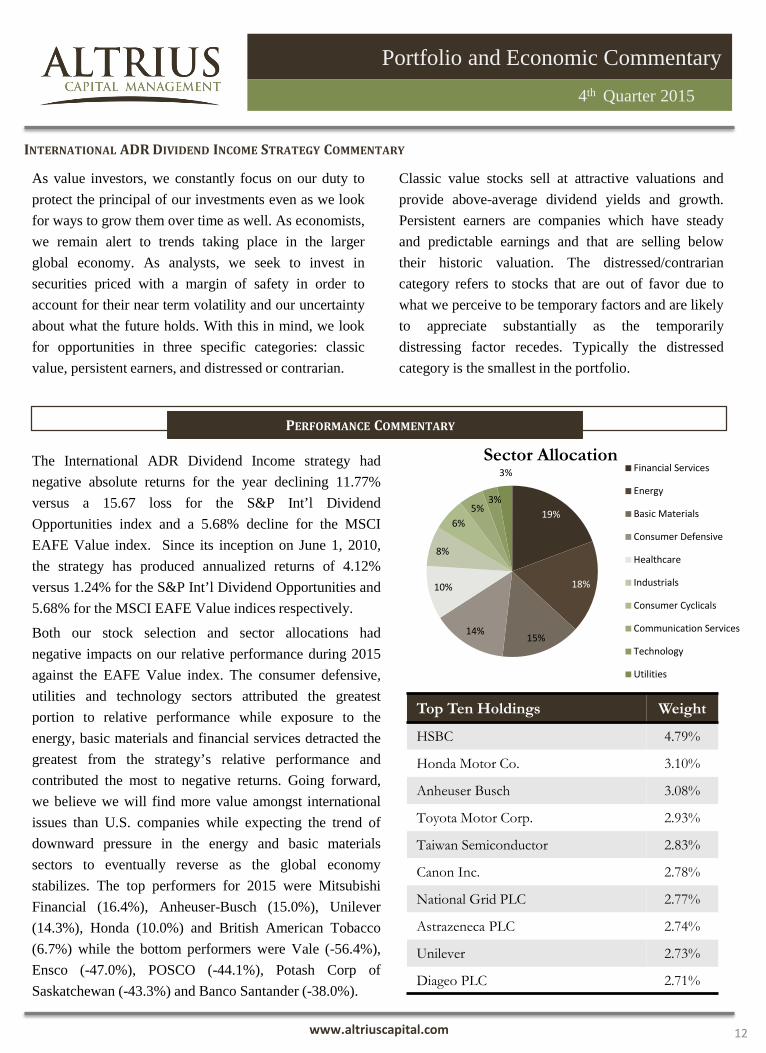
The International ADR Dividend Income strategy hadnegative absolute returns for the year declining 11.77%versus a 15.67 loss for the S&P Int’l DividendOpportunities index and a 5.68% decline for the MSCIEAFE Value index. Since its inception on June 1, 2010,the strategy has produced annualized returns of 4.12%versus 1.24% for the S&P Int’l Dividend Opportunities and5.68% for the MSCI EAFE Value indices respectively.
Both our stock selection and sector allocations hadnegative impacts on our relative performance during 2015against the EAFE Value index. The consumer defensive,utilities and technology sectors attributed the greatestportion to relative performance while exposure to theenergy, basic materials and financial services detracted thegreatest from the strategy’s relative performance andcontributed the most to negative returns. Going forward,we believe we will find more value amongst internationalissues than U.S. companies while expecting the trend ofdownward pressure in the energy and basic materialssectors to eventually reverse as the global economystabilizes. The top performers for 2015 were MitsubishiFinancial (16.4%), Anheuser-Busch (15.0%), Unilever(14.3%), Honda (10.0%) and British American Tobacco(6.7%) while the bottom performers were Vale (-56.4%),Ensco (-47.0%), POSCO (-44.1%), Potash Corp ofSaskatchewan (-43.3%) and Banco Santander (-38.0%).
PERFORMANCE COMMENTARY
Top Ten Holdings Weight
HSBC 4.79%
Honda Motor Co. 3.10%
Anheuser Busch 3.08%
Toyota Motor Corp. 2.93%
Taiwan Semiconductor 2.83%
Canon Inc. 2.78%
National Grid PLC 2.77%
Astrazeneca PLC 2.74%
Unilever 2.73%
Diageo PLC 2.71%
4th Quarter 2015
19%
18%
15%14%
10%
8%
6%5%
3%
Financial Services
Energy
Basic Materials
Consumer Defensive
Healthcare
Industrials
Consumer Cyclicals
Communication Services
Technology
Utilities
Sector Allocation
www.altriuscapital.com
3%

INTERNATIONAL ADR DIVIDEND INCOME STRATEGY OVERVIEW
Portfolio and Economic Commentary
13
CHANGES TO OUR PORTFOLIOS
4th Quarter 2015
www.altriuscapital.com
Though we had an active quarter making purchases to securities which were underweight while taking gainsfrom overweight positions, we made no purchases of new securities.

including government securities, corporate bonds, andmortgage- and asset-backed. Sources of added value:Credit Analysis - We emphasize independent analysisand do not rely on credit agencies.Duration Risk - We avoid long, extreme durationshifts generally operating within a moderate durationrange typically between two and four years.High Income - Our research attempts to identify issuespaying above average income.Risk Premium Management - We seek to attain anattractive yield/spread in relation to a five-year treasurywithin acceptable levels of portfolio risk.
Based on our macroeconomic outlook over a three tofive year period and our cyclical views from quarter toquarter, we employ top-down strategies that focus onyield curve positioning, volatility, and sector rotation.We then utilize bottom-up analysis to drive our securityselection process and facilitate the identification ofundervalued securities with the potential for aboveaverage income. We invest in securities that operateacross diversified sectors in the fixed income markets ofthe United States, primarily those in U.S. dollardenominated high yield and investment grade bonds,
UNCONSTRAINED FIXED INCOME STRATEGY COMMENTARY
Portfolio and Economic Commentary
14www.altrius-capital.com
MARKET OVERVIEW
Volatility in the fixed income markets showed no signsof abating in the fourth quarter of 2015, but ratherescalated in the closing weeks of the year, largely inresponse to the continued slide in oil and commodityprices, as well as a spike in investors’ fears overliquidity in the high yield market. Most all corporatebond indexes, both investment grade and high yield,posted losses for the year while U.S. Treasuries andother sovereign debt securities generated marginallypositive returns to close out 2015. In December, the Feddecided to raise rates, perhaps prematurely, for the firsttime in seven years, increasing its target funds rate0.25%, which had negative impacts on longer-datedrate-sensitive fixed income securities. In sum, investorsfound few places in the fixed income markets togenerate any meaningful returns in 2015. The outlookfor 2016 remains equally challenging with the potentialfor continued rising rates and with uncertaintysurrounding the greater global economy.
PERFORMANCE SUMMARY
The Unconstrained Fixed Income strategy experiencedits worst year since 2008, finishing 2015 down 10.23%.Market volatility in the latter half of the year pushedmost all price levels in the high yield marketplace down,and put increased pressure on our distressed positions
PERFORMANCE COMMENTARY
Top Ten Holdings Weight
International Game Technology 1.53%
Rent-A-Center 1.51%
Cooper Tire & Rubber 1.51%
Icahn Enterprises 1.41%
Credit Acceptance 1.39%
American Greetings 1.35%
GFI Group 1.34%
Oppenheimer Holdings 1.32%
Gap Inc 1.31%
AngloGold Ashanti 1.29%
Sector Allocation
4th Quarter 2015
24%
18%
13%
11%
8%
6%
5%
5%3%3%
2%2%
Consumer Discretionary
Energy
Financials
Industrials
Materials
Consumer Staples
Telecommunication Services
Healthcare
Information Technology
Utilities
Services
Cash

www.altrius-capital.com
Portfolio and Economic Commentary
15
UNCONSTRAINED FIXED INCOME STRATEGY COMMENTARY
in the energy, consumer discretionary and materialssectors. The Unconstrained Fixed Income strategyunderperformed the Barclays Aggregate bond andBarclays Corp BB+ indexes over both the fourthquarter and the year as a whole, with each indexgenerating returns for 2015 of +0.55% and -0.68%respectively. As value investors however, weunderstand we will always experience periods ofunderperformance – particularly when attempting toprovide a greater than average return in a low interestrate environment. We remain committed to positioningthe strategy in such a way as to produce a high level ofincome year-over-year, and even withstanding periodicdefaults above average long-term returns. We seek toachieve these dual ends through broad issuediversification and maintaining a long-term disciplinedmindset in our investment approach.
STRATEGY CHARACTERISTICS
In closing out 2015, consumer discretionary and energyremained the strategy’s two most heavily investedsectors, ending the year with each accounting forroughly 23% and 18% respectively of the strategy’stotal invested assets. The strategy’s exposure to theenergy sector declined roughly 3% during the fourthquarter of 2015, largely due to market valuation lossesas energy related bonds fell into further distress as oilprices continued to decline and concerns over globalgrowth remained pessimistic. Despite the strategy’sexposure to the energy and consumer discretionarysectors, we continue to invest in a wide array ofunaffiliated companies across multiple sectors in orderto provide broad diversification and help mitigateagainst issue specific credit risk.
The strategy’s overall credit quality improvedmarginally during the quarter, moving from anaggregate ‘B’ rating to ‘B+’. This move, albeit smalland to a greater degree intangible in effect, is reflectiveof our focused effort over the prior two quarters to takeadvantage of the volatility in the fixed income markets
and reinvest the strategy’s cash flows into higher qualityissues as spreads on BB to BBB- rated companiesexpanded from the historically tight levels that were beingmaintained over the prior three plus years. The strategy’saggregate maturity and effective duration remained largelyunchanged over the quarter, each contracting roughly 3%over Q3 2015 levels. Currently, the aggregate maturity forthe Unconstrained Fixed Income strategy resides at 3.9years (effective duration = 3.1), with the longest dated‘non-callable’ issue(s) in the strategy set to mature inFebruary of 2021.
STRATEGY OUTLOOK
The strategy’s exposure to the energy sector has been themajor source of distress and market value declines withinthe portfolio. We do not anticipate that the marketenvironment in the high yield fixed income space for 2016will change much from the current levels of volatility weare experiencing, especially as it pertains to the energy andmaterials sectors. However, as long-term income focusedinvestors we believe that the best opportunities in the fixedincome market remain in high yield corporate bonds. Ascredit spreads and market valuations on non-investmentgrade debt have expanded to approach long-term‘normalized’ averages, we are currently increasing ourexposure to, as well as establishing new positions in whatwe refer to as ‘higher quality high yield’; issues whichtypically offer 400-500 bps spreads with credit ratingsranging from B+ to BBB-. Our investment processremains unchanged guided by top-down macroeconomicresearch and bottom-up quantitative analysis.
4th Quarter 2015
1%
27%
50%
22%
0%10%20%30%40%50%60%
< 1 Year 1 - 3 Years 3 - 5 Years 5 - 7 Years
Maturity Distribution

UNCONSTRAINED FIXED INCOME STRATEGY OVERVIEW
Portfolio and Economic Commentary
16
Con-way Inc. 7.250% 1/15/18 – 5.4% YTM
Con-way Inc. (XPO) and its consolidated subsidiariesprovide transportation, logistics, and supply-chainmanagement services for a wide range of manufacturing,industrial, and retail customers. On October 30, 2015Con-way was acquired by XPO Logistics Inc. makingthe new entity the second largest ‘less-than-truckload’provider in North America. Prior to the XPO Logisticsacquisition, Con-way maintained an investment gradecredit rating of BBB- with leverage (total debt/EBITDA)kept below 2.0x year-over-year, and interest coverage(EBIT/interest expense) ranged between 3.5x and 5.0x.Now as part of XPO Logistics, the Con-way 2018 seniorunsecured notes trade at a slight premium to par value,down from the +10% premium value the notesmaintained prior to the announcement of the acquisition,and bear a CCC+ credit rating reflecting the liquidity andleverage profile of the new combined entity. Since theacquisition was just completed and finalized in the firsthalf of Q4 2015, it will take some time for the strongoperating fundamentals of Con-way to formallymaterialize and synergize with XPO Logistics ownbusiness operations, but we feel the solvency of the Con-way senior notes has in no way been jeopardized by theacquisition and we are being more than adequatelycompensated with a +450 bps credit spread on the notes.v
NEW PORTFOLIO PURCHASES
Although aluminum prices, along with other globalcommodities, have experienced continued declines overthe past couple of years due to slow global economicactivity and excess supplies, Novelis has producedconsistent year-over-year operating income growth ofbetween 4% and 6% over the past five years, even as netsales have tapered down marginally. Novelis has alsomaintained an overall leverage profile of around 5.0x(total debt/EBITDA) over the past five plus years, aswell as consistently providing annual interest coverage(EBIT/interest expense) of roughly 1.5x for its debtservice payments. As we do not expect the globalmacroeconomic environment to change much fromcurrent levels, we believe Novelis’ operatingperformance will continue to remain consistent andpredictable, benefiting from its leading market presence,geographic diversification, and broad array of end-market customers.
Novelis Inc. is the world’s leading aluminum rolledproducts producer and beverage can recycler. Anoperating subsidiary of the Indian aluminummanufacturer Hindalco Industries (which is itself asubsidiary of the Indian multinational conglomerateAditya Vikram Birla), Novelis serves a broad array ofcustomers in sectors ranging from beverage cans andpackaging to automotive manufacturing and constructionmaterials. Novelis currently maintains operations in 11countries throughout the world and conducts the majorityof its business in the North American and Europeanmarkets, which each account for roughly 33% of netsales year-over-year followed by Asia and SouthAmerica at roughly 18% and 15% respectively.
4th Quarter 2015
www.altrius-capital.com
Novelis Inc. 8.750% 12/15/20 – 8.4% YTM
Yum Brands Inc. 3.750% 11/1/21 – 5.0% YTM
Yum Brands Inc. (YUM), along with its subsidiaries, isthe owner, operator, and franchisor of quick servicerestaurants, most notably KFC, Taco Bell, and Pizza Hut.As of 2015 Yum operates approximately 41,000restaurant locations in over 125 countries and territoriesthroughout the world. Currently, Yum has very modestleverage with a total debt/EBITDA profile of less than1.25x; however, Yum plans to issue roughly $6 billion ofadditional debt capital to partially fund shareholderfriendly initiatives/returns in the coming year(s), whichwill expand its overall leverage to approximately 5.0x.Financial engineering aside, Yum’s global operations,mass market appeal, and increasing efforts to expand itsfranchising efforts enhance the Company’s ability toconsistently produce stable year-over-year cash flows.Yum maintains very good liquidity, given its steady cashflow generating abilities, and has historically providedinterest coverage (EBIT/interest expense) of between7.0x and 15.0x; however we do anticipate interestcoverage to settle and remain in the mid-to-high singledigits after the Company, as previously mentioned,proceeds to issue additional debt in the coming year(s).
UNCONSTRAINED FIXED INCOME STRATEGY OVERVIEW
Portfolio and Economic Commentary
17
Noble Energy Inc. 5.875% 6/11/22 – 6.0% YTM
Noble Energy Inc. (NBL) is an independent oil and gasexploration and production company with continentaloperations in the Denver-Julesburg Basin and MarcellusShale of the United States, as well as offshore operationsin the Gulf of Mexico, Eastern Mediterranean and WestAfrica. Since oil prices began their precipitous decline inthe latter part of 2014, Noble’s annual interest coverage(EBIT/interest expense) has decreased from levels inexcess of 10.0x (in years prior to 2014) to just below4.5x for the most recent FYE. Traditionally, Noble hasmaintained a modest leverage profile below 2.0x (totaldebt/EBITDA), however in 2015 the Companycompleted a $3.9 billion acquisition of Rosetta Resources($1.8 billion coming from debt financing), and enteredinto a handful of debt exchange programs to refinanceexisting debt obligations and extend maturity dates; all ofwhich will increase Noble’s aggregate leverage into thehigh single to low double digit multiples’ of totaldebt/EBITDA. Despite the impact of record low oilprices on Noble’s operating income and the increase inannual interest expense from the Company’s expandedleveraging activities, we deem that liquidity will remainadequate with low single digit interest coverage beingsustained over the life of the 2022 5.875% senior notes,with further support coming from available cash of over$1.0 billion on the balance sheet and an untapped $4.0billion available in an unsecured revolving credit facility.
NEW PORTFOLIO PURCHASES
Wheels, Halt and Catch Fire, and The Walking Dead; thelatter series of which set a record in 2014 of 17.3 millionviewers with the broadcast of its season five premiere.AMC Networks maintains a BB credit rating (a notchbelow investment grade), which is supported andexpected to remain stable given the Company’s moderateleverage and persistent track record of strong free cashflow generation. AMC Networks also possesses a goodand stable liquidity profile with interest coverage(EBIT/interest expense) being maintained between 2.5xand 5.0x year-over-year for the last five years, which isfurther supported with over $300 million of cashcurrently held on the balance sheet, an untapped $500million revolving credit facility, and projected free cashflows of around $250 million anticipated over the courseof the coming year(s). Over the course of 2015, AMCNetworks reduced its overall leverage (totaldebt/EBITDA) from roughly 4.5x as of FYE 2014 toroughly 3.5x as of the most recent quarter end (Q3 2015);as such we do anticipate our 2021 7.750% seniorunsecured notes will be called away within the nextcouple of years, if not sometime in 2016, as theCompany is expected to continue to generate excess cashflows and maintain leverage below 4.0x.
AMC Networks Inc. (AMCX) owns and operates variouscable television brands including most notably AMC, theIndependent Film Channel (IFC), WE tv (originallylaunched and known as Romance Classics in 1997), andSundance TV (formally known as Sundance Channel).While AMC Networks runs syndicated programming onits IFC, WE tv, SundanceTV, and BBC Americanetworks, the Company is heavily involved with theproduction of original content on its self-labeled AMCnetwork, and in recent years has received critical acclaimfor several of its scripted dramatic series such as MadMen, Breaking Bad, Turn: Washington’s Spies, Hell on
4th Quarter 2015
www.altrius-capital.com
AMC Networks Inc. 7.750% 7/15/21 – 6.5% YTM
Case New Holland Inc. 7.875% 12/1/17 – 4.6% YTM
Initially created and incorporated in the Netherlands asCNH Global NV following a 1999 merger of USconstruction and agricultural equipment manufacturersCase Corporation and New Holland Machine Company,the company which will henceforth be referred to as CaseNew Holland, has formally been registered andrecognized as CNH Industrial NV (CNHI) after CNHGlobal NV merged with Fiat Industrial S.p.A. of Italy in2013. Case New Holland has five operating segments:agricultural equipment, commercial vehicles,powertrains, construction equipment, and financialservices, with the former two segments typicallyaccounting for roughly 50% and 35% respectively ofyear-over-year net sales. Despite the cyclical nature ofboth the agricultural and industrial machine sectors, long-term demand fundamentals are stable, and Case NewHolland benefits from its competitive market position,particularly in the farm equipment business both

UNCONSTRAINED FIXED INCOME STRATEGY OVERVIEW
Portfolio and Economic Commentary
18
domestically and abroad with over 56% of sales comingfrom outside the US. Over its roughly two yearoperating existence, Case New Holland has maintained aleverage profile of roughly 5.5x (total debt/EBITDA), aswell as producing annual interest coverage(EBIT/interest expense) in the range of 3.0x to 3.5x.Although Case New Holland’s leverage and interestcoverage fundamentals are typically more characteristicof a company or single issue credit that would hold a B+to BB- credit rating, Case New Holland’s non-callable2017 7.875% senior notes maintain a credit rating ofBB+ (one notch below investment grade status), which isreflective of favorable long-term demand fundamentalsin the agricultural equipment sector, the Company’scompetitive market position, as well as the additionalliquidity support of a $2.4 billion revolving credit facilitywhich expires in November of 2019.
NEW PORTFOLIO PURCHASES
4th Quarter 2015
www.altrius-capital.com

DISCLOSURES
Portfolio and Economic Commentary
This report includes candid statements and observations regarding investment strategies, individual securities, andeconomic and market conditions; however, there is no guarantee that these statements, opinions or forecasts willprove to be correct. These comments may also include the expression of opinions that are speculative in nature andshould not be relied on as statements of fact. Altrius is committed to communicating with our investment partners ascandidly as possible because we believe our investors benefit from understanding our investment philosophy andapproach. Our views and opinions include “forward-looking statements” which may or may not be accurate over thelong term. Forward-looking statements can be identified by words like “believe,” “expect,” “anticipate,” or similarexpressions. You should not place undue reliance on forward-looking statements, which are current as of the date ofthis report. We disclaim any obligation to update or alter any forward-looking statements, whether as a result of newinformation, future events or otherwise. While we believe we have a reasonable basis for our appraisals and we haveconfidence in our opinions, actual results may differ materially from those we anticipate.
The information provided in this material should not be considered a recommendation to buy, sell or hold anyparticular security. The S&P 500® Index is an unmanaged index of 500 selected common stocks, most of which arelisted on the New York Stock Exchange. The Index is adjusted for dividends, weighted towards stocks with largemarket capitalizations and represents approximately two-thirds of the total market value of all domestic commonstocks. The Russell 1000 Value Index is an unmanaged index commonly used as a benchmark to measure valuemanager performance and characteristics. The Dow Jones U.S. Select Dividend Index is an unmanaged indexcommonly used as a benchmark to measure dividend manager performance and characteristics. The Russell 2000Index, the Russell 2000 Growth Index, and the Russell 2000 Value Index are unmanaged indices commonly used asbenchmarks to measure small cap manager performance and characteristics. The MSCI EAFE® Index is a free float-adjusted market capitalization index that is designed to measure developed market equity performance, excluding theU.S. & Canada. The Barclays Capital U.S. Aggregate Bond Index and Barclays Corporate BB+ Index areunmanaged indices that are commonly used as benchmarks to measure fixed income performance andcharacteristics. Index performance returns do not reflect any management fees, transaction costs or expenses.Investments cannot be made directly in an index. Investments made with Altrius Capital Management, Inc. arenot deposits or obligations of any bank, are not guaranteed by any bank, are not insured by the FDIC or anyother agency, and involve investment risks, including possible loss of the principal amount invested. Pastperformance is not a guarantee of future returns.
19
4th Quarter 2015
www.altriuscapital.com