portable electronic tongue based on microsensors for the...
TRANSCRIPT
sensors
Article
Portable Electronic Tongue Based on Microsensorsfor the Analysis of Cava Wines
Pablo Giménez-Gómez 1, Roger Escudé-Pujol 1, Fina Capdevila 2, Anna Puig-Pujol 2,Cecilia Jiménez-Jorquera 1 and Manuel Gutiérrez-Capitán 1,*
1 Instituto de Microelectrónica de Barcelona (IMB-CNM), CSIC Campus UAB, 08193 Cerdanyola del Vallès,Spain; [email protected] (P.G.-G.); [email protected] (R.E.-P.); [email protected] (C.J.-J.)
2 Institut Català de la Vinya i el Vi (IRTA-INCAVI), Plaça Àgora 2, 08720 Vilafranca del Penedès, Spain;[email protected] (F.C.); [email protected] (A.P.-P.)
* Correspondence: [email protected]; Tel.: +34-93-594-7700; Fax: +34-93-580-0267
Academic Editors: Takeshi Onodera and Kiyoshi TokoReceived: 30 August 2016; Accepted: 24 October 2016; Published: 27 October 2016
Abstract: Cava is a quality sparkling wine produced in Spain. As a product with a designation oforigin, Cava wine has to meet certain quality requirements throughout its production process;therefore, the analysis of several parameters is of great interest. In this work, a portableelectronic tongue for the analysis of Cava wine is described. The system is comprised of compactand low-power-consumption electronic equipment and an array of microsensors formed by sixion-selective field effect transistors sensitive to pH, Na+, K+, Ca2+, Cl−, and CO3
2−, one conductivitysensor, one redox potential sensor, and two amperometric gold microelectrodes. This system,combined with chemometric tools, has been applied to the analysis of 78 Cava wine samples. Resultsdemonstrate that the electronic tongue is able to classify the samples according to the aging time,with a percentage of correct prediction between 80% and 96%, by using linear discriminant analysis,as well as to quantify the total acidity, pH, volumetric alcoholic degree, potassium, conductivity,glycerol, and methanol parameters, with mean relative errors between 2.3% and 6.0%, by usingpartial least squares regressions.
Keywords: portable equipment; electrochemical microsensors; electronic tongue; multiparametricanalysis; Cava wine samples
1. Introduction
Multiparametric analysis is a key issue for quality assurance in many different areas of interest,such as the industrial processes [1], the food industry [2], clinical diagnostics [3], or environmentalmonitoring [4]. In order to obtain real-time information about the composition of a sample, automaticand portable systems for decentralized analysis are highly valuable. A promising alternative is theapplication of electronic tongues, which generate multivariate analytical data, enlarging the number ofparameters that can be determined simultaneously [5]. An electronic tongue entails the use of an arrayof sensors with partially-selective responses, plus a multivariate chemometric tool, and permitsqualitative and/or quantitative applications in liquid media [6,7]. Among the different chemicalsensors, microelectrodes fabricated with semiconductor technology present some advantages thatmake them particularly suitable for integration into arrays for on-site measurements, such as theminiaturization, robustness, high reproducibility, low output impedance, mass fabrication, and ease ofintegration with the electronic circuitry [8,9].
The applicability of electronic tongues has been especially relevant in food quality control andsafety, where the increasing demand on a sustainable and high-quality production has promoted thedevelopment of more automated and precise analytical systems for monitoring [10,11]. Wine is one of
Sensors 2016, 16, 1796; doi:10.3390/s16111796 www.mdpi.com/journal/sensors

Sensors 2016, 16, 1796 2 of 12
the most used beverages to test the viability of these systems [12]. Cava is a quality sparkling wineprotected under a designation of origin (D.O.) in Spain, which is produced mostly in the Penedèsregion. Unlike most wines, sparkling wines are characterized by the presence of CO2 in solution,which is produced by a second alcoholic fermentation, and a biological aging in contact with leesunder anaerobic conditions for at least nine months in the bottle [13]. It is significant to mentionthe complexity of the Cava wine as a sample, given the drastic changes in the chemical composition(CO2, sugars, ethanol, pH, amino acids), physical properties (turbidity, density, color), and varietalaromas produced by these fermentation and aging processes [14]. Only one research group fromthe Universitat Autònoma de Barcelona has approached the analysis of Cava with electronic tonguesystems. This group was able to classify Cava wine samples according to the content of sugar added [15]and to the aging time in bottle [16], as well as to determine the sugar and the total dry extract byusing a voltammetric electronic tongue based on modified graphite-epoxy electrodes. In anotherwork, the use of enzyme-modified sensors in the array allowed the quantification of different phenolicindices in Rosé Cava wines [17]. However, these systems were limited to the determination of justa few parameters, so it is necessary to develop more versatile and innovative tools for the analysisof Cava wine.
Most electronic tongue systems reported until now for food quality are laboratory versions [10,11],partly due to the use of large-sized sensors and data collection equipment. On one hand,the miniaturization of the electronic tongue has been approached by using individual wireelectrodes [18] or developing integrated arrays of sensors. Usually, these arrays have a planarconfiguration and include layers of conductive inks or pastes sequentially deposited onto insulatingand chemically-inert substrates. Depending on the thickness of these layers, integrated arraysof sensors have been fabricated by using screen-printed methods (thick-film technology) andapplied as portable devices for monitoring drinking waters [19] and beer discrimination [20].Additionally, thin-film technologies have been also used to fabricate integrated multisensor systemscombined with flow injection analysis [9] and portable taste sensors [21], both by using standardphotolithographic techniques.
On the other hand, an alternative to obtaining versatile portable instruments for multiparametricapplications at a minimum cost is the use of commercial integrated circuits (IC), such as power supplies,analog-to-digital converters, and microcontrollers [22]. The reduced size of these systems impliesreduced fabrication and maintenance costs, as well as lower power consumption. In a previouspaper [23], we developed and tested a compact multisensor meter, whose electronics were fabricatedaccording to microsensor requirements and took into account the minimum energy consumption andits portability. In this work, we have fabricated a multi- ion-selective field effect transistor (ISFET) meterable to simultaneously measure up to six ISFETs, with the same requirements of portability and lowpower consumption. The two compact meters have been used together to perform the multiparametricanalysis with an array of microsensors fabricated with microelectronic technology. This combinationsupposes an advance to achieve a portable electronic tongue system. The array of microsensors wasformed by one conductivity sensor, one redox potential (ORP) sensor, and two amperometric goldmicroelectrodes, which were measured with the multisensor meter, together with six ISFETs sensitiveto pH, Na+, K+, Ca2+, Cl−, and CO3
2−, measured with the multi-ISFET meter. For the data treatment,two different multivariate methods were used: linear discriminant analysis (LDA) and partial leastsquares (PLS). A set of 78 Cava wine samples was analyzed with the electronic tongue. The systemdemonstrated its reliability for Cava wines according to the aging time, as well as the quantification ofsome chemical parameters with high accuracy.
2. Materials and Methods
2.1. Reagents and Solutions
All reagents used were of high purity, analytical grade or equivalent. All solutions were preparedwith de-ionized water. For ISFET calibration, stock solutions with ionic salts with concentrations of

Sensors 2016, 16, 1796 3 of 12
10−4, 10−2, and 1.0 M were prepared. In the case of those sensitive to cations (Na+, K+, and Ca2+),the corresponding chloride salts were considered. For the Cl− and CO3
2− ions, solutions of NaCl andNaHCO3, respectively, were prepared. For the pH ISFET calibration, a universal buffer solutioncontaining 0.04 M boric acid, 0.04 M acetic acid, 0.04 M phosphoric acid, and 0.1 M KNO3 asa background was prepared. A solution containing 0.1 M KNO3 was used to activate the amperometricgold electrodes. In order to calibrate the conductivity sensor, two different standard solutions fromCrison (Barcelona, Spain), with nominal values of 1413 µS/cm and 147 µS/cm, were utilized. Twostandard redox solutions from Panreac (Barcelona, Spain), with values of 468 mV and 220 mV(at 25 ◦C vs. Ag/AgCl), were used to test the ORP sensor. For the ISFET measurements, a referencesolution containing an average concentration of the main species present in wine was prepared.The composition of this solution has been reported elsewhere [24].
2.2. Cava Wine Samples
A total set of 78 Cava wine samples from different producers were analyzed. All samples wereproduced and bottled in the Catalonia region and they are all commercially available. Samples wereselected according to their type, taking into account their vintage time as categorized by the RegulatoryBoard of Cava [25]: 20 “Young” samples (9–15 months), 25 “Reserva” samples (15–30 months),and 16 “Gran Reserva” samples (more than 30 months). Moreover, a set of 17 “Rosé” Cava sampleswere included in this study. These samples were mainly from the Penedès region (Spain). WhiteCava wines were obtained mainly from Macabeu, Xarel·lo, and Parellada grape varieties, althoughChardonnay and/or Subirat parent may also be used, that is, the five different white grape varietiesauthorized by Regulatory Board of Cava [25]. For Rosé cava wines, Trepat, Monastrell, Grenache Noir,and/or Pinot Noir might be used.
Volumetric alcoholic degree (VAD), total acidity, pH, potassium ion, conductivity, glycerol,and methanol were analyzed with reference/standard methods [26,27] in all 78 Cava samples atthe Catalan Institute of Vine and Wine (IRTA-INCAVI) in order to compare and evaluate the results ofthe developed electronic tongue.
2.3. Sensors and Devices Used
A set of ISFET sensors were fabricated using standard microelectronic technology [28]. One ISFETwas used for measuring pH and the rest were modified with polymeric membranes sensitive toNa+, K+, Ca2+, Cl−, and CO3
2− ions. Polymeric membranes were based on photocurable polymerswith commercial ionophores from Fluka (Buchs, Switzerland). The ionophores used in each casewere: 4-tert-butylcalix [4] arenetetraacetic acid tetraethyl ester (Ionophore X) for Na+, valinomycin(Ionophore I) for K+, N,N,N′,N′-tetracyclohexyl-3-oxapentanediamide (Ionophore II, ETH 129) for Ca2+,tridodecylmethylammonium chloride for Cl−, and 4-butyl-α,α,α-trifluoroacetophenone (Ionophore IV)for CO3
2−. All of these ionophores are selective to the principal ion, but are not specific and theypresent a certain degree of cross-response to other ions in solution. Membrane composition andpreparation has been presented elsewhere [29–32]. An Orion 90-02-00 double junction Ag/AgClreference electrode (Thermo Electron, Waltham, MA, USA) with 0.1 M CH3COOLi solution in its outerchamber was employed for all of the potentiometric measurements.
Sensors based on a platinum four-electrode configuration were employed as the conductivitysensors and ORP sensors. Their fabrication and characterization are reported elsewhere [33]. Finally,two conventional thin-film gold electrodes, also fabricated according to standard photolithographictechniques, were employed to perform chronoamperometric measurements. The amperometriccell contained the working electrode, a platinum electrode as a counter electrode (Radiometer,Lyon, France), and an Ag/AgCl/10% (w/v) KNO3 reference electrode (Metrohm 0726 100,Herisau, Switzerland).
All of these microsensors present a long-term stability above seven months with discretecalibrations in aqueous solutions [29–33]. However, their lifetimes are, in fact, limited by their use,

Sensors 2016, 16, 1796 4 of 12
so that in a continuous monitoring application, for example in Cava wine production, their responsecharacteristics (sensitivity, selectivity) would degrade within 2–3 months. This effect is noticedespecially in ISFET sensors due to the leaching of the ionophores out of the polymeric membrane [29].
2.4. Measurement Equipment
The measurements with the conductivity sensor, the ORP sensor, and the two amperometricgold electrodes were performed with a multisensor meter constructed on the IMB-CNM premises.A detailed explanation of the electronic design, software for data collection, and global performance ofthis equipment is presented in [23].
For the measurements with the six ISFETs, a new electronic device was fabricated. The electronicboard was designed with Allegro PCB Designer and Layout Plus software (Cadence Design Systems,Bracknell, UK). The fabrication of the board was molded using a PhotoMap s43 milling machine(LPKF Laser and Electronics AG, Garbsen, Germany). The size of the system is 21 cm × 10 cm × 3 cm.The PCB was formed by four different areas: the power supply unit, digital part, analog part, and sixISFET connectors. The communication between the digital and analog parts was performed using theI2C protocol. In order to obtain a real-time simultaneous measurement of the six ISFETs, each channelhad its own I2C address. The ISFET measurement was carried out by applying a 100 µA currentbetween the drain and the source, and recording the ISFET gate potential (in mV). This potential isrelated with the analyte concentration in solution.
The digital interface permitted the establishment of communication between the user and theanalog electronic part. The main IC was the ADUC848BSZ62-5 microcontroller (µC) (Analog Devices,Norwood, MA, USA). This µC was composed by a central processing unit (CPU), memory, digital andanalog ports, and units for standard communication protocols. One of the memories (E2PROM)contained the programmed code, which was sequentially executed by the µC. This code wasprogrammed in the C++ language using the development kit µVision 4.02 (Keil Electronik, Grasbrunn,Germany). The visualization of the results and the configuration of the measurement parameterswere carried out employing a virtual instrument (VI). The VI was programmed with LabView 2013(National Instruments, Austin, TX, USA). This is a modular, versatile, quick, and intuitive softwareprogram which provides a clear working environment to the user.
A scheme of the whole system formed by the two portable meters, a laptop PC with the Labviewsoftware, and the measurement cell with the different microsensors is shown in Figure 1.
Sensors 2016, 16, 1796 4 of 12
characteristics (sensitivity, selectivity) would degrade within 2–3 months. This effect is noticed especially in ISFET sensors due to the leaching of the ionophores out of the polymeric membrane [29].
2.4. Measurement Equipment
The measurements with the conductivity sensor, the ORP sensor, and the two amperometric gold electrodes were performed with a multisensor meter constructed on the IMB-CNM premises. A detailed explanation of the electronic design, software for data collection, and global performance of this equipment is presented in [23].
For the measurements with the six ISFETs, a new electronic device was fabricated. The electronic board was designed with Allegro PCB Designer and Layout Plus software (Cadence Design Systems, Bracknell, UK). The fabrication of the board was molded using a PhotoMap s43 milling machine (LPKF Laser and Electronics AG, Garbsen, Germany). The size of the system is 21 cm × 10 cm × 3 cm. The PCB was formed by four different areas: the power supply unit, digital part, analog part, and six ISFET connectors. The communication between the digital and analog parts was performed using the I2C protocol. In order to obtain a real-time simultaneous measurement of the six ISFETs, each channel had its own I2C address. The ISFET measurement was carried out by applying a 100 μA current between the drain and the source, and recording the ISFET gate potential (in mV). This potential is related with the analyte concentration in solution.
The digital interface permitted the establishment of communication between the user and the analog electronic part. The main IC was the ADUC848BSZ62-5 microcontroller (μC) (Analog Devices, Norwood, MA, USA). This μC was composed by a central processing unit (CPU), memory, digital and analog ports, and units for standard communication protocols. One of the memories (E2PROM) contained the programmed code, which was sequentially executed by the μC. This code was programmed in the C++ language using the development kit μVision 4.02 (Keil Electronik, Grasbrunn, Germany). The visualization of the results and the configuration of the measurement parameters were carried out employing a virtual instrument (VI). The VI was programmed with LabView 2013 (National Instruments, Austin, TX, USA). This is a modular, versatile, quick, and intuitive software program which provides a clear working environment to the user.
A scheme of the whole system formed by the two portable meters, a laptop PC with the Labview software, and the measurement cell with the different microsensors is shown in Figure 1.
Figure 1. Scheme of the whole measurement system. In detail: (A) conductivity or ORP sensor; (B) amperometric sensor; (C) reference electrode; (D) counter electrode; and (E) ISFET.
2.5. Characterization of Sensors and Electronics
For the evaluation of the new multi-ISFET meter, the response characteristics of ISFETs sensitive to the different ions considered were studied. The response characteristics were evaluated
Figure 1. Scheme of the whole measurement system. In detail: (A) conductivity or ORP sensor;(B) amperometric sensor; (C) reference electrode; (D) counter electrode; and (E) ISFET.

Sensors 2016, 16, 1796 5 of 12
2.5. Characterization of Sensors and Electronics
For the evaluation of the new multi-ISFET meter, the response characteristics of ISFETs sensitive tothe different ions considered were studied. The response characteristics were evaluated by calibrationin response to the principal ion. These calibration curves were obtained by means of the method of theanalyte addition: the variation of potential originated by the addition of accumulated microvolumes ofstock ion solutions (10−4, 10−2, and 1.0 M) in 25 mL of de-ionized water was measured and registeredby the new equipment. In the case of the pH ISFET, microvolumes of 1 M NaOH solution were addedto a 50 mL of universal buffer solution to change pH from 2 to 12. Then, the potential (in mV) wasplotted versus the logarithm of the activity of the principal ion (log ax or pH), where the sensitivity,limit of detection, or linear range of each potentiometric sensor were extracted. All of these experimentswere performed at room temperature by using three different ISFETs of each type, prepared under thesame experimental conditions.
Moreover, two platinum four-electrode sensors and two thin-film gold electrodes were firstlychemically cleaned, followed by an electrochemical activation carried out in 0.1 M KNO3 where theelectrode was cycled from +0.8 V to −2.2 V at least 20 times. These sensors were also characterizedbefore the analysis using the multisensor meter. The response characteristics are reported in [23],including the conductivity calibration and the ORP test obtained with the four-electrode sensors.
2.6. Electronic Tongue Measurement Procedure
The analysis was directly carried out in the Cava sample, previously degassed by magneticstirring. No measurement replications were done in order to get a rapid analysis and prevent changesof the Cava wine, as well as to minimize the formation of CO2 bubbles onto the sensor surface.
Once calibrated, the six ISFETs (one for each ion considered) were immersed in the Cava wineand the potentials (in mV vs. Ag/AgCl) were recorded every 10 s for 30 s using the multi-ISFETmeter. The output values corresponding to the relative measurements of each ISFET with respect tothe reference solution, which was checked periodically, were used as analytical signals for the models.This is a common strategy to correct the possible drift of the ISFET sensors.
Once the good behavior of the two platinum four-electrode sensors and two thin-film goldelectrodes was confirmed, they were immersed in the Cava wine sample and the signals were recordedevery 1 s for 30 s using the multisensor meter. In the case of the amperometric measurements, one goldelectrode was set to an overpotential of +1.01 V (vs. Ag/AgCl), at which the polyphenols are probablyoxidized. The other gold electrode was set to +1.31 V (vs. Ag/AgCl), related with the oxidation ofgold from the electrode [2].
The measurements with these two devices were performed sequentially, first with the multi-ISFETmeter and then with the multisensor meter. Therefore, a complete analysis of one Cava wine sampletook around 2 min under batch conditions.
2.7. Data Treatment and Analysis
Once all of the samples were passed through the sensors, a data matrix was constructed with thedifferent variables to be used as the input of the chemometric tools. In this study, the input data werecomposed by 10 variables, as shown in Table 1.
Table 1. Variables considered for constructing the models.
Equipment Sensors Variables
Multi-ISFET meter Six ISFETs pH, Na+, K+, Ca2+, Cl−,and CO3
2−
Multisensor meterTwo four-electrode sensors Conductivity and ORP
Two gold electrodes Current at +1.01 V and +1.31 V

Sensors 2016, 16, 1796 6 of 12
These data were treated using different multivariate methods. The linear discriminant analysis(LDA) was utilized to achieve a good classification model for the Cava wine samples. Discriminantanalysis is a supervised method, since it is used to build linear combinations of the original variablesfor a number of pre-specified classes (model). These combinations are later used for allocating newand unknown samples to the most probable class. Another important application of discriminantanalysis is to help in interpreting differences between groups of samples.
The partial least squares (PLS) regression was employed to perform the quantification of differentparameters of the samples. PLS is a method for multivariate calibration that finds the combinationsof the original variables (components or factors) that will best predict the values of the parametersanalyzed, by maximizing the covariance between the matrices. In this work, the PLS-1 variant (one PLSmodel per each parameter) was used in order to obtain more accurate predictions.
For the two methods, the original values were previously autoscaled—all of the variables werecentered and set to a standard deviation equal to 1, to avoid variables from having a different influenceon the model. Additionally, all of the obtained models were centered. On one hand, the Mahalanobismethod, for measuring the distance of an observation to the centers of the groups, together with theleave-one-out cross validation method were used for the LDA model. On the other hand, the classicalnon-linear iterative (NIPALS) algorithm, together with the test-set validation technique, was usedfor the PLS regressions. In this case, a fixed calibration set composed of 60 Cava wine samples waschosen. Meanwhile, the prediction set consisted of 18 samples. To control all of these parametersand to perform the analyses, the Unscrambler v.9.1 informatics package (CAMO ASA, Oslo, Norway)was used.
3. Results and Discussion
3.1. Characterization of Sensors and Electronics
ISFET sensors selective to pH, Na+, K+, Ca2+, Cl−, and CO32− were calibrated with the new
device. Three sensors of each type were connected and measured simultaneously with the multi-ISFETmeter. The response characteristics obtained are shown in Table 2. The limit of detection is calculatedby the cross-point method recommended by IUPAC for potentiometry [34]. As can be observed, all ofthe sensors presented a Nerstian response for at least a two-decade linear range with a high significantregression coefficient (R2). In fact, these analytical parameters obtained with the new device are verysimilar to those reported previously for ISFETs with the same membrane composition [24,29–31],also in terms of the limit of detection. These results demonstrate the good performance of thedeveloped equipment. Simultaneous measurements of six ISFETs can be carried out without anyelectrical interference thanks to the circuit design, which is a key issue for an electronic tongue system.Therefore, this multi-ISFET meter was used to perform the analysis of the Cava wine samples.
Table 2. Response characteristics obtained from the calibration curves for each type of ISFET using themulti-ISFET meter.
Parameter Sensitivity (mV/dec) 1 Linear Range (M) R2 Limit of Detection (M)
pH 54.2 (0.5) pH 1.56–11.42 0.9998 (n = 10) -Na+ 54.0 (0.4) 2.1 × 10⁻⁵–2.2 × 10⁻² 0.9994 (n = 6) 5.9 × 10⁻⁶
K+ 57.0 (0.8) 2.0 × 10⁻⁵–2.1 × 10⁻² 0.9996 (n = 7) 1.8 × 10⁻⁶
Ca2+ 28.6 (0.6) 5.9 × 10⁻⁷–1.9 × 10⁻² 0.9998 (n = 9) 1.9 × 10⁻⁷
Cl− −59 (1) 2.0 × 10⁻⁴–2.1 × 10⁻² 0.9998 (n = 4) 2.8 × 10⁻⁵
CO32− −58 (2) 2.1 × 10⁻⁴–2.2 × 10⁻² 0.9993 (n = 4) 3.0 × 10⁻⁵
1 Standard deviation of three different ISFET is indicated in brackets.
3.2. Classification of the Cava Wine Samples
With the data obtained from the different variables, LDA was performed. The confusion matrix ofthe obtained model is presented in Table 3, together with the percentages of sensitivity and specificity

Sensors 2016, 16, 1796 7 of 12
for the four groups. The sensitivity corresponds to the samples of each group correctly classified by theLDA model, while the specificity is calculated as the samples of different groups correctly rejected bythe model. As shown in Table 3, especially good results are obtained in the prediction of the Reservaclass samples, with just one sample confused with the Gran Reserva class. Looking more in detail atthe specificity of classification, it is observed that no Young sample is confused with Gran Reserva,and, conversely, no Gran Reserva sample is confused with Young. This is because the system is ableto discriminate very different aging times that are 9–15 months (Young) and more than 30 months(Gran Reserva). On the other hand, the Reserva class has an aging time in between (15–30 months) and,therefore, it is more likely to overlap with the borderline samples. However, the values of specificity areabove 90% in all cases and the total sensitivity of prediction is 87%. It is also important to highlight thehigh percentage of sensitivity and specificity achieved for the Rosé class samples, which demonstratesthe great discrimination capacity of the system formed by just electrochemical microsensors.
Table 3. Confusion matrix for the Cava wine samples obtained with the LDA model using thecross-validation method.
ClassesPrediction
Sensitivity (%) Specificity (%)Young Reserva Gran Reserva Rosé
Young 16 2 0 2 80 97Reserva 0 24 1 0 96 91
Gran Reserva 0 3 13 0 81 98Rosé 2 0 0 15 88 97
3.3. Quantification of Legal Parameters
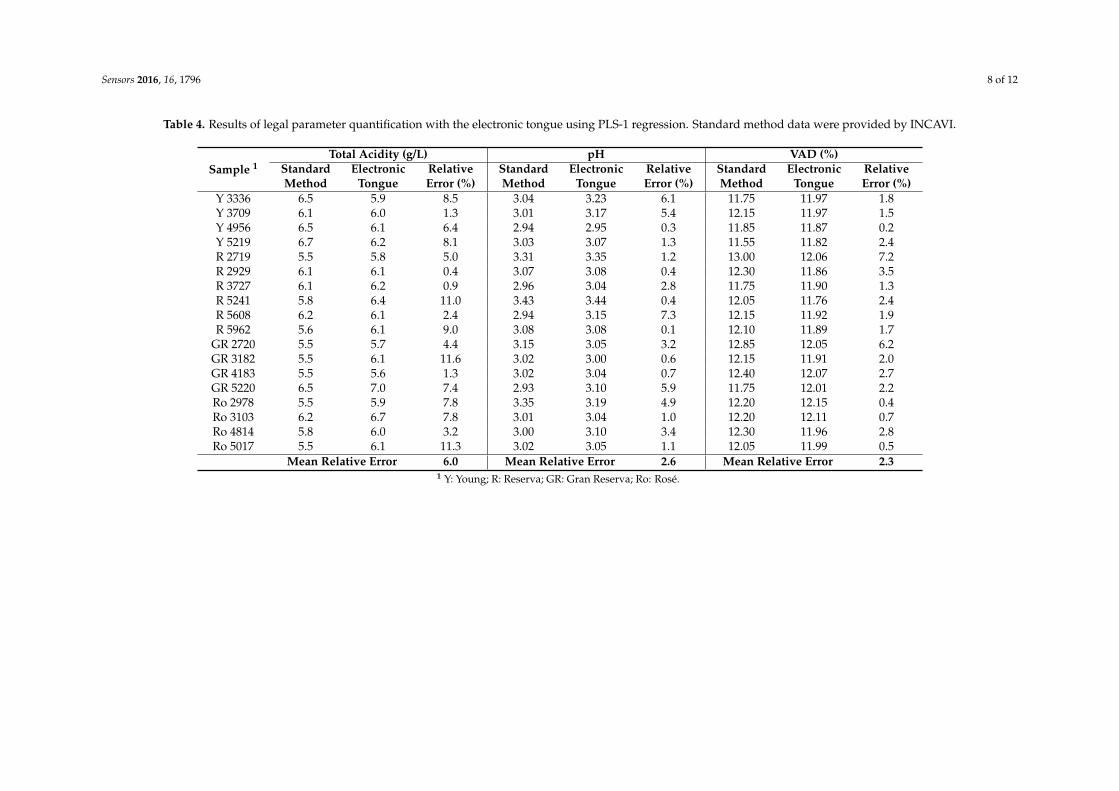
Next, a PLS regression was realized in order to assess if the system was able to quantify somechemical parameters of the samples already analyzed with standard methods. These parameters are ofinterest to meet the legal limits, such as the total acidity, pH, and VAD. These legal limits are fixedbetween 10.8% and 12.8% for VAD, between 2.8 and 3.3 for pH, and at least 5 g/L for total acidity [35].For the regression, the prediction set was formed by 18 Cava wine samples, whose data was notincluded in the calibration process: four Young (Y 3336, 3709, 4956, 5219), six Reserva (R 2719, 2929,3727, 5241, 5608, and 5962), four Gran Reserva (GR 2720, 3182, 4183, and 5220), and four Rosé (Ro 2978,3103, 4814, and 5017). The results are shown in Table 4. As can be seen, the interpolated values are ingood agreement with the data obtained using standard methods for the three parameters. In general,the relative errors are below 9%. Especially good results are obtained for pH and VAD prediction,with relative errors below 5%. The results for VAD are significant since there is no specific sensor forthis parameter. Values for total acidity are also quite accurate considering that it is a global parameterthat includes all titratable acids, mainly tartaric acid, but also lactic acid, malic acid, citric acid, etc.,and again no specific sensor is used.
3.4. Quantification of Other Parameters
PLS regressions were also used to determine other parameters of interest, such as potassium andconductivity, which are related with the tartaric stabilization, and glycerol and methanol, both relatedwith the final sensory quality of the Cava wine. The data for the prediction set obtained with oursystem and with standard methods are shown in Table 5. The values obtained with both methods arealso in good agreement, with relative errors below 15%. As can be seen, the mean errors are below6.0% for the four parameters. The best results are obtained for conductivity prediction. Again, glyceroland methanol are determined with no specific sensors, with good accuracy.
Sensors 2016, 16, 1796 8 of 12
Table 4. Results of legal parameter quantification with the electronic tongue using PLS-1 regression. Standard method data were provided by INCAVI.
Sample 1Total Acidity (g/L) pH VAD (%)
StandardMethod
ElectronicTongue
RelativeError (%)
StandardMethod
ElectronicTongue
RelativeError (%)
StandardMethod
ElectronicTongue
RelativeError (%)
Y 3336 6.5 5.9 8.5 3.04 3.23 6.1 11.75 11.97 1.8Y 3709 6.1 6.0 1.3 3.01 3.17 5.4 12.15 11.97 1.5Y 4956 6.5 6.1 6.4 2.94 2.95 0.3 11.85 11.87 0.2Y 5219 6.7 6.2 8.1 3.03 3.07 1.3 11.55 11.82 2.4R 2719 5.5 5.8 5.0 3.31 3.35 1.2 13.00 12.06 7.2R 2929 6.1 6.1 0.4 3.07 3.08 0.4 12.30 11.86 3.5R 3727 6.1 6.2 0.9 2.96 3.04 2.8 11.75 11.90 1.3R 5241 5.8 6.4 11.0 3.43 3.44 0.4 12.05 11.76 2.4R 5608 6.2 6.1 2.4 2.94 3.15 7.3 12.15 11.92 1.9R 5962 5.6 6.1 9.0 3.08 3.08 0.1 12.10 11.89 1.7
GR 2720 5.5 5.7 4.4 3.15 3.05 3.2 12.85 12.05 6.2GR 3182 5.5 6.1 11.6 3.02 3.00 0.6 12.15 11.91 2.0GR 4183 5.5 5.6 1.3 3.02 3.04 0.7 12.40 12.07 2.7GR 5220 6.5 7.0 7.4 2.93 3.10 5.9 11.75 12.01 2.2Ro 2978 5.5 5.9 7.8 3.35 3.19 4.9 12.20 12.15 0.4Ro 3103 6.2 6.7 7.8 3.01 3.04 1.0 12.20 12.11 0.7Ro 4814 5.8 6.0 3.2 3.00 3.10 3.4 12.30 11.96 2.8Ro 5017 5.5 6.1 11.3 3.02 3.05 1.1 12.05 11.99 0.5
Mean Relative Error 6.0 Mean Relative Error 2.6 Mean Relative Error 2.31 Y: Young; R: Reserva; GR: Gran Reserva; Ro: Rosé.

Sensors 2016, 16, 1796 9 of 12
Table 5. Results of quality parameter quantification with the electronic tongue using PLS-1. Standard method data were provided by INCAVI.
Sample 1Potassium (mg/L) Conductivity (mS/cm) Glycerol (g/L) Methanol (mg/L)
StandardMethod
ElectronicTongue
RelativeError (%)
StandardMethod
ElectronicTongue
RelativeError (%)
StandardMethod
ElectronicTongue
RelativeError (%)
StandardMethod
ElectronicTongue
RelativeError (%)
Y 3336 355 360 1.3 1.34 1.33 0.9 5 5.5 9.7 29 30 3.8Y 3709 433 423 2.4 1.42 1.32 6.9 4.9 5.4 10.0 29 28 2.3Y 4956 326 328 0.6 1.29 1.26 2.1 - - - 30 30 1.2Y 5219 332 332 0.0 1.38 1.32 4.3 5.3 5.2 1.7 29 30 5.0R 2719 550 487 11.4 1.79 1.66 7.5 6.1 6.2 2.2 31 34 10.6R 2929 360 395 9.7 1.29 1.28 0.9 5.1 5.7 12.2 30 32 5.7R 3727 300 332 10.7 1.21 1.21 0.3 5.6 5.4 2.8 30 30 0.0R 5241 372 315 15.4 1.19 1.13 5.3 5.1 5.6 9.5 30 30 1.3R 5608 379 418 10.3 1.31 1.31 0.1 5.8 5.8 0.7 29 31 6.1R 5962 320 334 4.4 1.2 1.19 0.5 5.5 5.7 2.9 28 30 7.5
GR 2720 544 518 4.7 1.73 1.70 1.6 6.9 6.3 8.1 31 32 3.0GR 3182 321 327 1.9 1.14 1.16 2.0 5.1 5.4 6.1 30 30 1.5GR 4183 391 408 4.2 1.42 1.41 0.6 5.5 5.4 2.5 28 31 10.8GR 5220 300 301 0.2 1.33 1.29 2.9 5.1 5.3 4.4 29 28 2.3Ro 2978 430 452 5.1 1.29 1.41 9.1 5.4 5.9 8.5 38 33 13.4Ro 3103 367 346 5.6 1.44 1.31 9.4 5.4 5.7 4.9 38 36 5.5Ro 4814 459 398 13.4 1.39 1.33 4.0 5.5 5.8 5.8 36 32 12.0Ro 5017 318 306 3.6 1.22 1.20 1.7 5.4 5.7 6.2 27 30 9.7
Mean Relative Error 5.8 Mean Relative Error 3.3 Mean Relative Error 5.8 Mean Relative Error 5.61 Y: Young; R: Reserva; GR: Gran Reserva; Ro: Rosé.

Sensors 2016, 16, 1796 10 of 12
4. Conclusions
A compact electronic tongue has been developed and applied to measure Cava wines.The electronics used (multi-ISFET meter and multisensor meter) have been fabricated accordingto microsensor requirements and taking into account the minimum energy consumption. This powerconsumption is below 10 mA if we consider the measurement with the 10 microsensors simultaneouslyevery 15 min. This means that the equipment could work continuously up to 150 h using a standard9 V battery.
This electronic tongue has been applied to the analysis of 78 Cava wine samples. The qualitativeresults confirm that the device is capable of classifying the samples according to the aging time and todistinguish the Rosé samples from the white Cava wine samples with a high sensitivity and specificity.In addition, the application of the PLS technique to the collected data permits the quantification ofsome chemical parameters of interest in the final product. Some of these parameters have legal limitsto accomplish, such as the total acidity, pH, and VAD. In general, the relative errors are below 10%.The best results are obtained for pH, VAD, and conductivity predictions with mean relative errorsbelow 4%. The good accuracy obtained for the determination of VAD, glycerol, and methanol isespecially relevant since there are no specific sensors for these parameters.
Compared with other electronic tongues for Cava wine analysis [15–17], this system is able todetermine simultaneously up to seven important chemical parameters, apart from the qualitativeanalysis, thanks to the hybrid nature of the electrochemical sensors (potentiometric, amperometric,and conductimetric). Moreover, this e-tongue uses small and low-power equipment for measurement,instead of bench-top laboratory equipment, and microsensors, which are easy to miniaturize andintegrate with the electronics.
In conclusion, the good results obtained both for classification and quantification analyses confirmthe viability of the multiparametric system. Additionally, the use of portable meters together withelectrochemical microsensors fabricated with semiconductor technology provide an advantageouscombination for rapid and feasible in-field measurements, not only for the wine industry but for foodquality control in general.
Acknowledgments: We acknowledge funding from the Spanish R & D National Program (MINECO, ProjectsTEC2011-29045-C04-01 and TEC2014-54449-C3-1-R). P.G.-G. is grateful to MINECO, Spain, for the financialsupport through a research studentship of the FPI Program. The technical assistance of Juan Manuel Ríos-Gallardois highly appreciated.
Author Contributions: P.G.-G., C.J.-J. and M.G.-C. designed the experiments and analyzed the data; F.C. andA.P.-P. selected the Cava wine samples and performed the analysis by standard methods; R.E.-P. developed theelectronic devices and the Labview interface of control; P.G.-G. performed the experiments. All authors havewritten, read and revised the manuscript.
Conflicts of Interest: The authors declare no conflict of interest.
References
1. Amodio, M.; Brattoli, M.; Dambruoso, P.; de Gennaro, L.; de Gennaro, G.; Loiotile, A.D.; Trizio, L. OdourImpact Assessment by a Multiparametric System (Electronic Noses/CH4-NMHC Analyser). In Nose2012: 3rd International Conference on Environmental Odour Monitoring and Control; DelRosso, R., Pierucci, S.,Klemes, J.J., Eds.; Aidic Servizi Srl: Milano, Italy, 2012; Volume 30, pp. 199–204.
2. Gutierrez, M.; Llobera, A.; Ipatov, A.; Vila-Planas, J.; Minguez, S.; Demming, S.; Buttgenbach, S.; Capdevila, F.;Domingo, C.; Jimenez-Jorquera, C. Application of an E-Tongue to the Analysis of Monovarietal and Blendsof White Wines. Sensors 2011, 11, 4840–4857. [CrossRef] [PubMed]
3. Totu, E.E.; Manuc, D. Multisensor for Clinical Analysis with Impact on Public Health Evaluation. Rev. Chim.2008, 59, 947–951.
4. Praveena, S.M.; Aris, A.Z. A baseline study of tropical coastal water quality in Port Dickson, Strait of Malacca,Malaysia. Mar. Pollut. Bull. 2013, 67, 196–199. [CrossRef] [PubMed]
5. Guth, U.; Vonau, W.; Zosel, J. Recent developments in electrochemical sensor application andtechnology—A review. Meas. Sci. Technol. 2009, 20, 042002. [CrossRef]

Sensors 2016, 16, 1796 11 of 12
6. Holmberg, M.; Eriksson, M.; Krantz-Rülcker, C.; Artursson, T.; Winquist, F.; Lloyd-Spetz, A.; Lundström, I.2nd Workshop of the Second Network on Artificial Olfactory Sensing (NOSE II). Sens. Actuators B Chem.2004, 101, 213–223. [CrossRef]
7. Vlasov, Y.; Legin, A.; Rudnitskaya, A.; Di Natale, C.; D’Amico, A. Nonspecific sensor arrays (“electronictongue”) for chemical analysis of liquids (IUPAC Technical Report). Pure Appl. Chem. 2005, 77, 1965–1983.[CrossRef]
8. Rothe, J.; Frey, O.; Stettler, A.; Chen, Y.H.; Hierlemann, A. Fully Integrated CMOS Microsystem forElectrochemical Measurements on 32 × 32 Working Electrodes at 90 Frames Per Second. Anal. Chem.2014, 86, 6425–6432. [CrossRef] [PubMed]
9. Codinachs, L.M.I.; Baldi, A.; Merlos, A.; Abramova, N.; Ipatov, A.; Jimenez-Jorquera, C.; Bratov, A. Integratedmultisensor for FIA-based electronic tongue applications. IEEE Sens. J. 2008, 8, 608–615. [CrossRef]
10. Baldwin, E.A.; Bai, J.H.; Plotto, A.; Dea, S. Electronic Noses and Tongues: Applications for the Food andPharmaceutical Industries. Sensors 2011, 11, 4744–4766. [CrossRef] [PubMed]
11. Rodríguez-Méndez, M.L. Electronic Noses and Tongues in Food Science; Elsevier Inc.: Oxford, UK, 2016;pp. 151–273.
12. Zeravik, J.; Hlavacek, A.; Lacina, K.; Skladal, P. State of the Art in the Field of Electronic and BioelectronicTongues-Towards the Analysis of Wines. Electroanalysis 2009, 21, 2509–2520. [CrossRef]
13. Buxaderas, S.; López-Tamames, E. Chapter 1-Sparkling Wines: Features and Trends from Tradition.In Advances in Food and Nutrition Research; Jeyakumar, H., Ed.; Academic Press: Waltham, MA, USA,2012; Volume 66, pp. 1–45.
14. Pozo-Bayón, M.Á.; Martínez-Rodríguez, A.; Pueyo, E.; Moreno-Arribas, M.V. Chemical and biochemicalfeatures involved in sparkling wine production: From a traditional to an improved winemaking technology.Trends Food Sci. Technol. 2009, 20, 289–299. [CrossRef]
15. Ceto, X.; Gutierrez, J.M.; Moreno-Baron, L.; Alegret, S.; del Valle, M. Voltammetric Electronic Tongue in theAnalysis of Cava Wines. Electroanalysis 2011, 23, 72–78. [CrossRef]
16. Ceto, X.; Capdevila, J.; Puig-Pujol, A.; del Valle, M. Cava Wine Authentication Employing a VoltammetricElectronic Tongue. Electroanalysis 2014, 26, 1504–1512. [CrossRef]
17. Ceto, X.; Capdevila, J.; Minguez, S.; del Valle, M. Voltammetric BioElectronic Tongue for the analysis ofphenolic compounds in rose cava wines. Food Res. Int. 2014, 55, 455–461. [CrossRef]
18. Ouyang, Q.; Zhao, J.W.; Chen, Q.S. Classification of rice wine according to different marked ages usinga portable multi-electrode electronic tongue coupled with multivariate analysis. Food Res. Int. 2013, 51,633–640. [CrossRef]
19. Garcia-Breijo, E.; Atkinson, J.; Gil-Sanchez, L.; Masot, R.; Ibanez, J.; Garrigues, J.; Glanc, M.;Laguarda-Miro, N.; Olguin, C. A comparison study of pattern recognition algorithms implemented ona microcontroller for use in an electronic tongue for monitoring drinking waters. Sens. Actuator A Phys. 2011,172, 570–582. [CrossRef]
20. Blanco, C.A.; de la Fuente, R.; Caballero, I.; Rodriguez-Mendez, M.L. Beer discrimination using a portableelectronic tongue based on screen-printed electrodes. J. Food Eng. 2015, 157, 57–62. [CrossRef]
21. Tahara, Y.; Nakashi, K.; Ji, K.; Ikeda, A.; Toko, K. Development of a Portable Taste Sensor witha Lipid/Polymer Membrane. Sensors 2013, 13, 1076–1084. [CrossRef] [PubMed]
22. Cruz, A.F.D.; Norena, N.; Kaushik, A.; Bhansali, S. A low-cost miniaturized potentiostat for point-of-carediagnosis. Biosens. Bioelectron. 2014, 62, 249–254. [CrossRef] [PubMed]
23. Gimenez-Gomez, P.; Escude-Pujol, R.; Jimenez-Jorquera, C.; Gutierrez-Capitan, M. Multisensor PortableMeter for Environmental Applications. IEEE Sens. J. 2015, 15, 6517–6523. [CrossRef]
24. Gutierrez, M.; Llobera, A.; Vila-Planas, J.; Capdevila, F.; Demming, S.; Buttgenbach, S.; Minguez, S.;Jimenez-Jorquera, C. Hybrid electronic tongue based on optical and electrochemical microsensors forquality control of wine. Analyst 2010, 135, 1718–1725. [CrossRef] [PubMed]
25. Ministerio de Agricultura, Pesca y Alimentación. Ministerio de Agricultura, Pesca y Alimentación. ORDENde 14 de Noviembre de 1991 por la que se Aprueba el Reglamento de la Denominación “Cava” y de suConsejo Regulador. In BOE-A-1991-28079; Secretaría General Técnica: Madrid, Spain, 1991; p. 37587.
26. Community Methods for the Analysis of Wines. Available online: http://eur-lex.europa.eu/legal-content/EN/TXT/?qid=1477386665745&uri=CELEX:31990R2676 (accesed on 25 August 2016).

Sensors 2016, 16, 1796 12 of 12
27. Compedium of International Methods of Wine and Must Analysis. Available online: http://www.oiv.int/public/medias/2624/compendium-2016-en-vol1.pdf (accesed on 25 August 2016).
28. Jiménez, C.; Bratov, A.; Abramova, N.; Baldi, A. ISFET based sensors: fundamentals and applications.In Encyclopedia of Sensors; Grimes, C.A., Dickey, E.C., Pishko, M.V., Eds.; American Scientific Publishers:New York, NY, USA, 2005; Volume X.
29. Artigas, J.; Beltran, A.; Jimenez, C.; Baldi, A.; Mas, R.; Dominguez, C.; Alonso, J. Application of ion sensitivefield effect transistor based sensors to soil analysis. Comput. Electron. Agric. 2001, 31, 281–293. [CrossRef]
30. Bratov, A.; Abramova, N.; Dominguez, C. Investigation of chloride sensitive ISFETs with different membranecompositions suitable for medical applications. Anal. Chim. Acta 2004, 514, 99–106. [CrossRef]
31. Makarychev-Mikhailov, S.; Goryacheva, O.; Mortensen, J.; Legin, A.; Levitchev, S.; Vlasov, Y. Carbonatesensors based on 4-hexyltrifluoroacetophenone modified by acceptor substituents in phenyl ring.Electroanalysis 2003, 15, 1291–1296. [CrossRef]
32. Beltran, A.; Artigas, J.; Jimenez, C.; Mas, R.; Bartroli, J.; Alonso, J. Development of durable nitrate-selectivemembranes for all-solid state ISE and ISFET sensors based on photocurable compositions. Electroanalysis2002, 14, 213–220. [CrossRef]
33. Orozco, J.; Baldi, A.; Baena, R.; Cadarso, A.; Bratov, A.; Jimenez, C. Portable system based on microsensorsfor environmental monitoring applications. Meas. Sci. Technol. 2007, 18, 935–940. [CrossRef]
34. Buck, R.P.; Lindner, E. Recommendations for nomenclature of ion-selective electrodes (IUPAC recommendations1994). Pure Appl. Chem. 1994, 66, 2527–2536. [CrossRef]
35. Regulatory Board of Cava. Pliego de Condiciones Denominación de Origen Protegida “Cava”. Availableonline: http://www.docava.es/wp-content/uploads/2015/05/PLIEGO-DOP-CAVA.pdf (accesed on25 August 2016).
© 2016 by the authors; licensee MDPI, Basel, Switzerland. This article is an open accessarticle distributed under the terms and conditions of the Creative Commons Attribution(CC-BY) license (http://creativecommons.org/licenses/by/4.0/).