port whitby sustainable l p t cic ommunity plan · port whitby sustainable l p t cic ommunity plan...
TRANSCRIPT

Port Whitby Sustainable C it PlCommunity PlanCommunity Café - May 11th 2010
Cameron Thomson

Introduction
• Study objectives
P i k h• Previous workshop
• Progress update
• Scenarios + Strategies
• Sustainability indicators
• Next steps

Study Objectives
• TBC

Defining Sustainability
• Economic viability
E i t l t d hi• Environmental stewardship
• Social responsibility
$$• Much wider than: $$S t i bilit• Green buildings
• Carbon reduction• Environmental Protection
Sustainability
• Water conservation etc

Previous workshop
• Definition of sustainability
W f i t i bilit• Ways of measuring sustainability
• Current sustainability performance in Whitby• Transport• Transport• Energy • Waste
Water• Water• Land Use
• Sustainable Strategies and TechnologiesSustainable Strategies and Technologies

Drake Landing, Alberta

BEDZED, London, UK

Village de la Gare, Quebec
• Village de la Gare is a new sustainable development in the Montreal metropolitan region, about 40km from the city centre.
• The plan is to create a mixed use, p ,transit oriented community with greater focus on walking, bicycling and transit than on automobile use.
• First master-planned, TOD project in Quebec
44% t it d h ( i t• 44% transit mode share (non-private car use)

ScenariosScenarios

Scenarios (4)
1. 2.Existing
Conditions2010
Existing Permits
2030
3 4Sustainable Scenario A
3. 4.Sustainable S i BScenario A
2030Scenario B
2030


What are we looking at for Sustainability?
Water image
Energy Water use and WasteEnvironmentally
friendly Relations with Safetystrategy and
infrastructure
Water use and wastewater
Waste reduction
friendly materials and
built formlocal
community
TransportationBiodiversityLandscaping
and open space
Social Inclusion and
Equality
Sustainability education
Economic impacts

What are we looking at?
• Land use – densities, location
• Transport – which methodslocation
• Employment – mix, location
methods
• Access – to transport, homes, amenities, parks
• Design & Planning –building heights, street
and nature
• Energy – efficiency + layout, stores generation
• Water – efficiency + t t ttreatment
• Waste – reduction + managementmanagement

Land Use Land Use

Land use density benefits
• Public Transportation feasibility
A t t t h iti k d• Access – to transport, homes, amenities, parks and nature
• Energy efficiencies• Energy efficiencies
• Water efficiencies
• Waste management ease

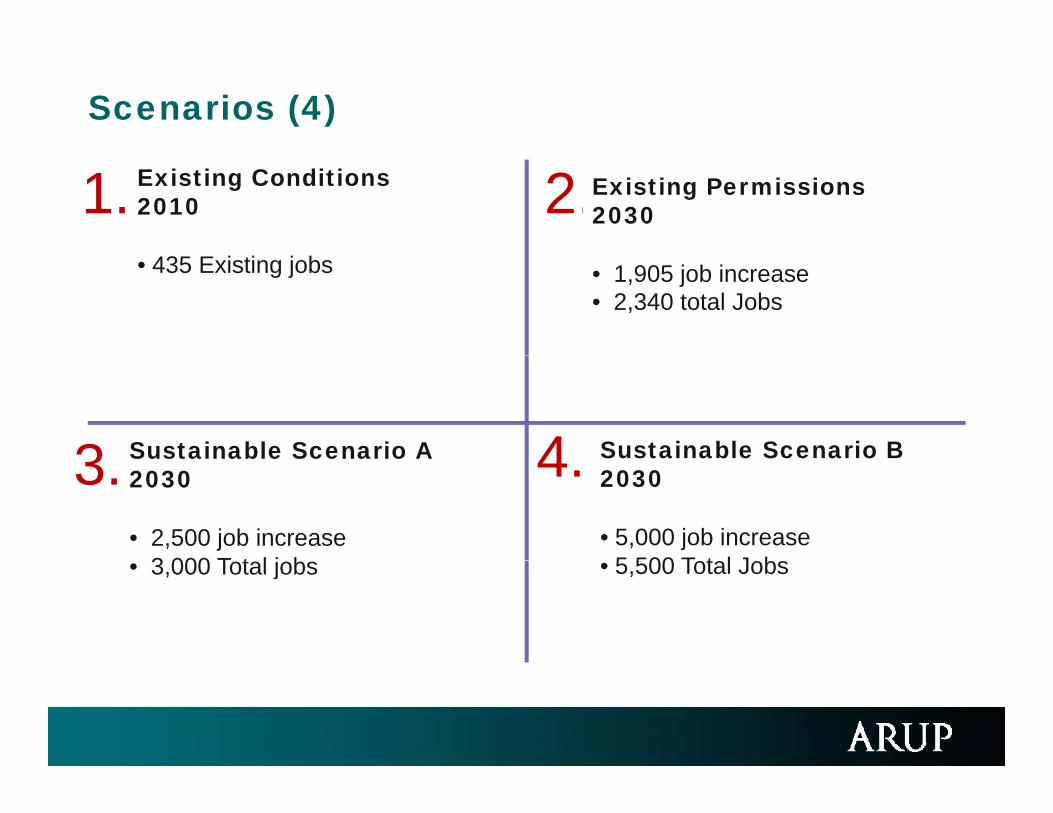
Scenarios (4)
Existing Conditions20101. 2.Existing Permissions
2030
• 435 Existing jobs • 1,905 job increase• 2,340 total Jobs
Sustainable Scenario A3 4 Sustainable Scenario BSustainable Scenario A2030
• 2,500 job increase3 000 T t l j b
3. 4. Sustainable Scenario B2030
• 5,000 job increase5 500 T t l J b• 3,000 Total jobs • 5,500 Total Jobs

EmploymentEmployment
Scenarios (4)
Existing Conditions20101. 2.Existing Permissions
2030
• 435 Existing jobs • 1,905 job increase• 2,340 total Jobs
Sustainable Scenario A3 4 Sustainable Scenario BSustainable Scenario A2030
• 2,500 job increase3 000 T t l j b
3. 4. Sustainable Scenario B2030
• 5,000 job increase5 500 T t l J b• 3,000 Total jobs • 5,500 Total Jobs

Employment + Sustainbility
Benefits
P id l t• Provides employment
• Stimulates local economy
• Infrastructure investment
• Less people movement
• Helps energy strategy

WaterWater

Water – Existing ConditionsWater Existing Conditions

Water

Water Scenario 3Water Scenario 3

Water – Potable Water and Wastewater
• Key Strategies
Conservation(Leak detection & Monitoring)
Building Efficiency Irrigation Efficiency Graywater Reclamation
• Benefits• Water consumption reduction• Resource and energy demand reductionResource and energy demand reduction
• Treatment and supply of water• Conveyance and treatment of wastewater

Water – Potable Water and Wastewater
• Potential potable water demand reduction: 40%• Corresponding wastewater flow reduction: 35%p g

Graywater Reclamation technologiesSystem Advantages Disadvantages
Most compact systemMost scalable to f t re capacit Higher le el of operator trainingMembrane Bio-
ReactorMost scalable to future capacityFully automated/Low maintenanceAccepts high pollutant load
Higher level of operator trainingHigher energy use for treatment
Activated Sludge Most common system type Higher energy use for mixing
Rotating Biological Contactor Accepts high pollutant load
Higher energy use Potential for odor/noise
Living MachineVisual amenity – can be showcasedQuiet & low cost operation
High level of maintenanceLarger footprint/system sizeInsufficient water quality
Emerging Technologies
Higher energy and resource efficiency Limited industry experience

Water – Stormwater Management
• Key Strategies
Ecoroofs Stormwater Detention
SWMPs Green Streets
• Benefits• Surface water quality and habitat protection
Effi i t d i d fl di iti ti• Efficient drainage and flooding mitigation• Increase in infiltration• Maximize aesthetic and recreational appeal by integrating green
featuresfeatures

Water – Stormwater Management
• Minimum of 15ha devoted to SWMPs• 10% of new roof area to be dedicated to Ecoroofs• Detention of water quality volume
• Comparison of SWMP effectiveness
Total Suspended Solids (TSS) Phosphorus (TP)

Water – Potable Water and Wastewater
• Key Strategies
Conservation(Leak detection, Monitoring, Pricing)
Building Efficiency Irrigation Efficiency Blackwater Reclamation
• BenefitsDual Pipe PlumbingEnergy and Resource
Recovery at offsite WPCPWastewater Treatment WetlandsRainwater Harvesting
• Water consumption reduction• Resource and energy demand reduction
• Treatment and supply of waterTreatment and supply of water• Conveyance and treatment of wastewater

Water Scenario 4Water Scenario 4

Water – Potable Water and Wastewater
• Potential potable water demand reduction: 65%• Corresponding wastewater flow reduction: 52%p g

Blackwater Reclamation technologiesSystem Advantages Disadvantages
Most compact systemMost scalable to f t re capacit Higher le el of operator trainingMembrane Bio-
ReactorMost scalable to future capacityFully automated/Low maintenanceAccepts high pollutant load
Higher level of operator trainingHigher energy use for treatment
Activated Sludge Most common system type Higher energy use for mixing
Rotating Biological Contactor Accepts high pollutant load
Higher energy use Potential for odor/noise
Living MachineVisual amenity – can be showcasedQuiet & low cost operation
High level of maintenanceLarger footprint/system sizeInsufficient water quality
Emerging Technologies
Higher energy and resource efficiency Limited industry experience

Water – Stormwater Management
• Key Strategies
Ecoroofs Stormwater Detention SWMPs Green Streets andPervious Pavements
• Benefits• Surface water quality and habitat protection
Effi i t d i d fl di iti ti• Efficient drainage and flooding mitigation• Increase in infiltration• Maximize aesthetic and recreational appeal by integrating green
featuresfeatures

Water – Stormwater Management
• Minimum of 20ha devoted to SWMPs• 25% of new roof area to be dedicated to Ecoroofs• Detention of water quality volume• Pervious pavements in parking, bike paths, pedestrian areas
C i f SWMP ff ti• Comparison of SWMP effectivenessTotal Suspended Solids (TSS) Phosphorus (TP)
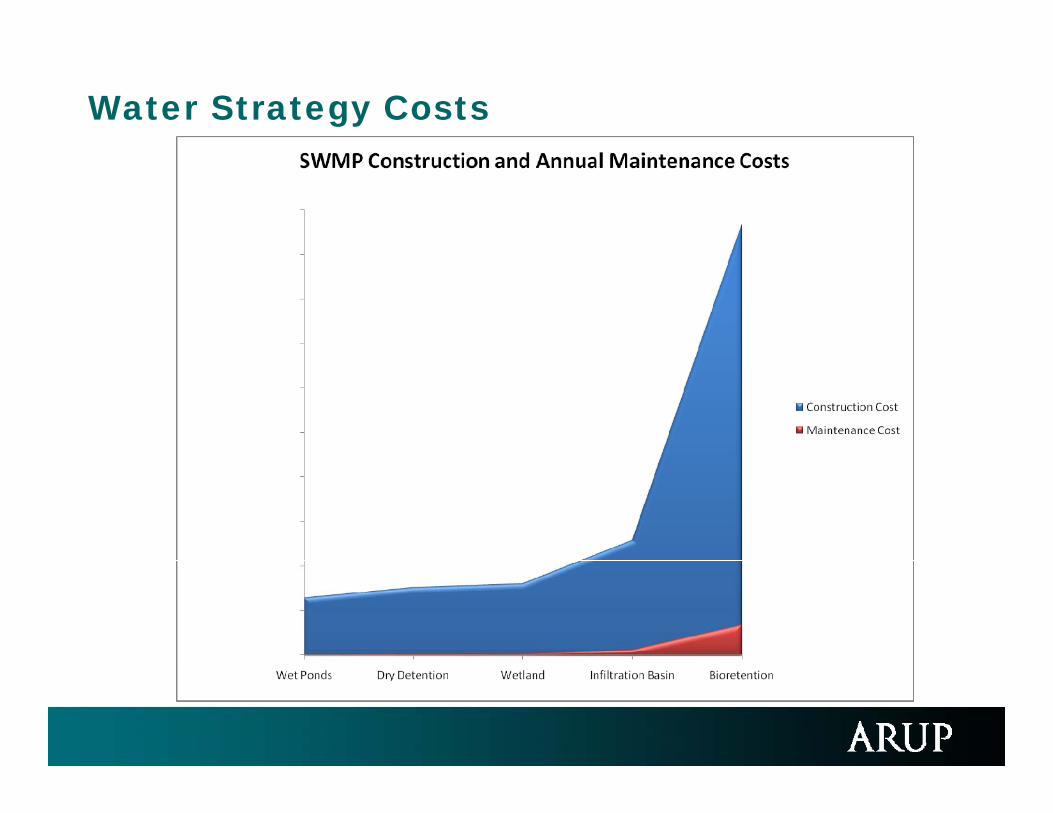
Water Strategy Costs

Water Comparison by Scenario
Strategy Existing Permissions
Scenario A Scenario B
Ecoroofs None 10% 25%
SWMP A 2h 15h 20hSWMP Areas 2ha 15ha 20ha
Water Conservation
None 5% 15%
Water Efficiency None 25% 5%
Water None Graywater BlackwaterReclamationConstructed Wetlands
None Stormwater Stormwater and Wastewater

5. Other Water Options5. Other Water Options

Community Integration of Water FeaturesScenarios A&B
• Stormwater features are integrated with buildings and public spaces to provide aesthetic benefitsand public spaces to provide aesthetic benefits along with their design function
• Fountains ponds pedestrian bridges etc• Fountains, ponds, pedestrian bridges etc.

Efficient Fire ProtectionScenarios A&B
• High efficiency sprinklering
R l i d t f i fi h d t (S i B• Reclaimed water for use in fire hydrants (Scenario B only)

Community GardensScenario B
• Provides stormwater benefits as well as a valuable resource to the community for gardening and small-resource to the community for gardening and smallscale agriculture
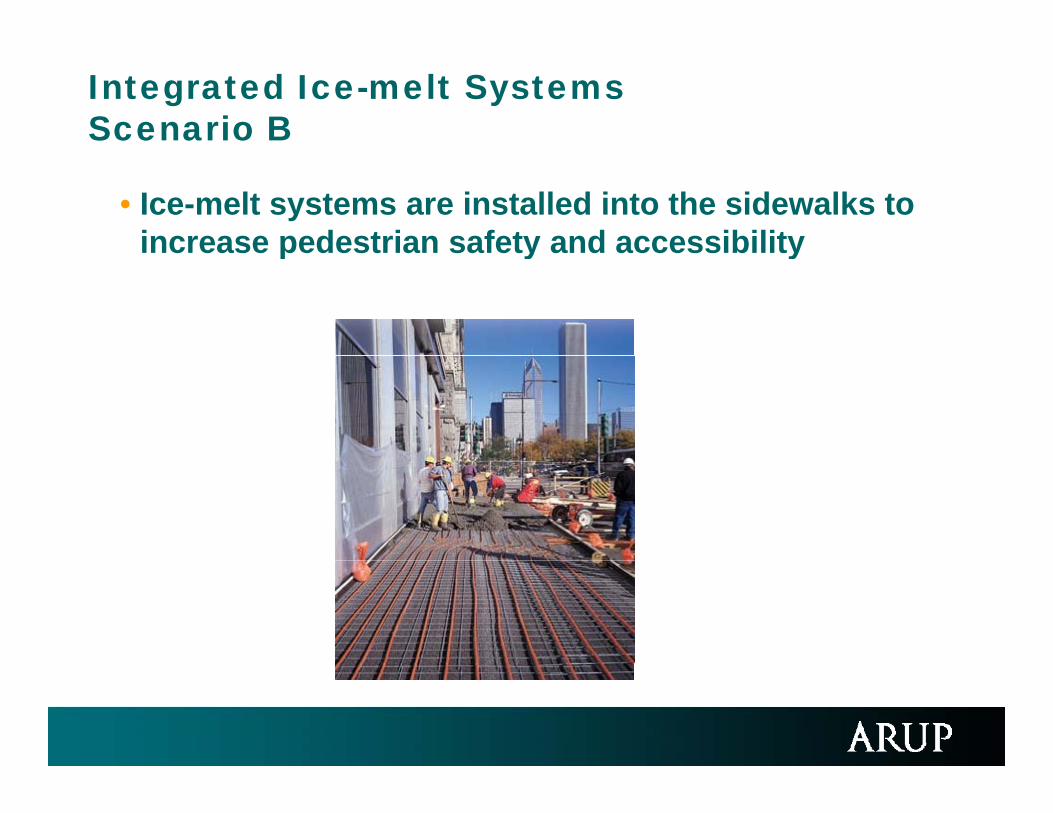
Integrated Ice-melt SystemsScenario B
• Ice-melt systems are installed into the sidewalks to increase pedestrian safety and accessibilityc ease pedest a sa ety a d access b ty

Thermal Pollution Control for Pringle CreekScenarios A&B
• NOTE: this is pending further analysis of thermal pollution potential to Pringle Creekpollution potential to Pringle Creek
• Tree plantings, surface water features, and underground detention are planned to minimize gthermal pollution to surface water bodies
• Heat island effect reductions are achieved

Living Machines in New SchoolsScenario B
• Wastewater treatment for schools, and educational benefits for studentsbenefits for students

Small-scale SWMPsScenario B
• An abundance of small stormwater management details throughout the community provide individualdetails throughout the community provide individual character and distributed stormwater management benefits

TransportationTransportation

Transportation Implications
• target of 15% reduction in AM peak hour auto driver trips
t d i d h 61% ( i ti diti 72%)• auto driver mode share: 61% (existing conditions: 72%)

Transportation Implications
• target of 15% reduction in AM peak hour auto driver trips
t d i d h 61% ( i ti diti 72%)• auto driver mode share: 61% (existing conditions: 72%)

3. Sustainable Scenario A3. Sustainable Scenario A
Key differences to Existing Conditions
• Transport – increased transit capacity, enhanced bicycle and pedestrian environment, travel demandbicycle and pedestrian environment, travel demand and parking strategies

Transportation & Access
• Key Strategies
B fitTransit Efficiency Bicycle Lanes Walking Environment
• Benefits• Pedestrian and bicycle connectivity to transit, jobs, schools and services
• Encourages active transportation for local and discretionary trips• Faster, more frequent bus service
• Bridge the gap between the GO Train and job and housing destinations, decreasing local congestion and parking footprint

Transportation & AccessK St t i• Key Strategies
Discounted transit Parking Pricing Carpooling
• Benefits• Incentivize transit use through discounts and tax breaks• On-street metered parking and garages decrease parking footprint and p g g g p g p
discourage unnecessary driving trips• Carpooling decreases VMT/capita and maximizes efficiency of auto trips

Transportation & Access
Potential Auto Driver Mode Share Reduction: 31%

4. Sustainable Scenario B4. Sustainable Scenario B
Enhanced

Key differences to Existing Conditions
• Transport – expansion of rapid transit systems, more aggressive TDM and parking strategiesmore aggressive TDM and parking strategies

Transportation & Access• Key Strategies• Key Strategies
• Rapid Transit, Vanpooling, More aggressive parking and transit pricing schemes
Bus Rapid Transit Bicycle Lanes Enhanced Walking Environment
Discounted transit Parking Pricing VanpoolingDiscounted transit Parking Pricing Vanpooling

Transportation & Access
Potential Auto Driver Mode Share Reduction: 46%

ComparisonMeasure Existing Scenario A Scenario BMeasure Existing
PermissionsScenario A Scenario B
Mode Share + ++ +++Transit Proximity + ++ ++
Residential Transit Proximity ++ + +++
Commercial Transit Proximity - +++ ++
Parking Footprint - + ++Shared Routes - ++ ++Services + Retail Proximity - ++ +++Jobs to Housing Balance ++ + +++

Transportation CostsImprovement Cost (USD)
Express Bus/BRT $13-15m/km
Bicycle Lanes $3,100-31,000/km
Sidewalks $118/m2
Roundabouts $45-150k
Curb Extensions (neckdowns, bulb-outs, etc.) and Crossing $5-30kIslandsChicanes $10-30k
Vertical Devices (raised crossings/intersections speed $15 200kVertical Devices (raised crossings/intersections, speed tables, etc.)
$15-200k
Parking Meter and Installation $300
AC Transit & Walkinginfo.org

EnergyEnergy

Energy – how it’s used

Local Power Generation
Conventional Distributed
( b th f l )(can be other fuels)

Solar Energy• Photo voltaic panels• Photo voltaic panels
• Thin film• Thick film
S l ll t• Solar collectors• Flat-plate • Evacuated Tube Collectors
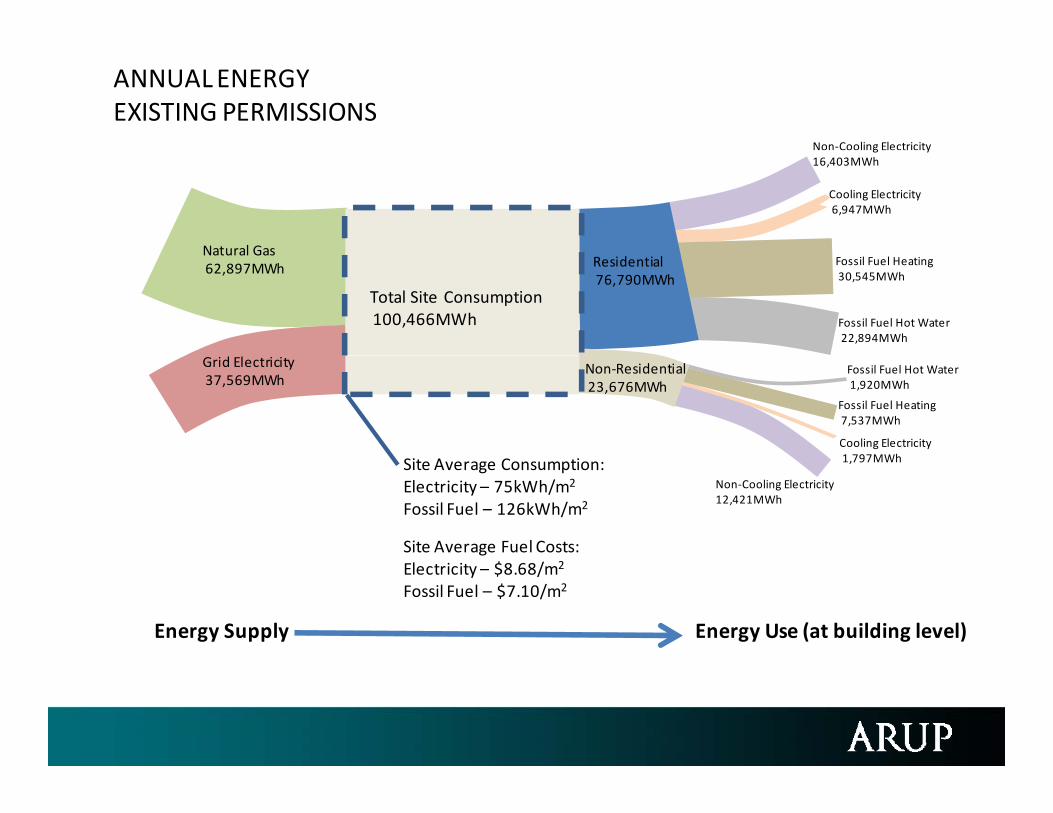
Non‐Cooling Electricity
ANNUAL ENERGYEXISTING PERMISSIONS
g y16,403MWh
Cooling Electricity6,947MWh
Natural GasFossil Fuel Heating30,545MWh
Fossil Fuel Hot Water22,894MWh
Residential76,790MWh
Total Site Consumption100,466MWh
Natural Gas62,897MWh
Cooling Electricity1 797MWh
Fossil Fuel Heating7,537MWh
Fossil Fuel Hot Water1,920MWh
Non‐Residential23,676MWh
Grid Electricity37,569MWh
1,797MWh
Non‐Cooling Electricity 12,421MWh
Site Average Consumption:Electricity – 75kWh/m2
Fossil Fuel – 126kWh/m2
Site Average Fuel Costs:Electricity – $8.68/m2
Fossil Fuel – $7.10/m2
Energy Supply Energy Use (at building level)

ANNUAL ENERGYSCENARIOA
Non‐Cooling Electricity ‐ 30,092MWh
Cooling Electricity ‐ 12,745MWh
SCENARIO ASolar Hot Water4,937MWh
Fossil Fuel Heating ‐ 37,050MWh
Fossil Fuel Hot Water ‐ 30,855MWhNon‐Residential
Residential110,742MWh
Grid Electricity
Natural Gas73,092MWh
Total Site Consumption136,114MWh
Cooling Electricity ‐ 2,256MWh
Non‐Cooling Electricity ‐ 12,993MWh
Fossil Fuel Heating ‐ 8,067MWh
Non‐Residential25,371MWh Fossil Fuel Hot Water ‐ 2,055MWh
58,085MWh
Si A C i R d ti i A f
9% Energy20% Fuel Cost>
g ySite Average Consumption:Electricity – 68kWh/m2
Fossil Fuel – 86kWh/m2
Site Average Fuel Costs:Electricity – $7 59/m2
Reduction in Average from Existing Permissions
Electricity – $7.59/mFossil Fuel – $4.94/m2
Energy Supply Energy Use (at building level)
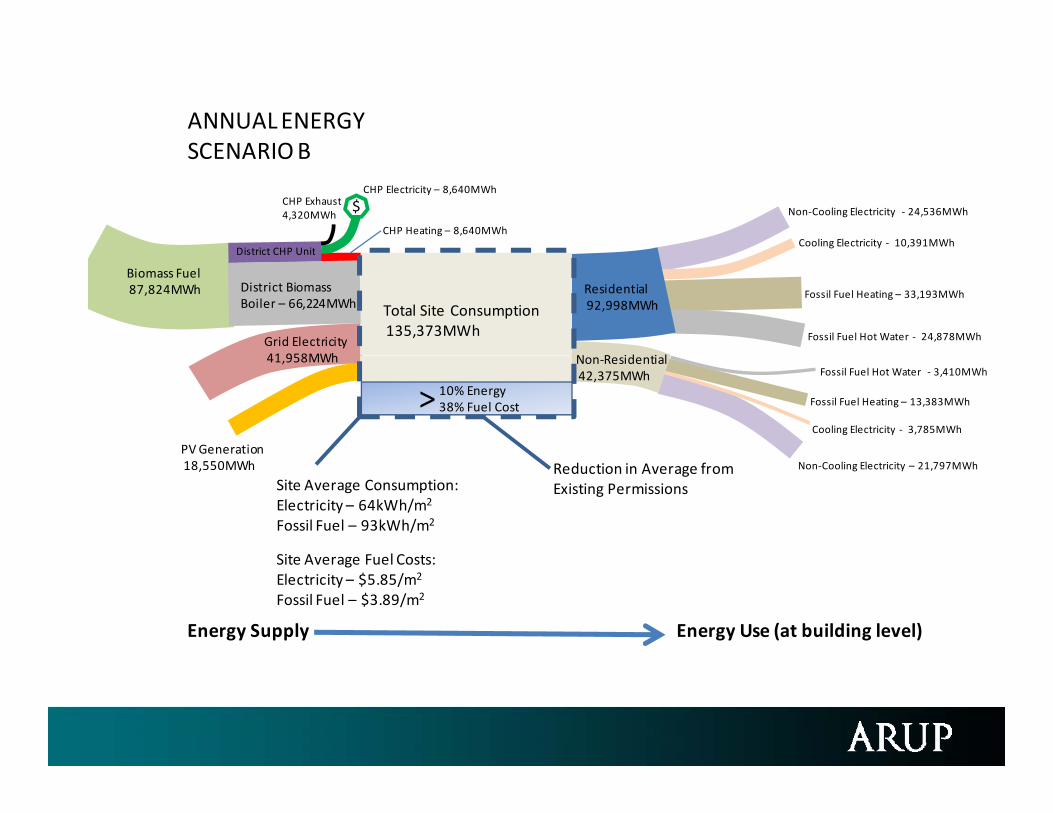
ANNUAL ENERGYSCENARIOB
Non‐Cooling Electricity ‐ 24,536MWh
Cooling Electricity ‐ 10,391MWh
SCENARIO B
CHP Heating – 8,640MWh
District CHP Unit
CHP Electricity – 8,640MWhCHP Exhaust4,320MWh
$
Fossil Fuel Heating – 33,193MWh
Fossil Fuel Hot Water ‐ 24,878MWh
N R id i l
Residential92,998MWhTotal Site Consumption
135,373MWhGrid Electricity41 958MWh
Biomass Fuel87,824MWh
District CHP Unit
District Biomass Boiler – 66,224MWh
Cooling Electricity ‐ 3,785MWh
Fossil Fuel Heating – 13,383MWh
Non‐Residential42,375MWh Fossil Fuel Hot Water ‐ 3,410MWh
41,958MWh
PV Generation
10% Energy38% Fuel Cost>
Non‐Cooling Electricity – 21,797MWh
Site Average Consumption:Electricity – 64kWh/m2
Fossil Fuel – 93kWh/m2
Site Average Fuel Costs:
18,550MWh Reduction in Average from Existing Permissions
Site Average Fuel Costs:Electricity – $5.85/m2
Fossil Fuel – $3.89/m2
Energy Supply Energy Use (at building level)

Transportation & Access
• Key Strategies
B fit• Benefits
• Quantification

WasteWaste

Existing Conditions
41%
Household/Commercial Waste composted
Landfill
41%
Waste recycled at Materials Recycling Facility
Waste323 kg/resident/year
59%

Existing permissions2010 goal2010 goal
Landfill
30%
Waste recycledat Materials
Household/Commercial Waste
447 kg/resident/year
Waste composted
70%Waste recycled at Materials Recycling Facility
70%

Scenario 13‐bin recycling + yard waste recycling in
residences + businesses
Drop‐off containers/pet composting
Landfill
Home/business starter kit2‐3%
23%89 kg/resident/year
Household/Commercial
Waste recycled at Materials Recycling Facility
Waste compostedHousehold/Commercial
Waste386 kg/resident/year
77%

AWCS for multi‐ Drop‐offScenario 2
Home/business starter kit2‐3%
residential +business (continue current
single family strategy)
Drop‐off containers/pet composting
Waste composted
Landfill
21%, 106 kg/resident/year
Household/Commercial Waste
481 kg/resident/yearWaste recycled at Materials Recycling Facility
481 kg/resident/year
79%
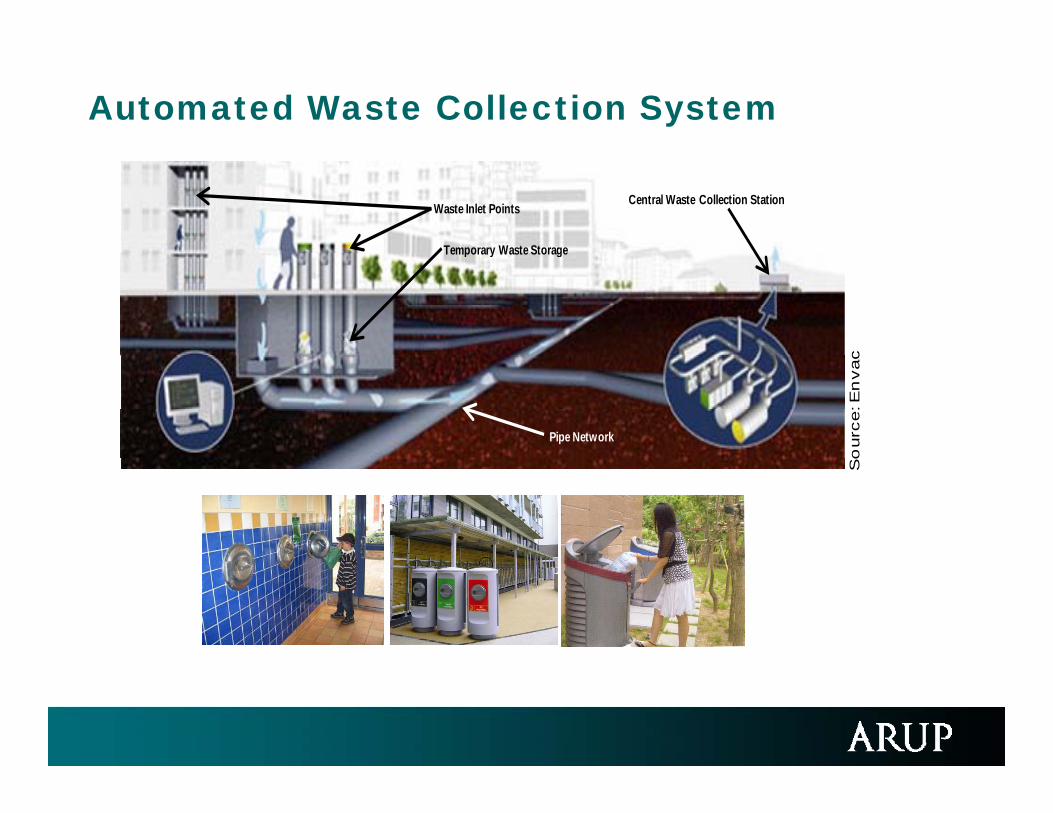
Automated Waste Collection System
Waste Inlet Points Central Waste Collection Station
Temporary Waste StorageTemporary Waste Storage
c
Pipe Network
ourc
e: E
nvac
So

Other
• Community gardens

SummarySummary

Scenarios (4)
1. 2.Existing
Conditions2010
Existing Permits
2030
3 4Sustainable Scenario A
3. 4.Sustainable S i BScenario A
2030Scenario B
2030
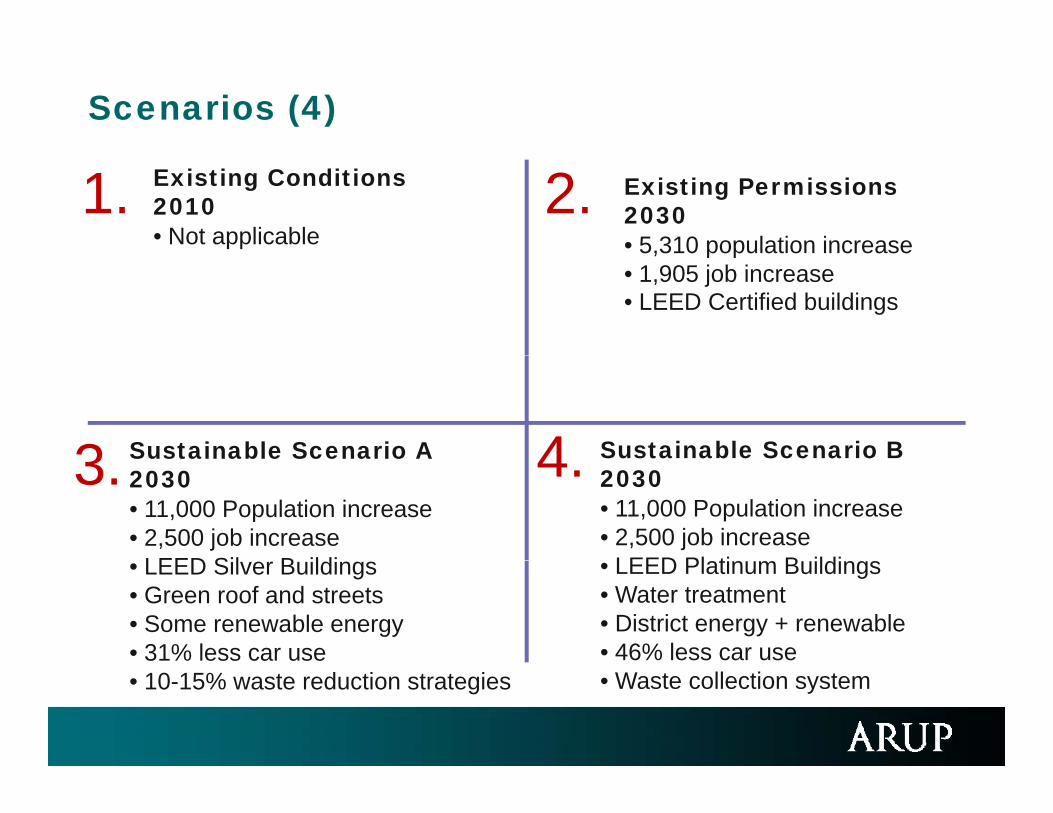
Scenarios (4)
Existing Conditions2010• Not applicable
1. 2. Existing Permissions2030• 5,310 population increase5,310 population increase• 1,905 job increase• LEED Certified buildings
Sustainable Scenario A3 4 Sustainable Scenario BSustainable Scenario A2030• 11,000 Population increase• 2,500 job increase
LEED Sil B ildi
3. 4. Sustainable Scenario B2030• 11,000 Population increase• 2,500 job increase
LEED Pl ti B ildi• LEED Silver Buildings• Green roof and streets• Some renewable energy• 31% less car use
• LEED Platinum Buildings• Water treatment• District energy + renewable• 46% less car use
• 10-15% waste reduction strategies • Waste collection system

Sustainability FrameworkSustainability Framework

What are we evaluating for Sustainability?
Water image
Energy Water use and WasteEnvironmentally
friendly Relations with Safetystrategy and
infrastructure
Water use and wastewater
Waste reduction
friendly materials and
built formlocal
community
TransportationBiodiversityLandscaping
and open space
Social Inclusion and
Equality
Sustainability education
Economic impacts

Framework
Goal Commitments / Strategies
Indicator Exisiting Permissions
(~7,000 population)
Scenario A Target (15,000
population)
Scenario B Target(10,000 population)
Enhanced Enhanced
Overall employment to population ratio% of residential development qualified as affordable housingArea of dedicated space for small/local business
Focus Area
mic
&
lit
y
es Enhance the competitiveness of the
area and foster a vibrant local economy Area of dedicated space for small/local business
% of funding from local, province or national incentives (grants, loans, tax rebates)% of local jobs captured by resident workforce within 3km% of local jobs captured by resident workforce within 500m% reduction in utility (electricity, gas, water) costs through efficiency % of new construction hires that are local to the Town of WhitbyResidential Density (units per hectare), Future Construction, on arterial road
% of "family -friendly" housing units Number of buildings (public, commercial and residential) certified under a
b ildi ti t
Eco
nom
Vital
ity
Aff
ord
abi
e pro
ject
sta
g
fety
&
Create a strong sense of community and provide a healthy and safe neighborhood with sufficient community facilities, parks, essential services and public
Residential Density (units per hectare), Future Construction, off arterial road
green building rating system% of heritage properties identified and protected% of public buildings accessible under the Ontarians with Disabilities Act (ODA) and Accessibility for Ontarians with Disabilities Act (AODA)% of waterfront with active pedestrian access% of dwelling units within 500m of at least 10 basic services*
% of dwelling units within 500m of place of employment% of dwelling units within 500m and 250m of Recreational or Open Space% of housing within walking distance (1/2 mi) from public space of 1/6 acre size or more % increase in per capita land area dedicated to community gardeningd
during f
utu
r
Public
Wel
lbei
ng,
Saf
Qual
ity
of
Life
essential services, and public spaces to engender a high quality of life for residents of all ages and abilities.
% of residents report feeling safe in annual survey to be included in annual progress report% increase in passenger trips to Whitby Station originating within the Port Whitby study area
% of vehicle trips occurring during peak and off-peak hours% population within 1/4 mile walking distance to GO Bus stops and 1/2 mile walking distance to GO Train station% reduction in afternoon peak-period automobile trips
% increase in miles of cycling and pedestrian paths% decrease in percentage of Whitby Station passengers arriving by private o
be
dev
elop
edPcc
essi
bili
ty &
ra
nsp
ort
atio
n
Significantly improve accessibility to the site for all modes of transportation, and promote transit, walking and cycling as the primary modes of transportation within the development to reduce auto-oriented travel, congestion and pollution impacts on the surrounding area and improving regional p g y p g g y p
automobile% decrease in average and maximum transit time to the GO Transit Station (and other inter- and intra-city transit)
ToAc
Tr connectivity.

Framework Cont’dGoal Commitments
/ StrategiesIndicator Exisiting
Permissions(~7,000 population)
Scenario A Target (15,000
population)
Scenario B Target(10,000 population)
Enhanced Enhanced
% reduction in regulated building energy use (versus code)% of electricity supply from on-site renewable sources% of natural gas supply from renewable resources
% decrease in per capita/per household annual potable water consumption% decrease in average annual and peak total petroleum hydrocarbons (TPH) in stormwater and river sampling
% decrease in annual number of Combined Sewer Overflow (CSO) events% increase in annual gallons of rainwater harvested and reused% decrease in annual average Total Suspended Solids (TSS) rating of stormwater% grey-water reclamation and reuse% of sewer and stormwater drains using combined infrastructure% of Site Area (including buildings and land area) Complying with Sustainable Stormwater Mgmt Guidelines% area of parking lots with pervious hardscape
Focus Area
c o T o e
Energy
source Efficiency
Reduce demand, create sustainable supply and mitigate contribution to climate change.
Provide a robust water supply to sustain the community, reduce potable water demand and treat wastewater and stormwater on-site.
Water & Wastewater
eoped during future
ges
E h h i i f h
% of wastewater treated on site% of river/lake sediment sites that meet Province standards for sediment quality% decrease in average annual kilograms of waste generated per capita% of residential, commercial, industrial and municipal waste diverted from landfill% of construction and demolition waste diverted from landfill% of organic waste converted into compost and/or biogassWaste generation rates for residential, commercial, industrial and municipal users
Res
Materials &
Solid Waste
To make a substantial contribution to the principle of eliminating the “concept of waste” through good design, emphasis on source reduction, reuse, recycling and composting, installation of appropriate facilities, close
W
To be develo
project stage
Goal Commitments / Strategies
Indicator Exisiting Permissions
(~7,000 population)
Scenario A Target (15,000
population)
Scenario B Target(10,000 population)
Enhanced Enhanced
Composite measure of six different land uses, including education, entertainment single and multi family residential retail and office uses
Focus Area
E c o n T o b e
nt Design to protect, and wherever
possible enhance parks soils
E h th titi f th
entertainment, single and multi-family residential, retail and office uses% decrease in average annual and peak total petroleum hydrocarbons (TPH) in soil samplingTotal area of brownfields that have been remediated% of buildings with greenroof, in compliance with greenroof guidelines% of Streets Shaded/Sheltered% decrease in average annual and peak heavy metals in soil sampling% of armored lake shoreline (bulkhead, sea wall, riprap, or any other built impediment to naturally advancing tidewaters)% land protected by conservation easement% of wetlands/waterbodies protected% of floodplain protected% of Provincially Significant Wetlands and Complexes protected from b
itat
&
div
ers
ity
Environm
en
Create valuable landscapes and ecosystems that are restorative, visually appealing, and enhance community character, while being functional, maintainable, biologically diverse and ecologically soundco
logy
possible, enhance parks, soils, water bodies and air quality to improve ecological and human health.
utu
re p
roje
ct
% of Provincially Significant Wetlands and Complexes protected from development% of wetlands area above DFO compensation minimumPer capita area of park and open space% reduction in energy-related carbon footprint% decrease in average annual and peak Air Quality Index rating% decrease in average annual PM2.5 level% decrease in average annual PPM carbon monoxide (CO) level% decrease in average annual PPM nitrogen oxides (NOx) level% decrease in total and per capita community-wide carbon dioxide equivalent (CO2e) emissions% residential units with "smart-metering", building management systems and f db k l f b t d d t ti&
ns
Air Q
ualit
yH
ab
Bio
d
Reduce local level of air pollutants to improve health and reduce pollution impacts on the surrounding area.
diverse and ecologically sound.Ec
elop
ed d
uring f
u
Integrate Information and C i ti T h l i t feedback panels for sub-metered energy and water consumption.
% of residential units with the option to connect to the broadband network
Number of digital information kiosks installed in public areasAdva
nce
d
Info
rmat
ion &
Com
munic
atio
nTec
hnolo
gy
To
be
dev
est
ages
Communications Technology into the development to allow residents to better manage resources, increase local economic activity, improve connectedness and facilitate community activity.