port stanley observatory monthly magnetic bulletin€¦ · one-minute values using a 61-point...
TRANSCRIPT

Port StanleyObservatoryMonthlyMagneticBulletin
BRITISH GEOLOGICAL SURVEY
West Falkland
Falkland Islands
MountAdam
700m
MountOsborne
705m
GooseGreen
Port Salavador
BerkleySound
ChoiseulSound
Bay ofHarbours
Eagle Passage
Port Stephens
King George BayQueen Charlotte Bay
Caracass
Island
Saunders Isla
nd
Keppel Island
Jason Islands
WeddellIsland Fa
lklan
d So
und
Stanley
Sapper Hill
Darwin
East Falkland
©Crown copyright; Ordnance Survey
April 2006
06/04/PS

PORT STANLEY OBSERVATORY MAGNETIC DATA
1.1 Introduction Port Stanley Observatory was installed by BGS with financial support from a consortium of oil companies and became operational in February 1994. This bulletin is published to meet the needs of users of geomagnetic data. Magnetic observatory data is presented as a series of plots of one-minute, hourly and daily values, followed by a tabulation of monthly values. The operation of the observatory and presentation of data are described in the rest of this section. Enquiries about the data should be addressed to:
National Geomagnetic Service British Geological Survey
Murchison House, West Mains Road Edinburgh EH9 3LA
Scotland, UK
Tel: +44 (0) 131 667 1000 Fax: +44 (0) 131 668 4368 E-mail: [email protected] Internet: www.geomag.bgs.ac.uk
1.2 Position Port Stanley Observatory, one of the geomagnetic observatories maintained and operated by the British Geological Survey (BGS), is situated on a site at Sapper Hill near Port Stanley in the Falkland Islands. The observatory co-ordinates are: Geographic: 51° 42.2′ S 302° 06.6′ E Geomagnetic: 41° 39.8′ S 10° 48.2′ E Height above mean sea level: 135 m The geomagnetic co-ordinates are calculated using the 10th generation International Geomagnetic Reference Field at epoch 2006.5. 1.3 The Observatory Operation 1.3.1 GDAS The observatory operates under the control of the Geomagnetic Data Acquisition System (GDAS), developed by BGS, which was installed in August 2002. The system operates under the control of data acquisition software running on QNX computers, which control the data logging and communications. There are two sets of sensors used for making magnetic measurements. A triaxial linear-core fluxgate magnetometer, manufactured by the Danish Meteorological Institute, is used to measure the variations in the horizontal (H) and vertical (Z) components of the field. The third sensor is oriented perpendicular to these, and measures variations, which
are proportional to the changes in declination (D). Measurements are made at a rate of 1 Hz. In addition to the fluxgate sensors there is a proton precession magnetometer making measurements of the absolute total field intensity (F) at a rate of 0.1Hz. The raw unfiltered data are retrieved automatically via Internet connections to the BGS office in Edinburgh in near real-time. The fluxgate data are filtered to produce one-minute values using a 61-point cosine filter whilst the total field intensity samples are filtered using a 7-point cosine filter. 1.4 Data Presentation The data presented in the bulletin are in the form of plots and tabulations described in the following sections. 1.4.1 Summary magnetograms Small-scale magnetograms are plotted which allow the month's data to be viewed at a glance. They are plotted 16 days a page and show the variations in D, H and Z. The scales are shown on the right-hand side of the page. On disturbed days the scales are multiplied by a factor, which is indicated above the panel for that day. The variations are centred on the monthly mean value, shown on the left side of the page. 1.4.2 Magnetograms The daily magnetograms are plotted using one-minute values of D, H and Z from the fluxgate sensors, with any gaps filled using back-up data. The magnetograms are plotted to a variable scale; scale bars are shown to the right of each plot. The absolute level (the monthly mean value) is indicated on the left side of the plots. 1.4.3 Hourly Mean Value Plots Hourly mean values of D, H and Z for the past 12 months are plotted in 27-day segments corresponding to the Bartels solar rotation number. Magnetic disturbances associated with active regions on the surface of the Sun may recur after 27 days: the same is true for geomagnetically quiet intervals. Plotting the data in this way highlights this recurrence, and also illustrates seasonal and diurnal variations throughout the year. 1.4.4 Daily and Monthly Mean Values Daily mean values of D, H, Z and F are plotted throughout the year. In addition, a table of monthly mean values of all the geomagnetic elements is provided. These values depend on accurate specification of the fluxgate sensor baselines. This data is provisional. It is anticipated that provisional values will not be altered by more than a few nT or tenths of arcminutes before being made definitive. © NERC 2006

Falkland Islands April 2006
150 nT
0.50o
150 nT
Z -21931
D 3.73
H 18961
1 2 3 4
Z -21931
D 3.73
H 18961
5 6 7 8
Z -21931
D 3.73
H 18961
9 10 11 12
6 12 18 24
Z -21931
D 3.73
H 18961
13
6 12 18 24
14 Scale x 2
6 12 18 24
15
6 12 18 24
16

Falkland Islands April 2006
150 nT
0.50o
150 nT
Z -21931
D 3.73
H 18961
17 18 19 20
Z -21931
D 3.73
H 18961
21 22 23 24
Z -21931
D 3.73
H 18961
25 26
6 12 18 24UT
27
6 12 18 24UT
28
6 12 18 24
Z -21931
D 3.73
H 18961
29
6 12 18 24
30

Declination in degrees east
0 3 6 9 12 15 18 21 24
Horizontal Intensity in nT
Vertical Intensity in nT
Declination in degrees east
0 3 6 9 12 15 18 21 24Hour (UT)
Horizontal Intensity in nT
Vertical Intensity in nT
3.73
18961
-21931
3.73
18961
-21931
15min
20nT
10nT
Falkland IslandsDate: 01-04-2006 Day number: 091
15min
30nT
10nT
Date: 02-04-2006 Day number: 092

Declination in degrees east
0 3 6 9 12 15 18 21 24
Horizontal Intensity in nT
Vertical Intensity in nT
Declination in degrees east
0 3 6 9 12 15 18 21 24Hour (UT)
Horizontal Intensity in nT
Vertical Intensity in nT
3.73
18961
-21931
3.73
18961
-21931
15min
30nT
20nT
Falkland IslandsDate: 03-04-2006 Day number: 093
15min
30nT
20nT
Date: 04-04-2006 Day number: 094

Declination in degrees east
0 3 6 9 12 15 18 21 24
Horizontal Intensity in nT
Vertical Intensity in nT
Declination in degrees east
0 3 6 9 12 15 18 21 24Hour (UT)
Horizontal Intensity in nT
Vertical Intensity in nT
3.73
18961
-21931
3.73
18961
-21931
15min
30nT
30nT
Falkland IslandsDate: 05-04-2006 Day number: 095
15min
20nT
20nT
Date: 06-04-2006 Day number: 096

Declination in degrees east
0 3 6 9 12 15 18 21 24
Horizontal Intensity in nT
Vertical Intensity in nT
Declination in degrees east
0 3 6 9 12 15 18 21 24Hour (UT)
Horizontal Intensity in nT
Vertical Intensity in nT
3.73
18961
-21931
3.73
18961
-21931
15min
20nT
10nT
Falkland IslandsDate: 07-04-2006 Day number: 097
15min
20nT
10nT
Date: 08-04-2006 Day number: 098

Declination in degrees east
0 3 6 9 12 15 18 21 24
Horizontal Intensity in nT
Vertical Intensity in nT
Declination in degrees east
0 3 6 9 12 15 18 21 24Hour (UT)
Horizontal Intensity in nT
Vertical Intensity in nT
3.73
18961
-21931
3.73
18961
-21931
15min
50nT
40nT
Falkland IslandsDate: 09-04-2006 Day number: 099
15min
20nT
10nT
Date: 10-04-2006 Day number: 100
Declination in degrees east
0 3 6 9 12 15 18 21 24
Horizontal Intensity in nT
Vertical Intensity in nT
Declination in degrees east
0 3 6 9 12 15 18 21 24Hour (UT)
Horizontal Intensity in nT
Vertical Intensity in nT
3.73
18961
-21931
3.73
18961
-21931
15min
20nT
10nT
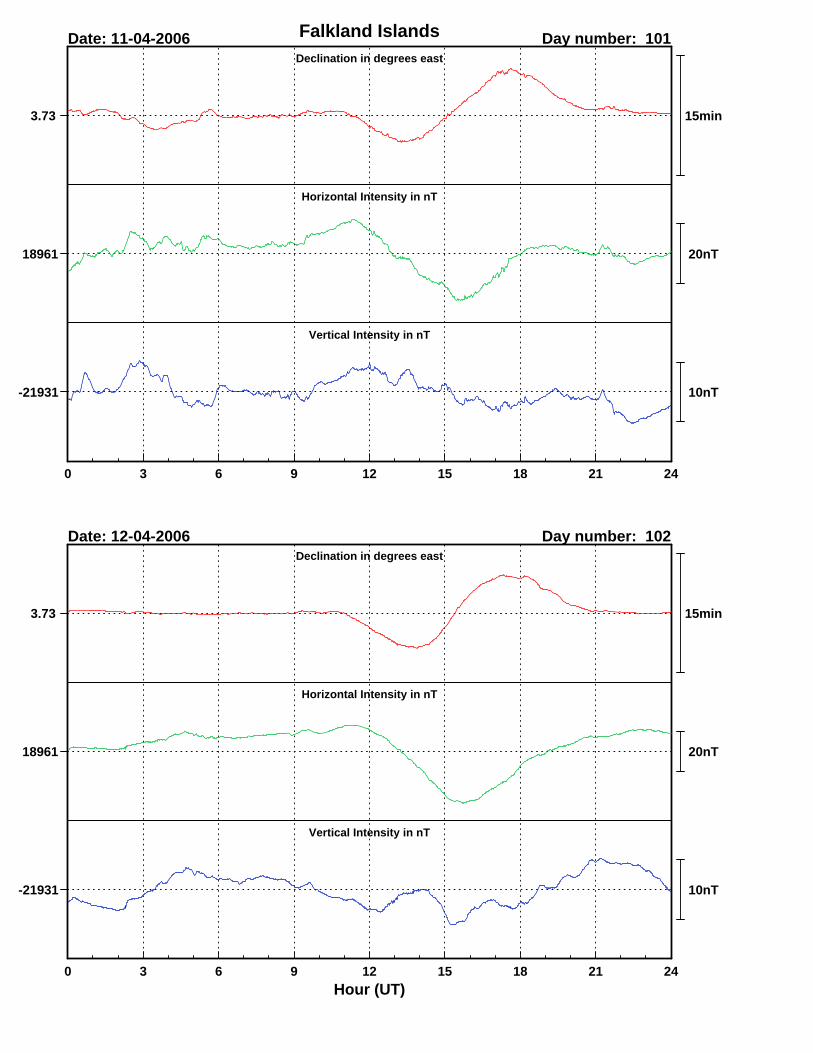
Falkland IslandsDate: 11-04-2006 Day number: 101
15min
20nT
10nT
Date: 12-04-2006 Day number: 102

Declination in degrees east
0 3 6 9 12 15 18 21 24
Horizontal Intensity in nT
Vertical Intensity in nT
Declination in degrees east
0 3 6 9 12 15 18 21 24Hour (UT)
Horizontal Intensity in nT
Vertical Intensity in nT
3.73
18961
-21931
3.73
18961
-21931
15min
30nT
20nT
Falkland IslandsDate: 13-04-2006 Day number: 103
15min
70nT
40nT
Date: 14-04-2006 Day number: 104

Declination in degrees east
0 3 6 9 12 15 18 21 24
Horizontal Intensity in nT
Vertical Intensity in nT
Declination in degrees east
0 3 6 9 12 15 18 21 24Hour (UT)
Horizontal Intensity in nT
Vertical Intensity in nT
3.73
18961
-21931
3.73
18961
-21931
15min
40nT
20nT
Falkland IslandsDate: 15-04-2006 Day number: 105
15min
30nT
10nT
Date: 16-04-2006 Day number: 106

Declination in degrees east
0 3 6 9 12 15 18 21 24
Horizontal Intensity in nT
Vertical Intensity in nT
Declination in degrees east
0 3 6 9 12 15 18 21 24Hour (UT)
Horizontal Intensity in nT
Vertical Intensity in nT
3.73
18961
-21931
3.73
18961
-21931
15min
20nT
10nT
Falkland IslandsDate: 17-04-2006 Day number: 107
15min
30nT
20nT
Date: 18-04-2006 Day number: 108

Declination in degrees east
0 3 6 9 12 15 18 21 24
Horizontal Intensity in nT
Vertical Intensity in nT
Declination in degrees east
0 3 6 9 12 15 18 21 24Hour (UT)
Horizontal Intensity in nT
Vertical Intensity in nT
3.73
18961
-21931
3.73
18961
-21931
15min
20nT
10nT
Falkland IslandsDate: 19-04-2006 Day number: 109
15min
20nT
20nT
Date: 20-04-2006 Day number: 110

Declination in degrees east
0 3 6 9 12 15 18 21 24
Horizontal Intensity in nT
Vertical Intensity in nT
Declination in degrees east
0 3 6 9 12 15 18 21 24Hour (UT)
Horizontal Intensity in nT
Vertical Intensity in nT
3.73
18961
-21931
3.73
18961
-21931
15min
20nT
10nT
Falkland IslandsDate: 21-04-2006 Day number: 111
15min
30nT
20nT
Date: 22-04-2006 Day number: 112

Declination in degrees east
0 3 6 9 12 15 18 21 24
Horizontal Intensity in nT
Vertical Intensity in nT
Declination in degrees east
0 3 6 9 12 15 18 21 24Hour (UT)
Horizontal Intensity in nT
Vertical Intensity in nT
3.73
18961
-21931
3.73
18961
-21931
15min
20nT
10nT
Falkland IslandsDate: 23-04-2006 Day number: 113
15min
20nT
10nT
Date: 24-04-2006 Day number: 114

Declination in degrees east
0 3 6 9 12 15 18 21 24
Horizontal Intensity in nT
Vertical Intensity in nT
Declination in degrees east
0 3 6 9 12 15 18 21 24Hour (UT)
Horizontal Intensity in nT
Vertical Intensity in nT
3.73
18961
-21931
3.73
18961
-21931
15min
20nT
10nT
Falkland IslandsDate: 25-04-2006 Day number: 115
15min
20nT
10nT
Date: 26-04-2006 Day number: 116

Declination in degrees east
0 3 6 9 12 15 18 21 24
Horizontal Intensity in nT
Vertical Intensity in nT
Declination in degrees east
0 3 6 9 12 15 18 21 24Hour (UT)
Horizontal Intensity in nT
Vertical Intensity in nT
3.73
18961
-21931
3.73
18961
-21931
15min
20nT
10nT
Falkland IslandsDate: 27-04-2006 Day number: 117
15min
40nT
30nT
Date: 28-04-2006 Day number: 118

Declination in degrees east
0 3 6 9 12 15 18 21 24
Horizontal Intensity in nT
Vertical Intensity in nT
Declination in degrees east
0 3 6 9 12 15 18 21 24Hour (UT)
Horizontal Intensity in nT
Vertical Intensity in nT
3.73
18961
-21931
3.73
18961
-21931
15min
20nT
10nT
Falkland IslandsDate: 29-04-2006 Day number: 119
15min
20nT
10nT
Date: 30-04-2006 Day number: 120

Rotn 4.00
3.60 2344
2345
2346
2347
2348
2349
2350
2351
2352
2353
2354
2355
2356
2357
May05
Jun
Jul
Aug
Sep
Oct
Nov
Dec
Jan06
Feb
Mar
Apr
Falkland Islands Observatory: Declination (degrees)
0 1 2 3 4 5 6 7 8 9 10 11 12 13 14 15 16 17 18 19 20 21 22 23 24 25 26 27
Hourly Mean Values Plotted By Bartels Solar Rotation Number

Rotn 19100
18900 2344
2345
2346
2347
2348
2349
2350
2351
2352
2353
2354
2355
2356
2357
May05
Jun
Jul
Aug
Sep
Oct
Nov
Dec
Jan06
Feb
Mar
Apr
Falkland Islands Observatory: Horizontal Intensity (nT)
0 1 2 3 4 5 6 7 8 9 10 11 12 13 14 15 16 17 18 19 20 21 22 23 24 25 26 27
Hourly Mean Values Plotted By Bartels Solar Rotation Number

Rotn -21900
-22000 2344
2345
2346
2347
2348
2349
2350
2351
2352
2353
2354
2355
2356
2357
May05
Jun
Jul
Aug
Sep
Oct
Nov
Dec
Jan06
Feb
Mar
Apr
Falkland Islands Observatory: Vertical Intensity (nT)
0 1 2 3 4 5 6 7 8 9 10 11 12 13 14 15 16 17 18 19 20 21 22 23 24 25 26 27
Hourly Mean Values Plotted By Bartels Solar Rotation Number

Falklands Is Observatory 2006Daily Mean Declination (deg)
Daily Mean Horizontal Intensity (nT)
Daily Mean Vertical Intensity (nT)
Daily Mean Total Intensity (nT)
Jan Feb Mar Apr May Jun Jul Aug Sep Oct Nov Dec
223.8 10min
18982 100nT
-21931 50nT
29005 75nT

Monthly Mean Values for Port Stanley Observatory 2006
Month D H I X Y Z F January 3° 44.5´ 18998 nT -49° 6.0´ 18958 nT 1240 nT -21932 nT 29017 nT February 3° 44.0´ 18989 nT -49° 6.7´ 18949 nT 1236 nT -21931 nT 29009 nT March 3° 43.2´ 18979 nT -49° 7.5´ 18939 nT 1231 nT -21930 nT 29002 nT April 3° 43.5´ 18961 nT -49° 9.2´ 18921 nT 1232 nT -21931 nT 28991 nT Note
i. The values shown here are provisional.