port service quality psq and customer ... - emerald insight
TRANSCRIPT

Port service quality (PSQ) andcustomer satisfaction: an
exploratory study of containerports in Vietnam
Tien Minh PhanDepartment of Business, VietnamMaritime University, Haiphong, Vietnam
Vinh V. ThaiSchool of Accounting, Information Systems and Supply Chain, RMIT University,
Melbourne, Australia, and
Thao Phuong VuDivision of Business Logistics, Faculty of Marketing, Thuongmai University,
Hai Phong, Vietnam
AbstractPurpose – This study aims to investigate the concept of port service quality (PSQ) and examine itsinfluence on customer satisfaction in the container port sector in Vietnam. Despite the importance of themaritime industry in which port is a critical sector in the national economy, there has been no researchso far which examines what PSQ entails and how it affects customer satisfaction in the context ofVietnam.
Design/methodology/approach – Following a literature review, a conceptual model of PSQ and itsinfluence on customer satisfaction was proposed. A survey questionnaire was then developed andpiloted with senior executives who are working in various container shipping lines and logisticscompanies in Vietnam. The questionnaire was first designed in English and then refined through theprocess of translation and back-translation to ensure language non-discrepancies. The survey wasadministered to 200 members of Vietnam Shipowners’ Association, Vietnam Logistics Associations andVietnam Shippers’ Council. By the cut-off date, 108 questionnaires were received, in which 99 validreplies were used for further analysis.
Findings – Results from this study reveal that PSQ is a construct of 4 factors and 16 items, and thatenhanced PSQ will positively influence customer satisfaction, in which the outcomes of port serviceperformance and its image would have the greatest impact. Interestingly, most items relating to socialand environmental responsibility were dropped, and this result is expected in the context of adeveloping country like Vietnam.
Originality/value – Findings from this research may enhance port managers’ understanding on areas ofPSQ to improve so as to meet and exceed their customers’ satisfaction.
Keywords Vietnam, Customer satisfaction, Container port, Port service quality
Paper type Research paper
© Pacific Star Group Education Foundation. Licensed re-use rights only.
MABR6,1
72
Received 9 January 2020Revised 30April 20203May 2020Accepted 26 June 2020
Maritime Business ReviewVol. 6 No. 1, 2021pp. 72-94EmeraldPublishingLimited2397-3757DOI 10.1108/MABR-01-2020-0003
The current issue and full text archive of this journal is available on Emerald Insight at:https://www.emerald.com/insight/2397-3757.htm
1. IntroductionIn the era of globalization, international trade transactions have been supported by globalsupply chains. In this respect, seaports play an important role as nodes for inbound andoutbound flow of products. Initially, seaports were basically considered as a platformwhere cargoes are loaded/unloaded onto or from ship, having connectivity with othertransport modes (Branch, 1986). As globalization progresses, the concept of seaport hasbeen expanded and being integrated with a function of providing value-added services(e.g. packaging and consolidating cross-docking) (World Bank, 2007), thus contributingsignificantly to the global supply chains. Seaports are now increasingly involved in theeffective management of product movements and information transfer. Therefore, anyunexpected incidents, such as accidents or delays in cargoes loading and unloading,may cause interruption in those movements, resulting in failure of performance in otherstages of the global supply chains. An inefficient outcome of seaport managementcertainly leads to the unhappiness of other stakeholders (e.g. shipping lines, shippersand logistics service providers) because of consequences they may have to bear as aresult.
In Vietnam, the role of seaports in recent years has become increasingly importantbecause of the surge in international trade volume particularly after Vietnam becamea member of World Trade Organization in 2007. In recent years, Vietnam’s seaportshave showed an impressive and consistent growth in terms of throughput and werealso highlighted as top logistics service expansion sector compared to others in theregion. Vietnam’s seaports system is developing fast with the throughput growth inthe period 2010–2015 reaching 11.8%, doubling the average level of the world. In2018, it was recorded that seaports in Vietnam handled 12,930,071 TEU (VietnamSeaports Association, 2018), which reflected a sizable trade of containerized cargo inthis country. However, Vietnam is still considered a developing country because oflow average GDP per capital and thus more attention is often paid to economic ratherthan sustainable development in general and that in the maritime industry inparticular.
Vietnam seaports system includes ports in three regions, namely, north, central andsouth, with three main ports being Hai Phong, Da Nang and Saigon, respectively.Among those, the ports of Hai Phong, Saigon and their respective satellite ports ofQuang Ninh (e.g. Cai Lan International Container Terminal) and Vung Tau (e.g. TanCang – Cai Mep Thi Vai Terminal) account for 97% of the country’s total container-handling volumes (Agency of Foreign Trade, 2018). Hai Phong Port is the nationalgateway to the northern part of Vietnam as well as southern China and currentlyconsists of 14 terminals. Some of these terminals, which are operated by corporationssuch as Germadept, Vinconship and VIMC, annually handle about 500,000 TEUsaccording to the annual reports of these corporations. In addition, the new 14-meter-deep sea port of Lach Huyen has been recently constructed in Hai Phong, which startedits operations since May 2018 and is capable of accommodating larger container vessels(i.e. 4,000–6,000 TEU), potentially accommodating up to 8,000 TEU vessels (Ship-Technology, 2019).
Meanwhile, the southern port market is currently dominated by Saigon New PortCorporation (SNP). Cat Lai Port, located in Hochiminh city and operated by SNP, accountedfor 92% of container throughput in the south in 2018. Growing at a slightly slower speedthan the other two strategic ports is the port system in Da Nang, which handles about 63%of container and 22% of bulk cargo volumes in this region (Nguyen and Ngo, 2017). Inaddition, this region is being invested with projects to develop Tien Sa terminal of Da Nang
Study ofcontainer ports
in Vietnam
73

Port as the regional node for trans-border transportation among Cambodia, Laos, Myanmarand Vietnam.
Generally, the port system in Vietnam includes three key seaport regions, which arefragmented into a number of ports and terminals managed by different port operators. Thissignificantly stimulates competition among them. Furthermore, it is projected that some keyVietnamese seaports will compete with hubs in Singapore or China in the long run (Nguyenand Ngo, 2017). In a competitive environment, service quality is recognized as a determinantof market share, return on investment and cost (Burch et al., 1995), thus playing animportant role in port success. For that reason, researching about service quality dimensionsof Vietnamese seaports and their impact on customer satisfaction is essential for theirgrowth and competitive advantage. This is especially valid given the context of adeveloping country like Vietnam with unique political and socio-economical features whichare also reflected in the distinctive features in terms of port governance, administration andmanagement (Thai, 2017). A research on port service quality (PSQ) and customersatisfaction will therefore contribute to enrich the literature of PSQ management especiallyin the context of developing countries.
Obviously, apart from considerable investment in upgrading infrastructure andfacilities, academic research on how to improve seaports’ service quality is relativelyscant, especially in the context of Vietnam. Furthermore, available studies on seaportsworldwide as well as in Vietnam heavily concentrate on their impacts on national andregional economies, efficient operations and competitiveness. In the meantime, thenumber of studies on PSQ is relatively limited, especially in a developing country likeVietnam. Hence, this research aims to investigate PSQ constructs and their influence oncustomer satisfaction in Vietnam seaports system. In this paper, we propose a model ofevaluating PSQ and its hypothesized relationships with customer satisfaction, and thenvalidating this model based on data collected from a survey of seaports’ customers inVietnam.
The remaining sections of this paper are structured as follows. Section 2 focuses onreviewing literature of service quality, PSQ and customer satisfaction, upon which theconceptual model of PSQ is based. Section 3 provides details of research methodology,including the research framework, hypothesis development, methods of data collectionand sampling. The analysis and findings are presented in Section 4, while researchimplications are discussed in Section 5. The paper concludes with the summary offindings and a brief elaboration on limitations and future research in Section 6.
2. Literature review2.1 Review on port service quality measurementSome scholars argued that quality of a service can be assessed by a set of specificationsdeveloped by the organization. In this connection, Cronin and Taylor (1992) introducedSERVPERF, arguing that customer preferences are more relevant to the long-term servicequality than impending differences in expectations and performance. Hopkins et al. (1993)evaluated cognitive service quality in the logistics sector using the SERVQUAL model, andidentified the meeting of customer expectations as the fundamental requirement forcustomer satisfaction. Another approach which is much more popularly applied is tocompare the extent of customer experience with the level of his or her expectation of servicequality as defined by Rushton et al. (2014). This idea is similar to the research ofParasuraman et al. (1985), who proposed the SERVQUAL model – one of the mostcommonly applied service quality measurement tools. SERVQUAL model covers fivedimensions of quality, namely, tangibles, reliability, responsiveness, assurance and
MABR6,1
74

empathy. These five dimensions can be differently interpreted when SERVQUAL is appliedin different industries. However, those dimensions concentrate on assessing the process ofdelivering service. There are some other models of service quality measurement, such asthose developed by Gronroos (1984) and Lehtinen and Lehtinen (1991). These two modelshave compensated SERVQUAL’s shortage by adding outcomes-related components, forinstance, technical and functional quality in the former, and process and output qualityin the latter. Albeit these models have been applied in quality assessment in variousfields, even in the port sector (Ugboma et al., 2004; Hu and Lee, 2017), and there is stillthe need for construct and variable customization for each industry (Babakus andBoller, 1992; Caro and Garcia, 2007; Ladhari, 2008; Van Dyke et al., 1997). Some scholarshave proved that SERVQUAL is not suitable to some businesses, for example,corporate banks (Guo et al., 2008) or supply chains (Seth et al., 2006). This view was alsoechoed by Chowdhary and Prakash (2007) that general dimensions cannot reflectprecisely the level of service quality, and thus industry-specific factors are needed.Also, another shortcoming of the SERVQUAL framework is that it was used to measurePSQ without taking into account the specifications of port operation and management(Lee et al., 2013). Additionally, port service attributes could not be found or thenecessity of reflecting the viewpoint of container carriers was not clearly illustrated inseveral papers using SERVQUAL model (Lee et al., 2013). Meanwhile, Brady andCronin (2001) defined the aspects of service quality as “relational quality,” “resultquality” and “physical environmental quality.” Leveraging on this, Cho et al. (2010)defined sub-factors being introduced by Brady and Cronin as the internal capacity of aport or an “endogenous quality.” Furthermore, the study is also supplemented byexploring the influence of cognitive service quality on customer satisfaction, loyaltyand referral intentions. In terms of conducting research studies on PSQ, understandingport users’ expectations and perceptions of service quality becomes crucial in light ofthe importance of ports (Ugoma et al., 2004). This emphasis is highlighted in PSQstudies in both developing and developed countries.
Studies of service quality in the maritime sector in general, and in the port industryin particular, have not been widely conducted in the literature. Most of these studiesfocus much on port efficiency, selection of port or carrier and so on. The first studies onassessing port services could be dated back to the late 20th century, conducted byFoster (1979), Slack (1985) and Murphy et al. (1987). These researchers merged the twoconcepts of PSQ and port selection by asking surveyed participants to identify keyfactors for choosing a port. This approach does not match with the idea of customers’expectation and perception comparison mentioned above. Table 1 provides a summaryof existing studies on PSQ dimensions.
According to Table 1, the criteria of PSQ measurement vary significantly from studyto study. While some of these dimensions only suit specific sectors such as passengerport (e.g. parking facilities), others can hardly reflect service quality, focusing much oninfrastructure and facilities of the port (e.g. available facilities) and pricing (e.g. portscosts). Another point which should be highlighted is that “social responsibility” has notyet been added in the above research, given that green advocacy and sustainabledevelopment have been increasingly prevalent in the port literature. Ports’ customers(shippers, carrier, logistics providers, etc.) are increasingly concerned about greeninitiatives from ports, especially in the context of International Maritime Organization(IMO) 2020 regulations.
A model which was designed specifically for measuring service quality in maritimetransport, ROPMIS, was introduced by Thai (2008) taking into account the aforesaid gaps in
Study ofcontainer ports
in Vietnam
75

the literature. This model contains resources-, outcomes-, processes-, management-, image-and social responsibility-related service quality factors. Compared to earlier studies, thismodel adds new dimensions of management, image and social responsibility tocomprehensively cover aspects of service quality in maritime transport. ROPMIS has beenadapted in various studies on service quality in container shipping (Tepe, 2015; Le, Ho andNguyen, 2018), tramp shipping (Thai et al., 2014), passenger shipping (Thamrin, 2012),freight forwarding (Gil-Saura et al., 2018) as well as container terminals and ports (Thai,2015; Yeo et al., 2016; Chang and Thai, 2016; Pham and Yeo, 2019) with high validity andreliability.
In these studies, in-depth interviews with senior executives and experts were oftenconducted to check the relevance of the variables in the specific maritime context,followed by quantitative results which confirmed the validity and reliability ofvariables and constructs. The model was also applied in a recent study by Nguyen(2015) to measure service quality and examine its effect on customer satisfaction ofports in the same system of Saigon Newport Corporation. For this reason, we also adoptthis model in the current study, and revisions were made to suit the context of seaportsin Vietnam. Compared to the earlier study on PSQ conducted in Vietnam, the currentstudy shall encompass a wider population in which ports of all groups in Vietnam willbe included in the research and not limited to those which belong to any specific portoperator.
2.2 Customer satisfaction measurementCustomer satisfaction is initially considered as customers’ assessment on a purchasingtransaction (Anderson et al., 1994), highlighted as the state of positive fulfillment whenjudging product, service or working relationship (Gaski and Nevin, 1985; Oliver, 1997;
Table 1.Summary of studieson PSQ dimensions
Studies Dimensions of PSQ
Ha (2003) Availability of port service informationGeographical positionTurn-around time of handling cargo at portAvailability of facilitiesManagementService feesConvenience for customer
Pantouvakis (2010) ServicesSecurity and safetyCleanlinessGuidance-communicationParking facilitiesInformation
Kolanovic et al. (2008) ReliabilityCompetence
Lee et al. (2013) TimelinessResponsivenessCooperationInfrastructurePrice acceptability
Cho et al. (2010) Endogenous qualityExogenous qualityRelational quality
MABR6,1
76

Farrelly and Quester, 2005). Customer satisfaction concept generally includes twocomponents, namely, pre-event expectations and post-event evaluation (Hill et al., 2003). Theresult from a difference between these two items reflects whether customers are happy withthe service or products they purchase.
There have been numerous papers and research works on the links between customersatisfaction and service quality. For example, Parasuraman et al. (1994), Brady andRobertson (2001), Santouridis and Trivellas (2010) and Liao (2012) proved that this was apositive relationship. This means that the better the quality of products or services, the moresatisfied the customers. In the context of the transportation sector, the positive link betweenservice quality and customer satisfaction was also elaborated in the work of Andersonet al. (2009) and Cao and Chen (2011) in their examination of transport by aircraft and train,respectively. There have also been several studies which examined this link in the portsector, most recently by Cho et al. (2010), Miremadi et al. (2011), Thai (2015), Yeo et al. (2016)and Chang and Thai (2016).
Although there are several studies on service quality and how it influences customersatisfaction, research focusing on service quality in the port sector, particularly its impactson customer satisfaction is still limited. This also applies in the case of Vietnam as adeveloping country and thus this current study is a timely contribution to the relevant bodyof knowledge.
3. Methodology3.1 Research contextThe aim of this research is to assess the prospective causal relationship between servicequality of seaports in Vietnam and the satisfaction of their customers encompassingshipping lines, shippers and who being on behalf of them to handle logistics activities(forwarder agents and logistics service providers). Vietnam’s seaport system includessix seaport groups. The first group contains northern seaports (locating between QuangNinh and Ninh Binh provinces); the second group consists of northern central seaports(situating between Thanh Hoa and Ha Tinh provinces); the third includes mid-centralseaports (locating between Quang Binh and Quang Ngai provinces); the fourth groupconsists of southern central seaports (situating between Binh Dinh and Binh Thuanprovinces); the fifth group includes southern seaports (Ho Chi Minh City and provincesof Dong Nai, Binh Duong and Ba Ria - Vung Tau); and the sixth group contains seaportsin the Mekong Delta. The northern seaports of Vietnam play the crucial role as gatewayconnecting the country with Northeast Asian countries and territories such as China,Japan, South Korea and Hong Kong (FPT Research, 2017). Meanwhile, the southernseaports are strategically located linking Vietnam with other Association of SoutheastAsian Nations countries and those in other continents. Currently, Vietnam has 45seaports, 265 terminals and 402 berths for accommodating vessels with a total length ofnearly 87,550 km. At present, there are 2 seaports of category IA (international gatewayports), 12 seaports of type I (general ports at regional focal economic regions), 18seaports of type II (local general ports) and 13 seaports of type III (offshore oil and gasterminals) (Agency of Foreign Trade, 2018).
3.2 Background theory, conceptual framework and measuresThis study is grounded in the well-known resource-based view theory, which postulatedthat the firm performs better than its competitors through unique and firm-specificresources that are costly for others to imitate and substitute (Barney, 1991; Madhani, 2010).The firm’s resources include both tangible and intangible resources. In the context of
Study ofcontainer ports
in Vietnam
77
seaports, tangible resources refer to physical resources which consist of channel, berth,gates, container yard, forklifts, etc. (Wanke and Barros, 2015; Bichou, 2013), while intangibleresources may exist in the form of knowledge, information and capabilities, to name just afew (Pak et al., 2015). In this connection, the quality of port service can be considered a formof intangible resources, and it is essential to examine whether such a resource wouldcontribute to enhance one of the most important aspects of port performance – customersatisfaction in this study.
Based on previous analyses, the ROPMIS model (Thai, 2008) is consistently used interms of measuring PSQ accompanied by six PSQ dimensions below:
(1) Resources-related: Readiness and availability of cargo handling facility,convenience of cargo track and trace, condition of infrastructure, etc.
(2) Outcome-related: Just-in-time provision of service, consistency of serviceperformance (time of delivery and acceptance), homogenous service supplied,safety assurance for cargoes, correctness of documents and diversification ofservice.
(3) Process-related: Employees’ attitude in serving customers, employees’ interactionwith customer needs, employees’ profession and awareness about customerenquiries and needs and technological application in providing service tocustomers.
(4) Management-related: Technological application in operations and management,performance in operations and management, understanding of customer needs andcustomer needs-oriented continuous improvement.
(5) Image/reputation-related: Reputation for good relationship with other supply chainpartners and reputation for service reliability.
(6) Social responsibility-related: Safe and environmentally responsible operations andsocial responsibility fulfillment.
In a recent study (Thai, 2015), the resources-related quality dimension was removed becauseit influences others in the large extent. The new dimension, namely, “image and socialresponsibility”was introduced as the consequence of combining two separate dimensions of“image” and “social responsibility” when revising the model of PSQ. This combination wasvalidated in the research of Thai (2015) and Yeo et al. (2015). In these studies, severalvariables which are used to analyze each PSQ dimension have been revised to reflect thedistinctive context of the port sector. For instance, the initial “physical infrastructure” underthe resources-related dimension of ROPMIS model was revised to include “physicalinfrastructures such as berths, yards, warehouses, distribution center and hinterlandconnection networks.”
It can be observed in the existing literature that the customer satisfaction construct iswell developed. Besides, this also encompasses measurements of satisfaction being reflectedby equipment and facilities, services, as well as overall satisfaction (Anderson et al., 2009;Pantouvakis, 2010). Additionally, a primary logical inference is that customers just onlymaintain continuously their selection of the given service and propagandize positively aboutit to others only when they have the satisfaction with the service provided (Cao and Chen,2011). For this reason, the current study also included these two measurement items in thecustomer satisfaction construct. Table 2 presents the conceptual framework for this researchand summary of measures. The ROPMIS model of Thai (2008) and PSQ models of Thai(2015) and Yeo et al. (2016) are the fundamental models of service quality to be applied and
MABR6,1
78

Research variables and measurement items Abbreviation References
Outcomes-related PSQ factors (OC) Adopted from Thai(2008), Thai (2016)and Yeo et al. (2016)
The port that we are using always provide fastservice
OC1
The port that we are using always provide service ina reliable manner
OC2
The port that we are using always ensure safety andsecurity to our ships/shipments
OC3
The port that we are using always produce error-freeinvoice and related documents
OC4
The port that we are using always offers competitiveprice of service
OC5
The port that we are using can always meet ourservice requirements anytime and anywhere wewant
OC6
Process-related PSQ factors (PR)The staff in the port that we are using alwaysdemonstrate professional attitude and behavior inmeeting our requirements
PR1
The staff in the port that we are using alwaysrespond quickly to our enquiries and requests
PR2
The staff in the port that we are using alwaysdemonstrate good knowledge of our needs andrequirements
PR3
The level of information and communicationstechnology (ICT) applications in customer service atthe port that we are using is comprehensive
PR4
Management-related PSQ factorsThe level of ICT applications in port operations andmanagement at the port that we are using iscomprehensive
MA1
The port that we are using demonstrates high levelof efficiency in operations and management
MA2
The management in the port that we are usingalways demonstrate good knowledge andcompetence, including incident-handling capability
MA3
The management in the port that we are usingalways demonstrate good understanding of ourneeds and requirements
MA4
The port that we are using always collect ourfeedback about their services and reflect on theirimprovement
MA5
The port that we are using continuously improvetheir customer-oriented operation and managementprocesses
MA6
Image and social responsibility-related PSQ factorsThe port that we are using demonstrates goodrelationship with other ports and land transportservice providers
CSR1
The port that we are using possesses positivereputation for reliability in the market
CSR2
(continued )
Table 2.Constructs and
measurement items
Study ofcontainer ports
in Vietnam
79

adopted in this study, in which the measurement items of quality dimensions in thesemodels are also used but amended to be in relevant to the Vietnamese port context in ourmodel of PSQ.
3.3 Research hypothesesThe purpose of this research focuses on examining how the satisfaction of port customers isinfluenced by PSQ with a four-dimensional construct. As a result, four hypotheses weredeveloped as follows:
H1. Outcomes-related PSQ positively influences customer satisfaction in Vietnameseseaports.
H2. Process-related PSQ positively influences customer satisfaction in Vietnameseseaports.
H3. Management-related PSQ positively influences customer satisfaction in Vietnameseseaports.
H4. Image and social responsibility-related PSQ positively influences customersatisfaction in Vietnamese seaports.
Research variables and measurement items Abbreviation References
The port that we are using always emphasizes onoperations and work safety
CSR3
The port that we are using demonstrates good recordof operations and work safety
CSR4
The port that we are using fulfill good socialresponsibility to their employees and otherstakeholders
CSR5
The port that we are using always emphasizes onenvironmentally responsible operations
CSR6
The port that we are using has in place theenvironmental management system
CSR7
Satisfaction with PSQ Anderson et al. (2009),Pantouvakis (2010)and Cao and Chen(2011)
Overall, we are satisfied with the facilities,equipment and other infrastructures of the port thatwe are using
CS1
Overall, we are satisfied with the management andemployees of the port that we are using
CS2
Overall, we are satisfied with the service quality ofthe port that we are using
CS3
We will refer services of the port that we are using toour business partners
CS4
We will continue using services of the port that weare using
CS5
Notes: MA = management; PR = process; OC = outcome; CSR = corporate social responsibility; CS =customer satisfactionTable 2.
MABR6,1
80

3.4 Sampling and data collectionThe data that were used to examine how PSQ affects port customers’ satisfactionwere obtained from a national survey with port customers including shipping linesand shippers and/or their representatives such as freight forwarders and logisticsservice providers. The population that was selected to conduct the survey includesthree customer groups in three regions of north, central and south of Vietnam. Thefirst group is of domestic shipping lines which are members of Vietnam Shipowners’Association (VSA). In total, 30 questionnaires were delivered in person torepresentatives of VSA’s members who are holding senior positions in businessdepartment, operations and customer service in their respective organizations.Meanwhile, the second group of prospective respondents includes 120 members ofVietnam Logistics Association to which the questionnaires were distributed viaemail. The same method of survey administration (email delivery) was also applied todistribute the questionnaire to 50 members of the third group, Vietnam Shippers’Council.
The non-probability random sampling is the method selected for the nationalsurvey. The questionnaires were delivered to prospective organizations from October2018 to February 2019. Prior to this, the questionnaire, which was initially designed inEnglish, was translated into Vietnamese, then back-translated into English. Theback-translated English version was compared with the original one to ensurethematic consistency. Next, the Vietnamese version of the questionnaire was pilotedwith several senior executives that are holding senior managerial positions in variouscontainer shipping lines and logistics firms in Vietnam. Only when this was done, theVietnamese version of the questionnaire was administered for the survey. The maincontents of the questionnaire consist of two main parts. The first part comprises 28statements corresponding to 4 variables of PSQ and customer satisfaction. Thesecond part collects demographic information (type of business, name of port andregion, experience and current designation of respondents) for classification purpose.Likert scale ranging from 1 to 5 is used, with “1” indicating “Strongly disagree” and“5” denoting “Strongly agree.” By the cut-off date, the authors collected a total of 108questionnaires from respondents, in which 99 valid replies were used for furtheranalysis, yielding a response rate of 49.5%. About 30% of respondents are currentlyworking in shipping companies, while 56% and 14% are freight forwarders/logisticsservice providers and shippers, respectively. Additionally, 47% of respondents haveless than 5 years of working experience, 35% of respondents have 5 to 10 years ofexperience, while 18% of the remaining respondents have had more than 10 years ofexperience. It can be seen from these descriptive statistics that the respondentsparticipating in this research are well eligible given their work experience in themaritime industry.
4. Analysis of results4.1 Factor analysis of the port service quality modelExploratory factor analysis (EFA) and Cronbach’s alpha are the traditional toolsbeing used to test how well the measured variables represent the number ofconstructs by measuring the validity and reliability. Several rounds of EFA were runusing SPSS Version 20 software to derive the most accurate results and removeinconsistent variables with factor loading lower than 0.5. Table 3 reveals that thestrength of inter-correlations, which is assessed by Bartlett’s test of sphericity and theKaiser–Meyer–Olkin (KMO) measure of sampling adequacy was good. The KMO
Study ofcontainer ports
in Vietnam
81
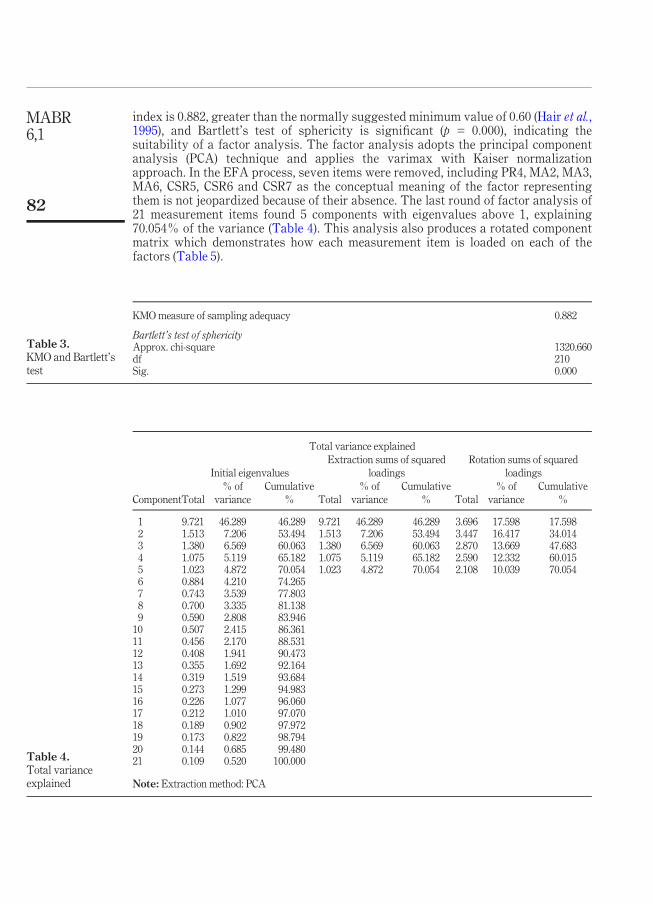
index is 0.882, greater than the normally suggested minimum value of 0.60 (Hair et al.,1995), and Bartlett’s test of sphericity is significant (p = 0.000), indicating thesuitability of a factor analysis. The factor analysis adopts the principal componentanalysis (PCA) technique and applies the varimax with Kaiser normalizationapproach. In the EFA process, seven items were removed, including PR4, MA2, MA3,MA6, CSR5, CSR6 and CSR7 as the conceptual meaning of the factor representingthem is not jeopardized because of their absence. The last round of factor analysis of21 measurement items found 5 components with eigenvalues above 1, explaining70.054% of the variance (Table 4). This analysis also produces a rotated componentmatrix which demonstrates how each measurement item is loaded on each of thefactors (Table 5).
Table 4.Total varianceexplained
Total variance explained
Component
Initial eigenvaluesExtraction sums of squared
loadingsRotation sums of squared
loadings
Total% of
varianceCumulative
% Total% of
varianceCumulative
% Total% of
varianceCumulative
%
1 9.721 46.289 46.289 9.721 46.289 46.289 3.696 17.598 17.5982 1.513 7.206 53.494 1.513 7.206 53.494 3.447 16.417 34.0143 1.380 6.569 60.063 1.380 6.569 60.063 2.870 13.669 47.6834 1.075 5.119 65.182 1.075 5.119 65.182 2.590 12.332 60.0155 1.023 4.872 70.054 1.023 4.872 70.054 2.108 10.039 70.0546 0.884 4.210 74.2657 0.743 3.539 77.8038 0.700 3.335 81.1389 0.590 2.808 83.946
10 0.507 2.415 86.36111 0.456 2.170 88.53112 0.408 1.941 90.47313 0.355 1.692 92.16414 0.319 1.519 93.68415 0.273 1.299 94.98316 0.226 1.077 96.06017 0.212 1.010 97.07018 0.189 0.902 97.97219 0.173 0.822 98.79420 0.144 0.685 99.48021 0.109 0.520 100.000
Note: Extraction method: PCA
Table 3.KMO and Bartlett’stest
KMO measure of sampling adequacy 0.882
Bartlett’s test of sphericityApprox. chi-square 1320.660df 210Sig. 0.000
MABR6,1
82

Moreover, we can also evaluate the validity and reliability by confirmatory factoranalysis (CFA). Based on the results of EFA, the validity and reliability of theextracted 4-factor PSQ model of 21 items and customer satisfaction of 5 items wereconducted using CFA in the current study (Churchill, 1991). The results of thismeasurement model are presented in Figure 1 and Table 6. Looking at the results ofCFA summarized in Table 6, it can be seen that the standardized loadings for all itemsare above 0.6, reflecting a good correlation between these observed items and thelatent variables. These obtained results are suitable as these values are higher thanrecommended minimum value of 0.50 (Bagozzi et al., 1991). Meanwhile, Litwin (1995)stated that the success of a social scientific research significantly depends on manyfactors besides accurate set of research tools and consistent sampling methods. Forthis reason, the comparative fit index (CFI), goodness-of-fit (GFI) index, compositereliability (CR), average variance extracted (AVE), maximum shared squaredvariance (MSV) and average shared squared variance (ASV) are examined to verifythe convergent and discriminant validity, as well as CR of the measurement model(Hair et al., 2010). According to Bollen (1989, p. 27), fit indices of CFI as low as 0.85 are“reasonable” for the model. Hair et al. (2010) also suggested the threshold for key fitindices e.g. GFI index should be more than 0.80 (good level), CR should be greater than0.7, while there is no convergent validity issue when CR is bigger than AVE and AVEis greater than 0.5. Meanwhile, the discriminant validity is confirmed when both MSVand ASV are smaller than AVE. The results in Tables 6 and 7 show that no CR valueis smaller than 0.7, all AVE values are bigger than 0.5 (convergent validity) and AVE
Table 5.Rotated component
matrixa
Component1 2 3 4 5
CS3 0.730CS2 0.720CS5 0.714CS4 0.712CS1 0.690OC2 0.682OC6 0.671OC5 0.663OC4 0.659OC3 0.610OC1 0.602CSR2 0.789CSR3 0.777CSR1 0.659CSR4 0.615PR3 0.791PR1 0.782PR2 0.707MA5 0.757MA4 0.724MA1 0.671
Notes: Extraction method: PCA. Rotation Method: Varimax with Kaiser normalization. aRotationconverged in seven iterations
Study ofcontainer ports
in Vietnam
83
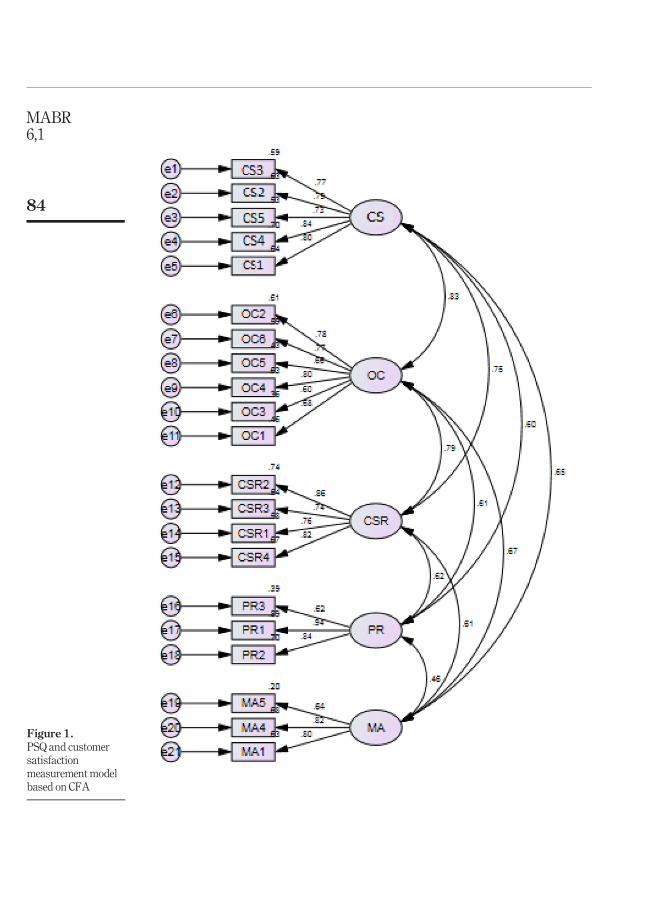
Figure 1.PSQ and customersatisfactionmeasurement modelbased on CFA
MABR6,1
84
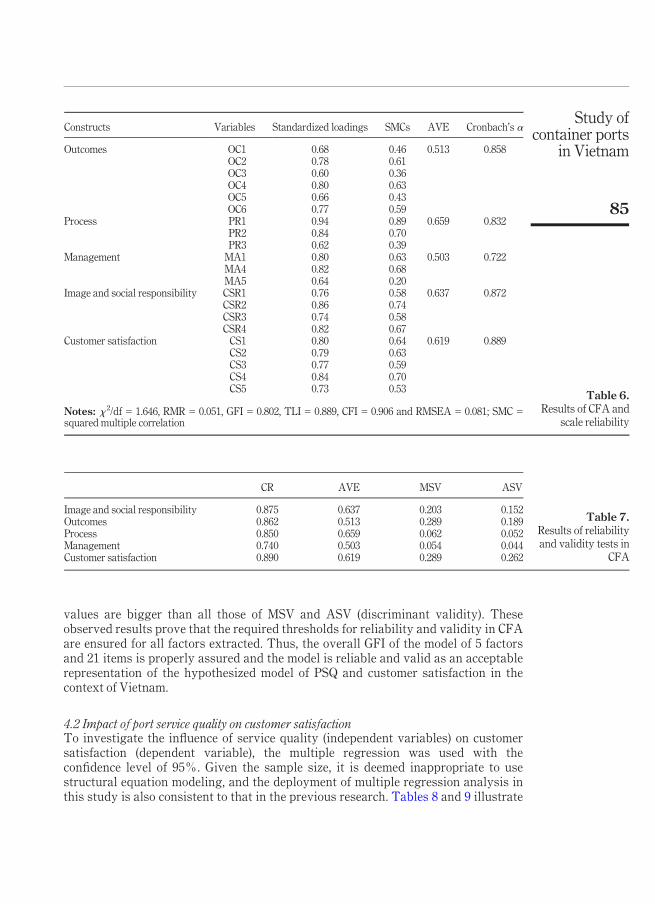
values are bigger than all those of MSV and ASV (discriminant validity). Theseobserved results prove that the required thresholds for reliability and validity in CFAare ensured for all factors extracted. Thus, the overall GFI of the model of 5 factorsand 21 items is properly assured and the model is reliable and valid as an acceptablerepresentation of the hypothesized model of PSQ and customer satisfaction in thecontext of Vietnam.
4.2 Impact of port service quality on customer satisfactionTo investigate the influence of service quality (independent variables) on customersatisfaction (dependent variable), the multiple regression was used with theconfidence level of 95%. Given the sample size, it is deemed inappropriate to usestructural equation modeling, and the deployment of multiple regression analysis inthis study is also consistent to that in the previous research. Tables 8 and 9 illustrate
Table 6.Results of CFA and
scale reliability
Constructs Variables Standardized loadings SMCs AVE Cronbach’s a
Outcomes OC1 0.68 0.46 0.513 0.858OC2 0.78 0.61OC3 0.60 0.36OC4 0.80 0.63OC5 0.66 0.43OC6 0.77 0.59
Process PR1 0.94 0.89 0.659 0.832PR2 0.84 0.70PR3 0.62 0.39
Management MA1 0.80 0.63 0.503 0.722MA4 0.82 0.68MA5 0.64 0.20
Image and social responsibility CSR1 0.76 0.58 0.637 0.872CSR2 0.86 0.74CSR3 0.74 0.58CSR4 0.82 0.67
Customer satisfaction CS1 0.80 0.64 0.619 0.889CS2 0.79 0.63CS3 0.77 0.59CS4 0.84 0.70CS5 0.73 0.53
Notes: x 2/df = 1.646, RMR = 0.051, GFI = 0.802, TLI = 0.889, CFI = 0.906 and RMSEA = 0.081; SMC =squared multiple correlation
Table 7.Results of reliabilityand validity tests in
CFA
CR AVE MSV ASV
Image and social responsibility 0.875 0.637 0.203 0.152Outcomes 0.862 0.513 0.289 0.189Process 0.850 0.659 0.062 0.052Management 0.740 0.503 0.054 0.044Customer satisfaction 0.890 0.619 0.289 0.262
Study ofcontainer ports
in Vietnam
85

the analysis results. All four factors of PSQ could be included in the regressionequation as they match the entry requirements. Considering the result gained frommultiple regression analysis, it can be seen that a suitable correlation between thedependent variable (customer satisfaction) and four predictors with the value of themultiple R (R = 0.780) is achieved, and this is statistically significant (p = 0.000). Inaddition, the adjusted R2 value is 0.591, indicating that about 59.1% of variance of thedependent variable (customer satisfaction) in this regression analysis can beexplained by those of the independent variables (four predictor variables). TheDurbin–Watson index is 1.546 being in the range from 1.5 to 2.5, meaning noautocorrelation problem exists.
As the value of significance tests of the regression demonstrating the coefficientsof independent variables are all less than 0.05, these independent variables havemeaningful explanations for the dependent variable, and no variables are excludedfrom the model. Additionally, there is a positive influence on customer satisfactionobserved from all four predictors. Specifically, the greatest positive influence oncustomer satisfaction (b = 0.538) belongs to the outcomes-related PSQ factor, whileimage and social responsibility-related PSQ (b = 0.450) and process-related factor (b= 0.248) stand at the second and third position, respectively. Standing in the lastposition is management-related (b = 0.233) factor. Given the beta values andsignificance (p-values) of the multiple regression test, it can be concluded that all fourhypotheses in this research are supported, confirming that the PSQ of outcomes-based, image and social responsibility-based, process-based and management-basedfactors all have positive influence on customer satisfaction in Vietnamese seaports.
Generating the same result as the research of Thai (2015), outcomes-related PSQfactor has the most positive influence on customer satisfaction. However, it isinterestingly found that the second most important factor affecting customersatisfaction is image and social responsibility. It is undeniable that ports play acrucial role as an integrated node in global supply chains, and thus they shouldconcentrate on all factors of PSQ as an all-rounded approach to managing servicequality. In accordance with the general theory of service quality, the experience of
Table 8.Model summary –coefficient ofdetermination
R R2 Adjusted R2 Std. error of the estimate Durbin–Watson
0.780a 0.608 0.591 0.63921171 1.546
Notes: aPredictors: (Constant), MA, PR, CSR and OC. bDependent variable: CS
Table 9.Model summary –regressioncoefficients
Model Standardized coefficients beta t Sig.
(Constant) 1.935E-17 0.064 0.000 1.000OC 0.538 0.065 0.538 8.334 0.000CSR 0.450 0.065 0.450 6.969 0.000PR 0.248 0.065 0.248 3.845 0.000MA 0.233 0.065 0.233 3.611 0.000
Note: aDependent Variable: CS
MABR6,1
86
user with the service is fundamentally shaped by encountering the outcome generatedfrom the service. Thus, perceived service quality can be derived through comparingwith the customer’s service expectation. Besides, it is also worth noticing that theimage and social responsibility-related factor of PSQ deserves its second importantposition, thanks to its huge contribution to port sustainability nowadays; although, inthis research, only those items measuring the port’s image were retained. It isevidenced that the reputation elements in the image and social responsibility-relatedfactor of PSQ are the desirable elements of all business organizations in general andseaports in particular. Reputation is absolutely one of the most efficient tools forboosting ports’ brand equity but owning a positive reputation is not easily attainedwithout implying the emphasis on the port’s corporate social performance as animportant service quality enabler. This finding is crucial as it proves a pre-conceptionthat, apart from reputation for reliability, safe and environmentally responsibleoperations are also essential to the quality service in the maritime industry, includingthat of ports. This industry frequently encounters a number of maritime accidentsand incidents recorded daily which often cause the disasters affecting adversely themaritime ecosystem and surrounding areas. In terms of ports, customers’ perceptionof quality can be easily affected by the performance being relevant to reliability andsafe and environmentally responsible operations. Indeed, ports around the world havebeen also aware of this issue, for instance, the biggest seaports worldwide currentlyare racing for automated and smart port concepts, which encourage and incentivizeships to use alternative and green energy and unmanned vehicles and are in line withIMO 2020 requirements. For example, the “Ghost Port Concept” has been used to referto Qingdao in China and Singapore, where there is almost no presence of human (Yun,2017). For this reason, it is important to recognize that image and social responsibility-related factor positively influences customer satisfaction. Furthermore, this positiveeffect also contributes to justify port’s investment in this aspect.
5. Discussion and implicationsThis paper validates the dimensions of PSQ model constructed from the genericmodels in the research of Thai (2008, 2015). Besides, in the context of a developingcountry like Vietnam, the investigation of how the dimensions of PSQ model influencecustomer satisfaction in the port sector is also carried out. Through theaforementioned analyses, it was unveiled that PSQ in Vietnam is a 4-dimensionalconstruct consisting of 16 items relating to outcomes, process, management andimage and social responsibility. It was also found that PSQ positively influences thesatisfaction of ports’ customers, in which outcomes-related factor plays the mostinfluential role, followed by image and social responsibility factor. The nextparagraphs discuss the implications and recommendations to improve the customersatisfaction of port services in Vietnam.
5.1 Improving port service outcomesRegarding the outcome-related PSQ factor, it is suggested that the seniormanagement of seaports in Vietnam should improve the promptness in carrying outtheir port services. It is widely agreed both in the literature and port managementpractice that ship owners and operators always want their vessels to be dispatched assoon as possible, as berthing at ports for a long time costs a huge amount of moneyand is not economically efficient for them. This is also one of the most importantfactors for these customers to decide whether or not to bring their vessels into a port.
Study ofcontainer ports
in Vietnam
87
Similarly, shippers and their representatives (i.e. freight forwarders and otherlogistics service providers) may not prefer a port whose cargo’s dwell-time is lengthy.Therefore, to meet the demand of these port customers, the operations department ofany seaport would need to significantly outline detailed berth, ship and yard planningwell in advance of vessel berthing (depending on the quality of human resource andcomputer software available at the port). Currently, the terminal operations systemhas been installed at many seaports in Vietnam to facilitate the operational activitiesof these ports. For this reason, there is the need to educate and train more staff andstevedores working at ports on technicalities in using the software and otheroperations. However, it was mentioned earlier in the introduction section thatseaports in the north of Vietnam possess distinctive features compared to those in thesouth. Specifically, the concentration of seaports in the south and fragmentation ofthose in the north leads to the discrepancy in applying technology. Such afragmentation and non-unification also reflect a piecemeal mindset in policy andmanagement planning in Vietnam in several economic sectors, including that in thenational logistics (Banomyong et al., 2015) and seaport (Thai, 2017) systems. Becauseof the fragmentation, the seaport system in the North of Vietnam faces difficulties inunifying interchange information systems between seaports, shipping lines and otherdry ports and inland container terminals. In this context, it is strongly recommendedthat the northern seaports of Vietnam should, under the guidelines of relevantgovernment agencies i.e. Ministry of Transport and Vietnam MaritimeAdministration as well as professional peak body i.e. Vietnam Seaports Association,discuss and implement various measures for smooth application of technology inports. For example, uniform standards and operating regulations should beestablished in ports which will then facilitate the unobstructed flows of ship andcargo movements, thus reducing turnaround time for ships and dwell-time forcargoes, and improving service quality for port users. This is important given that theefficiency of seaports especially container terminals is associated with their technicaland technological efficiencies (Yang and Yip, 2019). Meanwhile, with a higherproportion of electronic commerce port transactions in the south, seaports in this areashould pay more attention on measures to enhance the security of all electronictransactions against cyber-security attacks.
Besides, for all seaports in Vietnam, the efficiency in shipment delivery and receiptand the price of these services also inevitably contribute to improve the outcomes ofport services. Therefore, especially in this era of industrial revolution 4.0 (IR4), whichincludes Internet of Things, robotics and automation, the other recommendation to allports and terminals in Vietnam is to effectively combine both human resourceeffectiveness and technology advancements to enhance port operational efficiencyand service quality.
5.2 Improving port image, social responsibility and managementIn terms of image and social responsibility, we offer recommendations relating to twoelements being associated with this factor, namely, reputation and environment.Reputation reflects the image of the port, and significantly influences thesubconscious feeling of customers when deciding to use the service at a certain port.Obviously, the reputation of a port could not be enhanced without customers’ positiveexperience of its service quality, and in the era of IR4, just a negative customerexperience can be easily propagandized to the community with incredibly fast speedthrough social media. Hence, the responsibility of senior managements in a port is
MABR6,1
88

inevitably crucial, as they should set the role model of a leader to inspire employees tofollow, especially when it comes to activities to enhance the port’s service quality.
In terms of the environmental aspect, this has always been an issue of much publicconcern globally; however, it has not been paid much attention in the context ofmaritime activities in Vietnam compared to profit. This is evident from the findings ofthis research in which all items related to social and environmental responsibilitywere dropped. With the new IMO 2020 (low sulfur fuel regulation), the issue oflowering and limiting harmful effects of economic activities on the environment hasincreasingly become critical. In the seaport sector, many seaports worldwide, such asRotterdam and Long Beach, have been supplying liquefied natural gas and electricityto all vehicles and equipment (Port of Long Beach, 2020). Moreover, Rotterdam andGothenburg ports provide incentives in terms of discount of port dues and charges forvessels berthing at port that are operated by clean or low sulfur fuel (Port ofGothenburg Port Tariff for 2018 and Port of Rotterdam, General Terms andConditions Including Port Tariffs). As such, environmental education andimplementation of environmental friendly measures in ports should be the pivotalsolution for improving port image and social responsibility in Vietnamese seaports.These will help contribute to Vietnam Green Growth Strategy (GGS), which includesthe measures necessary to achieve sustainable development and reduce greenhousegas emissions, and indicates the direction of measures that should be implemented instages into the future (Climate and Development Knowledge Network, 2013).Implementing GGS and Green Growth Action Plan is critical for the Government ofVietnam, and seaports undoubtedly play an essential role in this respect.
Previous research highlighted that social and environmental responsibility PSQelements seem to affect customer satisfaction in developed countries of Singapore andSouth Korea (Thai, 2015; Yeo et al., 2016). In these port areas, environmental criteriain seaport activities have always been highly appreciated by port users. In contrast,some social responsibility-related indicators in port operations seem to be ignored byboth port users and port service providers in Vietnam. Indeed, applying these in thecontext of Vietnamese seaports seems to be difficult given the implied costconstraints. Nevertheless, a suitable suggestion which can be applied now in seaportsof Vietnam is the use of sewage disposal treatment (for ballast water) of vesselsberthing at these seaports.
6. Conclusion, limitation and future researchThe impact of service quality on customer satisfaction in the port sector is an under-researched area in the literature with only a few studies conducted quite recently, andscant research was found in the context of developing countries like Vietnam. Based onthe results obtained from this research, it is evidenced that there are four factorscontributing to PSQ, and customer satisfaction is significantly influenced by theenhancement of PSQ, in which the greatest impact is from the outcomes performance ofport service. It can be seen from the findings of this research that there are academicand managerial implications, both in terms of contribution to knowledge and practicalapplications. First, this research contributes to enhance a comprehensiveunderstanding of service quality as a key element of marketing strategy, especially inthe context of the seaport sector in a developing country like Vietnam. The resultsaffirm the significant and positive impacts of four PSQ factors, namely, outcomes,process, management, and image and social responsibility, which confirm the multi-dimensional nature of service quality on customer satisfaction. Second, some
Study ofcontainer ports
in Vietnam
89

managerial and policy recommendations can also be derived from findings of thisresearch. On the one hand, port managers in Vietnamese seaports are provided withguidelines on which areas of PSQ to focus their attention on so as to enhance theircustomers’ satisfaction. Specifically, improvements in various aspects of outcomes-related PSQ factors, i.e. timeliness, reliability, shipment safety and security, price andflexibility, should be made as these were perceived by port customers as criticalcontributors to their satisfaction with a port’s service quality. Besides, as portcustomers in Vietnam also appreciate the relationship that a port builds and maintainswith its maritime supply chain partners, its operations and work safety as well asreputation for reliability in the market, policies and strategies for a morecomprehensive and meaningful collaboration with other port stakeholders will becritical to a port’s performance in terms of service quality and customer satisfaction.This is especially important for seaports in the North of Vietnam to overcome thefragmentation and non-unification in port development which is partly because of theabsence of the implementation of “port authority” similar to that elsewhere in the world(Thai, 2017). Relevant government agencies i.e. the Ministry of Transport and VietnamMaritime Administration therefore should look into this issue seriously and provideprudent guidelines for various port operators. Meanwhile, for seaports in the south,more attention should be focused specifically on the next stage of development.Whereas seaports participate more intensively in e-commerce based business, and thusimportant issues such as cyber-security and diversification of port services would beneeded to enhance more values for port customers.
Despite the significance of this study’s findings, both in terms of theory buildingand managerial and policy implications, the generalization of this study should bedone with caution. Being a developing country with unique political and socio-economic systems which are different from those of other emerging economies, thegovernance, administration and management of seaports in Vietnam possess somedistinctive features (e.g. lack of “port authority” mentioned earlier) which may affectport customer satisfaction in some different ways. Therefore, it is recommended thatthe conceptual model developed in this research should be further tested in thecontext of other developing countries so as to improve the validity and reliability ofthe study instrument and enrich the theory of PSQ accordingly.
ReferencesAgency Of Foreign Trade. (2018), “Ministry of industry and trade of the socialist republic of Vietnam”,
Vietnam Logistics Report 2018, Ministry of Industry and Trade Press, Hanoi.Anderson, E.W., Fornell, C. and Lehmann, D.R. (1994), “Customer satisfaction, market share and
profitability: findings from Sweden”, Journal of Marketing, Vol. 58 No. 3, pp. 53-66.Anderson, S.W., Baggett, L.S. and Widener, S.K. (2009), “The impact of service operations
failures on customer satisfaction: evidence on how failures and their source affect whatmatters to customers”, Manufacturing and Service Operations Management, Vol. 11No. 1, pp. 52-69.
Babakus, E. and Boller, G.W. (1992), “An empirical assessment of the SERVQUAL scale”, Journal ofBusiness Research, Vol. 24 No. 3, pp. 253-268.
Bagozzi, R.P., Yi, Y. and Phillips (1991), “Assessing construct validity in organizational research”,Administrative Science Quarterly, Vol. 36 No. 3, pp. 421-458.
Banomyong, R., Thai, V.V. and Yuen, K. (2015), “Assessing the national logistics system of Vietnam”,The Asian Journal of Shipping and Logistics, Vol. 31 No. 1, pp. 21-58.
MABR6,1
90

Barney, J.B. (1991), “Firm resources and sustained competitive advantage”, Journal of Management,Vol. 17 No. 1, pp. 99-120.
Bichou, K. (2013), “An empirical study of the impacts of operating and market conditions on container-port efficiency and benchmarking”, Research in Transportation Economics, Vol. 42 No. 1,pp. 28-37.
Bollen, K.A. (1989), Structural Equations with Latent Variables, Wiley, New York, NY.Brady, M.K. and Cronin JR, J.J. (2001), “Some new thoughts on conceptualizing perceived service
quality: a hierarchical approach”, Journal of Marketing, Vol. 65, pp. 34-39.Brady, M.K. and Robertson, C.J. (2001), “Searching for a consensus on the antecedent role of service
quality and satisfaction: an exploratory cross-national study”, Journal of Business Research,Vol. 51 No. 1, pp. 53-60.
Branch, A.E. (1986), Elements of Port Operation andManagement, Chapman and Hall, London.Burch, E., Rogers, H.P. and Underwood, J. (1995), “Exploring SERVPERF: an empirical investigation of
the importance-performance”, Service Quality Relationship in the Uniform Rental Industry,available at: http//saber.uca.edu/docs/proceedings11/
Cao, C. and Chen, J. (2011), “An empirical analysis of the relationship among service quality, customersatisfaction and loyalty of high speed railway based on structural equation model”, CanadianSocial Science, Vol. 7 No. 4, pp. 67-73.
Caro, L.M. and Garcia, J.A.M. (2007), “Measuring perceived service quality in urgent transport service”,Journal of Retailing and Consumer Services, Vol. 14 No. 1, pp. 60-72.
Chang, C.-H. and Thai, V.V. (2016), “Do port security quality and service quality influencecustomer satisfaction and loyalty?”, Maritime Policy and Management, Vol. 43Nos No. 6,pp. 720-736.
Churchill, G.A. (1991),Marketing Research: Methodological Foundations, The Dryden Press, London.Cho, C.H., Kim, B.I. and Hyun, J.H. (2010), “A comparative analysis of the ports of Incheon and
Shanghai: the cognitive service quality of ports, customer satisfaction, and post-behaviour”, Total Quality Management and Business Excellence, Vol. 21 No. 9,pp. 919-930.
Chowdhary, N. and Prakash, M. (2007), “Prioritizing service quality dimensions”, Managing ServiceQuality: An International Journal, Vol. 17 No. 5, pp. 493-509.
Climate and Development Knowledge Network (2013), “FEATURE: Vietnam’s national green growthstrategy”, available at: https://cdkn.org/2013/04/feature-vietnams-national-green-growth-strategy/?loclang=en_gb
Cronin Jr, J.J. and Taylor, S.A. (1992), “Measuring service quality: a reexamination and extension”,Journal of Marketing, Vol. 56 No. 3, pp. 55-69.
Farrelly, F.J. and Quester, P.G. (2005), “Examining important relationship quality constructs ofthe focal sponsorship exchange”, Industrial Marketing Management, Vol. 34 No. 3,pp. 211-219.
Foster, T.A. (1979), “What’s important in a port”,DistributionWorldwide, Vol. 78 No. 1, pp. 32-36.FPT Research (2017), available at: https://static1.vietstock.vn/edocs/5802/Marine_Port_Report_072017_FPTS.
Gaski, J.F. and Nevin, J.R. (1985), “The differential effects of exercised and unexercised power sources ina marketing channel”, Journal of Marketing Research, Vol. 22 No. 2, pp. 130-142.
Gil-Saura, I., Berenguer-Contri, G. and Ruiz-Molina, M.E. (2018), “Satisfaction and loyalty in B2Brelationships in the freight forwarding industry: adding perceived value and service quality intoequation”,Transport, Vol. 33 No. 5, pp. 1184-1195.
Gronroos, C. (1984), “A service quality model and its marketing implications”, European Journal ofMarketing, Vol. 18 No. 4, pp. 36-44.
Study ofcontainer ports
in Vietnam
91

Guo, X., Duff, A. and Hair, M. (2008), “Service quality measurement in the Chinese corporate bankingmarket”, International Journal of BankMarketing, Vol. 26 No. 5, pp. 305-327.
Ha, M.-S. (2003), “A comparison of service quality at major container ports: implications for Koreanports”, Journal of Transport Geography, Vol. 11 No. 2, pp. 131-137.
Hair, J.H., Anderson, R. and Black, W. (1995), Multivariate data analysis: with readings EnglewoodCliffs, Prentice-Hall.
Hair, J.F., Black, W.C., Babin, B.J. and Anderson, R.E. (2010), Multivariate Data Analysis, SeventhEdition.
Hill, N., Brierley, J. and Macdougall, R. (2003), How to Measure Customer Satisfaction, Gower,Aldershot.
Hopkins, S.A., Strasser, S., Hopkins, W.E. and Foster, J.R. (1993), “Service quality gaps in thetransportation industry: an empirical investigation”, Journal of Business Logistics, Vol. 14 No. 1,pp. 145-162.
Hu, K.C. and Lee, P.T.W. (2017), “Novel 3D model for prioritizing the attributes of port service quality:cases involving major container ports in Asia”, International Journal of Shipping and TransportLogistics, Vol. 9 No. 6, pp. 673-695.
Kolanovic, I., Skenderovic, J. and Zenzerovic, Z. (2008), “Defining the port service quality model byusing the factor analysis”, Pomorstvo, God, Vol. 22, pp. 284 -285.
Ladhari, R. (2008), “Alternative measures of service quality: a review”, Managing Service Quality: AnInternational Journal, Vol. 18 No. 1, pp. 65-86.
Le, A.-T., Ho, T.-V. and Nguyen, L.-N. (2018), “Study of satisfaction of customers for the quality ofsea transport services: case in Tan Cang shipping joint stock Company – Da Nang branch”,International Research Journal of Advanced Engineering and Science, Vol. 3 No. 4,pp. 220-224.
Lee, S.-Y., Jose, L.T. and Chang, Y.-T. (2013), “Assessing port service quality by process component: thecase of Korean and Chinese ports”, International Journal of Shipping and Transport Logistics,Vol. 5 No. 2, pp. 137-154.
Lehtinen, U. and Lehtinen, J.R. (1991), “Two approaches to service quality dimensions”, The ServiceIndustries Journal, Vol. 11 No. 3, pp. 287-303.
Litwin (1995),How toMeasure Survey Reliability and Validity, Thousand Oaks, CA Sage.
Liao, K.-H. (2012), “Service quality, and customer satisfaction: direct and indirect effects in a B2B customerloyalty framework”,The Journal of Global BusinessManagement, Vol. 8 No. 1, pp. 86-93.
Madhani, P.M. (2010), Resource Based View (RBV) of Competitive Advantage: An Overview, The IcfaiUniversity Press, Hyderabad, pp. 3-22.
Miremadi, A., Ghalamkari, S. and Sadeh, F. (2011), “Customer satisfaction in port industry – a casestudy of Iranian shipping”, in 2011 International Conference on Sociality and EconomicsDevelopment, Vol. 10, pp. 58-62.
Murphy, P.E. and Ross, S.C. (1987), “Evaluating service firms: approaches with policyrecommendations”, Journal of Consumer Policy, Vol. 10, pp. 363-81.
Nguyen, C.K.T. and Ngo, Q.T. (2017), Report of Seaport, FPT Securities, Hanoi.
Nguyen, H.V. (2015), “Service quality at the seaport system of Saigon Newport corporation”,International Journal of Marketing Studies, Vol. 7 No. 6, pp. 145-154.
Oliver, R. (1997), Satisfaction: A Behavioral Perspective on the Customer, McGraw-Hill, Boston, MA.Pak, J.Y., Thai, V.V. and Yeo, G.T. (2015), “Fuzzy MCDM approach for evaluating intangible
resources affecting port service quality”, The Asian Journal of Shipping and Logistics,Vol. 31 No. 4, pp. 459-468.
Pantouvakis, A. (2010), “The relative importance of service features in explaining customersatisfaction”,Managing Service Quality: An International Journal, Vol. 20 No. 4, pp. 366-387.
MABR6,1
92

Parasuraman, A., Zeithaml, V.A. and Berry, L.L. (1985), “A conceptual model of service quality and itsimplications for future research”, Journal of Marketing, Vol. 49 No. 4, pp. 41-50.
Parasuraman, A., Zeithaml, V.A. and Berry, L.L. (1994), “Reassessment of expectations as a comparisonstandard in measuring service quality: implications for further research”, Journal of Marketing,Vol. 58 No. 1, pp. 111-124.
Pham, T.-Y. and Yeo, G.-T. (2019), “Evaluation of transshipment container terminals’ service quality inVietnam: from the shipping companies’ perspective”, Sustainability, Vol. 11 No. 5, doi: 10.3390/su11051503.
Rushton, A., Croucher, P. and Baker, P. (2014), The Handbook of Logistics and DistributionManagement, KoganPage, London.
Santouridis, I. and Trivellas, P. (2010), “Investigating the impact of service quality and customersatisfaction on customer loyalty in mobile telephony in Greece”,The TQM Journal, Vol. 22 No. 3,pp. 330-343.
Seth, N., Deshmukh, S.G. and Vrat, P. (2006), “A framework for measurement of quality of servicein supply chains”, Supply Chain Management: An International Journal, Vol. 11 No. 1,pp. 82-94.
Slack, B. (1985), “Containerization and Inter C port Competition”, Maritime Policy and Management,Vol. 12 No. 4, pp. 293-304.
Ship-Technology (2019), “Lach Huyen international gateway port, Haiphong”, available at: www.ship-technology.com/projects/lach-huyen-international-gateway-port-haiphong/
Tepe, R. (2015), “A study on the service quality components of container shipping”, Master’s thesis,Dokuz Eylul University, Graduate School of Social Sciences.
Thai, V.,V. (2017), “Assessing the national port system: the case of Vietnam”, Pettit, S. and Beresford, A., (eds),(Chapter 15), in Port Management: Cases in Port Geography, Operations and Policy, Kogan Page,pp. 407-443.
Thai, V.V., Tay, W.J., Tan, R. and Lai, A. (2014), “Defining service quality in tramp shipping:conceptual model and empirical evidence”, The Asian Journal of Shipping and Logistics, Vol. 30No. 1, pp. 01-29.
Thai, V.V. (2008), “Service quality in Maritime transport: Conceptual model and empirical evidence”,Asia Pacific Journal of Marketing and Logistics, Vol. 20 No. 4, pp. 493-518.
Thai, V.V. (2015), “The impact of port service quality on customer satisfaction: the case of Singapore”,Maritime Economics and Logistics, Vol. 18 No. 4, pp. 1-18.
Thamrin, H.M. (2012), “The role of service marketing mix and ship service quality towards perceivedvalue and its impact to ship passenger’s satisfaction in Indonesia”, Global Journal ofManagement and Business Research, Vol. 12 No. 3, pp. 96-101.
Ugboma, C., Ibe, C. and Orwude, I.C. (2004), “Service quality measurements in ports of a developingeconomy: Nigerian ports survey”, Managing Service Quality: An International Journal, Vol. 14No. 6, pp. 487-497.
Van Dyke, T.P., Kappelman, L.A. and Prybutok, V.R. (1997), “Measuring information systemsservice quality: concerns on the use of the servqual questionnaire”, MIS Quarterly,pp. 195-207.
Vietnam Seaports Association (2018), “Statistics 2018”, available at: www.vpa.org.vn/statistics-2018/
Wanke, P.F. and Barros, C.P. (2015), “Public-private partnerships and scale efficiency in Brazilianports: evidence from two-stage DEA analysis”, Socio-Economic Planning Sciences, Vol. 51,pp. 13-22.
World Bank (2007),World Bank Seaport Toolkit, 2nd ed., World Bank, Washington, DC.Yang, X. and Yip, T.-L. (2019), “Sources of efficiency changes at Asian container ports”, Maritime
Business Review, Vol. 4 No. 1, pp. 71-93.
Study ofcontainer ports
in Vietnam
93

Yeo, G.T., Thai, V.V. and Roh, S.Y. (2015), “An analysis of port service quality and customersatisfaction: the case of korean container ports”, Asian Journal of Shipping and Logistics, Vol. 31No. 4, pp. 427-447.
Yeo, G.T., Thai, V.V. and Roh, S.Y. (2016), “An analysis of port service quality and customersatisfaction: the case of Korean container ports”, The Asian Journal of Shipping and Logistics,Vol. 31 No. 4, pp. 427-447.
Yun, G. (2017), “Ghost port: Asia’s first fully-automated port begins operations in Qingdao”, availableat: CGTN.com,https://news.cgtn.com/news/3d637a4e31677a4d/share_p.html
Corresponding authorVinh V. Thai can be contacted at: [email protected]
For instructions on how to order reprints of this article, please visit our website:www.emeraldgrouppublishing.com/licensing/reprints.htmOr contact us for further details: [email protected]
MABR6,1
94