port of sd fact sheets
TRANSCRIPT
September 2014Fact Sheet 1 of 6
TRANSPORTATION and LAND USE (T&LU) FACT SHEET
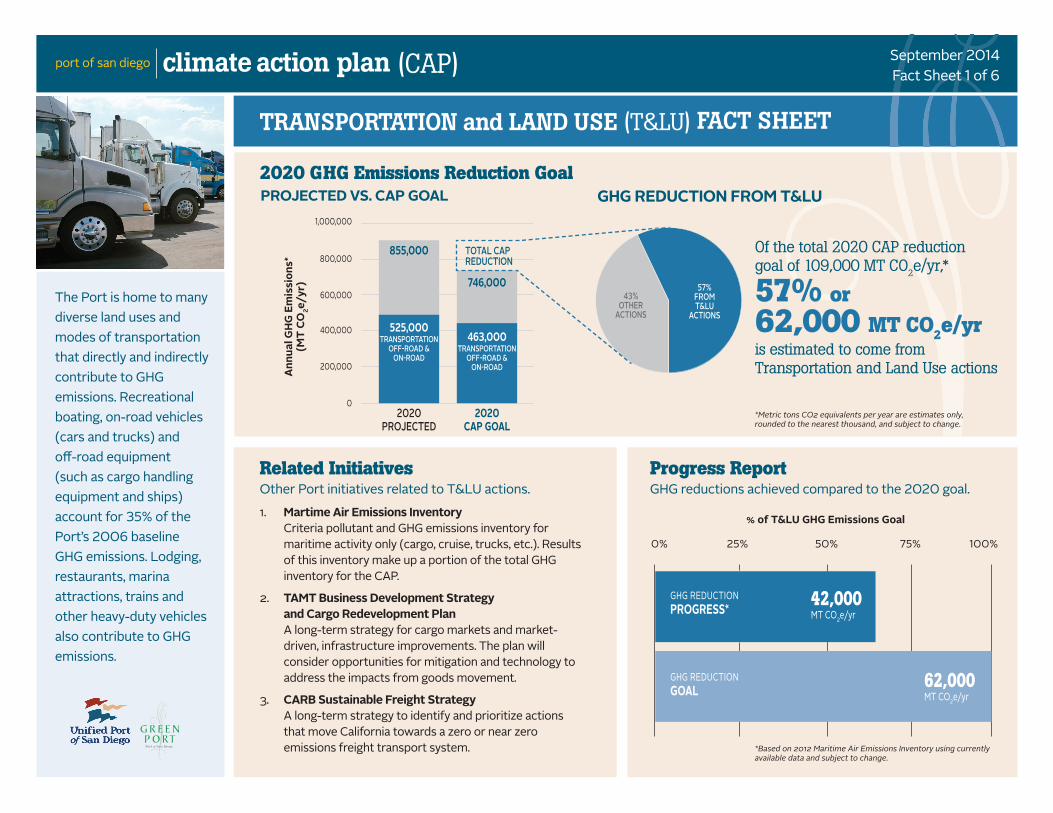
The Port is home to many diverse land uses and modes of transportation that directly and indirectly contribute to GHG emissions. Recreational boating, on-road vehicles (cars and trucks) and off-road equipment (such as cargo handling equipment and ships) account for 35% of the Port’s 2006 baseline GHG emissions. Lodging, restaurants, marina attractions, trains and other heavy-duty vehicles also contribute to GHG emissions.
climate action plan (CAP)
Annu
al G
HG E
mis
sion
s*(M
T CO
2e/y
r)
1,000,000
800,000
600,000
400,000
200,000
02020
PROJECTED2020
CAP GOAL
746,000
525,000TRANSPORTATION
OFF-ROAD & ON-ROAD
463,000TRANSPORTATION
OFF-ROAD & ON-ROAD
2020 GHG Emissions Reduction Goal
Related InitiativesOther Port initiatives related to T&LU actions.
Progress ReportGHG reductions achieved compared to the 2020 goal.
PROJECTED VS. CAP GOAL
1. Martime Air Emissions Inventory Criteria pollutant and GHG emissions inventory for maritime activity only (cargo, cruise, trucks, etc.). Results of this inventory make up a portion of the total GHG inventory for the CAP.
2. TAMT Business Development Strategy and Cargo Redevelopment Plan A long-term strategy for cargo markets and market-driven, infrastructure improvements. The plan will consider opportunities for mitigation and technology to address the impacts from goods movement.
3. CARB Sustainable Freight Strategy A long-term strategy to identify and prioritize actions that move California towards a zero or near zero emissions freight transport system.
% of T&LU GHG Emissions Goal
0% 25% 50% 75% 100%
855,000 Of the total 2020 CAP reduction goal of 109,000 MT CO2e/yr,*
57% or62,000 MT CO2e/yris estimated to come from Transportation and Land Use actions
62,000 MT CO2e/yr
42,000 MT CO2e/yr
*Metric tons CO2 equivalents per year are estimates only, rounded to the nearest thousand, and subject to change.
*Based on 2012 Maritime Air Emissions Inventory using currently available data and subject to change.
TOTAL CAPREDUCTION
43%OTHER
ACTIONS
GHG REDUCTION GOAL
GHG REDUCTION PROGRESS*
GHG REDUCTION FROM T&LU
57% FROMT&LU
ACTIONS
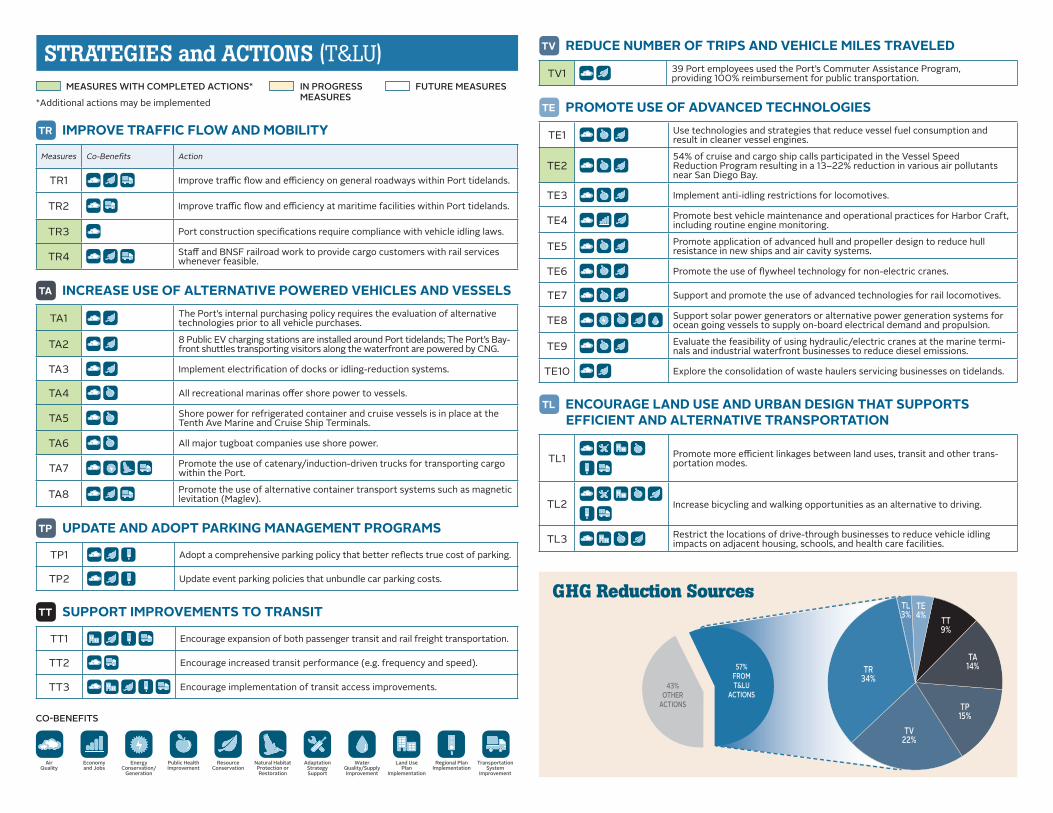
STRATEGIES and ACTIONS (T&LU)
TR IMPROVE TRAFFIC FLOW AND MOBILITYMeasures Co-Benefits Action
TR1 Improve traffic flow and efficiency on general roadways within Port tidelands.
TR2 Improve traffic flow and efficiency at maritime facilities within Port tidelands.
TR3 Port construction specifications require compliance with vehicle idling laws.
TR4 Staff and BNSF railroad work to provide cargo customers with rail services whenever feasible.
TA INCREASE USE OF ALTERNATIVE POWERED VEHICLES AND VESSELS
TA1 The Port’s internal purchasing policy requires the evaluation of alternative technologies prior to all vehicle purchases.
TA2 8 Public EV charging stations are installed around Port tidelands; The Port’s Bay-front shuttles transporting visitors along the waterfront are powered by CNG.
TA3 Implement electrification of docks or idling-reduction systems.
TA4 All recreational marinas offer shore power to vessels.
TA5 Shore power for refrigerated container and cruise vessels is in place at the Tenth Ave Marine and Cruise Ship Terminals.
TA6 All major tugboat companies use shore power.
TA7 Promote the use of catenary/induction-driven trucks for transporting cargo within the Port.
TA8 Promote the use of alternative container transport systems such as magnetic levitation (Maglev).
TP UPDATE AND ADOPT PARKING MANAGEMENT PROGRAMS
TP1 Adopt a comprehensive parking policy that better reflects true cost of parking.
TP2 Update event parking policies that unbundle car parking costs.
TT SUPPORT IMPROVEMENTS TO TRANSIT
TT1 Encourage expansion of both passenger transit and rail freight transportation.
TT2 Encourage increased transit performance (e.g. frequency and speed).
TT3 Encourage implementation of transit access improvements.
TV REDUCE NUMBER OF TRIPS AND VEHICLE MILES TRAVELED
TV1 39 Port employees used the Port’s Commuter Assistance Program, providing 100% reimbursement for public transportation.
TE PROMOTE USE OF ADVANCED TECHNOLOGIES
TE1 Use technologies and strategies that reduce vessel fuel consumption and result in cleaner vessel engines.
TE2 54% of cruise and cargo ship calls participated in the Vessel Speed Reduction Program resulting in a 13–22% reduction in various air pollutants near San Diego Bay.
TE3 Implement anti-idling restrictions for locomotives.
TE4 Promote best vehicle maintenance and operational practices for Harbor Craft, including routine engine monitoring.
TE5 Promote application of advanced hull and propeller design to reduce hull resistance in new ships and air cavity systems.
TE6 Promote the use of flywheel technology for non-electric cranes.
TE7 Support and promote the use of advanced technologies for rail locomotives.
TE8 Support solar power generators or alternative power generation systems for ocean going vessels to supply on-board electrical demand and propulsion.
TE9 Evaluate the feasibility of using hydraulic/electric cranes at the marine termi-nals and industrial waterfront businesses to reduce diesel emissions.
TE10 Explore the consolidation of waste haulers servicing businesses on tidelands.
TL ENCOURAGE LAND USE AND URBAN DESIGN THAT SUPPORTS EFFICIENT AND ALTERNATIVE TRANSPORTATION
TL1
Promote more efficient linkages between land uses, transit and other trans-portation modes.
TL2
Increase bicycling and walking opportunities as an alternative to driving.
TL3 Restrict the locations of drive-through businesses to reduce vehicle idling impacts on adjacent housing, schools, and health care facilities.
CO-BENEFITS
Economyand Jobs
Energy Conservation/
Generation
Regional Plan Implementation
Transportation System
Improvement
Water Quality/Supply Improvement
Natural Habitat Protection or Restoration
Air Quality
Public Health Improvement
Resource Conservation
Adaptation Strategy Support
Land Use Plan
Implementation
GHG Reduction Sources
57% FROMT&LU
ACTIONS43%
OTHERACTIONS
TR34%
TV22%
TP15%
TA14%
TT9%
TL 3%
TE 4%
MEASURES WITH COMPLETED ACTIONS* IN PROGRESS MEASURES
FUTURE MEASURES*Additional actions may be implemented

September 2014Fact Sheet 2 of 6
ENERGY CONSERVATION and EFFICIENCY (EC&E) FACT SHEET
The built environment is a significant indirect contributor to GHG emissions as a result of the electricity and natural gas demand in buildings. Increasing the energy efficiency of both new and existing buildings will result in significant GHG reductions. The Port can implement energy strategies for buildings and exterior spaces, which can provide the opportunity to save money on utility costs, improve air quality, and provide other community benefits.
climate action plan (CAP)
Annu
al G
HG E
mis
sion
s*(M
T CO
2e/y
r)
1,000,000
800,000
600,000
400,000
200,000
02020
PROJECTED2020
CAP GOAL
746,000
300,000ELECTRICITY & NATURAL GAS
256,000ELECTRICITY & NATURAL GAS
2020 GHG Emissions Reduction Goal
Related InitiativesOther Port Initiatives related to EC&E actions.
Progress ReportGHG reductions achieved compared to the 2020 goal.
PROJECTED VS. CAP GOAL
1. Energy Roundtable Established by Chairman Bob Nelson and chaired by Jim Waring, Executive Chairman of CleanTECH San Diego, the Roundtable is a group of industry leaders that provides input on best practices to reduce GHG emissions and increase energy security for the Port and the tenants.
2. Local Government Partnership Program with SDG&E The Port is implementing energy saving initiatives, such as the Green Business Network, energy efficiency upgrades to Port facilities, and education and training for staff, with the goal of achieving a greater and long-lasting reduction in energy use on Port tidelands.
% of EC&E GHG Emissions Goal
0% 25% 50% 75% 100%
855,000 Of the total 2020 CAP reduction goal of 109,000 MT CO2e/yr,*
20% or22,000 MT CO2e/yris estimated to come from Energy Conservation and Efficiency actions
TOTAL CAPREDUCTION
*Metric tons CO2 equivalents per year are estimates only, rounded to the nearest thousand, and subject to change.
80%OTHER
ACTIONS
GHG REDUCTION FROM EC&E
20% FROMEC&C
ACTIONS
*Based on currently available data for 2013 and subject to change.
22,000 MT CO2e/yr
14,000 MT CO2e/yr
GHG REDUCTION GOAL
GHG REDUCTION PROGRESS*

STRATEGIES and ACTIONS (EC&E)
EB REDUCE BUILDING ENERGY USEMeasures Co-Benefits Action
EB1 Green building standards for new construction are under development and will likely include measures EL1 , EB3, and elements of SW3, WR1 and EB7.
EB2 Establish green building standards and/or policy for existing buildings.
EB3 This measure (energy efficiency performance standards) will be included in the development of green building standards (EB1 and EB2).
EB4 No-cost energy audits and energy efficiency education are offered through the Green Business Network to encourage the retrofit of existing buildings to reduce energy use.
EB5The Green Business Network provides education and outreach to Port businesses to increase understanding and awareness of energy efficiency funding opportunities.
EB6The Green Business Network provides free energy audits to Port businesses and assists in accessing funding programs and other incentives to install energy efficient lighting and other building retrofits.
EB7 Enforce the requirements of AB1103 requiring owners of nonresidential buildings in CA to measure and report to the California Energy Commission the building’s energy use via U.S. EPA Energy Star Portfolio Manager and disclose the information to prospective buyers, lessees, and lenders.
EH REDUCE HEAT GAIN AND INCREASE SHADING
Measures Co-Benefits Action
EH1 Adopt a Heat Island Mitigation Plan that uses cool roofs, cool pavements, and strategically placed shade trees, and actively inspect and enforce state requirements for cool roofs on non-residential re-roofing projects.
EH2
Urban Forestry Management: Develop an Urban Forestry Program to consolidate policies and ordinances regarding tree planting, maintenance, and removal, including: comprehensive inventory and analysis of the urban forest, tree-planting target and schedule to support goals of the California Climate Action Team to plant 5 million trees in urban areas by 2020.Establish guidelines for tree planting (deciduous vs. evergreen, low-VOC- producing trees, drought-tolerant native trees and vegetation).
EH3 Portions of this measure (convert existing landscaping to reflective and impervious surfaces) are being addressed within existing Low Impact Development requirements of the stormwater program.
GHG Reduction Sources
EB80%
EL10%
EH10%
20% FROMEC&C
ACTIONS
80%OTHER
ACTIONS
EL IMPROVE LIGHTING PERFORMANCE
Measures Co-Benefits Action
EL1 This measure (exterior lighting performance standards) will be included in the development of green building standards (EB1 and EB2).
EL2 Port stoplights will be upgraded in efficiency when current lights burn out .
EL3 7 of 32 Port-managed vending machines have been de-lamped to achieve energy savings at no cost.
EL4Phase I of an exterior lighting retrofit project was completed in June 2014, installing more than 300 energy efficiency LED lights and reducing energy consumption by 300,000 kWh annually; Energy efficiency retrofit projects in the Port’s two largest buildings will be completed by December 2014, reducing energy consumption by approximately 220,000 kWh annually.
CO-BENEFITS
Economyand Jobs
Energy Conservation/
Generation
Regional Plan Implementation
Transportation System
Improvement
Water Quality/Supply Improvement
Natural Habitat Protection or Restoration
Air Quality
Public Health Improvement
Resource Conservation
Adaptation Strategy Support
Land Use Plan
Implementation
MEASURES WITH COMPLETED ACTIONS* IN PROGRESS MEASURES FUTURE MEASURES*Additional actions may be implemented
September 2014Fact Sheet 3 of 6
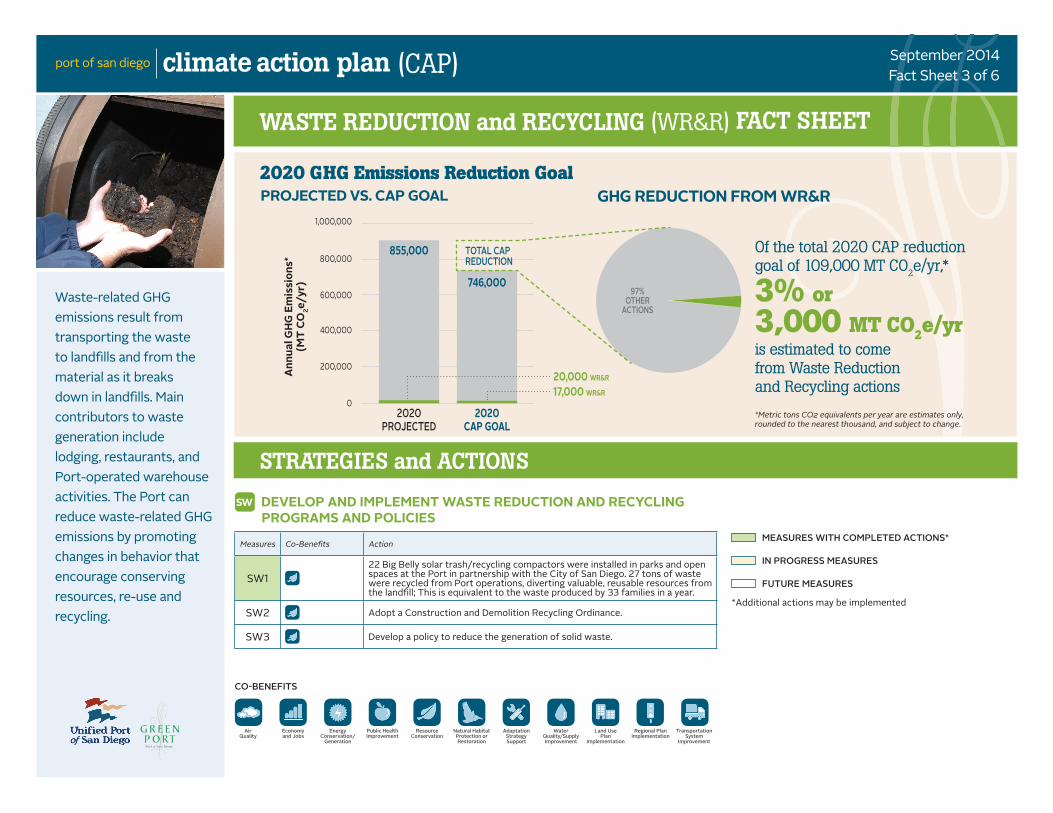
WASTE REDUCTION and RECYCLING (WR&R) FACT SHEET
climate action plan (CAP)
Annu
al G
HG E
mis
sion
s*(M
T CO
2e/y
r)
1,000,000
800,000
600,000
400,000
200,000
02020
PROJECTED2020
CAP GOAL
746,000
20,000 WR&R
17,000 WR&R
2020 GHG Emissions Reduction GoalPROJECTED VS. CAP GOAL
855,000 Of the total 2020 CAP reduction goal of 109,000 MT CO2e/yr,*
3% or3,000 MT CO2e/yris estimated to come from Waste Reduction and Recycling actions
SW DEVELOP AND IMPLEMENT WASTE REDUCTION AND RECYCLING PROGRAMS AND POLICIES
Measures Co-Benefits Action
SW1 22 Big Belly solar trash/recycling compactors were installed in parks and open spaces at the Port in partnership with the City of San Diego. 27 tons of waste were recycled from Port operations, diverting valuable, reusable resources from the landfill; This is equivalent to the waste produced by 33 families in a year.
SW2 Adopt a Construction and Demolition Recycling Ordinance.
SW3 Develop a policy to reduce the generation of solid waste.
Waste-related GHG emissions result from transporting the waste to landfills and from the material as it breaks down in landfills. Main contributors to waste generation include lodging, restaurants, and Port-operated warehouse activities. The Port can reduce waste-related GHG emissions by promoting changes in behavior that encourage conserving resources, re-use and recycling.
CO-BENEFITS
Economyand Jobs
Energy Conservation/
Generation
Regional Plan Implementation
Transportation System
Improvement
Water Quality/Supply Improvement
Natural Habitat Protection or Restoration
Air Quality
Public Health Improvement
Resource Conservation
Adaptation Strategy Support
Land Use Plan
Implementation
TOTAL CAPREDUCTION
*Metric tons CO2 equivalents per year are estimates only, rounded to the nearest thousand, and subject to change.
GHG REDUCTION FROM WR&R
97%OTHER
ACTIONS
STRATEGIES and ACTIONS
MEASURES WITH COMPLETED ACTIONS*
IN PROGRESS MEASURES
FUTURE MEASURES
*Additional actions may be implemented
September 2014Fact Sheet 4 of 6
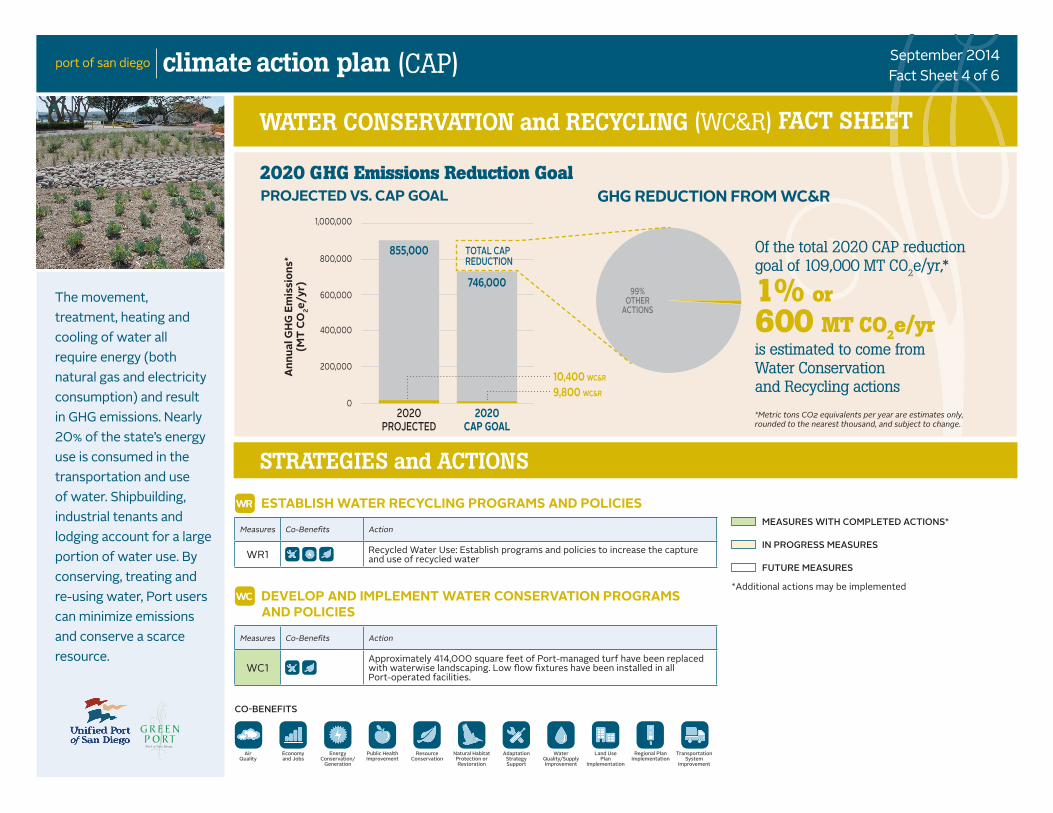
WATER CONSERVATION and RECYCLING (WC&R) FACT SHEET
STRATEGIES and ACTIONS
climate action plan (CAP)
Annu
al G
HG E
mis
sion
s*(M
T CO
2e/y
r)
1,000,000
800,000
600,000
400,000
200,000
02020
PROJECTED2020
CAP GOAL
746,000
2020 GHG Emissions Reduction GoalPROJECTED VS. CAP GOAL
855,000 Of the total 2020 CAP reduction goal of 109,000 MT CO2e/yr,*
1% or600 MT CO2e/yris estimated to come from Water Conservation and Recycling actions
The movement, treatment, heating and cooling of water all require energy (both natural gas and electricity consumption) and result in GHG emissions. Nearly 20% of the state’s energy use is consumed in the transportation and use of water. Shipbuilding, industrial tenants and lodging account for a large portion of water use. By conserving, treating and re-using water, Port users can minimize emissions and conserve a scarce resource.
WR ESTABLISH WATER RECYCLING PROGRAMS AND POLICIESMeasures Co-Benefits Action
WR1 Recycled Water Use: Establish programs and policies to increase the capture and use of recycled water
WC DEVELOP AND IMPLEMENT WATER CONSERVATION PROGRAMS AND POLICIES
Measures Co-Benefits Action
WC1 Approximately 414,000 square feet of Port-managed turf have been replaced with waterwise landscaping. Low flow fixtures have been installed in all Port-operated facilities.
CO-BENEFITS
Economyand Jobs
Energy Conservation/
Generation
Regional Plan Implementation
Transportation System
Improvement
Water Quality/Supply Improvement
Natural Habitat Protection or Restoration
Air Quality
Public Health Improvement
Resource Conservation
Adaptation Strategy Support
Land Use Plan
Implementation
TOTAL CAPREDUCTION
10,400 WC&R
9,800 WC&R
MEASURES WITH COMPLETED ACTIONS*
IN PROGRESS MEASURES
FUTURE MEASURES
*Additional actions may be implemented
*Metric tons CO2 equivalents per year are estimates only, rounded to the nearest thousand, and subject to change.
GHG REDUCTION FROM WC&R
99%OTHER
ACTIONS

September 2014Fact Sheet 5 of 6
ALTERNATIVE ENERGY GENERATION (AEG) FACT SHEET
Shifting from fossil fuel power sources to clean, renewable energy can contribute significantly to meeting the Port’s GHG reduction goals. The Port can help meet energy demands through on-site, distributed renewable energy generation. Alternative energy policies, programs and technologies can make Port tenants more resilient to price variations and interruptions in power supply, while promoting the economic benefits of new, local industries.
climate action plan (CAP)
Annu
al G
HG E
mis
sion
s*(M
T CO
2e/y
r)
1,000,000
800,000
600,000
400,000
200,000
02020
PROJECTED2020
CAP GOAL
746,000
Related InitiativesOther Port initiatives related to AEG actions.
Progress ReportGHG reductions achieved compared to the 2020 goal.
GHG REDUCTION FROM AEGPROJECTED VS. CAP GOAL
1. Energy Roundtable Established by Chairman Bob Nelson and chaired by Jim Waring, Executive Chairman of CleanTECH San Diego, the Roundtable is a group of industry leaders that provides input on best practices to reduce greenhouse gas emissions and increase energy security for the Port and the tenants.
% of GHG Emissions Goal
855,000 Of the total 2020 CAP reduction goal of 109,000 MT CO2e/yr,*
20% or22,000 MT CO2e/yris estimated to come from Alternative Energy Generation actions
0% 25% 50% 75% 100%
GHG REDUCTION PROGRESSTO BE DETERMINED
22,000 MT CO2e/yr GHG REDUCTION GOALALTERNATIVE ENERGY GENERATION
TOTAL CAPREDUCTION
147,000ELECTRICITY 125,000
ELECTRICITY
*Metric tons CO2 equivalents per year are estimates only, rounded to the nearest thousand, and subject to change.
80%OTHER
ACTIONS
20% FROMAEG
ACTIONS
2020 GHG Emissions Reduction Goal

STRATEGIES and ACTIONS (AEG)
EA PROMOTE AND IMPLEMENT ON-SITE RENEWABLE ENERGY GENERATION
Measures Co-Benefits Action
EA1 An on-site renewable energy generation policy is under development. Over 257,000 kWh of renewable energy was produced for Port operations in FY 13/14.
EA2 Implement on-site renewable energy generation policy for 2035 (solar power, wind power, methane recovery, wave power etc.).
EA3 Implement on-site renewable energy generation policy for 2050 (solar power, wind power, methane recovery, wave power etc.).
EA4 Establish policies and programs that facilitate the siting of new renewable energy generation.
EA5
Remove Barriers: Identify and remove or reduce barriers to renewable energy production, including: 1) Review and revise building and development codes, design guidelines, and zoning ordinances to remove barriers; 2) Work with related agencies, such as fire, water, health and others that may have policies or requirements that adversely impact the development or use of renewable energy technologies.
EA6 Pursue economic incentives and creative financing for renewable energy projects (such as a Solar Cooperative Purchasing Policy), as well as other support for tenants or developers seeking funding for such projects.
EA7 Promote co-generation (i.e., combined heat and power system) projects.
EA8 Encourage the implementation of methane recovery systems that generate energy for use at landfills used by tenants.
EA9 Reduce costs to permit alternative energy generation projects.
EA10 Develop clean, fuel cell distributed generation within Port tidelands.
EA11 Implement a program to install technologies for generating energy from renewable sources such as solar power, wind power, and/or wave power on Port tidelands. Establish progressively more ambitious production goals for the years 2020, 2035, and 2050.
ME DEVELOP SMART GRID AND ENERGY DISTRICTS
Measures Co-Benefits Action
ME1 Develop Smart Grid and energy districts for Port operations and tenants.
CO-BENEFITS
Economyand Jobs
Energy Conservation/
Generation
Regional Plan Implementation
Transportation System
Improvement
Water Quality/Supply Improvement
Natural Habitat Protection or Restoration
Air Quality
Public Health Improvement
Resource Conservation
Adaptation Strategy Support
Land Use Plan
Implementation
MEASURES WITH COMPLETED ACTIONS* IN PROGRESS MEASURES FUTURE MEASURES*Additional actions may be implemented

September 2014Fact Sheet 6 of 6
MISCELLANEOUS (MISC) FACT SHEET
These measures range from practical and easy to implement and low-cost GHG initiatives, such as increasing public awareness and developing a Green Business Certification Program, to high investment measures that leverage emerging technology, such as smart grid networks and carbon capture and injection.
climate action plan (CAP)
Annu
al G
HG E
mis
sion
s*(M
T CO
2e/y
r)
1,000,000
800,000
600,000
400,000
200,000
02020
PROJECTED2020
CAP GOAL
746,000
2020 GHG Emissions Reduction Goal
Related InitiativesOther Port initiatives related to Miscellaneous CAP actions.
PROJECTED VS. CAP GOAL
1. Green Team A cross-functional team of Port staff that is working to synergize sustainability efforts throughout the organization.
2. Integrated Planning The development of a comprehensive and holistic approach to planning that integrates a range of related processes and decision-making tools into a unified vision for the future; sustainability considerations will be included as important values and planning principles.
3. Major Maintenance/Capital Improvement Program The Port’s Major Maintenance and Capital Improvement Programs upgrade Port-owned infrastructure. Some
projects, such as equipment retrofits and installation of shore power, directly reduce environmental impacts on Port tidelands and adjacent communities.
4. LEED Existing Building certification The Port is pursing LEED certification for two Port-owned facilities in an effort to create more efficient and sustainable facilities.
5. West Coast Port’s Sustainability Guidelines (pilot phase) Developing technical tools to integrate sustainable concepts into planning, design and construction processes for Port-related engineering projects in partnership with nine other West Coast ports.
855,000 Of the total 2020 CAP reduction goal of 109,000 MT CO2e/yr,*
.03% or35 MT CO2e/yris estimated to come from Miscellaneous actions
TOTAL CAPREDUCTION
*Metric tons CO2 equivalents per year are estimates only, rounded to the nearest thousand, and subject to change.
GHG REDUCTION FROM MISC
99.07%OTHER
ACTIONS
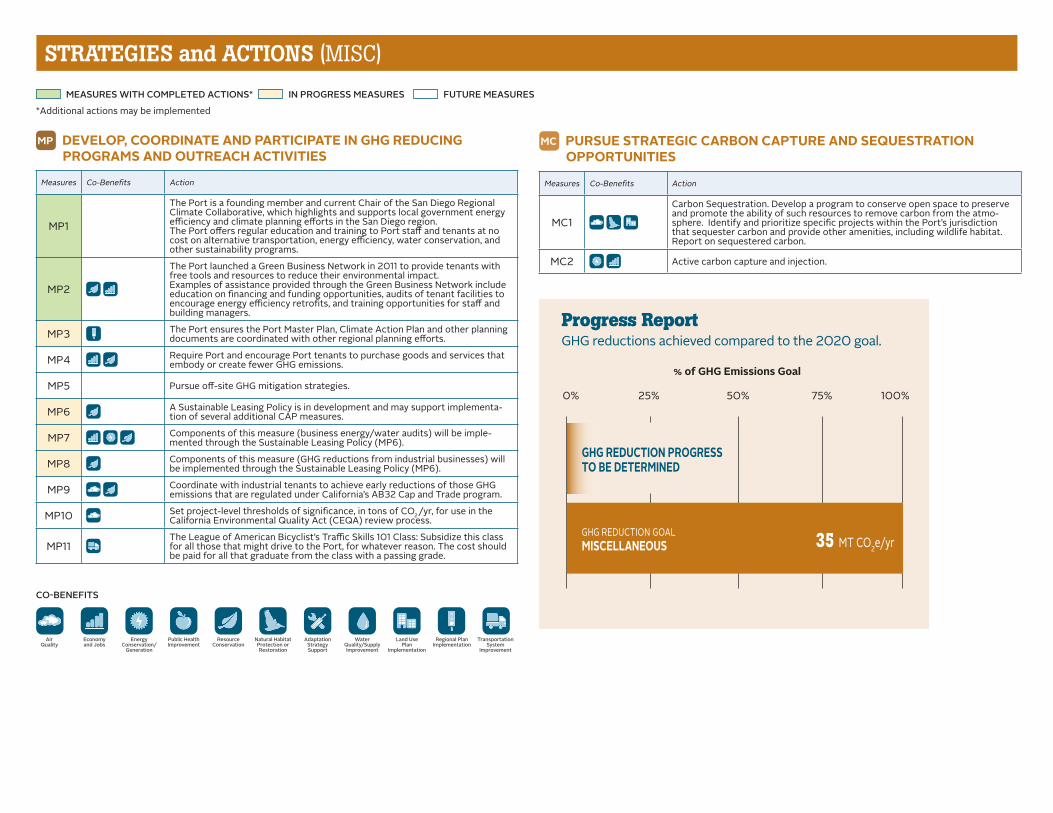
STRATEGIES and ACTIONS (MISC)
MP DEVELOP, COORDINATE AND PARTICIPATE IN GHG REDUCING PROGRAMS AND OUTREACH ACTIVITIES
Measures Co-Benefits Action
MP1
The Port is a founding member and current Chair of the San Diego Regional Climate Collaborative, which highlights and supports local government energy efficiency and climate planning efforts in the San Diego region.The Port offers regular education and training to Port staff and tenants at no cost on alternative transportation, energy efficiency, water conservation, and other sustainability programs.
MP2
The Port launched a Green Business Network in 2011 to provide tenants with free tools and resources to reduce their environmental impact. Examples of assistance provided through the Green Business Network include education on financing and funding opportunities, audits of tenant facilities to encourage energy efficiency retrofits, and training opportunities for staff and building managers.
MP3 The Port ensures the Port Master Plan, Climate Action Plan and other planning documents are coordinated with other regional planning efforts.
MP4 Require Port and encourage Port tenants to purchase goods and services that embody or create fewer GHG emissions.
MP5 Pursue off-site GHG mitigation strategies.
MP6 A Sustainable Leasing Policy is in development and may support implementa-tion of several additional CAP measures.
MP7 Components of this measure (business energy/water audits) will be imple-mented through the Sustainable Leasing Policy (MP6).
MP8 Components of this measure (GHG reductions from industrial businesses) will be implemented through the Sustainable Leasing Policy (MP6).
MP9 Coordinate with industrial tenants to achieve early reductions of those GHG emissions that are regulated under California’s AB32 Cap and Trade program.
MP10 Set project-level thresholds of significance, in tons of CO2/yr, for use in the California Environmental Quality Act (CEQA) review process.
MP11The League of American Bicyclist’s Traffic Skills 101 Class: Subsidize this class for all those that might drive to the Port, for whatever reason. The cost should be paid for all that graduate from the class with a passing grade.
MEASURES WITH COMPLETED ACTIONS* IN PROGRESS MEASURES FUTURE MEASURES*Additional actions may be implemented
CO-BENEFITS
Economyand Jobs
Energy Conservation/
Generation
Regional Plan Implementation
Transportation System
Improvement
Water Quality/Supply Improvement
Natural Habitat Protection or Restoration
Air Quality
Public Health Improvement
Resource Conservation
Adaptation Strategy Support
Land Use Plan
Implementation
Progress ReportGHG reductions achieved compared to the 2020 goal.
% of GHG Emissions Goal
0% 25% 50% 75% 100%
GHG REDUCTION PROGRESSTO BE DETERMINED
35 MT CO2e/yr GHG REDUCTION GOALMISCELLANEOUS
MC PURSUE STRATEGIC CARBON CAPTURE AND SEQUESTRATION OPPORTUNITIES
Measures Co-Benefits Action
MC1
Carbon Sequestration. Develop a program to conserve open space to preserve and promote the ability of such resources to remove carbon from the atmo-sphere. Identify and prioritize specific projects within the Port’s jurisdiction that sequester carbon and provide other amenities, including wildlife habitat. Report on sequestered carbon.
MC2 Active carbon capture and injection.