porosity–permeability relationships in miocene...
TRANSCRIPT

Porosity–permeability relationships in Miocene carbonateplatforms and slopes seaward of the Great Barrier Reef,Australia (ODP Leg 194, Marion Plateau)
STEPHEN N. EHRENBERG*, GREGOR P. EBERLI� and GREGOR BAECHLE�*Statoil, Stavanger, Norway (E-mail: [email protected])�Division of Marine Geology and Geophysics, University of Miami, 4600 Rickenbacker Causeway,Miami, FL 33149, USA
ABSTRACT
This paper reports a series of 700 porosity–permeability analyses and
supporting petrographic and sedimentologic descriptions from Early to Late
Miocene carbonate strata cored on the Marion Plateau, offshore from north-
eastern Australia, during Ocean Drilling Program (ODP) Leg 194. The samples
analysed are not only mainly coarse bioclastic limestones and dolomitized
equivalents from platform-top facies, but also include 79 plugs from deeper-
water slope to hemipelagic drift facies. Outstanding characteristics of this data
set are the wide ranges of porosity and permeability in both limestones and
dolostones, the large degree of short-range heterogeneity typical of these strata,
and the better porosity–permeability correlation of dolostones than limestones.
The platforms have experienced widely varying calcite cementation,
dolomitization and dissolution but show little clear evidence of meteoric
diagenesis, suggesting that subaerial exposure may have played little role in
porosity–permeability evolution. Permeability-for-given-porosity is controlled
by grain size and calcite cement content in grainstones and by occurrence of
larger shelter pores and vugs in mud-rich samples. Dolomitization tends to
reduce the variation of permeability-for-given-porosity by recrystallizing mud
matrix to form intercrystalline macroporosity that connects vugs and moulds
to become integrated with the effective pore system. As a result, there are no
differences in permeability–porosity trends for different dolostone textures,
whether dominated by intercrystalline, vuggy, or preserved intergranular pore
types. Two platform-top sites separated by only 5 km display a major lateral
variation in dolostone porosity–permeability characteristics within the
youngest dolostone units. This difference is interpreted as reflecting a
relatively ‘windward’ (current-facing) setting of the site with the overall
higher permeability-for-given-porosity (Site 1199) that led to less muddy
depositional facies, greater cementation, and lesser grain dissolution. Pore-
geometry parameters measured by petrographic image analysis confirm that
the ‘windward’ dolostones have pores that are both larger and less intricate
than dolostones comprising the more current-protected location.
Keywords Diagenesis, dolomite, Miocene, Ocean Drilling Program, porosity,reservoir quality, rhodalgal.
INTRODUCTION
Quantitative information about porosity and per-meability in subsurface sedimentary successions
is important for understanding the processes offluid displacement involved in both diagenesisand petroleum exploitation (Lucia, 1995; Moore,2001). For shallowly buried carbonate platform
Sedimentology (2006) 53, 1289–1318 doi: 10.1111/j.1365-3091.2006.00817.x
� 2006 The Authors. Journal compilation � 2006 International Association of Sedimentologists 1289
strata in particular, such information is necessaryfor constraining models of dolomitization and thesubsequent diagenetic evolution of reservoirproperties attending deeper burial. Availableporosity–permeability data sets for subsurfacecarbonate strata are in fact surprisingly rare. Dataare sometimes shown as plots (Saller & Vijaya,2002), but are rarely directly available for generaluse. This paper offers a description and inter-pretations for a large new data set where the basicdata have been posted for unrestricted use(Ehrenberg et al., 2003).
The results presented here are of interest as anexample of the earliest stages in the evolution ofpetrophysical properties of a coarse-grained bio-clastic carbonate platform in an open oceanicsetting. Numerous carbonate platforms of broadlysimilar type, but with widely variable componentfeatures, have been described in the Australasianregion previously (Betzler et al., 2000; Kusumast-uti et al., 2002). More complete reviews of thisliterature are given in Wilson (2002) and Ehren-berg et al. (2006a). Key reservoir characteristicsare extreme local heterogeneity and very highvalues of porosity and permeability and exten-sive, but widely variable amounts of both dolom-itization and dissolution. An important questionin regard to porosity–permeability trends in car-bonates is the role of dolomitization on theevolution of permeability (Lucia, 1995; Warren,2000; Ehrenberg et al., 2006b). The Marion plat-form carbonates are relevant for investigating thisquestion because they include both limestonesand dolostones of similar or overlapping originalcomposition. Comparisons within the large dataset generated by this study are interpreted inorder to develop a model for the effect of dolo-mitization on porosity and permeability in thistype of carbonate reservoir. The petrophysicalexpression of sequence architecture and the link-age of permeability variations to pore geometryare also examined.
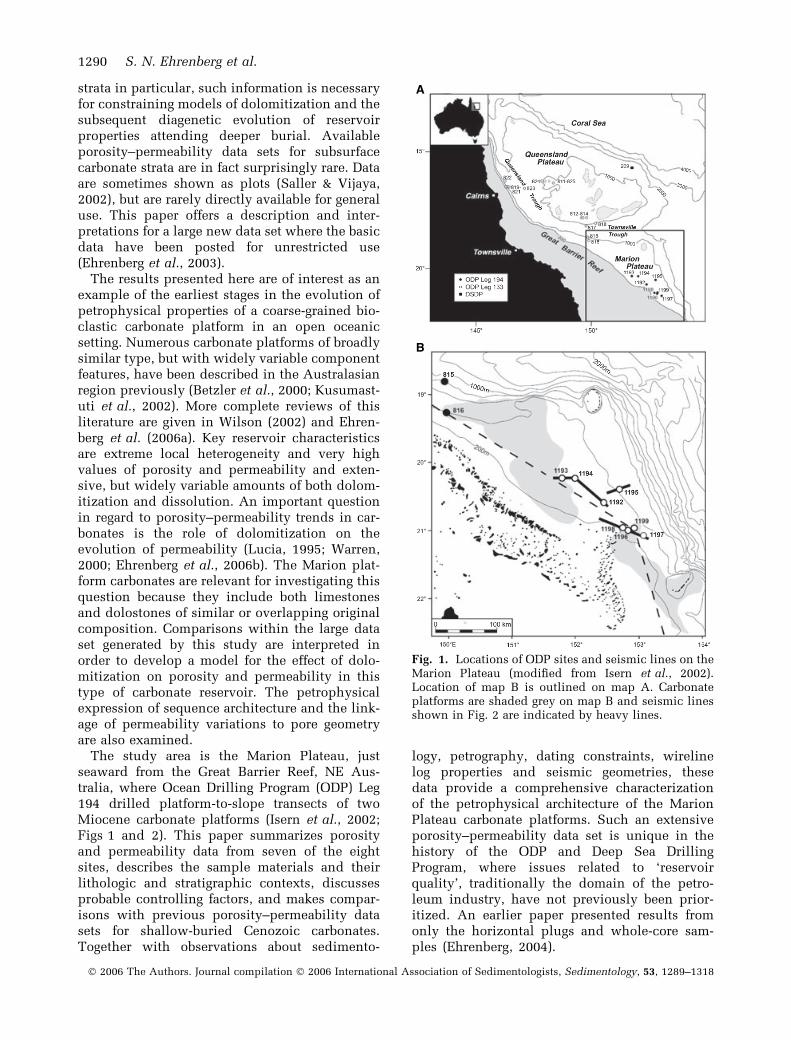
The study area is the Marion Plateau, justseaward from the Great Barrier Reef, NE Aus-tralia, where Ocean Drilling Program (ODP) Leg194 drilled platform-to-slope transects of twoMiocene carbonate platforms (Isern et al., 2002;Figs 1 and 2). This paper summarizes porosityand permeability data from seven of the eightsites, describes the sample materials and theirlithologic and stratigraphic contexts, discussesprobable controlling factors, and makes compar-isons with previous porosity–permeability datasets for shallow-buried Cenozoic carbonates.Together with observations about sedimento-
logy, petrography, dating constraints, wirelinelog properties and seismic geometries, thesedata provide a comprehensive characterizationof the petrophysical architecture of the MarionPlateau carbonate platforms. Such an extensiveporosity–permeability data set is unique in thehistory of the ODP and Deep Sea DrillingProgram, where issues related to ‘reservoirquality’, traditionally the domain of the petro-leum industry, have not previously been prior-itized. An earlier paper presented results fromonly the horizontal plugs and whole-core sam-ples (Ehrenberg, 2004).
A
B
Fig. 1. Locations of ODP sites and seismic lines on theMarion Plateau (modified from Isern et al., 2002).Location of map B is outlined on map A. Carbonateplatforms are shaded grey on map B and seismic linesshown in Fig. 2 are indicated by heavy lines.
1290 S. N. Ehrenberg et al.
� 2006 The Authors. Journal compilation � 2006 International Association of Sedimentologists, Sedimentology, 53, 1289–1318
ANALYTICAL TECHNIQUES
The samples studied are from Site 1193 in theNorthern Marion Platform (NMP), Sites 1196 and1199 in the Southern Marion Platform (SMP), andSites 1194, 1195, 1197 and 1198 from the slopesof these platforms (Fig. 2). The 700 samples forwhich both porosity and permeability were deter-mined include 406 horizontal 1-inch plugs, 271vertical 1-inch plugs and 23 whole-core samples.Grain density measurements were also obtainedfor the horizontal plugs and some vertical plugs.
Plug samples 1 inch in diameter and varyinglength (ca 1 inch) were drilled from the workinghalf of slabbed cores onboard the drilling shipJoides Resolution. Sampling was limited to inter-vals with sufficient recovery of core having acoherent state of preservation suitable for drillingof a plug sample. Efforts were made to collectboth horizontal and vertical plugs from nearbydepths in as many places as possible, but manyintervals were suitable for drilling only a singleplug sample. Photomicrographs showing1 · 1Æ5 cm areas of 139 horizontal plugs and 23whole-core samples are archived in Ehrenberget al. (2003).
Porosity and permeability of plug and whole-core samples from the platform-top sites wereanalysed at Reservoir Laboratories AS in Stav-anger and Trondheim. Seventy-nine samplesfrom slope and basin sites were measured atTerraTek, Salt Lake City Utah, using the samemethods as for the platform samples. Porosity wasmeasured by helium injection using a Boyle’s lawporosimeter, with bulk volume determined bycalliper. Permeability values reported are Klin-kenberg-corrected nitrogen permeabilities meas-ured with confining pressure of 20 bar. A fewpermeability values reported as >50 D have beenset equal to 50 D. All data are archived with fulldetails of analytical methods and representativephotomicrographs in Ehrenberg et al. (2003).Whole-rock bulk-carbonate analyses of oxygenand carbon isotopes were carried out using acommon acid bath interfaced to a Finnigan-MAT251 mass spectrometer. Data are reported relativeto Vienna Pee Dee Bee.
Each sample was assigned to one of threecarbonate mineralogic categories: (1) limestone,(2) dolostone or (3) partly dolomitized. Thisdifferentiation was based on consideration ofavailable information from core descriptions,
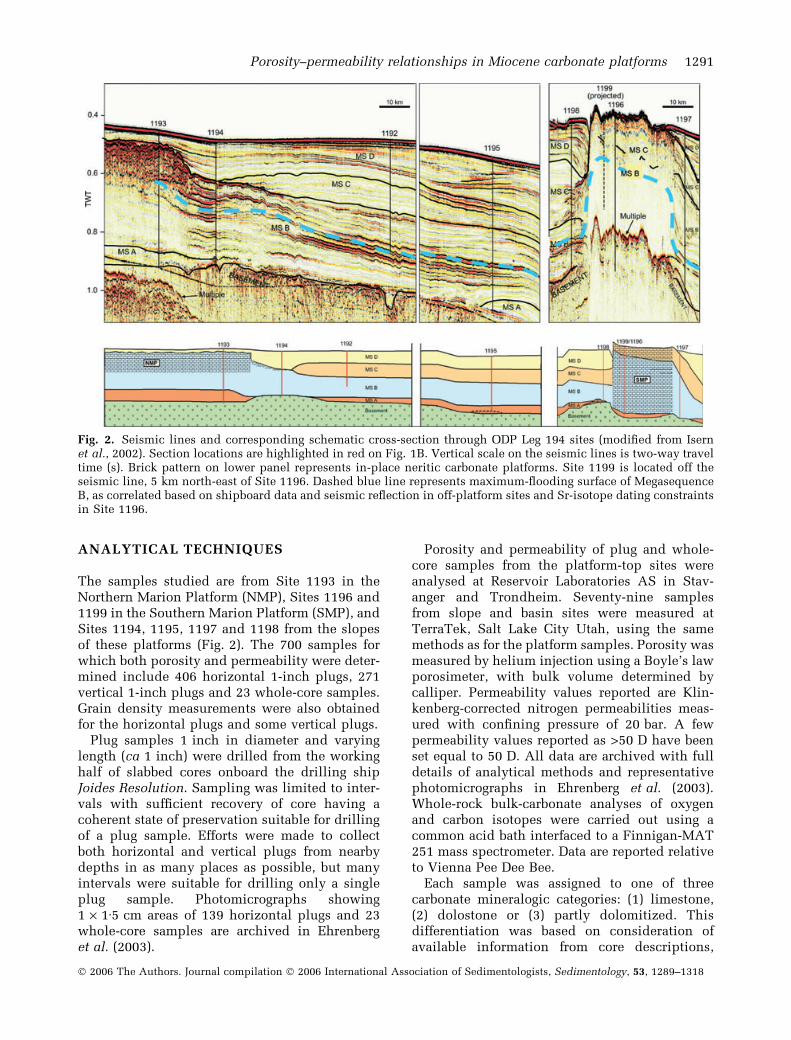
Fig. 2. Seismic lines and corresponding schematic cross-section through ODP Leg 194 sites (modified from Isernet al., 2002). Section locations are highlighted in red on Fig. 1B. Vertical scale on the seismic lines is two-way traveltime (s). Brick pattern on lower panel represents in-place neritic carbonate platforms. Site 1199 is located off theseismic line, 5 km north-east of Site 1196. Dashed blue line represents maximum-flooding surface of MegasequenceB, as correlated based on shipboard data and seismic reflection in off-platform sites and Sr-isotope dating constraintsin Site 1196.
Porosity–permeability relationships in Miocene carbonate platforms 1291
� 2006 The Authors. Journal compilation � 2006 International Association of Sedimentologists, Sedimentology, 53, 1289–1318
shipboard bulk X-ray diffraction (XRD) analyses,grain density values and thin-section observa-tions. Most samples are either limestone ordolostone (defined here as 80% or more calciteor dolomite, respectively). Thin sections werecut for 371 samples, including 141 horizontalplugs, 207 vertical plugs, and 23 whole-coresamples.
Digital image analysis was performed on imagesof whole thin sections (circular, 1-inch diameterplug area) recorded using a high-resolution flat-bed scanner. Pore areas were recognized by thecolour of blue-stained epoxy impregnation, andparameters were calculated as described byWeger et al. (2004).
GEOLOGICAL SETTING ANDSTRATIGRAPHY
The carbonate platforms of the Marion Plateauhave flat tops and steep, asymmetric slopessimilar to rimmed tropical platforms dominatedby coral reefs, green algae and ooids, such as inthe Bahamas. However, the biotic assemblages ofthe Marion platforms consist mainly of red algae,bryozoans, molluscs and benthic foraminiferawith corals and green algae being subordinate toabsent (Isern et al., 2002). Ooids have not beenobserved. These assemblages constitute a ‘for-amol’ or ‘rhodalgal’ association, suggestive ofeither cool (subtropical) water temperatures orparticular conditions such as elevated nutrientsupply or reduced light availability (Carannanteet al., 1988; Pomar et al., 2004; Wilson & Vecsei,2005). Rather than reefal facies, coarse bioclasticdebris forms the main substance and support forthe Marion platforms. A strong influence ofoceanic currents during platform growth isinferred from asymmetric slope geometries,sculptured drift deposits, the fragmental natureof the sediments, and current-swept phosphatichardgrounds (Glenn & Kronen, 1993; Isern et al.,2001). As discussed by Pomar et al. (2004), thetops of foramol and rhodalgal platforms are likelyto have been limited by a base level at consider-ably greater water depths (at wave- and storm-base; possibly 40–80 m) than the base level oftropical platforms.
The Marion Plateau strata are described here interms of two systems of nomenclature (Isernet al., 2002, 2004): (1) ‘megasequences’ definedfrom seismic images of the off-platform slope anddrift sediments (Fig. 2) and (2) ‘lithologic units’defined by shipboard core description. The mega-
sequences are designated A–D, from oldest toyoungest, whereas the lithologic units are num-bered in the opposite sense, top downwards,using Roman numerals, according to standardODP convention. The lithologic unit designationsare specific to each site, such that identical unitnumbers are not intended to indicate stratigraphiccorrelation of units between sites. An exceptionto this, however, is that the unit numbers docorrespond to correlative units in Sites 1196 and1199, due to their proximity (5 km). The nomen-clature and the boundaries of megasequences andlithologic units are illustrated in Fig. 3 for thethree platform sites studied.
The characteristics of the four megasequencesare summarized as follows. Dates given are fromEhrenberg et al. (2006a).
• Megasequence A is a relatively thin, silici-clastic-dominated interval deposited during theinitial marine transgression of the volcanic/vol-caniclastic basement. Sr-isotope dating of oystersin the basal transgressive beds gives ages of 28Æ6–32Æ0 Ma.
• Megasequence B makes up the bulk of theplatform strata penetrated by Leg 194 (Fig. 2). Itsduration was 12 Myr (23–11 Ma; Aquitanian-Serravallian). Ehrenberg et al. (2006a) proposedsubdivision of this interval into four componentsequences (Fig. 3). Megasequence B might becapped by karstic exposure surfaces in both NMPand SMP sites (Isern et al., 2002), but evidence forexposure is weak.
• Megasequence C corresponds with a hiatusoverlying the NMP and with Upper Unit I in theSMP. Megasequence C had a duration of roughly4 Myr (11–6Æ7 Ma; Tortonian-Messinian).
• Megasequence D consists of Plio-Pleistocenehemipelagic drift deposits that fill palaeotopo-graphy around the Miocene platforms.
Porosity and permeability analyses of the pre-sent data set are from Megasequences B and C.
Northern Marion Platform
The NMP was penetrated at Site 1193, where itcorresponds with an interval of platform-toplithofacies 194 m thick that is both overlain andunderlain by finer-grained strata. Core descrip-tion shows the section to be comprised of fivemain lithologic units:
• Units I and II comprise 35 m of unlithifiedhemipelagic ooze, dated as 5Æ6–0 Ma (Wei, 2004)and corresponding with Megasequence D.
1292 S. N. Ehrenberg et al.
� 2006 The Authors. Journal compilation � 2006 International Association of Sedimentologists, Sedimentology, 53, 1289–1318

• Unit III (the NMP) consists of 194 m of coarsebioclastic limestone and subordinate dolostone(dated as 16–11 Ma and corresponding with the
upper part of Megasequence B). Interpretation ofthe top of Unit III as a karst surface is based on theidentification of approximately contemporaneous,
III
IV
V
VI
A
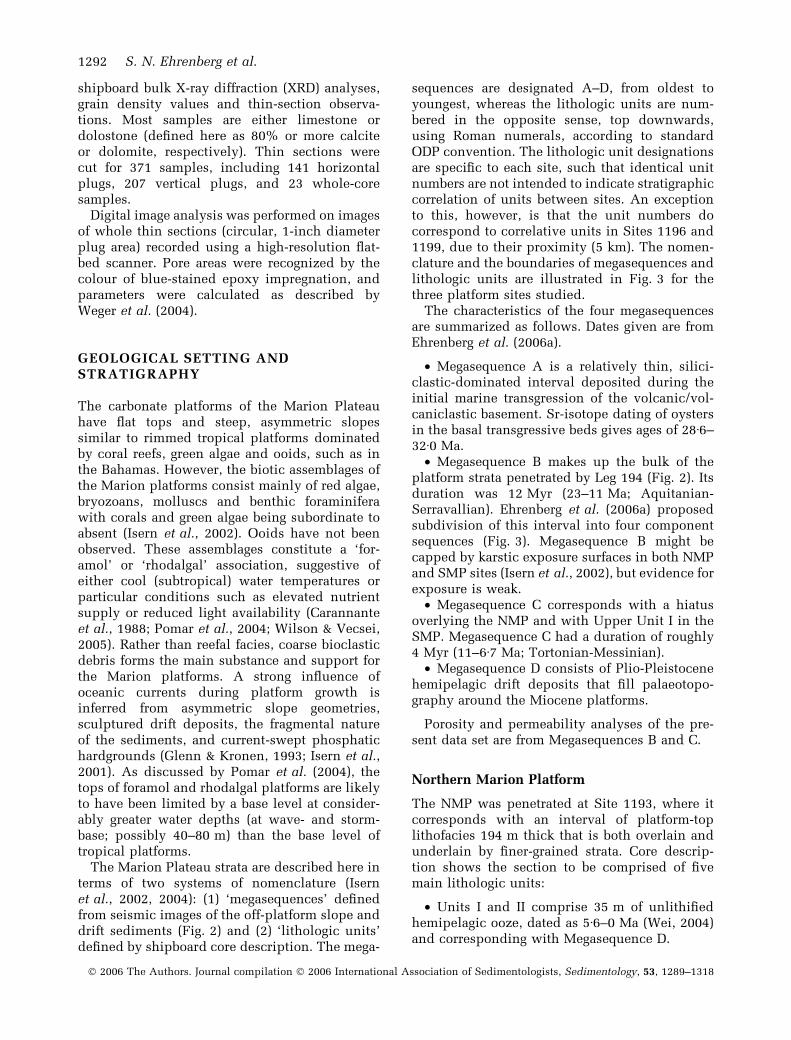
Fig. 3. Profiles of wireline log readings (available for Sites 1196 and 1199) and plug measurements in the Leg 194platform sites studied. Shipboard core descriptions (BLUE ¼ limestone; GREEN ¼ dolostone) and sequence strati-graphic interpretations are summarized at right of each diagram. Plotting symbols indicate mineralogy, except thatseveral partly dolomitized carbonates are plotted as limestone. Horizontal lines show boundaries of lithologic units(labelled in permeability track for Sites 1193 and 1196 and in porosity track for Site 1199). Sequence stratigraphy andcorrelations are discussed in Ehrenberg et al. (2006a).
Porosity–permeability relationships in Miocene carbonate platforms 1293
� 2006 The Authors. Journal compilation � 2006 International Association of Sedimentologists, Sedimentology, 53, 1289–1318
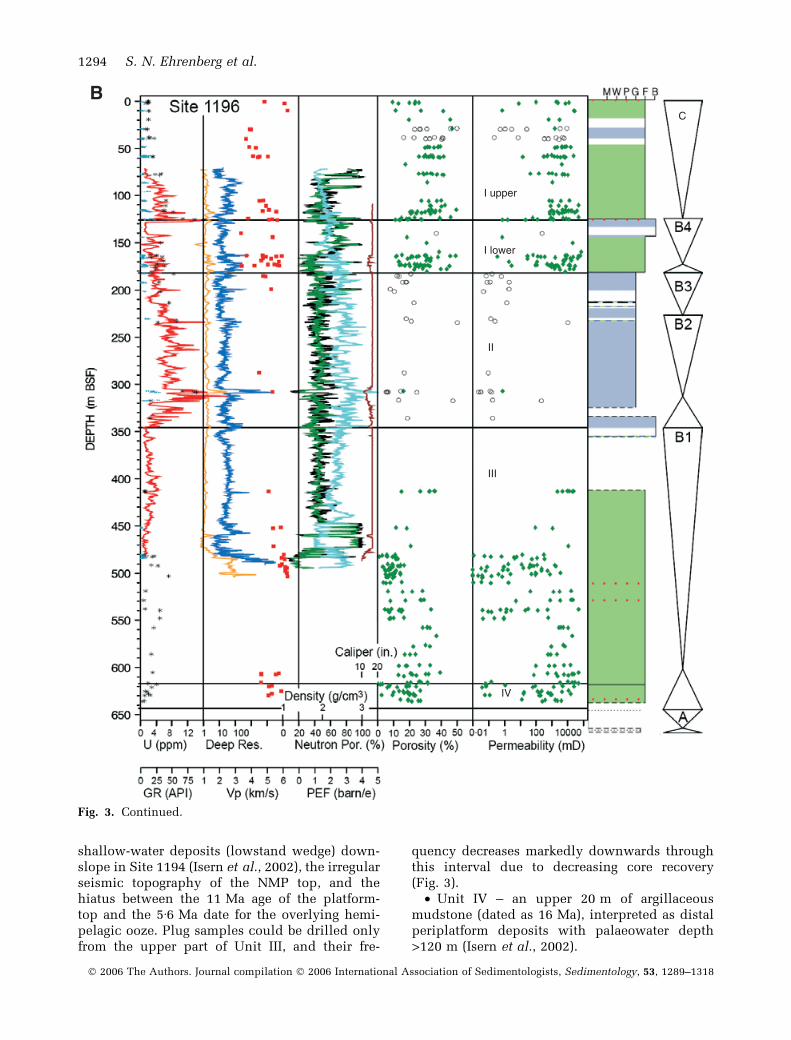
shallow-water deposits (lowstand wedge) down-slope in Site 1194 (Isern et al., 2002), the irregularseismic topography of the NMP top, and thehiatus between the 11 Ma age of the platform-top and the 5Æ6 Ma date for the overlying hemi-pelagic ooze. Plug samples could be drilled onlyfrom the upper part of Unit III, and their fre-
quency decreases markedly downwards throughthis interval due to decreasing core recovery(Fig. 3).
• Unit IV – an upper 20 m of argillaceousmudstone (dated as 16 Ma), interpreted as distalperiplatform deposits with palaeowater depth>120 m (Isern et al., 2002).
I upper
I lower
II
III
IV
C
B
Fig. 3. Continued.
1294 S. N. Ehrenberg et al.
� 2006 The Authors. Journal compilation � 2006 International Association of Sedimentologists, Sedimentology, 53, 1289–1318
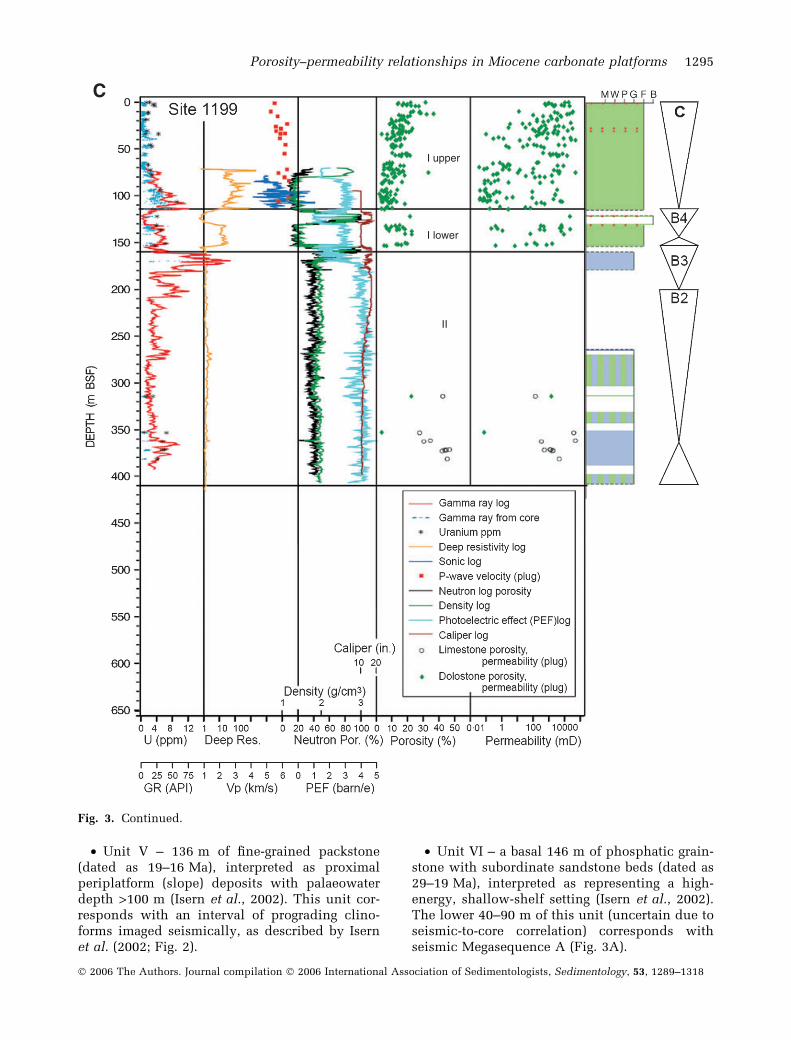
• Unit V – 136 m of fine-grained packstone(dated as 19–16 Ma), interpreted as proximalperiplatform (slope) deposits with palaeowaterdepth >100 m (Isern et al., 2002). This unit cor-responds with an interval of prograding clino-forms imaged seismically, as described by Isernet al. (2002; Fig. 2).
• Unit VI – a basal 146 m of phosphatic grain-stone with subordinate sandstone beds (dated as29–19 Ma), interpreted as representing a high-energy, shallow-shelf setting (Isern et al., 2002).The lower 40–90 m of this unit (uncertain due toseismic-to-core correlation) corresponds withseismic Megasequence A (Fig. 3A).
I uppe r
I lower
II
C
Fig. 3. Continued.
Porosity–permeability relationships in Miocene carbonate platforms 1295
� 2006 The Authors. Journal compilation � 2006 International Association of Sedimentologists, Sedimentology, 53, 1289–1318
Underlying the above succession, the deepest1193 cores [531–544 m below seafloor (mbsf)]recovered 5Æ6 m of dark red, highly altered basal-tic breccia, representing the top of acousticbasement.
In the NMP, Megasequence B displays a cleartransgressive/regressive pattern, beginning withshallow-water grainstones and subordinatesandstones (Unit VI), interpreted as representingearly transgression, followed by prograding plat-form-slope clinoforms (Unit V), siliciclastic-richmudstones (Unit IV), representing maximum-flooding, and finally aggrading platform-topdeposits (Unit III).
Southern Marion Platform
Stratigraphic correlations between the NMP andSMP based on available dating constraints (Eh-renberg et al., 2006a) are shown in Fig. 3. Basedon sedimentologic core description and wireline-log interpretation, the SMP section is divided intosix main units (Isern et al., 2002):
• Upper Unit I – 126–114 m (at Sites 1196 and1199, respectively) of coarse grainstone to float-stone having grainstone/packstone matrix. Mostof this interval is replaced by fabric-preservingdolomite, except for two limestone intervals atSite 1196: the capping bed (20–40 cm thick,immediately below the seafloor) and a zone atleast 12 m thick (possibly as thick as 28 m,however, due to uncertainty arising from coregaps; Fig. 3). No limestone is present in UpperUnit I of Site 1199. The biota is dominantly redalgae, including both branched fragments andlarge rhodoliths, and larger benthic foraminifera.Upper Unit I is interpreted as showing a shoaling-upwards trend, based on upward increase inrhodolith abundance and greater occurrence ofcoral and Halimeda in the upper 20 m. Sr-isotopedating of bioclasts suggests deposition of UpperUnit I beginning after 11 Ma and terminating at6Æ7 Ma (Ehrenberg et al., 2006a).
• Lower Unit I – 56–46 m (at Sites 1196 and1199, respectively) of coarse bioclastic carbonatedominated by red algae and larger foraminifera.The upper 18 m of this interval contains beds ofcoral-rich boundstone to floatstone that werepoorly recovered in coring. The lower subunit IDconsists of dolomitized coralline algal-foramini-feral grainstone to floatstone with variablerhodolith content. Like Upper Unit I, Lower UnitI is also interpreted as a single shoaling-upwardcycle based on upward increase in rhodoliths,
coral and Halimeda. A karst surface is inferredcapping Lower Unit I based on textures observedin core (red-brown silt filling dissolution vugs).Most of Lower Unit I is replaced by partiallyfabric-preserving dolomite, except the top 18 m ofthis interval that is preserved as limestone in hole1196A. Sr-isotope dating of bioclasts from thistop-8 m of limestone gives ages of 11Æ1–11Æ8 Ma(Ehrenberg et al., 2006a).
• Unit II – 164–250 m (at Sites 1196 and 1199,respectively) of mostly undolomitized, domi-nantly fine- to medium-grained grainstone rich inmiliolid to Lepidocyclinid foraminifers. This unitis interpreted as representing a sand-shoal settingwith water depths much shallower (<30 m andprobably mostly <10 m) than the overlying andunderlying units (mostly 60–120 m; Isern et al.,2002). Sr-isotope dating of bioclasts gives ages of15–19 Ma for Unit II.
• Unit III – 271 m of coarse dolostone withlittle preservation of primary texture. The coresfrom this interval commonly contain ghosts ofrhodoliths and moulds of large foraminifers andshells, indicating a coarse bioclastic facies similarto Unit I.
• Unit IV – at least 19 m (maximum 26 m;actual thickness uncertain because of core gap) ofstrongly layered dolostone variably rich in quartzand phosphatic grains.
• Unit V – The deepest 1196 cores (643–672 mbsf) recovered phosphatic sandstone andshale, the lower part of which yielded a LateChattian (24 Ma) nannofossil assemblage, butRupelian (31 Ma) Sr-isotope dates.
In the SMP, Megasequence B comprises the517 m of section from Lower Unit I through UnitIV. Available dating constraints show that SMPUnits IV and III (fabric-destructive dolostones) aretime-equivalent with the shallow-shelfal grain-stones of NMP Unit VI, whereas platform-interiorgrain shoals (SMP Unit II) are time-equivalentwith slope facies at the NMP (Units V and IV,together with the lower part of Unit III). Thedolomitized red-algal rudstone–floatstone (LowerUnit I of the SMP) is contemporaneous with thetop 140 m of the NMP. The NMP drownedafterwards while the SMP continued to grow(SMP Upper Unit I).
WIRELINE LOGS
Wireline logging of Site 1193 was not possiblebecause of bad hole conditions, but Sites 1196
1296 S. N. Ehrenberg et al.
� 2006 The Authors. Journal compilation � 2006 International Association of Sedimentologists, Sedimentology, 53, 1289–1318

and 1199 were logged over large parts of theirpenetrated depths (Fig. 3). Unique information onplatform petrophysics and lithology is providedby the log curves. At Site 1196, however, thecalliper log shows maximum reading (15 inches)over most of the logged interval (Fig. 3), indica-ting hole diameter larger than the tool capacity.The enlarged hole diameter decreases the accu-racy of log readings of the neutron, density andphotoelectric effect tools, which must be pressedagainst the side of the hole to function properly.The gamma ray (GR), resistivity and sonic read-ings are less sensitive to hole diameter and appearto have provided reliable readings.
Although both neutron and density porosityprofiles may be unreliable in Site 1196 because ofhole diameter, possible cavernous porosity isindicated at 450–470 m in 1196 by extremereadings. Caverns are also indicated at Site 1199at 120–130 and 155–161 mbsf. Deep resistivityreadings correlate with porosity-tool readings,indicating that the porosity values of <20% incertain intervals are low enough to greatlyincrease formation resistivity.
Photoelectric effect (PEF) clearly distinguisheslimestone versus dolostone in Site 1199 as cor-responding with readings around 4 and 3,respectively. PEF values in 1196 are mostly below3 and are highly variable. The variable characterin combination with the GR data could indicatedolomite–limestone alternations or alternativelycould reflect the large and varying diameter of aborehole filled with seawater (PEF value around0Æ4 barn/e).
Acoustic log readings of compressional velocityin Site 1196 (mostly 2–3 km sec)1) are systemat-ically lower than plug measurements (4–6 km sec)1) over the same interval (Fig. 3B). Thisdiscrepancy was reported in Isern et al. (2002),who noted that the accuracy of the log readings isconfirmed by the check shot data from the verticalseismic tool. They explained the discrepancy bycore recovery of systematically better-cemented(faster) intervals and exclusion of interbeddedlower-velocity rock that makes up the major partof the SMP section.
Spectral GR logging shows that the total GRreadings shown in Fig. 3 entirely reflect uraniumabundance (Delius et al., 2005). Certain trends inGR activity appear to correlate between Sites 1196and 1199, whereas other features, such as thehigh-U interval at the top of Unit II in Site 1199,are locally unique (Fig. 3). Variations in uraniumcontent of plug samples also roughly match thepattern of GR variation (Fig. 3). Higher U values
do not show consistent correlation with petro-graphic features or other chemical components inthe plug samples analysed, except that phos-phate-rich samples from both NMP and SMP topsare U-rich. Log data show that phosphate-richhardgrounds in Site 1194 are also U-rich (Isernet al., 2002). Phosphate mineralization duringextended submarine exposure is thus linked touranium concentration.
Other U-rich samples from SMP upper Unit Iand Unit II, however, are not P-rich, so otherfactors must explain the U enrichment in thesestrata. Based on the geochemical behaviour ofuranium, it can be speculated that local Uenrichment reflects trapping and temporary pre-servation of organic matter in the uppermostsediment layers due to poorly oxygenated depo-sitional conditions (Myers & Wignall, 1987).Uranium is more soluble under oxidizing condi-tions, but becomes fixed in sedimentary depositsunder reducing conditions, especially near con-centrations of organic matter (Hostetler & Garrels,1962; Langmuir, 1978). In the Miocene Malam-paya carbonate platform, offshore Philippines, Uenrichment coincides with transgressive intervals(Fournier et al., 2004). Thus, some of the U-richintervals from the SMP may also reflect organic-rich sedimentation during transgressions. Thisinterpretation seems to fit for the transgressiveportion of sequence B2 (lower 40–50 m of SMPUnit II), where a trend of upward-increasing Uappears to be correlative between Site 1196 and1199 (Fig. 3B and C). The U-maximum in eachcase is tentatively interpreted as defining themaximum-flooding surface of sequence B2. Simi-larly, the trend of downward-increasing U to-wards the base of SMP upper Unit I is correlativebetween Site 1196 and 1199 (Fig. 3B and C). TheU-maximum in this case is interpreted as defininga flooding surface corresponding with the initi-ation of Megasequence C, with the subsequenttrend of decreasing U reflecting regression (Isernet al., 2001).
Major U enrichment also occurs in the upperpart of SMP Unit II in Site 1199, where shallow-water deposition rather than transgression isinterpreted from facies characteristics. This Uanomaly is distinctly absent from the same inter-val in Site 1196 and therefore of only local extent.A possible explanation is that the 1199 U ano-maly may be associated with occurrences oforganic fragments and films noted during coredescriptions of the upper part of SMP Unit II andsuggested to represent remnants of sea grass(Isern et al., 2002).
Porosity–permeability relationships in Miocene carbonate platforms 1297
� 2006 The Authors. Journal compilation � 2006 International Association of Sedimentologists, Sedimentology, 53, 1289–1318
LITHOLOGY AND PETROGRAPHY
Platform samples
Most platform samples are >97% carbonate, but afew samples have 5–10% quartz, phosphate andglauconite grains. Mineralogic proportions esti-mated qualitatively from thin sections, but withreference to shipboard and University of MiamiXRD analyses show that most samples are dom-inantly either limestone or dolostone, with inter-mediate, partly dolomitized lithologies being rare(Ehrenberg, 2004).
LimestonesThe limestones contain four main pore types: (1)intergranular pores, (2) micropores within mudmatrix, (3) intrafossil pores and (4) larger vugs(sensu Lucia, 1995) formed by moulds of dis-solved bioclasts and shelter pores. Based on therelative abundances and sizes of these pore types,the samples were grouped in four textural categ-ories (Fig. 4). Limestones not represented by athin section (48 of the 138 platform limestone andintermediately dolomitized samples analysed forporosity) were assigned a texture based on exam-ination with a hand lens.
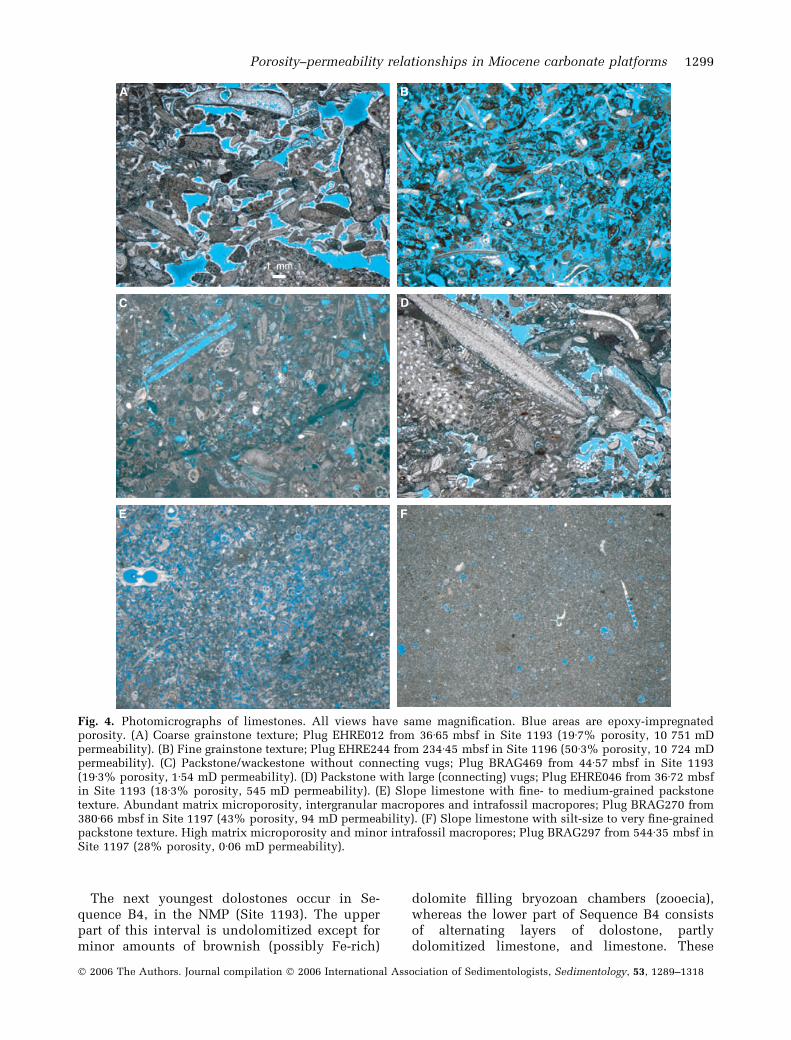
• Coarse grainstone: The pore system is dom-inated by large intergranular macropores incoarse-grained (>1 mm) grainstone to mud-poorpackstone and rudstone to floatstone (Fig. 4A).Also included are a subordinate number of sam-ples with similar depositional textures, but whereextensive cementation has filled most macroporesexcept for scattered mouldic or intrafossilmacropores.
• Fine grainstone: The pore system is domin-ated by small intergranular and intrafossil poresin fine-grained (<1 mm) grainstone to mud-poorpackstone (Fig. 4B). Again, however, exceptionsincluded in this group are samples with similardepositional textures, but where extensivecementation has filled most macropores exceptfor scattered mouldic or intrafossil macropores.Most samples in this group are from SMP Unit II.
• Packstone/wackestone: The pore system isdominated by micropores within mud matrix andunconnected intrafossil and mouldic vugs(Fig. 4C). The samples in this group are all fromthe NMP and are coarse- to very coarse-grained(average grain size 0Æ5–3 mm).
• Packstone with large vugs: The pore system isdominated by vugs that are larger than bioclastspresent and that may be interconnected to dom-
inate fluid flow (Fig. 4D). Micropores within mudmatrix and intrafossil vugs are generally alsopresent. The samples in this group are all fromthe NMP and are coarse- to very coarse-grained.
DolostonesMarion platform dolostones contain three mainpore types: (1) relict intergranular and intrafossilpores, (2) intercrystalline pores and (3) vugs(mainly bioclast moulds). The proportions ofthese pore types vary widely from sample tosample, as illustrated in Fig. 5. Accordingly,dolostone thin sections were grouped into fourtextural categories based on qualitative petro-graphic estimation of the dominant pore types.Dolostones not represented by a thin section (264of the 502 platform dolostone samples analysedfor porosity) were not classified.
• Intergranular-dominated: These sampleshave preserved their original grainstone/pack-stone textures (Fig. 5A). The dominant pore typeis intergranular porosity inherited from the pre-cursor limestone.
• Intercrystalline-dominated: The pore systemis dominated by intercrystalline pores. This groupincludes both fabric-preserving textures (Fig. 5C)and fabric-destructive textures (Fig. 5D) in whichvugs comprise a minor portion of the visibleporosity.
• Vug-dominated: The pore system is a mixtureof vugs and enclosing intercrystalline pores, butvugs comprise the major portion of the visibleporosity. This group also includes both fabric-preserving textures (Fig. 5E) and fabric-destruc-tive textures (Fig. 5F).
• Rhodolith-dominated: The area representedin the thin section is dominated by a rhodolith,such that values of porosity and permeabilitymeasured on the plug mostly reflect the preservedfabric of the rhodolith (Fig. 5B).
The dolostone fabrics show distinct relation-ships to platform locations and stratigraphy. Thestratigraphically oldest dolostones occur in Se-quence B1, which has only been sampled at Site1196 (SMP Units IV and III; Fig. 5F). Thesedolostones all have coarsely crystalline fabricdestructive textures, with both intercrystalline-dominated and vug-dominated pore systems (171poro-perm analyses). Somewhat younger are thepoorly recovered dolostone to partly dolomitizedlimestone intervals from the lower part of SMPUnit II. However, only three dolostone plugs wereanalysed from this interval.
1298 S. N. Ehrenberg et al.
� 2006 The Authors. Journal compilation � 2006 International Association of Sedimentologists, Sedimentology, 53, 1289–1318
The next youngest dolostones occur in Se-quence B4, in the NMP (Site 1193). The upperpart of this interval is undolomitized except forminor amounts of brownish (possibly Fe-rich)
dolomite filling bryozoan chambers (zooecia),whereas the lower part of Sequence B4 consistsof alternating layers of dolostone, partlydolomitized limestone, and limestone. These
D C
E F
A B
Fig. 4. Photomicrographs of limestones. All views have same magnification. Blue areas are epoxy-impregnatedporosity. (A) Coarse grainstone texture; Plug EHRE012 from 36Æ65 mbsf in Site 1193 (19Æ7% porosity, 10 751 mDpermeability). (B) Fine grainstone texture; Plug EHRE244 from 234Æ45 mbsf in Site 1196 (50Æ3% porosity, 10 724 mDpermeability). (C) Packstone/wackestone without connecting vugs; Plug BRAG469 from 44Æ57 mbsf in Site 1193(19Æ3% porosity, 1Æ54 mD permeability). (D) Packstone with large (connecting) vugs; Plug EHRE046 from 36Æ72 mbsfin Site 1193 (18Æ3% porosity, 545 mD permeability). (E) Slope limestone with fine- to medium-grained packstonetexture. Abundant matrix microporosity, intergranular macropores and intrafossil macropores; Plug BRAG270 from380Æ66 mbsf in Site 1197 (43% porosity, 94 mD permeability). (F) Slope limestone with silt-size to very fine-grainedpackstone texture. High matrix microporosity and minor intrafossil macropores; Plug BRAG297 from 544Æ35 mbsf inSite 1197 (28% porosity, 0Æ06 mD permeability).
Porosity–permeability relationships in Miocene carbonate platforms 1299
� 2006 The Authors. Journal compilation � 2006 International Association of Sedimentologists, Sedimentology, 53, 1289–1318

D
E F
A B
C
Fig. 5. Photomicrographs of dolostones. All views have same magnification. Blue areas are epoxy-impregnatedporosity. (A) Relict intergranular texture in a mimetically fabric-preserving dolostone; Plug BRAG638 from26Æ14 mbsf in Site 1199 (17Æ1% porosity, 2550 mD permeability). (B) Rhodolith-dominated texture. Plug BRAG605from 2Æ17 mbsf in Site 1196 (13Æ3% porosity, 8Æ1 mD permeability). (C) Intercrystalline-dominated texture in a fabric-preserving dolostone with wide variation in crystal size. Plug BRAG546 from 174Æ00 mbsf in Site 1196 (29Æ3%porosity, 2423 mD permeability). (D) Intercrystalline-dominated texture in a finely crystalline, fabric-destructivedolostone. Plug EHRE041 from 129Æ03 mbsf in Site 1193 (38Æ3% porosity, 18 385 mD permeability). Althoughmoulds are a major component of the visible pore space, intercrystalline pores appear volumetrically equal todominant. (E) Vug-dominated texture in a finely crystalline, fabric-preserving dolostone. Plug BRAG537 from144Æ13 mbsf in Site 1196 (18Æ6% porosity, 0Æ72 mD permeability). (F) Vug-dominated texture in a coarsely crystalline,fabric-destructive dolostone; Plug BRAG568 from 491Æ87 mbsf in Site 1196 (14Æ7% porosity, 54 mD permeability).
1300 S. N. Ehrenberg et al.
� 2006 The Authors. Journal compilation � 2006 International Association of Sedimentologists, Sedimentology, 53, 1289–1318

dolostones have relatively finely crystalline, fab-ric-destructive textures (Fig. 5D) and coloursranging from tan to brick red (12 plugs analysed).In the SMP, Sequence B4 (Lower Unit I) isentirely dolomitized except for its poorly recov-ered uppermost beds (Subunit IC; only threeplugs analysed). The underlying SMP SubunitID was much better recovered (71 poro-permanalyses from Sites 1196 and 1199) and consistsof partly fabric-preserving dolostones with relicttextures ranging from floatstone to packstone(Fig. 5E). Pore systems of these samples aredominated by intercrystalline to vuggy pores.
The stratigraphically youngest dolostones inMegasequence C (SMP Upper Unit I) were coredin both Sites 1196 and 1199 (275 poro-permanalyses). These dolostones have better preserva-tion of depositional textures than in the under-lying SMP lower Unit I. Coarse grainstones torudstones within the upper 35 m of upper Unit Icommonly have mimetic fabric preservation byvery finely crystalline dolomite replacing bio-clasts, combined with coarser dolomite thatreplace and overgrows isopachous cement(Fig. 5A). These mimetic dolostones are interbed-ded with partly fabric-preserving dolostones inwhich intergranular volumes are partly filled bycoarser limpid dolomite, possibly replacing de-positional matrix in somewhat muddier pack-stone to floatstone facies (Fig. 5C). Upper andlower Unit I have similar depositional textures,except for greater abundances of large rhodolithsin the former and the presence of poorly recov-ered coral-rich floatstones in the upper 18 m oflower Unit I.
Slope and drift samples
The slope and hemipelagic drift strata (Sites1193, 1194, 1195, 1197, 1198) consist of un-dolomitized silt-size to medium-grained pack-stones with widely varying mud content andless common fine- to medium-grained grain-stones. Thin sections have been made only fromthe plugs analysed from Sites 1194 and 1197,but shipboard core descriptions and macro-scopic examination of the plugs indicate thatlithologies of the 1193, 1195 and 1198 slopesamples are similar. The thin sections from the1194 and 1197 plugs show textures varyingfrom mud-lean with abundant intergranularporosity (Fig. 4E) to mud-rich with pore systemsdominated by matrix microporosity (Fig. 4F).Mouldic and intrafossil pores are common toabundant.
DIAGENESIS
Observations
XRD analyses show that samples from bothplatforms consist entirely of low-magnesium cal-cite and dolomite, indicating stabilization fromoriginal sediments that probably contained abun-dant aragonite and high-magnesium calcite(James et al., 2005). The other main evidence ofdiagenesis is the effect of micritization, calcitecementation, dissolution and dolomitizationobserved in thin section.
Micritization along bioclast margins is gener-ally minor in coarser-grained facies, but isintense in some of the fine-grained grainstonesof SMP Unit II. Micritization of bioclasts isbelieved to occur through microboring by photo-synthetic algae and bacteria (Reid & MacIntyre,2000). Therefore, the minor degree of micrit-ization characteristic of the coarse-grained plat-form facies may reflect rapid accumulation inwater depths having limited light penetration,as proposed for foramol and rhodalgal carbo-nates by Wilson & Vecsei (2005). Greatermicritization of the fine-grained grainstonescomposing SMP Unit II may reflect the rela-tively shallow, current-reworked setting of thesefacies.
Calcite cementation occurred in three succes-sive stages. The earliest calcite cement consists ofisopachous coatings of very finely crystalline,inclusion-rich cement lining surfaces of theoriginal intergranular pore system. These earliestcoatings are commonly very thin to absent, andare followed by thicker isopachous coatings ofclear (inclusion-poor), calcite crystals havingtypical ‘dogtooth’ (prismatic to acicular) mor-phology with long axes perpendicular to palaeo-pore walls. Less commonly this same cementzone has finely crystalline, equant morphology.The last step in the cement sequence is a sharptransition from dogtooth crystal terminations tolarger blocky calcite crystals that partly to com-pletely filled the remaining pore spaces. Despitethis sharp change in crystal morphology, cathodo-luminescence observations show that chemicalzone growth was continuous, without any appar-ent break in composition coincident with thechange in crystal morphology. Mud matrix hasbeen extensively cemented and recrystallized tomicrospar. Petrographic relationships are notdiagnostic regarding the timing of mud cementa-tion with respect to the above intergranularcement sequence.
Porosity–permeability relationships in Miocene carbonate platforms 1301
� 2006 The Authors. Journal compilation � 2006 International Association of Sedimentologists, Sedimentology, 53, 1289–1318
In the platform limestones, selective dissolu-tion of aragonite bioclasts appears to postdate theearliest fibrous calcite cement, but moulds arecommonly lined with dogtooth cement coatingsthat are thinner than the outward-growing dog-tooth cement surrounding the outer surface of thesame moulds. Moulds predate (are filled by) thecoarser, blocky calcite spar. Dolomite in differentstratigraphic units varies from fine-mimetic tocoarse fabric-destructive in style. Petrographicrelationships are not diagnostic regarding thetiming of dolomite with respect to calcite cemen-tation and dissolution because most samples areeither pure dolostone or limestone. The fewpartly dolomitized samples examined consist ofscattered dolomite rhombs together with partlyreplaced calcite bioclasts and matrix, where theonly calcite cement present consists of syntaxialovergrowths on echinoderm fragments.
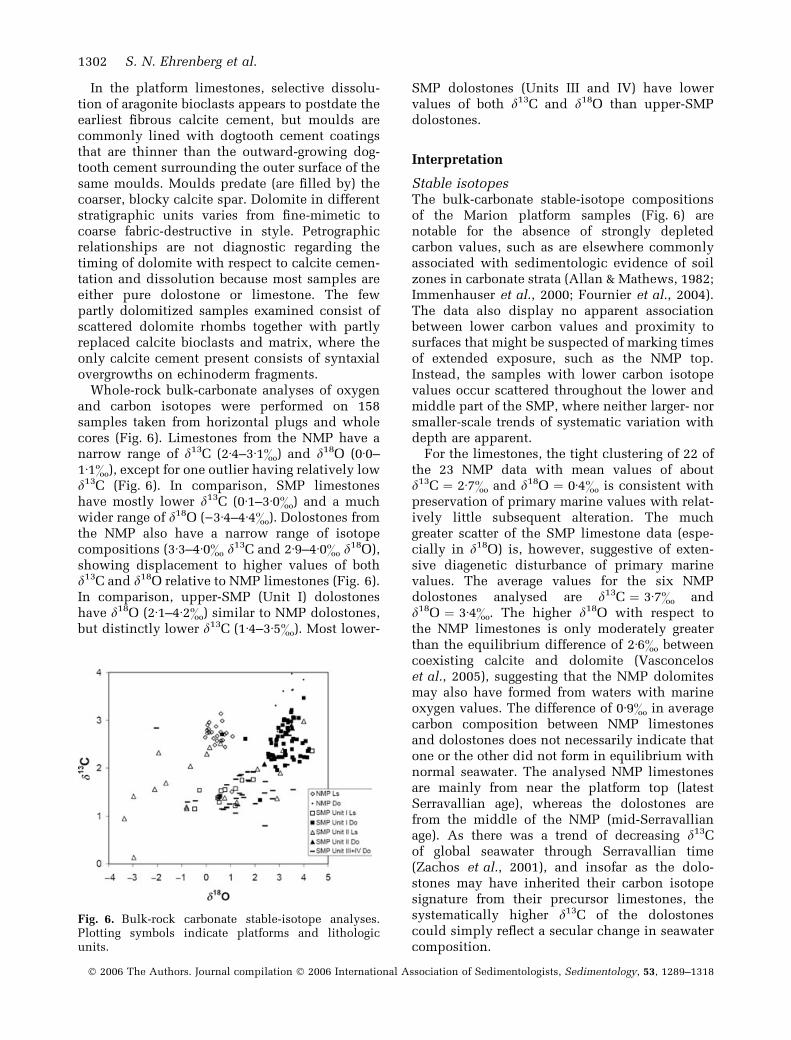
Whole-rock bulk-carbonate analyses of oxygenand carbon isotopes were performed on 158samples taken from horizontal plugs and wholecores (Fig. 6). Limestones from the NMP have anarrow range of d13C (2Æ4–3Æ1&) and d18O (0Æ0–1Æ1&), except for one outlier having relatively lowd13C (Fig. 6). In comparison, SMP limestoneshave mostly lower d13C (0Æ1–3Æ0&) and a muchwider range of d18O ()3Æ4–4Æ4&). Dolostones fromthe NMP also have a narrow range of isotopecompositions (3Æ3–4Æ0& d13C and 2Æ9–4Æ0& d18O),showing displacement to higher values of bothd13C and d18O relative to NMP limestones (Fig. 6).In comparison, upper-SMP (Unit I) dolostoneshave d18O (2Æ1–4Æ2&) similar to NMP dolostones,but distinctly lower d13C (1Æ4–3Æ5&). Most lower-
SMP dolostones (Units III and IV) have lowervalues of both d13C and d18O than upper-SMPdolostones.
Interpretation
Stable isotopesThe bulk-carbonate stable-isotope compositionsof the Marion platform samples (Fig. 6) arenotable for the absence of strongly depletedcarbon values, such as are elsewhere commonlyassociated with sedimentologic evidence of soilzones in carbonate strata (Allan & Mathews, 1982;Immenhauser et al., 2000; Fournier et al., 2004).The data also display no apparent associationbetween lower carbon values and proximity tosurfaces that might be suspected of marking timesof extended exposure, such as the NMP top.Instead, the samples with lower carbon isotopevalues occur scattered throughout the lower andmiddle part of the SMP, where neither larger- norsmaller-scale trends of systematic variation withdepth are apparent.
For the limestones, the tight clustering of 22 ofthe 23 NMP data with mean values of aboutd13C ¼ 2Æ7& and d18O ¼ 0Æ4& is consistent withpreservation of primary marine values with relat-ively little subsequent alteration. The muchgreater scatter of the SMP limestone data (espe-cially in d18O) is, however, suggestive of exten-sive diagenetic disturbance of primary marinevalues. The average values for the six NMPdolostones analysed are d13C ¼ 3Æ7& andd18O ¼ 3Æ4&. The higher d18O with respect tothe NMP limestones is only moderately greaterthan the equilibrium difference of 2Æ6& betweencoexisting calcite and dolomite (Vasconceloset al., 2005), suggesting that the NMP dolomitesmay also have formed from waters with marineoxygen values. The difference of 0Æ9& in averagecarbon composition between NMP limestonesand dolostones does not necessarily indicate thatone or the other did not form in equilibrium withnormal seawater. The analysed NMP limestonesare mainly from near the platform top (latestSerravallian age), whereas the dolostones arefrom the middle of the NMP (mid-Serravallianage). As there was a trend of decreasing d13Cof global seawater through Serravallian time(Zachos et al., 2001), and insofar as the dolo-stones may have inherited their carbon isotopesignature from their precursor limestones, thesystematically higher d13C of the dolostonescould simply reflect a secular change in seawatercomposition.
Fig. 6. Bulk-rock carbonate stable-isotope analyses.Plotting symbols indicate platforms and lithologicunits.
1302 S. N. Ehrenberg et al.
� 2006 The Authors. Journal compilation � 2006 International Association of Sedimentologists, Sedimentology, 53, 1289–1318

Dolostones from SMP Unit I have a range ind18O similar to the NMP dolostones and cantherefore be interpreted as also having formed bylow-temperature crystallization from normal sea-water. The more scattered and lower values ofd18O determined for the lower-SMP dolostones(Units III and IV) are suggestive of greater dia-genetic alteration at elevated temperatures, as isconsistent with the relatively coarsely crystalline,fabric-destructive textures of these more deeplyburied rocks.
Involvement of meteoric waterThe original sediments of the Marion platformsprobably contained major proportions of aragon-ite and high-magnesium calcite. Stabilization tothe present assemblages of low-magnesium cal-cite and dolomite could have been facilitated bybacterial degradation of sedimentary organic mat-ter under marine phreatic conditions (Jameset al., 2005). Subaerial exposure could well haveassisted this process, but is not required.
The three calcite-cement stages observed inMarion platform carbonates are similar to cementsequences that have been described in carbonatesof many different ages and settings (Moore, 2001;Ehrenberg et al., 2002). The earliest stage of veryfinely crystalline, inclusion-rich, isopachous ce-ment is interpreted as having formed by recrys-tallization of fibrous marine cement (James &Choquette, 1983). The following stage of clear(inclusion-poor) dogtooth isopachous calcite re-flects phreatic cementation during earliest burial.The morphologic transition to the final stage ofcoarser, blocky calcite spar could result from adecreased rate of cement growth rather thancoincidence with any fundamental change inwater chemistry or a hiatus in growth. In otherstudies, similar dogtooth to blocky cements havebeen interpreted as being of both marine andmeteoric origin (Melim et al., 2001, 2002), andthese morphologies are therefore not diagnosticregarding the chemistry or origin of the precipi-tating waters.
Bioclast dissolution is similarly undiagnostic ofmarine versus meteoric diagenetic conditions(Brachert & Dullo, 2000; Melim et al., 2001). Ingeneral, however, two stages of bioclast dissolu-tion are inferred to have occurred, the firstaffecting only aragonite bioclasts during earlylimestone diagenesis and the second occurringduring or after partial dolomitization. The latterstage is suggested based on qualitative compar-ison between the abundances and types ofmouldic pores in limestones and dolostones.
Most moulds in limestones consist of partlydissolved bifoliate bryozoans or have shapesindicative of shell fragments, coral, or Halimeda(Fig. 4A, C and D). Although common, suchmoulds appear to be much less abundant thanthe mouldic pores in many dolostones (Fig. 5D–F), which commonly appear to represent bioclaststhat rarely show signs of dissolution in associatedlimestones, specifically large benthic foraminifera,echinoderms and red algae. These textures,together with the paucity of intermediately dolo-mitized compositions, are interpreted as reflect-ing widespread dissolution of remaining calciteduring or after partial dolomitization. Anotherindication of dolomite-related dissolution is thecharacteristic texture of sucrosic dolomite, whichhas been suggested to form by growth of uni-formly spaced euhedral dolomite accompanied orfollowed by dissolution of non-replaced calcite(Murray, 1960; Dawans & Swart, 1988; Swart &Melim, 2000).
Dolomitization of the Marion platforms isinterpreted as having occurred through circula-tion of normal to slightly modified seawater,based on the non-evaporitic, oceanic setting ofthe Marion platforms and the limited range ofdolostone stable-isotope compositions.
The petrographic observations from both NMPand SMP cores are consistent with either com-bined marine and meteoric phreatic diagenesis orpurely marine diagenesis (Melim et al., 2001). Inother words, none of the textures compellinglyindicate the involvement of meteoric water orsubaerial exposure. In particular, no evidence hasbeen found of soil-related textures, such as des-cribed by Fournier et al. (2004). Contrasting lowCL intensity in calcite cements and dolomite ofthe SMP versus overall bright CL intensities inNMP carbonates was noted by Ehrenberg &Dickson (2003) and Ehrenberg (2004), but this isbelieved to reflect greater influx of terrestrial-derived fines to the NMP depositional setting,rather than any difference concerning meteoricdiagenesis. Kindler et al. (2006) have also re-ported finding no evidence for subaerial exposureof the SMP top.
The apparent absence of petrographic andisotopic evidence for meteoric diagenesis of theMarion platforms is surprising in view of theextended span of platform growth during a timeof high-amplitude sea-level changes, combinedwith the interpretation of a lowstand wedgeadjacent to the NMP, as represented by stratacored in Site 1194 (Isern et al., 2001, 2002). Apossible explanation is that NMP and SMP
Porosity–permeability relationships in Miocene carbonate platforms 1303
� 2006 The Authors. Journal compilation � 2006 International Association of Sedimentologists, Sedimentology, 53, 1289–1318
exposure involved mainly dissolution. Cander(1995) interpreted a possibly similar situation inEocene limestones from central Florida, wherematrix stabilization during extended subaerialexposure involved very low efficiency of water–rock interaction, resulting in retention ofseawater-like stable-isotope values. Absence ofnegative excursions in stable-isotope valuesdespite the inferred presence of subaerial expo-sure surfaces has also been noted in othercarbonate successions (Melim, 1996; Ehrenberget al., 2002).
Nevertheless, other Miocene Australasianplatforms contain strong sedimentologic andstable-isotopic evidence of diagenesis caused byrepeated subaerial exposure (Epting, 1980;Grange & Davies, 1985; Dolan & Hermany, 1988;Mayall & Cox, 1988; Jordan & Abdullah, 1992;Moldovanyi et al., 1995; Park et al., 1995; Mayallet al., 1997; Wilson & Evans, 2002; Fournier et al.,2004; Heubeck et al., 2004; Vahrenkamp et al.,2004). As in the Oligocene platforms studied bySaller et al. (1993) and Saller & Vijaya (2002), thesimplest and most plausible explanation forthe absence of evidence for subaerial exposurein the Marion platforms may be that the platformsdid not experience significant exposure. Non-exposure could reflect water depths on the orderof 50–100 m during platform growth (Pomaret al., 2004; Wilson & Vecsei, 2005), such thatsea-level falls did not touch down. This explanationshould not apply, however, to the shallow-waterfacies composing SMP Unit II, where negatived18O values (Fig. 6) may reflect cementationinvolving meteoric waters.
POROSITY AND PERMEABILITY
Comparisons by site, unit and lithology
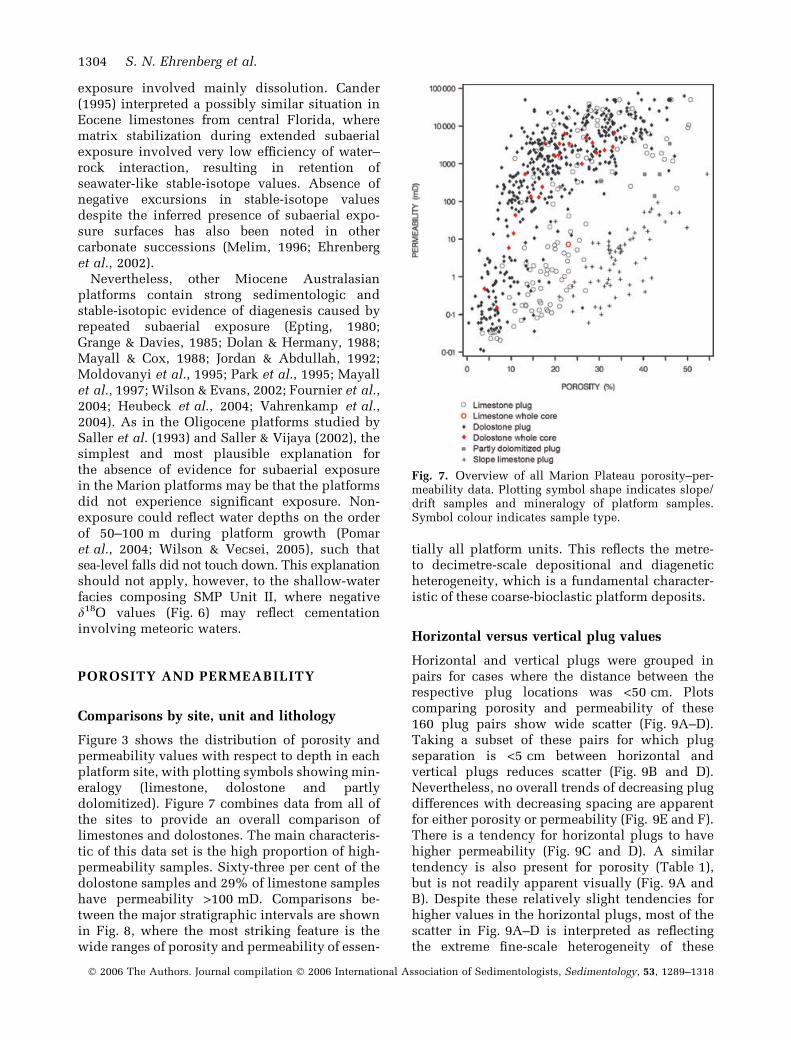
Figure 3 shows the distribution of porosity andpermeability values with respect to depth in eachplatform site, with plotting symbols showing min-eralogy (limestone, dolostone and partlydolomitized). Figure 7 combines data from all ofthe sites to provide an overall comparison oflimestones and dolostones. The main characteris-tic of this data set is the high proportion of high-permeability samples. Sixty-three per cent of thedolostone samples and 29% of limestone sampleshave permeability >100 mD. Comparisons be-tween the major stratigraphic intervals are shownin Fig. 8, where the most striking feature is thewide ranges of porosity and permeability of essen-
tially all platform units. This reflects the metre-to decimetre-scale depositional and diageneticheterogeneity, which is a fundamental character-istic of these coarse-bioclastic platform deposits.
Horizontal versus vertical plug values
Horizontal and vertical plugs were grouped inpairs for cases where the distance between therespective plug locations was <50 cm. Plotscomparing porosity and permeability of these160 plug pairs show wide scatter (Fig. 9A–D).Taking a subset of these pairs for which plugseparation is <5 cm between horizontal andvertical plugs reduces scatter (Fig. 9B and D).Nevertheless, no overall trends of decreasing plugdifferences with decreasing spacing are apparentfor either porosity or permeability (Fig. 9E and F).There is a tendency for horizontal plugs to havehigher permeability (Fig. 9C and D). A similartendency is also present for porosity (Table 1),but is not readily apparent visually (Fig. 9A andB). Despite these relatively slight tendencies forhigher values in the horizontal plugs, most of thescatter in Fig. 9A–D is interpreted as reflectingthe extreme fine-scale heterogeneity of these
Fig. 7. Overview of all Marion Plateau porosity–per-meability data. Plotting symbol shape indicates slope/drift samples and mineralogy of platform samples.Symbol colour indicates sample type.
1304 S. N. Ehrenberg et al.
� 2006 The Authors. Journal compilation � 2006 International Association of Sedimentologists, Sedimentology, 53, 1289–1318

carbonate strata rather than systematic anisotropyof properties. Therefore, the horizontal and ver-tical plug data are discussed together.
Whole-core versus plug values
The 22 analyses of whole-core dolostones (6–8 cm diameter by 6–10 cm long) fall along a
curved trend in log-permeability versus linearporosity coordinates that is similar to that definedby the dolostone plug values (Fig. 7). The whole-core data, however, do not range to as highpermeability values as the plugs. A possibleexplanation for the higher permeability range ofthe plug samples is that the highest-permeabilityplugs may contain large vugs that effectively
Fig. 8. Porosity–permeability analyses of platform samples sorted by site and lithostratigraphic unit. (A) NMP (Site1193). Plotting symbols indicate mineralogy. (B) SMP Unit I (Sites 1196 and 1199). Plotting symbols differentiatesites and upper versus lower Unit I. (C) SMP (Sites 1196 and 1199) Unit II and upper Unit I limestones. (D) SMP(Sites 1196 and 1199) Units III and IV. Plotting symbols indicate unit.
Porosity–permeability relationships in Miocene carbonate platforms 1305
� 2006 The Authors. Journal compilation � 2006 International Association of Sedimentologists, Sedimentology, 53, 1289–1318
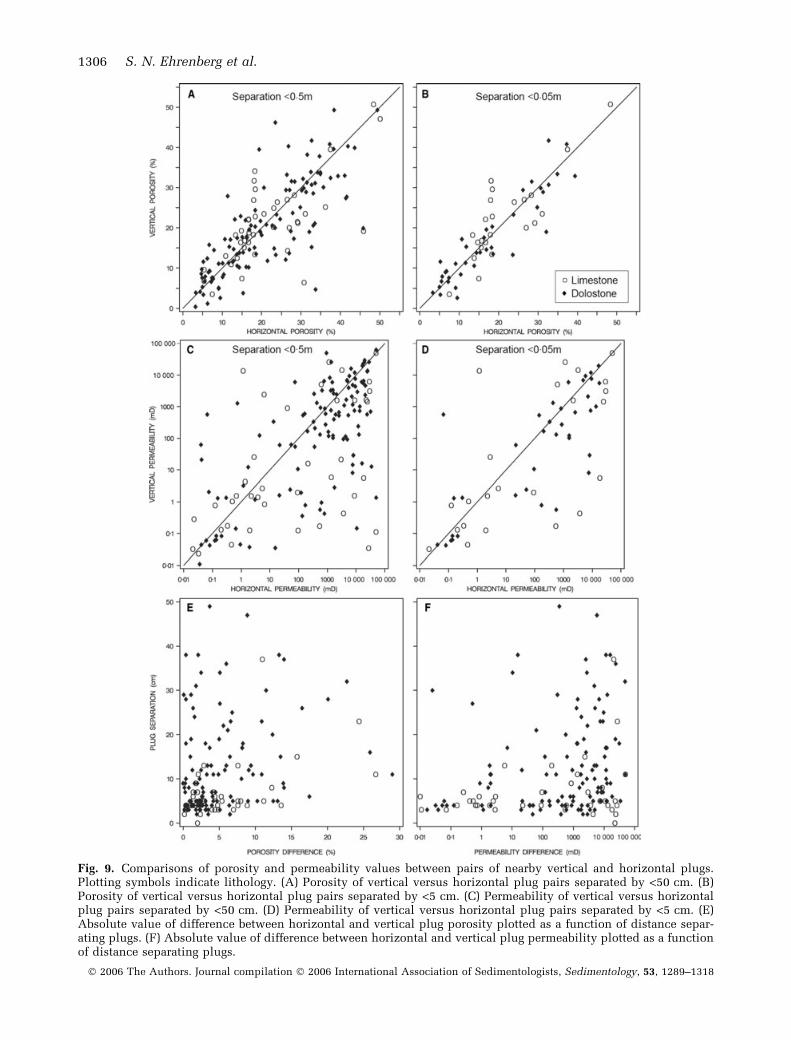
Fig. 9. Comparisons of porosity and permeability values between pairs of nearby vertical and horizontal plugs.Plotting symbols indicate lithology. (A) Porosity of vertical versus horizontal plug pairs separated by <50 cm. (B)Porosity of vertical versus horizontal plug pairs separated by <5 cm. (C) Permeability of vertical versus horizontalplug pairs separated by <50 cm. (D) Permeability of vertical versus horizontal plug pairs separated by <5 cm. (E)Absolute value of difference between horizontal and vertical plug porosity plotted as a function of distance separ-ating plugs. (F) Absolute value of difference between horizontal and vertical plug permeability plotted as a functionof distance separating plugs.
1306 S. N. Ehrenberg et al.
� 2006 The Authors. Journal compilation � 2006 International Association of Sedimentologists, Sedimentology, 53, 1289–1318

‘short circuit’ flow through the enclosing macro-pore system on the 1-inch plug scale. These samevugs may be isolated from one another, however,on the scale of the whole-core samples. Thishypothesis was tested by examining availablethin sections from plugs with permeabilities>10 D. Most of these thin sections were found tolack large vugs and to have pore systems thatappear consistent with very high permeability. Itis therefore concluded that the higher perme-ability range of the plug samples compared withthe whole-core samples is probably not an artefactof limited plug size with respect to vug sizes, butmay simply reflect the limited number of whole-core samples.
Texture
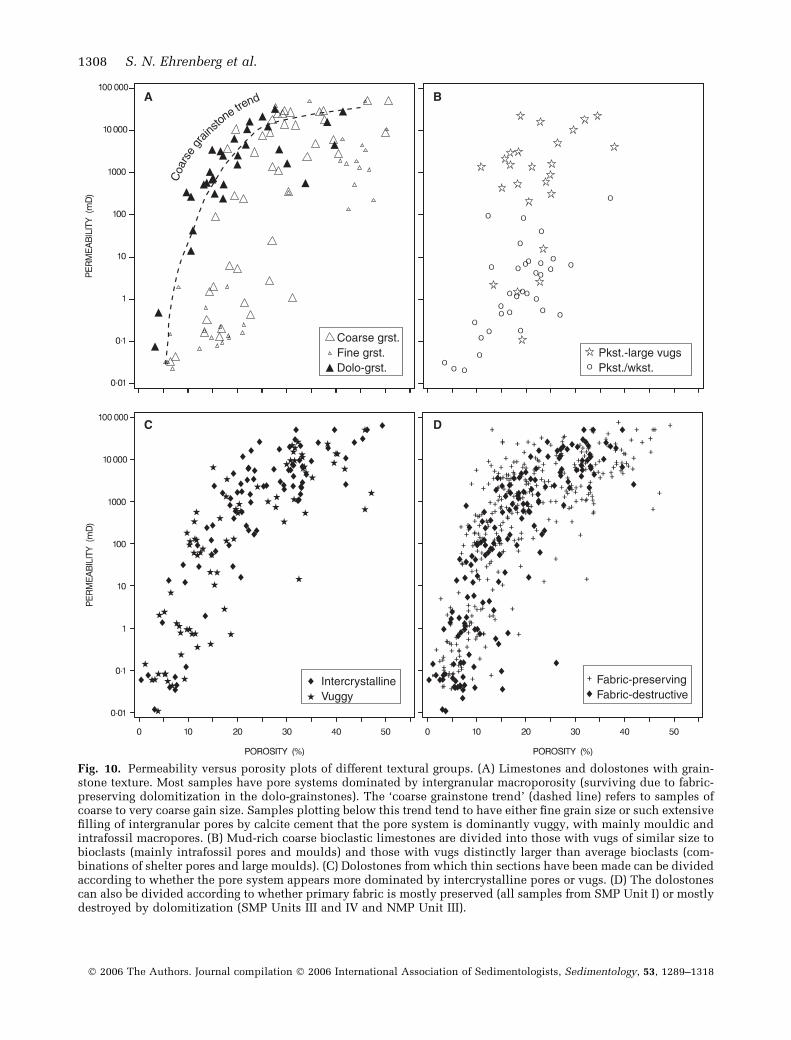
As described above, limestones and dolostonesare each divisible into four textural groups,reflecting the dominant pore types present(Figs 4 and 5, respectively). Plots comparingthe porosity–permeability distributions of thetextural categories are shown in Fig. 10. Lime-stones and dolostones with dominantly grain-stone texture and intergranular pore systems(Figs 4A,B and 5A) have very high permeability-for-given-porosity, except for samples with finergrain size or extensive calcite cementation(Fig. 10A). Limestones with dominantly pack-stone to wackestone texture and pore systemsdominated by matrix micropores and vugs(Fig. 4C) show poor porosity–permeability cor-relation (Fig. 10B). Permeabilities over about100 mD in these mud-dominated textures de-pend on the presence of vugs distinctly largerthan the grains present. These apparently con-nected vugs include varying combinations ofmoulds, non-fabric-selective dissolution vugs,and areas of intergranular space that were
sheltered from infilling by mud during depos-ition (Fig. 4D).
Dolostones with dominantly intercrystallinepore systems show complete overlap in poros-ity–permeability space with dolostones havingdominantly vuggy pore systems (Fig. 10C). Fig-ure 10D shows the same dolostones classifiedaccording to whether primary fabric is partlypreserved (samples from SMP Unit I) or mainlydestroyed (samples from SMP Units II, III, and IVand NMP Unit III). Both groups show completeoverlap in the porosity–permeability plot.
Relationships to platform architecture
In regard to larger-scale trends, each stratigraphicunit and site has its distinct pattern of porosity–permeability variation (Figs 3 and 8). Thesecharacteristics are reviewed here sequentiallyfor the four main stages of platform evolution.
Sequence B1 (23–18 Ma)The oldest platform strata sampled are the fabric-destructive dolostones of SMP Units III and IV.The densely sampled portion of this interval(480–685 m in Site 1196) is divisible into threesubintervals (tops at 480, 538 and 617 m) thateach comprise a lower portion with overall higherporosity and permeability and an upper portionincluding greater numbers of low-porosity–per-meability samples (Fig. 3B). Although deposi-tional textures have been largely destroyed bydolomitization, it is suggested that these trendsreflect large-scale shoaling cycles. Only theuppermost part of this densely sampled intervalis covered by the wireline logs (Fig. 3B). The logreadings indicate a sharp transition from low tooverlying high porosity at ca 480 mbsf and highporosity throughout the poorly recovered upper132 m of Unit III.
Sequences B2 and B3 (18–15 Ma)The next younger stratigraphic interval sampledis SMP Unit II. Core recovery from this interval istoo low for recognition of any vertical trends inlithology and reservoir quality that may bepresent. The wireline logs from both SMP sitesshow overall high porosity, while limited sam-ples give an impression of wide variability overshort vertical distances. This porosity variationmainly reflects differences in cementation byblocky calcite spar. Plugs with porosity >40%have nearly no cement, whereas lower-porosityplugs tend to be heavily cemented except formoulds of larger bioclasts. Only one of the
Table 1. Average differences between horizontal andvertical plug pairs (<0Æ5 m vertical separation).
Horizontal-plug porosity minus vertical-plug porosityAll plug pairs (n ¼ 160) 0Æ8Pairs with positive difference (n ¼ 85) 5Æ7Pairs with negative difference (n ¼ 74) )4Æ9Pairs with zero difference (n ¼ 1) 0
Horizontal-plug permeability minus vertical-plugpermeabilityAll plug pairs (n ¼ 160) 2589Pairs with positive difference (n ¼ 104) 6128Pairs with negative difference (n ¼ 55) )4056Pairs with zero difference (n ¼ 1) 0
Porosity–permeability relationships in Miocene carbonate platforms 1307
� 2006 The Authors. Journal compilation � 2006 International Association of Sedimentologists, Sedimentology, 53, 1289–1318
Pkst.-large vugs Pkst./wkst.
Coarse grst. Fine grst. Dolo-grst.
Fabric-preserving Fabric-destructive
Intercrystalline Vuggy
A B
C D
C o a
r s e
g r a i n
s t o n e t r e
n d
Fig. 10. Permeability versus porosity plots of different textural groups. (A) Limestones and dolostones with grain-stone texture. Most samples have pore systems dominated by intergranular macroporosity (surviving due to fabric-preserving dolomitization in the dolo-grainstones). The ‘coarse grainstone trend’ (dashed line) refers to samples ofcoarse to very coarse gain size. Samples plotting below this trend tend to have either fine grain size or such extensivefilling of intergranular pores by calcite cement that the pore system is dominantly vuggy, with mainly mouldic andintrafossil macropores. (B) Mud-rich coarse bioclastic limestones are divided into those with vugs of similar size tobioclasts (mainly intrafossil pores and moulds) and those with vugs distinctly larger than average bioclasts (com-binations of shelter pores and large moulds). (C) Dolostones from which thin sections have been made can be dividedaccording to whether the pore system appears more dominated by intercrystalline pores or vugs. (D) The dolostonescan also be divided according to whether primary fabric is mostly preserved (all samples from SMP Unit I) or mostlydestroyed by dolomitization (SMP Units III and IV and NMP Unit III).
1308 S. N. Ehrenberg et al.
� 2006 The Authors. Journal compilation � 2006 International Association of Sedimentologists, Sedimentology, 53, 1289–1318
samples examined in thin section has abundantmud matrix, so it would appear that Unit IIporosity differentiation has mainly been a resultof differential cementation.
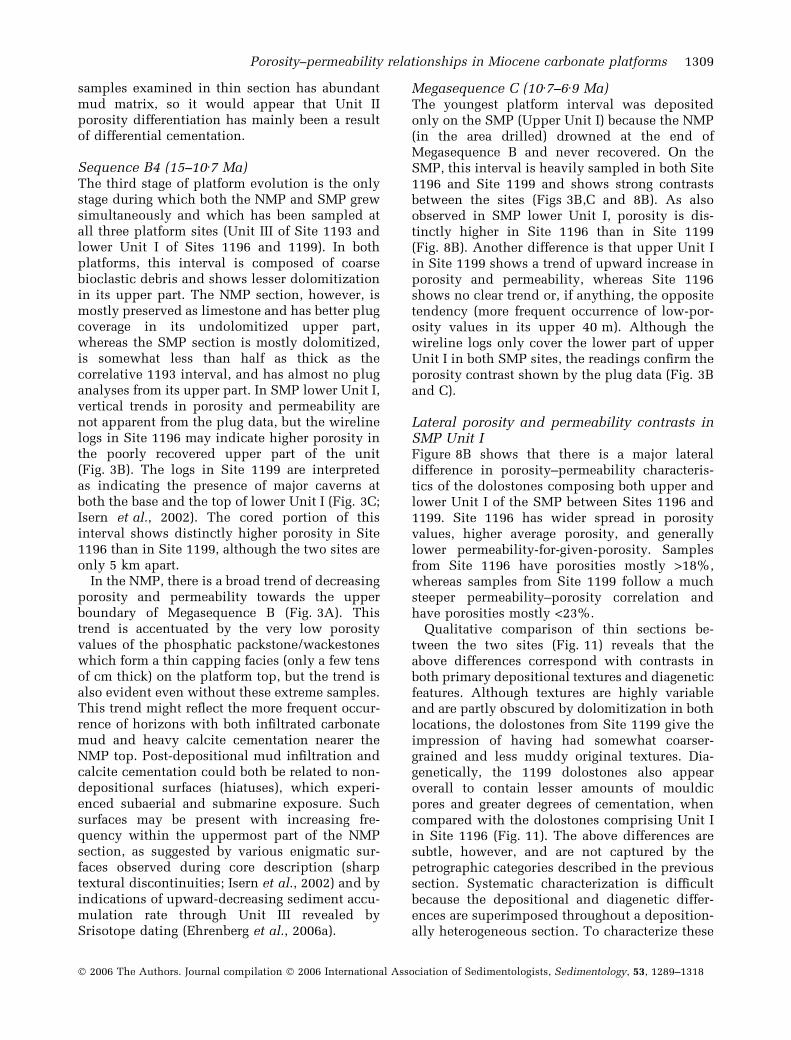
Sequence B4 (15–10Æ7 Ma)The third stage of platform evolution is the onlystage during which both the NMP and SMP grewsimultaneously and which has been sampled atall three platform sites (Unit III of Site 1193 andlower Unit I of Sites 1196 and 1199). In bothplatforms, this interval is composed of coarsebioclastic debris and shows lesser dolomitizationin its upper part. The NMP section, however, ismostly preserved as limestone and has better plugcoverage in its undolomitized upper part,whereas the SMP section is mostly dolomitized,is somewhat less than half as thick as thecorrelative 1193 interval, and has almost no pluganalyses from its upper part. In SMP lower Unit I,vertical trends in porosity and permeability arenot apparent from the plug data, but the wirelinelogs in Site 1196 may indicate higher porosity inthe poorly recovered upper part of the unit(Fig. 3B). The logs in Site 1199 are interpretedas indicating the presence of major caverns atboth the base and the top of lower Unit I (Fig. 3C;Isern et al., 2002). The cored portion of thisinterval shows distinctly higher porosity in Site1196 than in Site 1199, although the two sites areonly 5 km apart.
In the NMP, there is a broad trend of decreasingporosity and permeability towards the upperboundary of Megasequence B (Fig. 3A). Thistrend is accentuated by the very low porosityvalues of the phosphatic packstone/wackestoneswhich form a thin capping facies (only a few tensof cm thick) on the platform top, but the trend isalso evident even without these extreme samples.This trend might reflect the more frequent occur-rence of horizons with both infiltrated carbonatemud and heavy calcite cementation nearer theNMP top. Post-depositional mud infiltration andcalcite cementation could both be related to non-depositional surfaces (hiatuses), which experi-enced subaerial and submarine exposure. Suchsurfaces may be present with increasing fre-quency within the uppermost part of the NMPsection, as suggested by various enigmatic sur-faces observed during core description (sharptextural discontinuities; Isern et al., 2002) and byindications of upward-decreasing sediment accu-mulation rate through Unit III revealed bySrisotope dating (Ehrenberg et al., 2006a).
Megasequence C (10Æ7–6Æ9 Ma)The youngest platform interval was depositedonly on the SMP (Upper Unit I) because the NMP(in the area drilled) drowned at the end ofMegasequence B and never recovered. On theSMP, this interval is heavily sampled in both Site1196 and Site 1199 and shows strong contrastsbetween the sites (Figs 3B,C and 8B). As alsoobserved in SMP lower Unit I, porosity is dis-tinctly higher in Site 1196 than in Site 1199(Fig. 8B). Another difference is that upper Unit Iin Site 1199 shows a trend of upward increase inporosity and permeability, whereas Site 1196shows no clear trend or, if anything, the oppositetendency (more frequent occurrence of low-por-osity values in its upper 40 m). Although thewireline logs only cover the lower part of upperUnit I in both SMP sites, the readings confirm theporosity contrast shown by the plug data (Fig. 3Band C).
Lateral porosity and permeability contrasts inSMP Unit IFigure 8B shows that there is a major lateraldifference in porosity–permeability characteris-tics of the dolostones composing both upper andlower Unit I of the SMP between Sites 1196 and1199. Site 1196 has wider spread in porosityvalues, higher average porosity, and generallylower permeability-for-given-porosity. Samplesfrom Site 1196 have porosities mostly >18%,whereas samples from Site 1199 follow a muchsteeper permeability–porosity correlation andhave porosities mostly <23%.
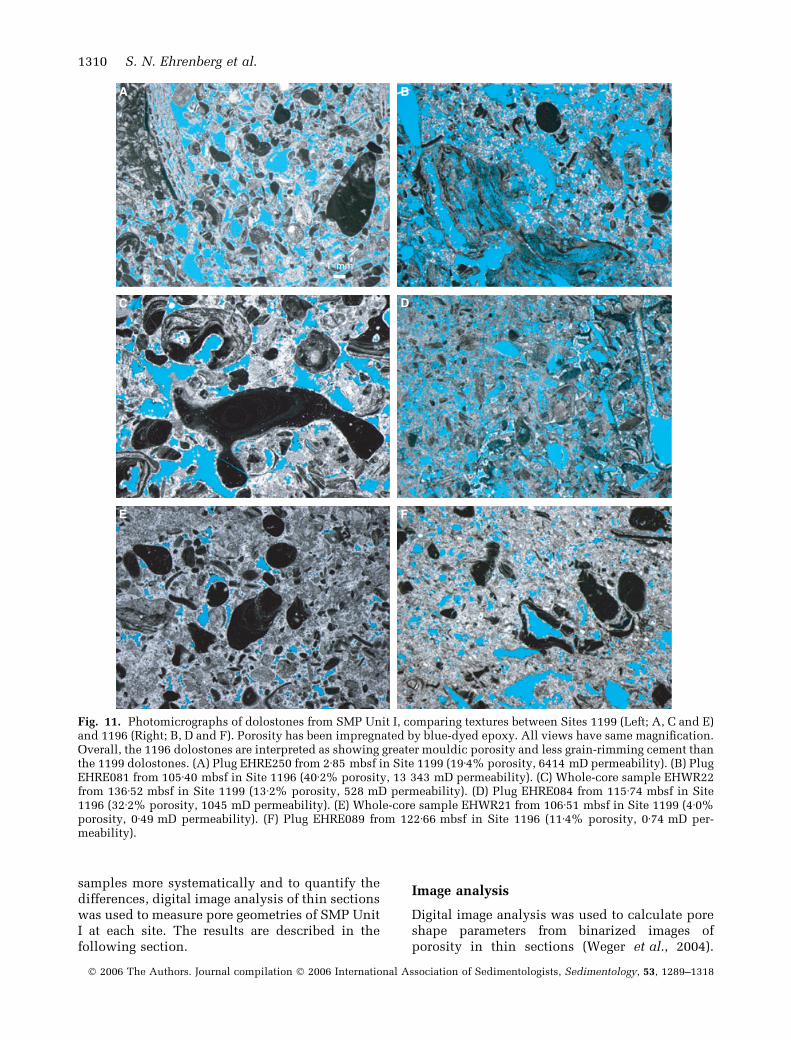
Qualitative comparison of thin sections be-tween the two sites (Fig. 11) reveals that theabove differences correspond with contrasts inboth primary depositional textures and diageneticfeatures. Although textures are highly variableand are partly obscured by dolomitization in bothlocations, the dolostones from Site 1199 give theimpression of having had somewhat coarser-grained and less muddy original textures. Dia-genetically, the 1199 dolostones also appearoverall to contain lesser amounts of mouldicpores and greater degrees of cementation, whencompared with the dolostones comprising Unit Iin Site 1196 (Fig. 11). The above differences aresubtle, however, and are not captured by thepetrographic categories described in the previoussection. Systematic characterization is difficultbecause the depositional and diagenetic differ-ences are superimposed throughout a deposition-ally heterogeneous section. To characterize these
Porosity–permeability relationships in Miocene carbonate platforms 1309
� 2006 The Authors. Journal compilation � 2006 International Association of Sedimentologists, Sedimentology, 53, 1289–1318
samples more systematically and to quantify thedifferences, digital image analysis of thin sectionswas used to measure pore geometries of SMP UnitI at each site. The results are described in thefollowing section.
Image analysis
Digital image analysis was used to calculate poreshape parameters from binarized images ofporosity in thin sections (Weger et al., 2004).
B
C
E F
D
A
Fig. 11. Photomicrographs of dolostones from SMP Unit I, comparing textures between Sites 1199 (Left; A, C and E)and 1196 (Right; B, D and F). Porosity has been impregnated by blue-dyed epoxy. All views have same magnification.Overall, the 1196 dolostones are interpreted as showing greater mouldic porosity and less grain-rimming cement thanthe 1199 dolostones. (A) Plug EHRE250 from 2Æ85 mbsf in Site 1199 (19Æ4% porosity, 6414 mD permeability). (B) PlugEHRE081 from 105Æ40 mbsf in Site 1196 (40Æ2% porosity, 13 343 mD permeability). (C) Whole-core sample EHWR22from 136Æ52 mbsf in Site 1199 (13Æ2% porosity, 528 mD permeability). (D) Plug EHRE084 from 115Æ74 mbsf in Site1196 (32Æ2% porosity, 1045 mD permeability). (E) Whole-core sample EHWR21 from 106Æ51 mbsf in Site 1199 (4Æ0%porosity, 0Æ49 mD permeability). (F) Plug EHRE089 from 122Æ66 mbsf in Site 1196 (11Æ4% porosity, 0Æ74 mD per-meability).
1310 S. N. Ehrenberg et al.
� 2006 The Authors. Journal compilation � 2006 International Association of Sedimentologists, Sedimentology, 53, 1289–1318
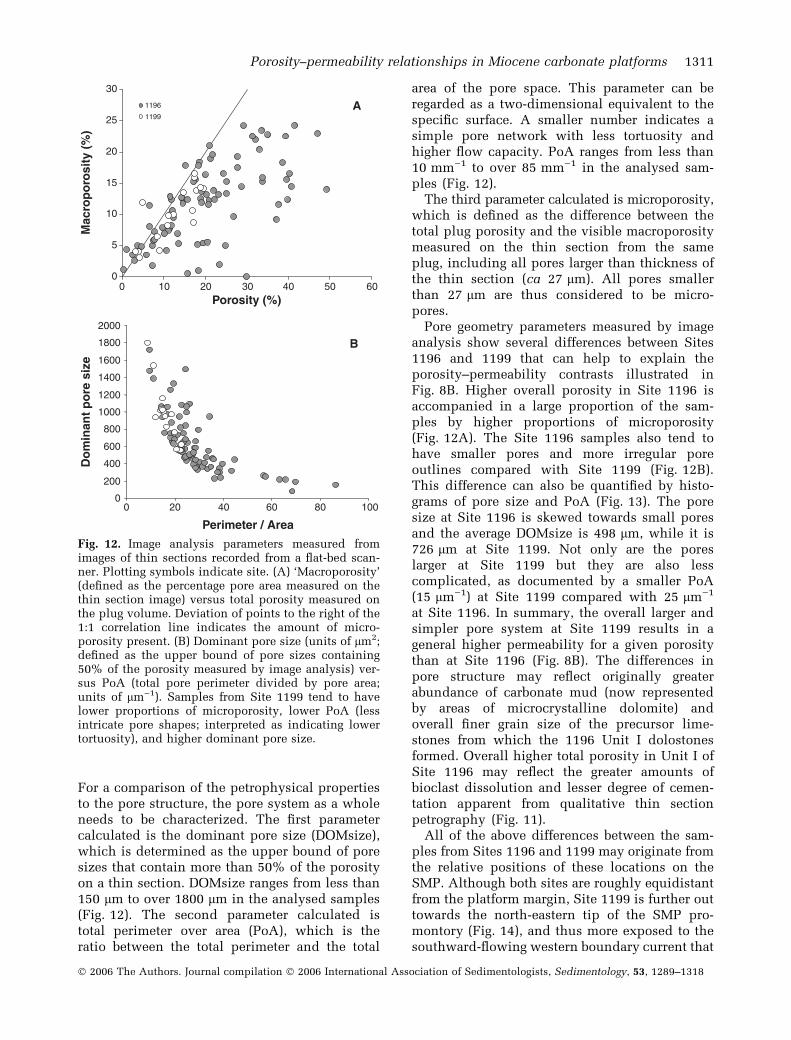
For a comparison of the petrophysical propertiesto the pore structure, the pore system as a wholeneeds to be characterized. The first parametercalculated is the dominant pore size (DOMsize),which is determined as the upper bound of poresizes that contain more than 50% of the porosityon a thin section. DOMsize ranges from less than150 lm to over 1800 lm in the analysed samples(Fig. 12). The second parameter calculated istotal perimeter over area (PoA), which is theratio between the total perimeter and the total
area of the pore space. This parameter can beregarded as a two-dimensional equivalent to thespecific surface. A smaller number indicates asimple pore network with less tortuosity andhigher flow capacity. PoA ranges from less than10 mm)1 to over 85 mm)1 in the analysed sam-ples (Fig. 12).
The third parameter calculated is microporosity,which is defined as the difference between thetotal plug porosity and the visible macroporositymeasured on the thin section from the sameplug, including all pores larger than thickness ofthe thin section (ca 27 lm). All pores smallerthan 27 lm are thus considered to be micro-pores.
Pore geometry parameters measured by imageanalysis show several differences between Sites1196 and 1199 that can help to explain theporosity–permeability contrasts illustrated inFig. 8B. Higher overall porosity in Site 1196 isaccompanied in a large proportion of the sam-ples by higher proportions of microporosity(Fig. 12A). The Site 1196 samples also tend tohave smaller pores and more irregular poreoutlines compared with Site 1199 (Fig. 12B).This difference can also be quantified by histo-grams of pore size and PoA (Fig. 13). The poresize at Site 1196 is skewed towards small poresand the average DOMsize is 498 lm, while it is726 lm at Site 1199. Not only are the poreslarger at Site 1199 but they are also lesscomplicated, as documented by a smaller PoA(15 lm)1) at Site 1199 compared with 25 lm)1
at Site 1196. In summary, the overall larger andsimpler pore system at Site 1199 results in ageneral higher permeability for a given porositythan at Site 1196 (Fig. 8B). The differences inpore structure may reflect originally greaterabundance of carbonate mud (now representedby areas of microcrystalline dolomite) andoverall finer grain size of the precursor lime-stones from which the 1196 Unit I dolostonesformed. Overall higher total porosity in Unit I ofSite 1196 may reflect the greater amounts ofbioclast dissolution and lesser degree of cemen-tation apparent from qualitative thin sectionpetrography (Fig. 11).
All of the above differences between the sam-ples from Sites 1196 and 1199 may originate fromthe relative positions of these locations on theSMP. Although both sites are roughly equidistantfrom the platform margin, Site 1199 is further outtowards the north-eastern tip of the SMP pro-montory (Fig. 14), and thus more exposed to thesouthward-flowing western boundary current that
0 0
0 20 40 60 80 100
10 20 30 40 50 60
5
10
15
Porosity (%)
Mac
rop
oro
sity
(%
)
1196
1199 A
20
25
30
0
200
400
600
800
1000
1200
1400
Perimeter / Area
Do
min
ant
po
re s
ize 1600
1800
2000
B
Fig. 12. Image analysis parameters measured fromimages of thin sections recorded from a flat-bed scan-ner. Plotting symbols indicate site. (A) ‘Macroporosity’(defined as the percentage pore area measured on thethin section image) versus total porosity measured onthe plug volume. Deviation of points to the right of the1:1 correlation line indicates the amount of micro-porosity present. (B) Dominant pore size (units of lm2;defined as the upper bound of pore sizes containing50% of the porosity measured by image analysis) ver-sus PoA (total pore perimeter divided by pore area;units of lm)1). Samples from Site 1199 tend to havelower proportions of microporosity, lower PoA (lessintricate pore shapes; interpreted as indicating lowertortuosity), and higher dominant pore size.
Porosity–permeability relationships in Miocene carbonate platforms 1311
� 2006 The Authors. Journal compilation � 2006 International Association of Sedimentologists, Sedimentology, 53, 1289–1318
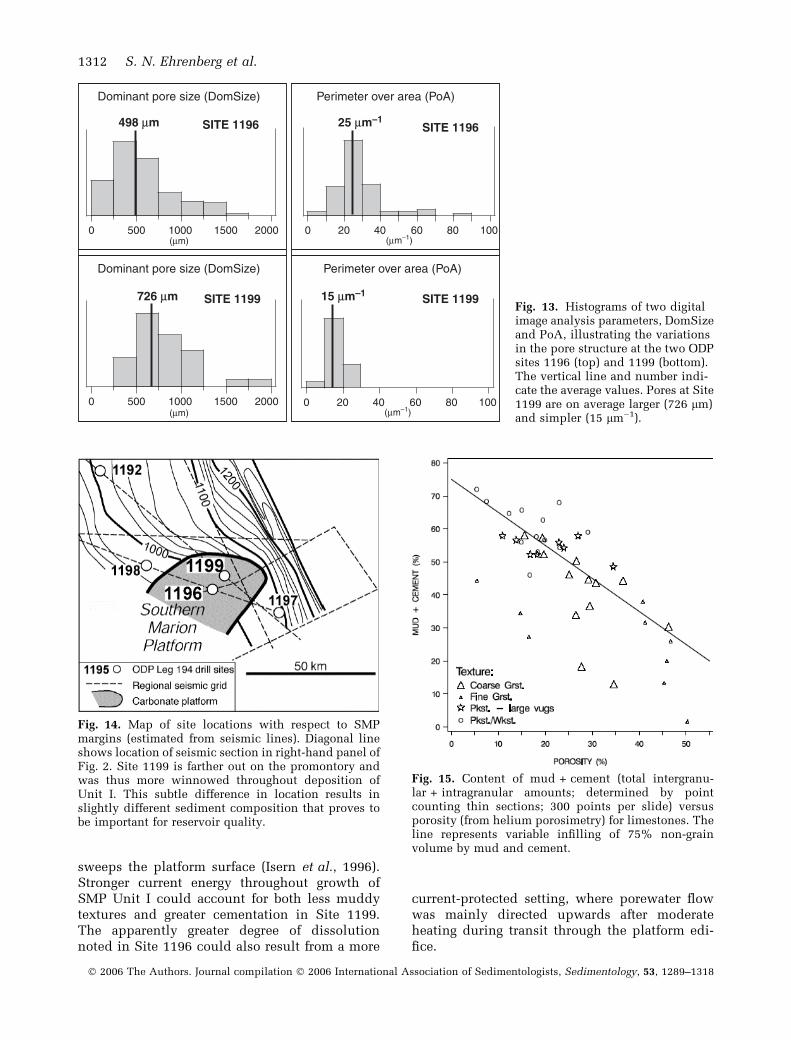
sweeps the platform surface (Isern et al., 1996).Stronger current energy throughout growth ofSMP Unit I could account for both less muddytextures and greater cementation in Site 1199.The apparently greater degree of dissolutionnoted in Site 1196 could also result from a more
current-protected setting, where porewater flowwas mainly directed upwards after moderateheating during transit through the platform edi-fice.
0 500 1000 1500 2000
0 500 1000 1500 2000 0 20 40 60 80 100
Dominant pore size (DomSize) Perimeter over area (PoA)
726 µm 15 µm–1
Dominant pore size (DomSize) Perimeter over area (PoA)
(µm)
(µm)
0 10 20 30 40 50 60 70 80 90100(µm–1)
(µm–1)
25 µm–1498 µm SITE 1196 SITE 1196
SITE 1199SITE 1199Fig. 13. Histograms of two digitalimage analysis parameters, DomSizeand PoA, illustrating the variationsin the pore structure at the two ODPsites 1196 (top) and 1199 (bottom).The vertical line and number indi-cate the average values. Pores at Site1199 are on average larger (726 lm)and simpler (15 lm)1).
Fig. 14. Map of site locations with respect to SMPmargins (estimated from seismic lines). Diagonal lineshows location of seismic section in right-hand panel ofFig. 2. Site 1199 is farther out on the promontory andwas thus more winnowed throughout deposition ofUnit I. This subtle difference in location results inslightly different sediment composition that proves tobe important for reservoir quality.
Fig. 15. Content of mud + cement (total intergranu-lar + intragranular amounts; determined by pointcounting thin sections; 300 points per slide) versusporosity (from helium porosimetry) for limestones. Theline represents variable infilling of 75% non-grainvolume by mud and cement.
1312 S. N. Ehrenberg et al.
� 2006 The Authors. Journal compilation � 2006 International Association of Sedimentologists, Sedimentology, 53, 1289–1318
CONTROLLING FACTORS
Porosity
For limestones, the correlation in Fig. 15 indi-cates that the main factors causing variation intotal porosity are the combined abundances ofmud matrix and cement. Carbonate mud is highlyporous when deposited, but mud matrix in the1193 limestones appears to have lost porosity bymicro-cementation and recrystallization. Occur-rence of low-porosity carbonate mud thereforecorresponds with low porosity throughout theupper part of the NMP, where tight, mud-domin-ated intervals alternate on a metre to decimetrescale with porous beds of grainstone to mud-leanpackstone. In SMP limestones (Unit II and the 12–28-m-thick limestone interval in upper Unit I,Site 1196) the main factor causing low porosity
values, however, is abundant blocky calcitecement. Other factors probably causing variationsin limestone porosity include the abundance ofaragonite bioclasts available for dissolution andvariations in original pore space due to differinggrain shapes and sorting. Little evidence isapparent petrographically for compactional por-osity loss, suggesting that early (isopachous)calcite cements may have been important forpreserving porosity from compaction.
For dolostones, the causes of porosity variationpotentially include all of the above factors (i.e.porosity inherited from the precursor limestone)plus both porosity increase due to dissolutionduring or following dolomitization and porositydecrease due to dolomite cementation (Ehrenberget al., 2006b). Even in the clearest fabric-preser-ving dolostones, where most pore space is inher-ited intergranular porosity (Fig. 5A), it isuncertain whether cementational porosity lossoccurred mainly before or during growth of thelimpid dolomite rhombs that coat pore surfaces.This dolomite appears to have formed by bothreplacement of isopachous calcite cement andovergrowth of dolomite cement on the replacedcement zone. In the fabric-destructive dolostones,uncertainties are far more extreme.
Permeability
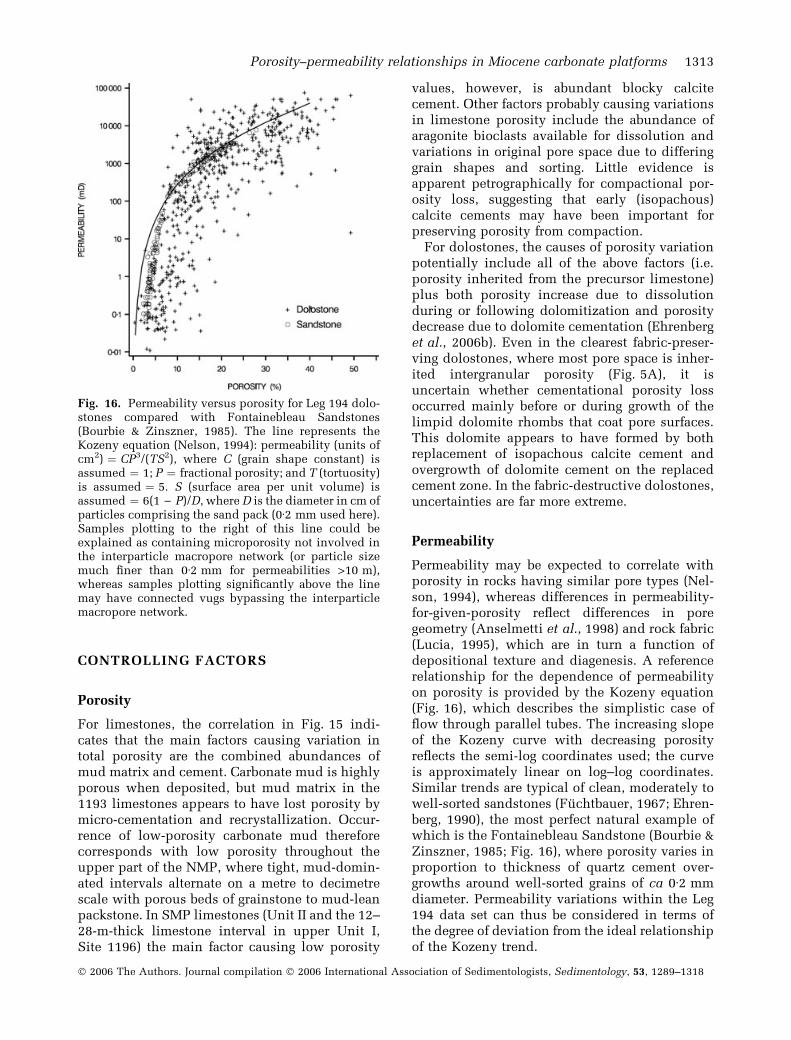
Permeability may be expected to correlate withporosity in rocks having similar pore types (Nel-son, 1994), whereas differences in permeability-for-given-porosity reflect differences in poregeometry (Anselmetti et al., 1998) and rock fabric(Lucia, 1995), which are in turn a function ofdepositional texture and diagenesis. A referencerelationship for the dependence of permeabilityon porosity is provided by the Kozeny equation(Fig. 16), which describes the simplistic case offlow through parallel tubes. The increasing slopeof the Kozeny curve with decreasing porosityreflects the semi-log coordinates used; the curveis approximately linear on log–log coordinates.Similar trends are typical of clean, moderately towell-sorted sandstones (Fuchtbauer, 1967; Ehren-berg, 1990), the most perfect natural example ofwhich is the Fontainebleau Sandstone (Bourbie &Zinszner, 1985; Fig. 16), where porosity varies inproportion to thickness of quartz cement over-growths around well-sorted grains of ca 0Æ2 mmdiameter. Permeability variations within the Leg194 data set can thus be considered in terms ofthe degree of deviation from the ideal relationshipof the Kozeny trend.
Fig. 16. Permeability versus porosity for Leg 194 dolo-stones compared with Fontainebleau Sandstones(Bourbie & Zinszner, 1985). The line represents theKozeny equation (Nelson, 1994): permeability (units ofcm2) ¼ CP3/(TS2), where C (grain shape constant) isassumed ¼ 1; P ¼ fractional porosity; and T (tortuosity)is assumed ¼ 5. S (surface area per unit volume) isassumed ¼ 6(1 ) P)/D, where D is the diameter in cm ofparticles comprising the sand pack (0Æ2 mm used here).Samples plotting to the right of this line could beexplained as containing microporosity not involved inthe interparticle macropore network (or particle sizemuch finer than 0Æ2 mm for permeabilities >10 m),whereas samples plotting significantly above the linemay have connected vugs bypassing the interparticlemacropore network.
Porosity–permeability relationships in Miocene carbonate platforms 1313
� 2006 The Authors. Journal compilation � 2006 International Association of Sedimentologists, Sedimentology, 53, 1289–1318
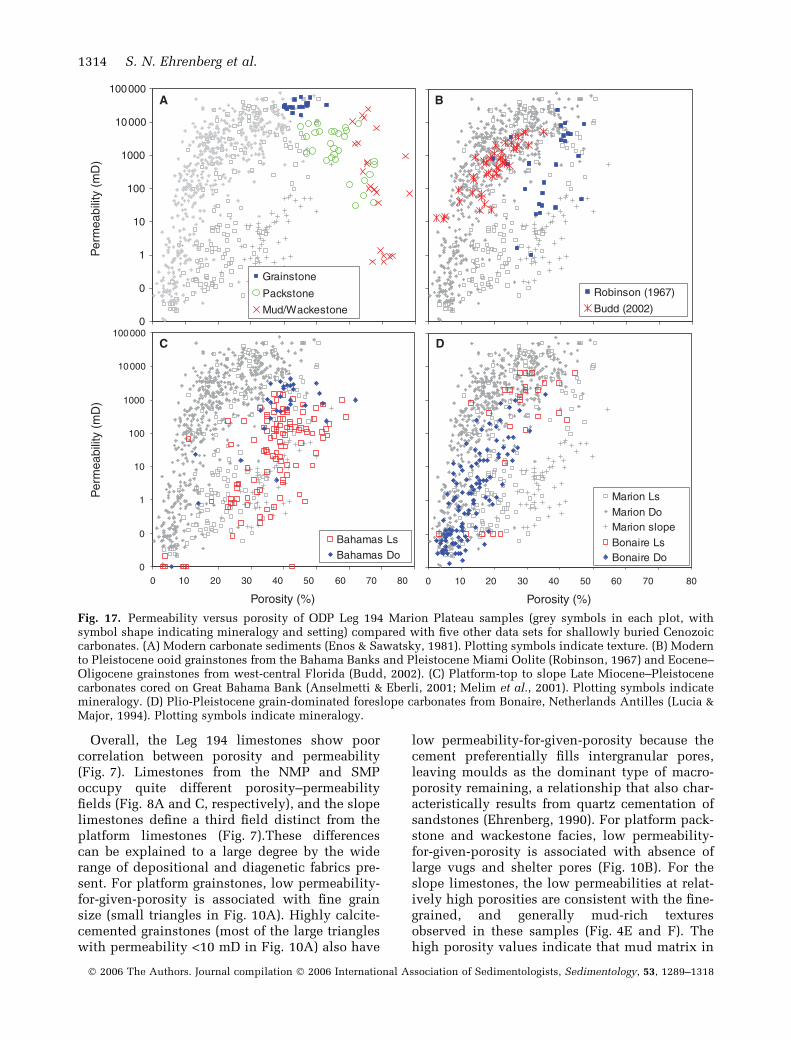
Overall, the Leg 194 limestones show poorcorrelation between porosity and permeability(Fig. 7). Limestones from the NMP and SMPoccupy quite different porosity–permeabilityfields (Fig. 8A and C, respectively), and the slopelimestones define a third field distinct from theplatform limestones (Fig. 7).These differencescan be explained to a large degree by the widerange of depositional and diagenetic fabrics pre-sent. For platform grainstones, low permeability-for-given-porosity is associated with fine grainsize (small triangles in Fig. 10A). Highly calcite-cemented grainstones (most of the large triangleswith permeability <10 mD in Fig. 10A) also have
low permeability-for-given-porosity because thecement preferentially fills intergranular pores,leaving moulds as the dominant type of macro-porosity remaining, a relationship that also char-acteristically results from quartz cementation ofsandstones (Ehrenberg, 1990). For platform pack-stone and wackestone facies, low permeability-for-given-porosity is associated with absence oflarge vugs and shelter pores (Fig. 10B). For theslope limestones, the low permeabilities at relat-ively high porosities are consistent with the fine-grained, and generally mud-rich texturesobserved in these samples (Fig. 4E and F). Thehigh porosity values indicate that mud matrix in
Robinson (1967)
Budd (2002)
0
0
1
10
100
1000
10000
100000
0 10 20 30 40 50 60 70 80
Porosity (%)
Per
mea
bilit
y (m
D)
Bahamas LsBahamas Do
0 10 20 30 40 50 60 70 80
Porosity (%)
Marion LsMarion DoMarion slopeBonaire LsBonaire Do
0
0
1
10
100
1000
10000
100000P
erm
eabi
lity
(mD
)
Grainstone
Packstone
Mud/Wackestone
BA
DC
Fig. 17. Permeability versus porosity of ODP Leg 194 Marion Plateau samples (grey symbols in each plot, withsymbol shape indicating mineralogy and setting) compared with five other data sets for shallowly buried Cenozoiccarbonates. (A) Modern carbonate sediments (Enos & Sawatsky, 1981). Plotting symbols indicate texture. (B) Modernto Pleistocene ooid grainstones from the Bahama Banks and Pleistocene Miami Oolite (Robinson, 1967) and Eocene–Oligocene grainstones from west-central Florida (Budd, 2002). (C) Platform-top to slope Late Miocene–Pleistocenecarbonates cored on Great Bahama Bank (Anselmetti & Eberli, 2001; Melim et al., 2001). Plotting symbols indicatemineralogy. (D) Plio-Pleistocene grain-dominated foreslope carbonates from Bonaire, Netherlands Antilles (Lucia &Major, 1994). Plotting symbols indicate mineralogy.
1314 S. N. Ehrenberg et al.
� 2006 The Authors. Journal compilation � 2006 International Association of Sedimentologists, Sedimentology, 53, 1289–1318
the slope samples has not been recrystallized andcemented to the same high degree as in theplatform limestones.
The Leg 194 dolostones define a curved field onlog-permeability versus linear-porosity coordi-nates that roughly parallels the Kozeny curve(Fig. 16). This suggests a fundamental similaritybetween the ostensibly diverse and complex poresystems of the dolostones and the simple sandpack described by the Kozeny equation. Thissimilarity is interpreted as reflecting the inter-particle macropore network of the dolostones,consisting either of intercrystalline pores in thematrix-dominated and fabric-destructive dolo-stones or the relict intergranular pores in thefabric-preserving dolo-grainstones. The presenceand even dominance of vugs does not signifi-cantly modify this relationship because the vugstend to be well connected through the surround-ing interparticle macropore system and are thuspart of the ‘effective porosity’ used for fluid flow.
COMPARISON WITH OTHER DATA SETS
Several data sets of quantitative porosity–per-meability measurements from shallowly buried(<700 m) Cenozoic carbonates are available forcomparison with the Marion Plateau (Fig. 17).These comparisons illustrate the remarkable vari-ability of carbonates and are useful for putting thepresent study in perspective with respect toseveral well known and much discussed exam-ples of carbonate diagenesis and reservoir quality.
At the youngest end of the spectrum is thestudy of modern carbonate sediments by Enos &Sawatsky (1981). These 72 analyses define a trendof decreasing permeability with increasingporosity, which reflects the high microporosityof unconsolidated carbonate mud (Fig. 17A). Thistrend contrasts with the positive correlationtypically observed in rocks. Reversal of the trendmust occur by compaction and cementation of themud matrix during the early stages of lithifica-tion. The grainstones of the Enos & Sawatsky(1981) data set overlap with the highest porosity–permeability values of the Leg 194 data, but themodern packstones and wackestone/mudstoneshave even higher porosities. The comparison ofthe modern data with the Miocene samples of theMarion Platforms provides an indication ofthe influence of the diagenetic alteration of thedifferent textures. During early diagenesis grain-stones lose little porosity and consequently thepermeability remains high. The increase in mud
content is in tandem with an increase of porosityloss during diagenetic alteration as recrystalliza-tion and cementation reduce the pore space.
Robinson (1967) analysed plugs cut from vari-ably cemented modern to Pleistocene ooid grain-stones from the Bahamas and the PleistoceneMiami Oolite of south Florida (Fig. 17B). TheRobinson (1967) grainstones may be regarded asrepresenting a diagenetic extension from theuncemented grainstones of Enos & Sawatsky(1981), which occupy a field at the high end ofthe Robinson (1967) porosity–permeability field(Fig. 17).
Budd (2002) reported porosity and permeabilityvalues for 45 samples of Eocene–Oligocene grain-stone from shallow boreholes (<500 m) in west-central Florida. These data show a positivecorrelation trend overlapping with the dolostonefield of the Marion Plateau data (Fig. 17B). Coar-ser grain size correlates poorly with porosity andpermeability in this data set (Budd, 2002), prob-ably reflecting the fact that the coarser-grainedsamples also tend to have poorer sorting.
Platform-top and slope carbonate facies of LateMiocene to Pleistocene age were cored in bore-holes Clino and Unda on Great Bahama Bank, fromwhich a series of 90 porosity–permeability pairswere reported from 33 to 670 m depth by Melimet al. (2001) and Anselmetti & Eberli (2001). Inthese cores, the dolostones have permeabilitieshigher than or overlapping with the highestlimestone permeabilities, but porosity values aresimilar (Fig. 17C). These Bahama data overlapwith the lower permeability-for-given-porosityrange of the Leg 194 samples, including mainlythe fine-grained grainstone textures and the slopesamples. This overlap is consistent with the factthat roughly half of the Bahamas measurementsare from slope facies that appear petrographicallysimilar to the Leg 194 slope/drift samples. How-ever, the Bahamas platform and slope samplesshow extensive overlap. The overall low permeab-ility-for-given-porosity of the majority of theBahamas platform samples reflects the mud-richtextures in the majority of these samples.
Lucia & Major (1994) analysed plugs drilledfrom outcrops of Plio-Pleistocene grain-domi-nated foreslope carbonates from the island ofBonaire, Netherlands Antilles. Limestones werecompared with stratigraphically equivalent dolo-stones separated by distances of less than a fewmetres to nearly 500 m. The outstanding charac-teristic of these data is the higher porosity–permeability values of the limestones (Fig. 17D).The dolostones define a broad trend roughly
Porosity–permeability relationships in Miocene carbonate platforms 1315
� 2006 The Authors. Journal compilation � 2006 International Association of Sedimentologists, Sedimentology, 53, 1289–1318
parallel to the Leg 194 dolostone field, but dis-placed to lower permeability-for-given-porosity.
CONCLUSIONS
Comparison of plug measurements and petro-graphy with wireline logs and sedimentologicdata provides a comprehensive basis for descri-bing the petrophysical characteristics of Miocenecarbonate platforms on the Marion Plateau andinterpreting the controlling factors involved.Contrary to initial expectations (Isern et al.,2002), petrographic and stable-isotope studiesreveal no compelling evidence for subaerialexposure at megasequence boundaries, possiblyindicating that the observed petrophysical char-acteristics have developed without significantinfluence of meteoric diagenesis.
Overall high porosity and permeability of thesestrata reflects the dominantly coarse bioclastictextures and the presence of early isopachouscalcite cement, which may have inhibited com-paction. Extreme petrophysical heterogeneityover short vertical intervals is nevertheless apredominant characteristic and results from high-frequency variation in depositional textures andearly diagenesis.
The limestones display wide variations in bothtotal porosity and porosity–permeability trend(i.e. permeability-for-given-porosity) that areclearly related to depositional and diageneticcharacteristics, including mud content, grain sizeand cement volume. Dolostones, however, tend toplot along a more limited porosity–permeabilitytrend regardless of whether textures are domin-ated by preserved intergranular pores, intercrys-talline pores or vugs. This general lack ofcorrelation between dolostone texture and per-meability–porosity trend is interpreted as reflect-ing recrystallization of mud matrix to formintercrystalline macroporosity that connects vugsas part of the effective pore system.
A systematic lateral porosity–permeability dif-ference over a distance of only 5 km within theyoungest dolostones (Unit I) of the SMP mayreflect a subtle difference in the positions of thetwo cored locations with respect to oceaniccurrents. Site 1199 is characterized by lower totalporosity relative to the same stratigraphic intervalin Site 1196. Site 1199 also has higher overallpermeability-for-given-porosity, which, on imageanalysis of thin sections, is seen to be related tolarger pore sizes and less complicated poreshapes. These differences are suggested to result
from the more ocean-facing position of Site 1199,where exposure to stronger current energy may belinked to less muddy depositional textures andgreater marine cementation.
This study provides a well-documented exam-ple of extreme petrophysical heterogeneity inshallowly buried carbonate platforms having arelatively simple diagenetic history. Carefulpetrographic and geochemical characterizationallows recognition of large-scale patterns havingpredictable relationships with depositionaland diagenetic fabrics and underlying causalprocesses.
ACKNOWLEDGEMENTS
Samples used were provided by the Ocean Drill-ing Program, which is sponsored by the U.S.National Science Foundation and participatingcountries under management of Joint Oceanogra-phic Institutions, Inc. Vertical plugs were selec-ted and prepared by Guido L. Bracco Gartneronboard the Joides Resolution. Travel costs forSNE participation in Leg 194 were paid by theNorwegian Research Council. Porosity and per-meability measurements of platform samples andresearch costs for SNE were funded by Statoil,and Knut Henrik Jacobsen is thanked for projectmotivation. Porosity and permeability measure-ments of slope samples and research costs forGregor Eberli were funded by USSP grants no.668372 and 660387. Stable-isotope analyses wereperformed under the direction of Peter K. Swart atthe University of Miami. Jerry Lucia is thankedfor providing the data plotted in Fig. 17D for hisBonaire carbonates. Detailed and helpful reviewsby J. J. G. Reijmer and F. Fournier are acknow-ledged with thanks.
REFERENCES
Allan, J.R. and Mathews, R.K. (1982) Isotope signatures
associated with early meteoric diagenesis. Sedimentology,
29, 797–817.
Anselmetti, F.S. and Eberli, G.P. (2001) Sonic velocity in
carbonates – a combined product of depositional lithology
and diagenetic alterations. In: Subsurface Geology of a
Prograding Carbonate Platform Margin, Great Bahama
Bank: Results of the Bahamas Drilling Project (Ed. R.N.
Ginsburg), SEPM Spec. Publ., 70, 193–216.
Anselmetti, F.S., Luthi, S. and Eberli, G.P. (1998) Quantitative
characterization of carbonate pore systems by digital image
analysis. AAPG Bull., 82, 1815–1836.
Betzler, C., Kroon, D. and Reijmer, J.J.G. (2000) Synchroneity of
major late Neogene sea level fluctuations and paleoceani-
1316 S. N. Ehrenberg et al.
� 2006 The Authors. Journal compilation � 2006 International Association of Sedimentologists, Sedimentology, 53, 1289–1318
graphically controlled changes as recorded by two carbonate
platforms. Paleoceanography, 15, 722–730.
Bourbie, T. and Zinszner, B. (1985) Hydraulic and acoustic
properties as a function of porosity in Fontainebleau
Sandstone. J. Geophys. Res., 90, 11524–11532.
Brachert, T.C. and Dullo, W.-C. (2000) Shallow burial dia-
genesis of skeletal carbonates: selective loss of aragonite
shell material (Miocene to Recent, Queensland Plateau and
Queensland Trough, NE Australia) – implications for shal-
low cool-water carbonates. Sed. Geol., 136, 169–187.
Budd, D.A. (2002) The relative roles of compaction and early
cementation in the destruction of permeability in carbonate
grainstones: a case study from the Paleogene of west-central
Florida, U.S.A. J. Sed. Res., 72, 116–128.
Cander, H.S. (1995) Interplay of water–rock interaction effi-
ciency, unconformities, and fluid flow in a carbonate aqui-
fer: Floridan Aquifer system. In: Unconformities in
Carbonate Strata – Their Recognition and the Significance
of Associated Porosity (Eds D.A. Budd, A.H. Saller and
P.M. Harris), AAPG Mem., 63, 103–124.
Carannante, G., Esteban, M., Milliman, J.D. and Simone, L.(1988) Carbonate lithofacies as paleolatitude indicators:
problems and limitations. Sed. Geol., 60, 333–346.
Dawans, J.M. and Swart, P.K. (1988) Textural and geochemi-
cal alterations in Late Cenozoic Bahamian dolomites. Sedi-
mentology, 35, 385–403.
Delius, H., Eberli, G.P. and Bracco Gartner, G.L. (2005) Se-
quence stratigraphic significance of uranium anomalies in
carbonate rocks, ODP Leg 194 (abstract). British Sedimen-
tary Research Group Annual General Meeting, Leeds.
Dolan, P.J. and Hermany (1988) The geology of the Wiriagar
field, Bintuni basin, Irian Jaya. Indonesian Petrol. Assoc.
17th Annu. Conv. Proc., 1, 53–87.
Ehrenberg, S.N. (1990) Relationship between diagenesis and
reservoir quality in sandstones of the Garn Formation,
Haltenbanken, mid-Norwegian continental shelf. AAPG
Bull., 74, 1538–1558.
Ehrenberg, S.N. (2004) Porosity and permeability in Miocene
carbonate platforms on the Marion Plateau, offshore NE
Australia: relationships to stratigraphy, facies and dolomi-
tization. In: The Geometry and Petrogenesis of DolomiteHydrocarbon Reservoirs (Eds C.J.R. Braithwaite, G. Rizzi
and G. Darke), Geol. Soc. London Spec. Publ., 235, 233–253.
Ehrenberg, S.N. and Dickson, J.A.D. (2003) Miocene carbonate
platforms of the Marion Plateau, offshore NE Australia:
contrasting styles of cathodoluminescence, geochemistry,
dolomitization, architecture, and biota related to differing
degrees of platform isolation (abstract). In: 12th BathurstMeeting, International Conference of Carbonate Sedimen-
tology, Durham, 8–10 July (Programme and Abstracts).
Ehrenberg, S.N., Pickard, N.A.H., Svana, T.A. and Oxtoby,N.H. (2002) Cement geochemistry of photozoan carbonate
strata (Upper Carboniferous–Lower Permian), Finnmark
carbonate platform, Barents Sea. J. Sed. Res., 72, 95–115.
Ehrenberg, S.N., Eberli, G.P. and Bracco Gartner, G.L. (2003)
Data report: porosity and permeability of Miocene carbonate
platforms on the Marion Plateau, ODP Leg 194. In: Pro-
ceedings of the Ocean Drilling Program, Scientific Results,
194 (Eds F.S. Anselmetti, A.R. Isern, P. Blum and C. Betzler),
<http://www-odp.tamu.edu/publications/194_SR/007/007.
htm>.
Ehrenberg, S.N., McArthur, J.M. and Thirlwall, M.F. (2006a)
Strontium-isotope dating of Miocene carbonate platforms
on the Marion Plateau, offshore NE Australia. J. Sed. Res.,
76, 91–116.
Ehrenberg, S.N., Eberli, G.P., Keramati, M. and Moallemi, A.(2006b) Permeability–porosity relationships in interbedded
limestone–dolostone reservoirs. AAPG Bull., 90, 91–114.
Enos, P. and Sawatsky, L.H. (1981) Pore networks in Holocene
carbonate sediments. J. Sed. Petrol., 51, 961–986.
Epting, M. (1980) Sedimentology of Miocene carbonate
buildups, central Luconia, offshore Sarawak. Bull. Geol.
Soc. Malaysia, 12, 17–30.
Fournier, F., Montaggioni, L. and Borgomano, J. (2004)
Paleoenvironments and high-frequency cyclicity from
Cenozoic south-east Asian shallow-water carbonates: a case
study from the Oligo-Miocene buildups on Malampaya
(offshore Palawan, Philippines). Mar. Petrol. Geol., 21, 1–21.
Fuchtbauer, H. (1967) Influence of different types of diagen-
esis on sandstone porosity. Proc. 7th World Petrol. Cong., 2,353–369.
Glenn, C.R. and Kronen, J.D. (1993) Origin and significance of
late Pliocene phosphatic hardgrounds on the Queensland
Plateau, northeastern Australian margin. In: Proc. ODP Sci.Results (Eds J.A. McKenzie, P.J. Davies and A. Palmer-
Julson), 133, 525–534.
Grange, A.M. and Davies, K.G. (1985) Reef exploration in the
East Sengkang Basin, Sulawesi, Indonesia. Mar. Petrol.
Geol., 2, 142–155.
Heubeck, C., Story, K., Peng, P., Sullivan, C. and Duff, S.(2004) An integrated reservoir study of the Liuhua 11-1
Field using a high-resolution three-dimensional seismic
data set. In: Seismic Imaging of Carbonate Reservoirs and
Systems (Eds G.P. Eberli, J.L. Massaferro and J.F. Sarg),
AAPG Mem., 81, 149–168.
Hostetler, P.B. and Garrels, R.M. (1962) Transport and preci-
pitation of uranium and vanadium at low temperatures,
with special reference to sandstone-type uranium deposits.
Econ. Geol., 57, 137–167.
Immenhauser, A., Creusen, A., Esteban, M. and Vonhof, H.(2000) Recognition and interpretation of polygenetic dis-
conformity surfaces in the middle Cretaceous huaiba, Nahr
Umr, and Natih Formations of northern Oman. GeoArabia,
5, 299–322.
Isern, A.R., McKenzie, J.A. and Feary, D.A. (1996) The role of
sea-surface temperature as a control on carbonate platform
development in the western Coral Sea. Palaeogeogr.
Palaeoclimatol. Palaeoecol., 124, 247–272.
Isern, A.R., Anselmetti, F.S. and Blum, P. (2001) Ocean
drilling constrains carbonate platform formation and Mio-
cene sea level on the Australian margin. EOS, 82, 469–476.
Isern, A.R., Anselmetti, P. and Blum, P. (2002) Proceedings of
the Ocean Drilling Program, Initial Reports, Vol. 194. Ocean
Drilling Program, College Station, TX.
Isern, A.R., Anselmetti, F.S. and Blum, P. (2004) A Neogene
carbonate platform, slope and shelf edifice shaped by sea
level and ocean currents, Marion Plateau (NE Australia). In:
Seismic Imaging of Carbonate Reservoirs and Systems (Eds
G.P. Eberli, J.L. Massaferro and J.F. Sarg), AAPG Mem., 81,133–148.
James, N.P. and Choquette, P.W. (1983) Diagenesis 6. Lime-
stones – the sea floor diagenetic environment. Geosci. Can.,
10, 162–179.
James, N.P., Bone, Y. and Kyser, T.K. (2005) Where has all the
aragonite gone? Mineralogy of Holocene neritic cool-water
carbonates, southern Australia. J. Sed. Res., 75, 454–463.
Jordan, C.F., Jr and Abdullah, M. (1992) Arun Field –
Indonesia, North Sumatra Basin, Sumatra. In: Atlas of Oiland Gas Fields, Stratigraphic Traps III (Eds N.F. Foster
Porosity–permeability relationships in Miocene carbonate platforms 1317
� 2006 The Authors. Journal compilation � 2006 International Association of Sedimentologists, Sedimentology, 53, 1289–1318
and E.A. Beaumont), AAPG, Treatise of Petroleum Geol-
ogy, 1–39.
Kindler, P., Ruchonnet, C. and White, T. (2006) The Southern
Marion Platform (Marion Plateau, NE Australia) during the
early Pliocene: a lowstand-producing, temperate-water
carbonate factory. In: Cool-Water Carbonates: Deposi-
tional Systems and Palaeonvironmental Controls (Eds
H.M. Pedley and G. Carannante), Geol. Soc. London Spec.Publ., 255, 271–284.
Kusumastuti, A., Van Rensbergen, P. and Warren, K.J. (2002)
Seismic sequence analysis and reservoir potential of
drowned Miocene carbonate platforms in the Madura Strait,
East Java, Indonesia. AAPG Bull., 86, 213–232.
Langmuir, D. (1978) Uranium solution – mineral equilibria at
low temperatures with applications to sedimentary ore
deposits. Geochim. Cosmochim. Acta, 42, 547–569.
Lucia, F.J. (1995) Rock-fabric/petrophysical classification of
carbonate pore space for reservoir characterization. AAPG
Bull., 79, 1275–1300.
Lucia, F.J. and Major, R.P. (1994) Porosity evolution
through hypersaline reflux dolomitization. In: Dolomites a
Volume in Honour of Dolomieu (Eds B. Purser, M. Tucker
and D. Zenger), Int. Assoc. Sedimentol. Spec. Publ., 21,325–341.
Mayall, M.J. and Cox, M. (1988) Deposition and diagenesis of
Miocene limestones, Senkang Basin, Sulawesi, Indonesia.
Sed. Geol., 59, 77–92.
Mayall, M.J., Bent, A. and Roberts, D.M. (1997) Miocene car-
bonate buildups offshore Socialist Republic of Vietnam. In:
Petroleum Geology of Southeast Asia (Eds A.J. Fraser,
S.J. Matthews and R.W. Murphy), Geol. Soc. London Spec.
Publ., 126, 117–120.
Melim, L.A. (1996) Limitations on lowstand meteoric diagen-
esis in the Pliocene–Pleistocene of Florida and Great
Bahama Bank: implications for eustatic sea-level models.
Geology, 24, 893–896.
Melim, L.A., Anselmetti, F.S. and Eberli, G.P. (2001) The
importance of pore type on permeability of Neogene car-
bonates, Great Bahama Bank. In: Subsurface Geology of a
Prograding Carbonate Platform Margin, Great Bahama
Bank: Results of the Bahamas Drilling Project (Ed. R.N.
Ginsburg), SEPM Spec. Publ., 70, 217–238.
Melim, L.A., Westphal, H., Swart, P.K., Eberli, G.P. and
Munnecke, A. (2002) Questioning carbonate diagenetic
paradigms: evidence from the Neogene in the Bahamas.
Mar. Geol., 185, 27–53.
Moldovanyi, E.P., Wall, F.M. and Yan, Z.J. (1995) Regional
exposure events and platform evolution of Zhujiang For-
mation carbonates, Pearl River Mouth Basin: evidence from
primary and diagenetic facies. In: Unconformities and
Porosity in Carbonate Strata (Eds D.A. Budd, A.H. Saller
and P.M. Harris), AAPG Mem., 63, 125–140.
Moore, C.H. (2001) Carbonate Reservoirs Porosity Evolution
and Diagenesis in a Sequence Stratigraphic Framework.
Elsevier, Amsterdam, 444 pp.
Murray, R.C. (1960) Origin of porosity in carbonate rocks.
J. Geophys. Petrol., 30, 59–84.
Myers, K.J. and Wignall, P.B. (1987) Understanding Jurassic
organic-rich mudrocks – new concepts using gamma-ray
spectrometry and palaeoecology: examples from the Kim-
meridge Clay of Dorset and the Jet Rock of Yorkshire. In:
Marine Clastic Sedimentology (Eds J.K. Legget and G.G.
Zuffa), pp. 172–189, Graham and Trotman, London.
Nelson, P.H. (1994) Permeability–porosity relationships in
sedimentary rocks. Log Anal., May–June, 38–62.
Park, R.K., Matter, A. and Tonkin, P.C. (1995) Porosity evo-
lution in the Batu Raja carbonates of the Sunda Basin –
windows of opportunity. Indonesia Petrol. Assoc. 24th
Annu. Conv. Proc., 163–184.
Pomar, L., Brandano, M. and Westphal, H. (2004) Environ-
mental factors influencing skeletal grain sediment associa-
tions: a critical review of Miocene examples from the
western Mediterranean. Sedimentology, 51, 627–651.
Reid, R.P. and MacIntyre, I.G. (2000) Microboring versus
recrystallization: further insight into the micritization pro-
cess. J. Sed. Res., 70, 24–28.
Robinson, R.B. (1967) Diagenesis and porosity development in
Recent and Pleistocene oolites from southern Florida and
the Bahamas. J. Sed. Petrol., 37, 355–364.
Saller, A. and Vijaya, S. (2002) Depositional and diagenetic
history of the Kerendan carbonate platform, Oligocene,
central Kalimantan, Indonesia. J. Petrol. Geol., 25, 123–150.
Saller, A., Armin, R., Ichram, L.O. and Glenn-Sullivan, C.(1993) Sequence stratigraphy of aggrading and backstepping
carbonate shelves, Oligocene, central Kalimantan, Indone-
sia. In: Carbonate Sequence Stratigraphy; Recent Develop-
ments and Applications (Eds R.G. Loucks and J.F. Sarg),
AAPG Mem., 57, 267–290.
Swart, P.K. and Melim, L.A. (2000) The origin of dolomites in
Tertiary sediments from the margin of the Great Bahama
Bank. J. Sed. Res., 70, 738–748.
Vahrenkamp, V.C., David, F., Duijndam, P., Newall, M. and
Crevello, P. (2004) Growth architecture, faulting, and kars-
tification of a middle Miocene carbonate platform, Luconia
Province, offshore Sarawak, Malaysia. In: Seismic Imagingof Carbonate Reservoirs and Systems (Eds G.P. Eberli,
J.L. Massaferro and J.F. Sarg), AAPG Mem., 81, 329–350.
Vasconcelos, C., McKenzie, J.A., Warthmann, R. and Ber-nasconi, S.M. (2005) Calibration of the d18O paleothermo-
meter for dolomite precipitated in microbial cultures and
natural environments. Geology, 33, 317–320.
Warren, J. (2000) Dolomite: occurrence, evolution and eco-
nomically important associations. Earth-Sci. Rev., 52, 1–81.
Weger, R., Baechle, G., Massaferro, J.-L. and Eberli, G.P.(2004) Effects of pore structure on sonic velocity in car-
bonates. Ext. Abstract, 74th Annual SEG Meeting, Dallas.
Wei, W. (2004) Data report: Calcareous nannofossil biostrati-
graphy of ODP Site 1193 seaward of the Great Barrier Reef.
In: Proceedings of the Ocean Drilling Program, Scientific
Results, 194 (Eds F.S. Anselmetti, A.R. Isern, P. Blum and C.
Betzler), <http://www-odp.tamu.edu/publications/194_SR/
002/002.htm>.
Wilson, M.E.J. (2002) Cenozoic carbonates in southeast Asia:
implications for equatorial carbonate development. Sed.
Geol., 147, 295–428.
Wilson, M.E.J. and Evans, M.J. (2002) Sedimentology and
diagenesis of Tertiary carbonates on the Mangkalihat Pen-
insula, Borneo: implications for subsurface reservoir qual-
ity. Mar. Petrol. Geol., 19, 873–900.
Wilson, M.E.J. and Vecsei, A. (2005) The apparent paradox of
abundant foramol facies in low latitudes: their environ-
mental significance and effect on platform development.
Earth-Sci. Rev., 69, 133–168.
Zachos, J., Pagani, M., Sloan, L., Thomas, E. and Billups, K.(2001) Trends, rhythms and aberrations in global climate
65 Ma to present. Science, 292, 686–693.
Manuscript received 5 August 2005; revision accepted22 June 2006
1318 S. N. Ehrenberg et al.
� 2006 The Authors. Journal compilation � 2006 International Association of Sedimentologists, Sedimentology, 53, 1289–1318