population synthesis of inss. population synthesis in astrophysics a population synthesis is a...
Post on 21-Dec-2015
219 views
TRANSCRIPT
Population synthesis of INSs

Population synthesis in astrophysics
A population synthesis is a method of a direct modeling of
relatively large populations of weakly interacting objects with non-trivial evolution.
As a rule, the evolution of the objects is followed from their birth up to the present moment.
(see astro-ph/0411792)
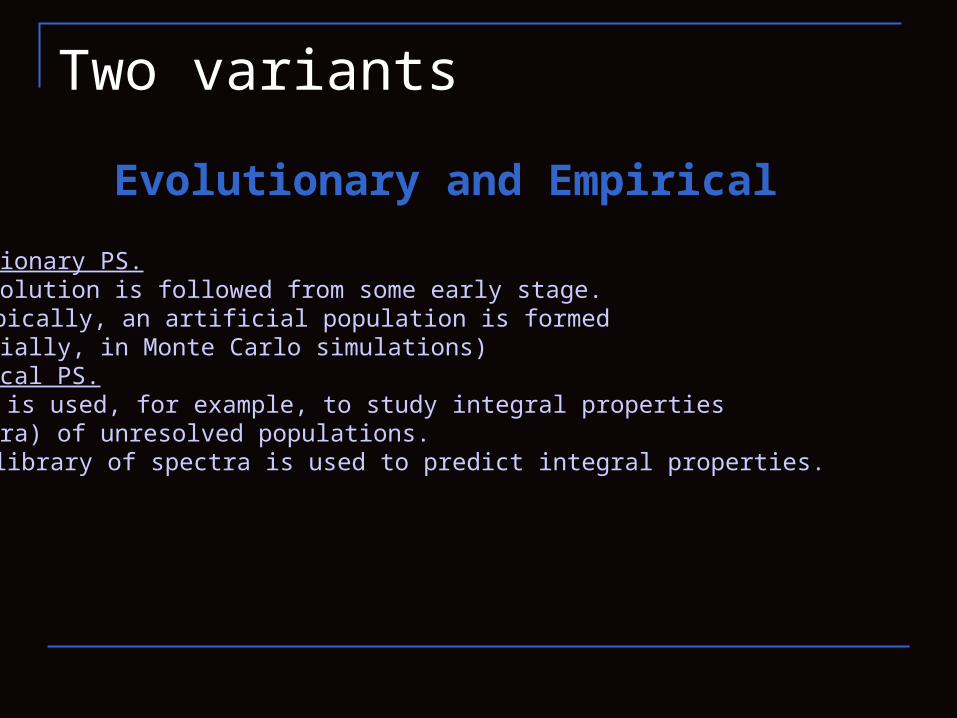
Two variants
Evolutionary and Empirical
1. Evolutionary PS.The evolution is followed from some early stage.
Typically, an artificial population is formed(especially, in Monte Carlo simulations)
2. Empirical PS. It is used, for example, to study integral properties
(speсtra) of unresolved populations. A library of spectra is used to predict integral properties.

Empirical population synthesis
1103.5226
Ionizing backgroundfrom QSO (left dashed)and galaxies (right dashed).
Data corresponds to theLy-alpha forest observations.

Population synthesisIngredients:- initial condition- evolutionary laws
Modeling observations
«Artificial universe»«Artificialobserved universe»

Why PS is necessary?
1. No direct experiments computer experiments
2. Long evolutionary time scales
3. Selection effects. We see just a top of an iceberg.
4. Expensive projects for which it is necessary to make predictions

Tasks1. To test and/or to determine initial and evolutionary parameters. To do it one has to compare calculated and observed populations. This task is related to the main pecularity of astronomy:
we cannot make direct experiments under controlled conditions.
2. To predict properties of unobserved populations. Population synthesis is actively use to define programs for future
observational projects: satellites, telescopes, etc.

Examples
1. PS of radiopulsars2. PS of gamma-ray pulsars3. PS of close-by cooling NSs4. PS of isolated NSs

Magnetorotational evolution of radio pulsars
Spin-down.Rotational energy is released.The exact mechanism is still unknown.

Population synthesis of radio pulsars
(following Faucher-Giguere and Kaspi astro-ph/0512585)
The idea was to make an advance population synthesis study of normalradio pulsar to reproduce the data observed in PMBPS and Swinburne.Comparison between actual data and calculations should help to understandbetter the underlying parameters and evolution laws.
Only normal (non-millisecond, non-binary, etc.) pulsars are considered.Note, however, that the role of pulsars originated in close binaries can be important.
Ingredients• Velocity distribution• Spatial distribution• Galactic model• Initial period distribution• Initial magnetic field distribution• Field evolution (and angle)• Radio luminosity• Dispersion measure model• Modeling of surveys
The observed PSR sample is heavily biased.It is necessary to model the process of detection,i.e. to model the same surveys in the synthetic Galaxy.A synthetic PSR is detected if it appears in thearea covered by on pf the survey, and if itsradio flux exceeds some limit.
2/3 of known PSRs were detected in PMBPSor/and SM (914 and 151).
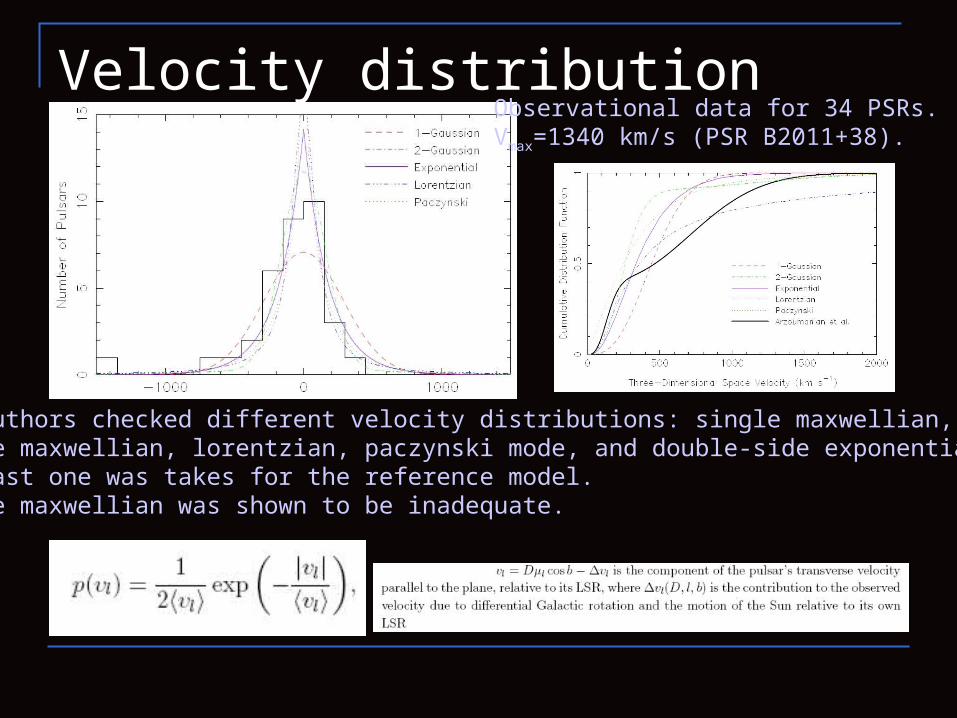
Velocity distributionObservational data for 34 PSRs.Vmax=1340 km/s (PSR B2011+38).
The authors checked different velocity distributions: single maxwellian,double maxwellian, lorentzian, paczynski mode, and double-side exponential.The last one was takes for the reference model.Single maxwellian was shown to be inadequate.
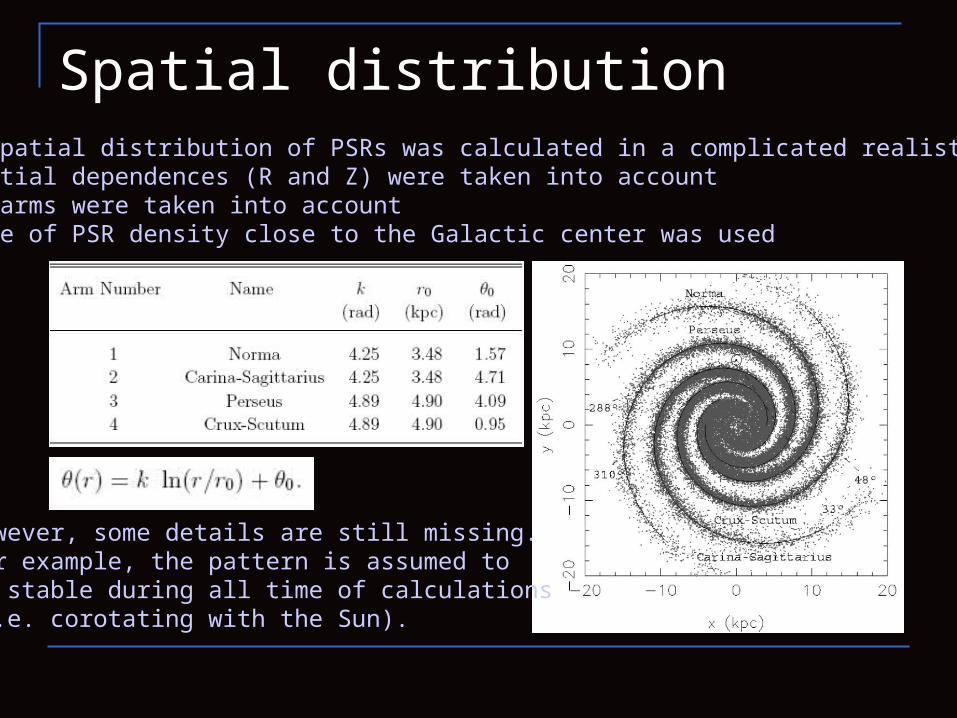
Spatial distributionInitial spatial distribution of PSRs was calculated in a complicated realistic way.• exponential dependences (R and Z) were taken into account• Spiral arms were taken into account• Decrease of PSR density close to the Galactic center was used
However, some details are still missing.For example, the pattern is assumed tobe stable during all time of calculations(i.e. corotating with the Sun).

Galactic potentialThe potential was taken from Kuijken and Gilmore (1989):• disc-halo• bulge• nuclei

Initial spin periods and fieldsSpin periods were randomly taken from a normal distribution.Magnetic fields – also from a normal distribution for log B.
The authors do not treat separately the magnetic field and inclination angle evolution.
Purely magneto-dipole model with n=3 and sin χ=1 is used.RNS=106 cm, I=1045.
The death-line is taken in the usual form:
P~(P20+K t)1/2
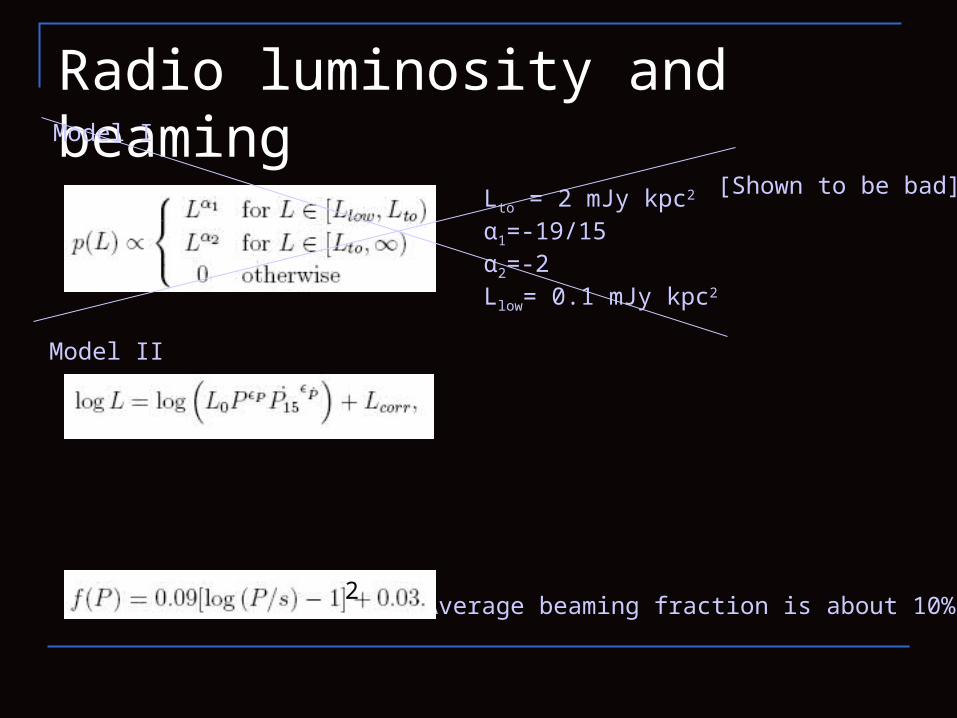
Radio luminosity and beaming
Average beaming fraction is about 10%2
Lto = 2 mJy kpc2 α1=-19/15 α2=-2Llow= 0.1 mJy kpc2
Model I
Model II
[Shown to be bad]

Optimal model and simulations The code is run till the number of “detected”
synthetic PSR becomes equal tothe actual number of detected PSRs in PBMPS and SM.
For each simulation the “observed” distributions of b,l, DM, S1400, P, and B,are compared with the real sample.
It came out to be impossible to to apply only statistical tests.Some human judgement is necessary for interpretation.

Results
Solid lines – calculation, hatched diagrams - real observations
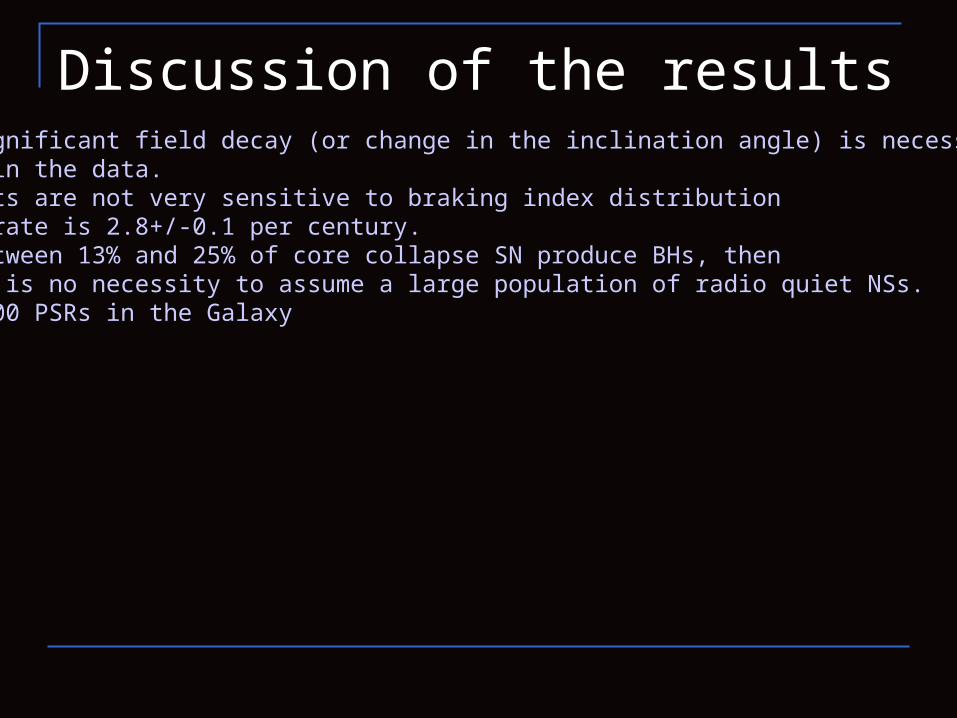
Discussion of the results1. No significant field decay (or change in the inclination angle) is necessary to
explain the data.2. Results are not very sensitive to braking index distribution3. Birthrate is 2.8+/-0.1 per century.
If between 13% and 25% of core collapse SN produce BHs, thenthere is no necessity to assume a large population of radio quiet NSs.120 000 PSRs in the Galaxy
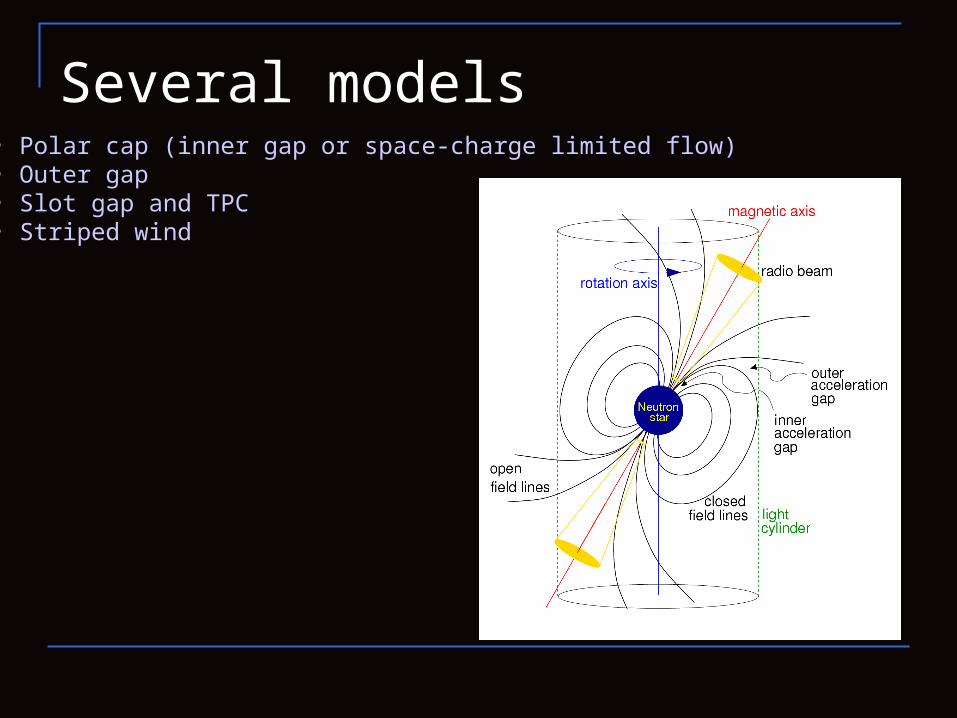
Several models• Polar cap (inner gap or space-charge limited flow)• Outer gap• Slot gap and TPC• Striped wind
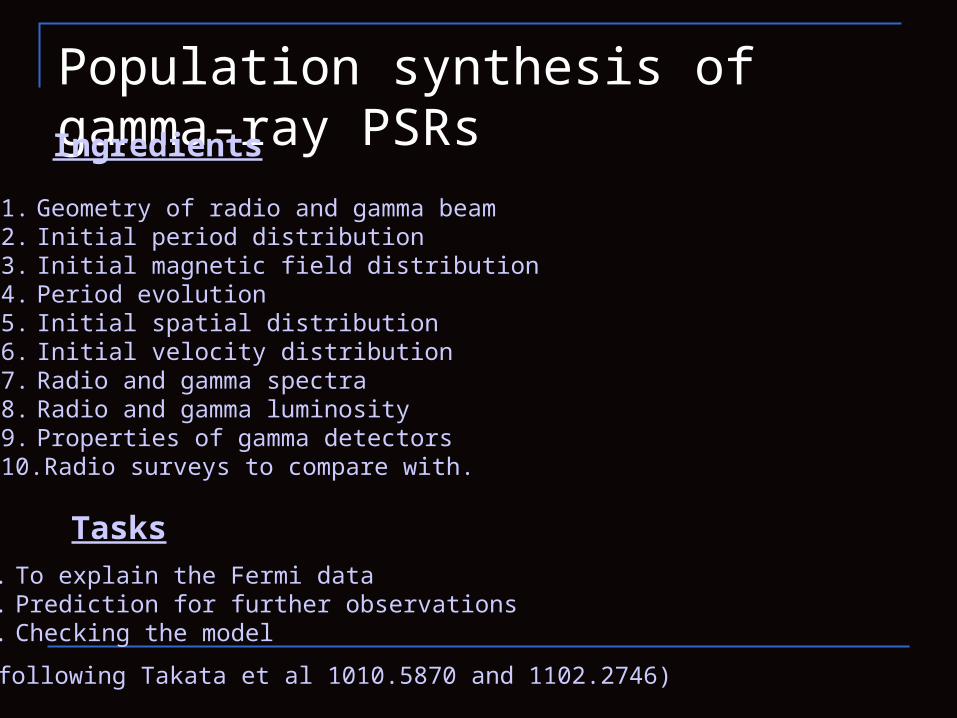
Population synthesis of gamma-ray PSRs
(following Takata et al 1010.5870 and 1102.2746)
Ingredients
1. Geometry of radio and gamma beam2. Initial period distribution3. Initial magnetic field distribution4. Period evolution5. Initial spatial distribution6. Initial velocity distribution7. Radio and gamma spectra8. Radio and gamma luminosity9. Properties of gamma detectors10.Radio surveys to compare with.
Tasks
1. To explain the Fermi data2. Prediction for further observations3. Checking the model

EGRET legacyJust 6 pulsars:
• Crab• Geminga• Vela• PSR B1055-52• PSR B1706-44 • PSR B1951+32
Nolan et al. 1996astro-ph/9607079
(plus one by COMPTEL)
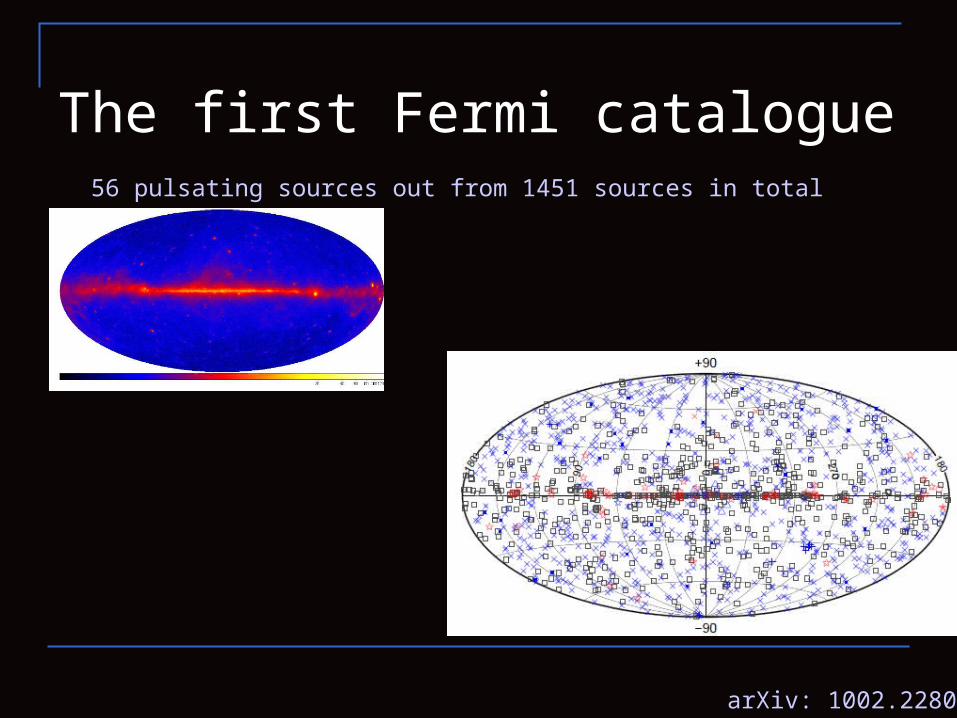
The first Fermi catalogue56 pulsating sources out from 1451 sources in total
arXiv: 1002.2280

P-Pdot diagram
arXiv: 1007.2183
63 PSRs detected by Fermi

Galactic map
arXiv:0910.1608

Fermi data: summary- 63 clearly detected pulsating PSRs: ~20 radio selected (with 7 known from CGRO time) 24 – in blind searches (several detected also in radio) 27 - mPSRs- 18 mPSRs candidates from radio (non-pulsating in gamma)
About radio pulsar populationsee Lorimer arXiv: 1008.1928
The outer gap models seems to bemore probable on the base of Fermi data.
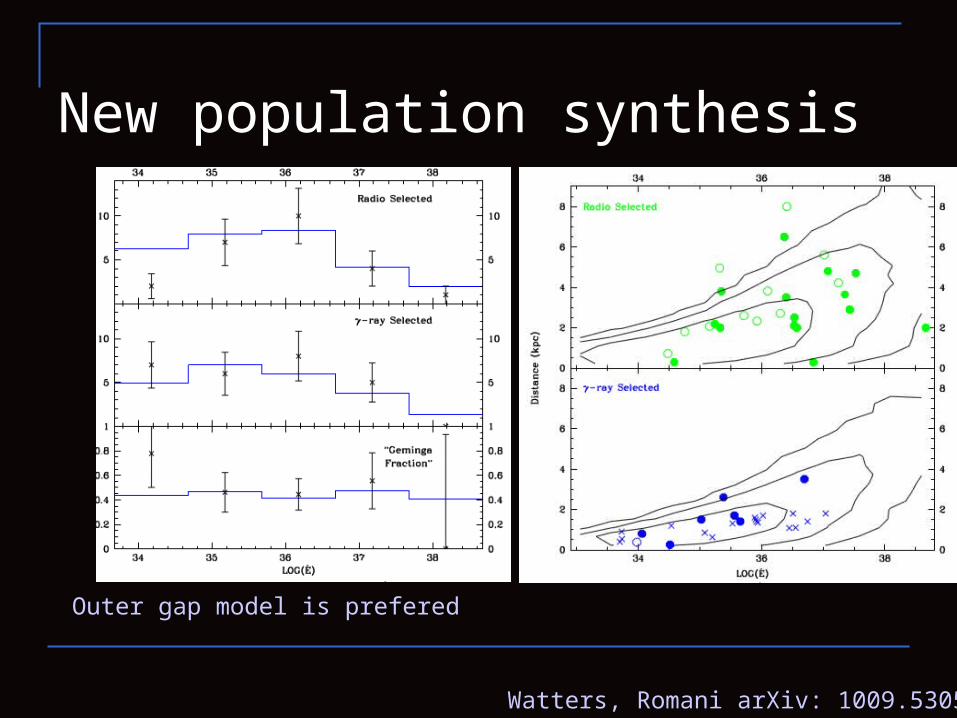
New population synthesis
Watters, Romani arXiv: 1009.5305
Outer gap model is prefered

Gamma-ray pulsar population synhesis with the outer gap model: spin periods
1010.5870
Standard constant field magneto-dipole formula with constant angle

Initial spatial and velocity distributions
Plus galactic potential and circular velocity

Radio emission and beaming
L400=d2 S400
Beaming:

Radio detection and surveys
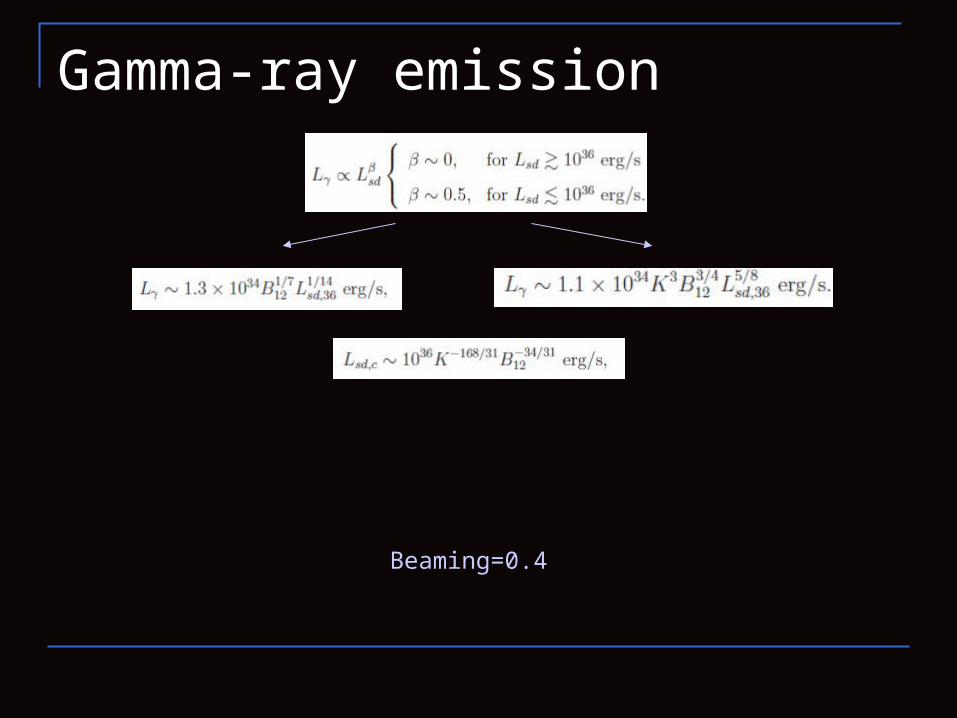
Gamma-ray emission
Beaming=0.4

ResultsBirth rate: ~1.3 per century

ResultsRadio selected Gamma-ray selected

Predictions for lower fluxes

Millisecond pulsars
1102.2746
Radio observed

Millisecond pulsars
Radio detected

Prediction for low fluxes

Population of close-by young NSs
Magnificent seven Geminga and 3EG J1853+5918 Four radio pulsars with thermal emission
(B0833-45; B0656+14; B1055-52; B1929+10)
Seven older radio pulsars, without detected thermal emission.
To understand the origin of these populations and predict future detectionsit is necessary to use population synthesis.

Population synthesis: ingredients
Birth rate of NSs Initial spatial distribution Spatial velocity (kick) Mass spectrum Thermal evolution Interstellar absorption Detector properties
To build an artificial model
of a population of some astrophysical sources and
to compare the results ofcalculations with observations.
Task:

Gould Belt : 20 NS Myr-1
Gal. Disk (3kpc) : 250 NS Myr-1
Arzoumanian et al. 2002
ROSAT
• Cooling curves by• Blaschke et al. • Mass spectrum
18°Gould BeltGould Belt
Population synthesis – I.

Solar vicinity
Solar neighborhood is not a typical region of our Galaxy
Gould Belt R=300-500 pc Age: 30-50 Myrs 20-30 SN per Myr (Grenier 2000) The Local Bubble Up to six SN in a few Myrs

The Gould Belt
Poppel (1997) R=300 – 500 pc Age 30-50 Myrs Center at 150 pc from the
Sun Inclined respect to the
galactic plane at 20 degrees 2/3 massive stars in 600 pc
belong to the Belt

Mass spectrum of NSs
Mass spectrum of local young NSs can be different from the general one (in the Galaxy)
Hipparcos data on near-by massive stars
Progenitor vs NS mass: Timmes et al. (1996); Woosley et al. (2002)
astro-ph/0305599

Woosley et al. 2002
Progenitor mass vs. NS massProgenitor mass vs. NS mass
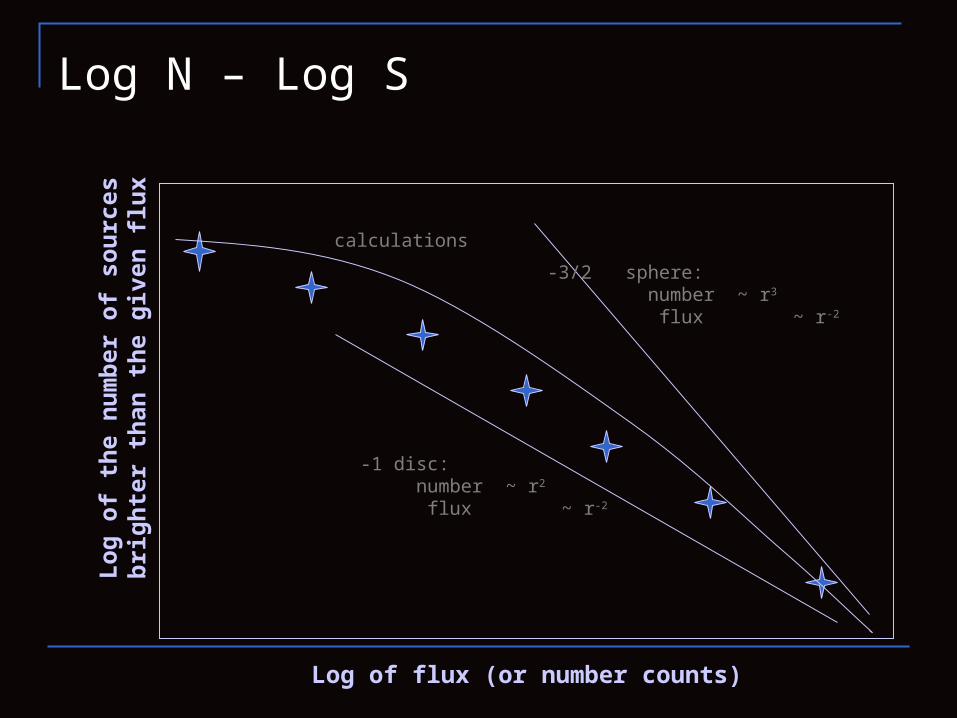
Log N – Log S
Log of flux (or number counts)
Lo
g o
f th
e n
um
ber
of
sou
rces
bri
gh
ter
than
th
e g
iven
flu
x
-3/2 sphere: number ~ r3
flux ~ r-2
-1 disc: number ~ r2
flux ~ r-2
calculations
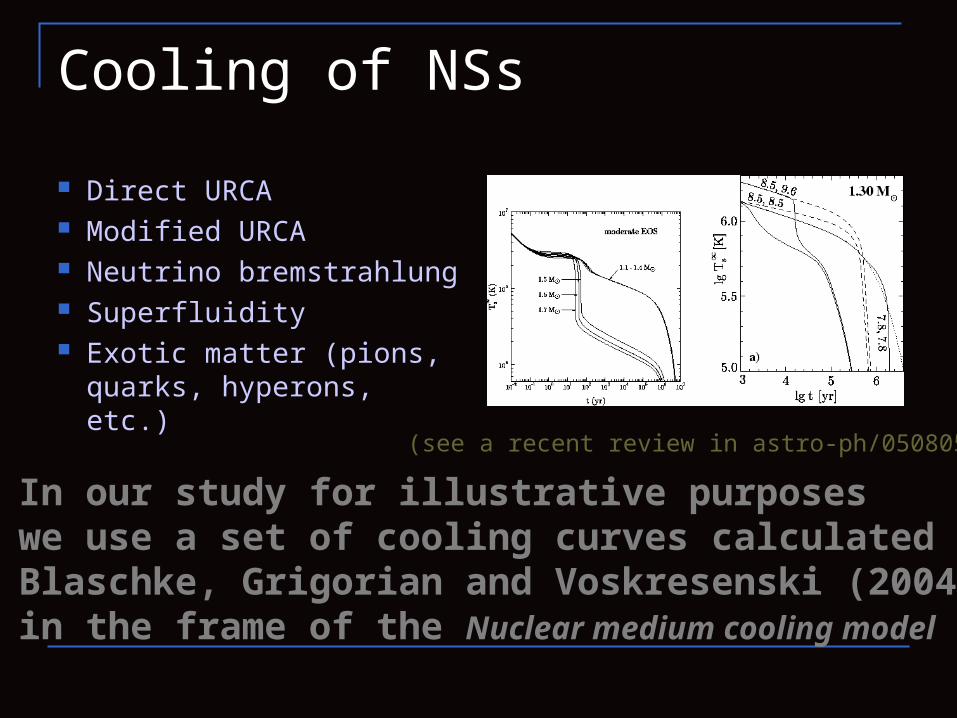
Cooling of NSs
Direct URCA Modified URCA Neutrino bremstrahlung Superfluidity Exotic matter (pions,
quarks, hyperons, etc.)
In our study for illustrative purposeswe use a set of cooling curves calculated by Blaschke, Grigorian and Voskresenski (2004)in the frame of the Nuclear medium cooling model
(see a recent review in astro-ph/0508056)

Some results of PS-I:Log N – Log S and spatial distribution
(Popov et al. 2005 Ap&SS 299, 117)
More than ½ are in+/- 12 degrees from the galactic plane.19% outside +/- 30o
12% outside +/- 40o
Log N – Log S for close-by ROSAT NSs can be explained by standard cooling curves taking into account the Gould Belt.
Log N – Log S can be used as an additional
test of cooling curves

1. Spatial distribution of progenitor stars
a) Hipparcos stars up to 500 pc[Age: spectral type & cluster age (OB
ass)]b) 49 OB associations: birth rate ~
Nstar
c) Field stars in the disc up to 3 kpc
Population synthesis – II.recent improvements
We use the same normalization for NS formation rate inside 3 kpc: 270 per Myr.
Most of NSs are born inOB associations.
For stars <500 pc we eventry to take into accountif they belong to OB assoc.with known age.

Effects of the new spatial distribution on Log N – Log S
Solid – new initial XYZDashed – Rbelt = 500 pcDotted – Rbelt = 300 pc
There are no significanteffects on the Log N – Log Sdistribution due to moreclumpy initial distributionof NSs.

Standard test: temperature vs. age
Kaminker et al. (2001)

Log N – Log S as an additional testLog N – Log S as an additional test
Standard test: Age – Temperature Sensitive to ages <105 years Uncertain age and temperature Non-uniform sample
Log N – Log S Sensitive to ages >105 years (when applied to close-by NSs) Definite N (number) and S (flux) Uniform sample
Two test are perfect together!!!
astro-ph/0411618

Isolated neutron star censusTask.To calculate distribution of isolated NSs in the Galaxy over evolutionary stages: Ejector, Propeller, Accretor, Georotator
Ingredients.
• Galactic potential• Initial NS spatial distribution• Kick velocity• ISM distribution• Spin evolution and critical periods• Magnetic field distribution and evolution

Stages
astro-ph/9910114
Rather conservativeevolutionary schemewas used.
For example,subsonic propellershave not been considered (Ikhsanov 2006).

Accreting isolated NSsAt small fluxes <10-13 erg/s/cm2 accretors can become more abundantthan coolers. Accretors are expected to be slightly harder:300-500 eV vs. 50-100 eV. Good targets for eROSITA!
From several hundreds up toseveral thousands objectsat fluxes about few X 10-14, but difficult to identify.
Monitoring is important.
Also isolated accretors canbe found in the Galactic center(Zane et al. 1996, Deegan, Nayakshin 2006).
astro-ph/0009225 New results in 1004.4805

Extensive population synthesis
We want to make extensive population synthesis studies using as many approaches as we can to confront theoretical models
with different observational data
Log N – Log S for close-by young cooling isolated neutron stars Log N – Log L distribution for galactic magnetars P-Pdot distribution for normal radio pulsars
MNRAS (2009) arXiv: 0910.2190

Extensive population synthesis:M7, magnetars, PSRs
M7M7
Magnetars
PSRs
Using one populationit is difficult or impossibleto find unique initialdistribution for themagnetic field
All three populations are compatible with a unique distribution.Of course, the resultis model dependent.
PSRs

Results There are several different populations of neutron stars
which must be studied together in one framework Population synthesis calculations are necessary
to confront theoretical models with observations We use different approaches to study different populations
using the same parameters distribution In the model with magnetic field decay we focused on
log-normal distributions of initial magnetic fields We can describe properties of several populations
◊ close-by cooling NSs ◊ magnetars ◊ normal PSRs with the same log-normal magnetic field distribution
Best model: <log(B0/[G])>= 13.25, σlogB0=0.6, <P0>= 0.25 s, σP0 = 0.1 s
We exclude distributions with >~20% of magnetars Populations with ~10% of magnetars are favoured

Conclusions• Population synthesis is a useful tool in astrophysics• Many theoretical parameters can be tested only via such modeling• Many parameters can be determined only via PS models • Actively used to study NSs

Papers to read
• Physics Uspekhi 50, 1123 (2007) – see my web-page http://xray.sai.msu.ru/~polar/html/presentations.html• arXiv: 0903.1905