population pharmacokinetics of sirolimus in kidney transplant patients*
TRANSCRIPT

Population pharmacokinetics of sirolimus in kidney transplant patients
Objectire: To characterize the dose-related pharmacokinetics of the immunosuppressant agent sirolimus (formerly rapamycin) in kidney transplant patients by use of two-stage and nonlinear mixed-effect model population methods. Methods: Patients ( H = 36) from three centers (Germany, the United Kingdom, and Sweden) who received steady-state oral doses of cyclosporine (ciclosporin) were assessed after single oral administration of siroliius at doses of 3, 510, and 15 mg/m2. Plasma and whole blood sirolimus samples were analyzed by a high-performance liquid chromatographic/mass spectrophotometric method. Simultaneous fitting used biexponential functions with intercept/slope or ckarance/volume terms, as well as first-order ab- sorption (kJ and a lag-time. Resa&: The nonlinear mixed-effect model method (P-Pharm) provided a better characterization of siroli- mus kinetics, especially for the absorption and distribution phases where fewer data were available per patient. Sirolimus distribution between whole blood and plasma was concentration-independent, with a mean blood/plasma ratio (coefficient of variation) of 30.9 (48.5%). Elimination was not influenced by dose, as shown by estimates of the terminal half-lie of 63 hours (27.5%) and apparent oral blood clearance of 8.9 L/hr (38.2%). Sirolimus distribution parameters were influenced by body weight and surface area. Sirolimus was rapidly absorbed, as shown by the absorption lag-time of 0.27 hour (35.1%), and k, of 2.77 hr-’ (48.4%). The concomitant administration of sirolhuus and cyclosporine did not reveal any pharma- cokinetic interactions. Conclzlsion: This report provides an initial population pharmacokinetics of sirolimus in kidney transplant recipients receiving cyclosporine concurrently. Siroliius blood and plasma pharmacokinetics were biex- ponential and linear for doses from 3 to 15 mg/m”. No pharmacokinetic interaction was found between sirolimus and cyclosporine. (Clin Pharmacol Ther 1997;61:416-28.)
Geraldine M. Ferron, PharmD, Elena V. Mishina, PhD, James J. Zimmerman, PhD, and William J. Jusko, PhD Btifalo, N.Y., and Philadelphia, Pa.
Sirolimus (formerly rapamycin) is an immunosup- pressant* that is effective for the prevention of allo- graft rejection in experimental animals? The drug is more potent in vitro than cyclosporine (ciclo- sporin),3’4 and its cellular mechanism of action is different. Sirolimus has been shown to inhibit T-cell
From the Department of Pharmaceutics, School of Pharmacy, State University of New York at Buffalo, Buffalo, and the Clinical Pharmacokinetics Department, Wyeth-Ayerst Re- search Inc., Philadelphia.
Supported by Wyeth-Ayerst Research Inc., Philadelphia, Pa. Received for publication July 11, 1996; accepted Oct. 22, 1996. Reprint requests: William J. Jusko, PhD, 565 Hochstetter Hall,
Department of Pharmaceutics, State University of New York at Buffalo, Buffalo, NY 14260.
Copyright 0 1997 by Mosby-Year Book, Inc. 0009-9236/97/$5.00 + 0 13/l/78842
416
activation through suppression of interleukin-2 (IL-2) and interleukin-4 (IG4) driven T-cell prolif- eration, whereas cyclosporine inhibits T-cell stimu- lation by reduction of IL-2 production and interleu- kin receptor (IL2R) expression.2,5‘7 In vitro and in vivo studies have shown the synergistic interaction of the two drugs.8F9 The pharmacokinetics of cyclo- sporine is well characterized in humans,” whereas sirolimus disposition has been described preliminary in one group of patients.‘i Because the chemical structure and properties of sirolimus are similar to those of tacrolimus and cyclosporine, sirolimus hu- man disposition could be expected to include a large volume of distribution related to high tissue and red blood cell partitioning, extensive liver metabolism, intermediate to a long elimination half-life, and low oral bioavailability.10,12713

CLINICAL PHARMACOLOGY & THERAPEUTICS VOLUME 61, NUMBER 4 Fewon et al. 417
To optimize the clinical use and to minimize the risk of adverse events, pharmacokinetic studies of drugs must evaluate not only average population pharmacokinetic parameters but also their inter- patient variability. In addition, factors of demo- graphic (age and weight), environmental (food and study site), or drug-related (e.g., cyclospor- ine) origin that may influence patient exposure to the drug should be identified.r4,15 For these pur- poses, two analysis methods are commonly used: the two-stage method, which is the study of co- variable influences on parameters calculated by individual modeling; and the nonlinear mixed- effect model method (NMEM). The NMEM ap- proach is known to give better characterization of the interpatient variability in parameter values; the two-stage method usually overestimates the interpatient variabilities because of less accurate parameter estimation in phases where few data are available for each individual.
This study was designed to provide the popula- tion pharmacokinetic characteristics of sirolimus in patients with stable kidney transplants and to examine the effect of dose (3 to 15 mg/m’) on these characteristics. The mean and interpatient variability of each kinetic parameter for the ab- sorption, distribution, and elimination phases were calculated by use of the two-stage and NMEM methods. Initially, a polyexponential function was used to describe the time course of both plasma and blood concentrations simulta- neously. The resulting joint intercept and slope parameters were changed to clearance and vol- ume terms to make the population kinetic model more physiologically relevant. The influences of demographic (study center, age, and weight) and drug-related (cyclosporine administration) factors on the interpatient variability of various pharma- cokinetic parameters were then assessed.
METHODS Patient populations
Phase I oral safety and tolerance assessments were carried out in Germany, the United Kingdom, and Sweden with different populations of kidney transplant patients, including patients with a high risk of chronic rejection (Germany), patients with compromised kidney function (United Kingdom), and patients with stable transplants (Sweden).
All patients were receiving steady-state doses of cyclosporine sufficient to maintain therapeutic blood levels. Swedish and British patients also generally
Table I. Summary of patients characteristics by study center
Study center United
Germany Kingdom Sweden
Age 64 52.3 (24.0) 51.0 (25.5) 43.3 (29.0) Gender
Male 11 11 9 Female
Height (cm) 171.: (4.6) 171.: (6.7) 172.: (4.0) Weight (kg) 73.9 (17.5) 78.2(28.7) 75.6(18.9) Body surface 1.87 (10.1) 1.90 (15.7) 1.88
area (m”) (10.0)
Data are presented as the mean (SD) (n = 12).
received maintenance doses of therapeutic steady- state oral prednisone and azathioprine; however, no other immunosuppressants were administered to the German patients.
Patients were allowed other concomitant medica- tions, provided that the regimen was initiated at least 2 weeks before sirolimus administration and was continued for the duration of the study. The administration times of these concomitant medica- tions were adjusted to minimize effects on sirolimus pharmacokinetics. The median number of such medications administered were 3 (range, 0 to 7) in Germany, 2 (range, 0 to 6) in the United Kingdom, and 3.5 (range, 0 to 5) in Sweden. Prohibited med- ications included terfenadine, nonsteroidal antiin- flammatory drugs, potassium-sparing diuretics, or cytotoxic agents. Alcoholic or recreational drugs were also not permitted.
The demographic characteristics of the patients are presented in Table I. Very similar values for age, height, weight, and body surface were observed among the three study centers. The overall mean + SD values for the age, weight, height, and body surface area of the patients among centers were 49 2 13 years (range, 20 to 68 years), 75.9 2 16.7 kg (range, 52 to 121.5 kg), 172 + 9 cm (range, 150 to 188 cm), and 1.89 + 0.23 m2 (range, 1.5 to 2.43 m’). The total number of patients receiving sirolimus was 36 (12 at each center), four of whom were women; none of the patients were of African descent.
Drug formulation Oral sirolimus (5 mg/ml) was provided in a non-
aqueous mixture obtained from Wyeth-Ayerst Re- search (Radnor, Pa.). The concentrate was pro- tected from light and refrigerated in 5 ml flint-glass
418 Ferron et al. CLINICAL PHARMACOLOGY &THERAPEUTICS
APRIL 1997
vials that enabled withdrawal of 2.5 ml. The siroli- mus dose was determined based on body surface area (mg/m’). The final solution was prepared in a glass vessel by diluting the appropriate volume of sirolimus concentrate with sterile water and vigor- ously stirring for at least 1 minute.
Study design After approval by the appropriate institutional
committee at each center, patients were enrolled into a randomized, double-blind, placebo-controlled, ascending single-dose study. Four doses (3,5, 10, and 15 mg/m2) were evaluated consecutively at each cen- ter, with three patients receiving sirolimus and one patient receiving placebo within each dose group (one patient inadvertently received a dose of 7.8 instead of 5 mg/m2). On day -1, patients reported to the center in the fasting state at approximately 7 AM and received a light low-fat liquid breakfast. At 1 hour after breakfast, cyclosporine was administered with 240 ml of room temperature distilled water. On day 1, the timing of the breakfast and dose administration were the same as on day -1, except that cyclosporine and sirolimus were administered consecutively, each with 120 ml water. Patients abstained from food for 3 hours after the morning dose administration. All meals had a standardized 30% fat content to minimize the effect of fat on cyclosporine absorption. Patients were dis- charged from the study center on day 7.
On day -1, whole blood was collected for blood cyclosporine determinations before (0 hours) and at Y2, 1,2,3,6, and 12 hours after dose administration. On day 1, blood was collected for blood cyclospor- ine, plasma sirolimus, and blood sirolimus determi- nations before (0 hour) and at Y2, 1, 2, 3, 6, and 12 hours after dose administration. Blood was collected before cyclosporine dosing for blood cyclosporine, blood sirolimus, and plasma sirolimus determina- tions on day 2 (trough), except at the British center where the blood was collected on days 3 and 5. Blood samples for plasma sirolimus determinations were rapidly centrifuged at 4” C to separate the plasma. A total of 636 sirolimus whole blood and plasma samples were obtained among the centers, with 13 to 24 sets per patient.
Assay methods Sirolimus. Blood and plasma samples were analyzed
for sirolimus by a validated electrospray high- performance liquid chromatographic/mass spec- trophotometric (I-IPLCMS) method (TexMS Analyt- ical Services, Houston, Texas). A 1 ml aliquot of whole
blood was spiked with desmethoxyrapamycin as the internal standard. The samples were extracted with 5 ml of n-butyl chloride. After removal of the organic layer and evaporation to dryness, the residue was re- constituted in 150 p,l of 2:l acetonitrile/ methanol and subjected to solid-phase extraction by use of a C,s reversed-phase column (LC-Packings, San Francisco, Calif.). The eluant was dried under nitrogen and re- constituted in 20 p.1 methanol. A 1 ~1 aliquot was analyzed by electrospray I-IPLUMS (Mermag, model R-110). The ratio of the intensities (m/z 937)/@/z 907) for sirolimus and desmethoxyrapamycin was used to calculate the concentration of sirolimus by use of a calibration curve. This was generated from the analysis of a drug-free whole blood matrix fortified with various amounts of sirolimus and a fixed amount of the inter- nal standard. The methods for blood and plasma anal- ysis were linear over the ranges from 0.25 to 50 ngknl for blood and 0.25 to 10 rig/ml for plasma, with a 1 ml sample.
Assay performance during sample processing was assessed by precision and accuracy of the standard concentrations used for calibration curves and the quality control samples. Precision was expressed as the coefficient of variation (CV) at each concentration. Accuracy was measured as the percent deviation of the observed from the theoretical concentrations. For blood calibration standards (0.25,0.5, 1,5, 10,25, and 50 rig/ml), the mean interday CV values for precision ranged from 2.1% to 8.9%, and accuracies expressed as a mean percentage error ranged from -0.8% to 3.2%. For blood quality control standards (0.75, 15, and 40 @ml), the mean values of the interday CV for precision ranged from 6.6% to 8.2%, and accuracies ranged from -0.5% to 1.3%. For plasma calibration standards (0.25, 0.5, 1, 5, 10, and 20 @ml), the mean values of the interday CV for precision ranged from 3.2% to 5.1%, and ac- curacies ranged from -0.6% to 1.3%. For plasma quality control standards (0.70, 2.5, and 8 @ml), the mean CV values for precision ranged from 7.8% to 8.4%, and accuracies ranged from 0.2% to 0.6%.
Sirolimus concentrations below the limit of quan- tification (0.25 rig/ml) were not used in the two-stage analysis. However, in the NMEM analysis, all whole blood and plasma sirolimus concentrations greater than 0.25 rig/ml were entered as “reliable” data (status = 0) and concentrations between 0.125 and 0.25 r&ml were considered “uncertain” data (sta- tus = 1); the P-Pharm software (SIMED, Creteil,
CLINICAL P HARMACOLOGY &THERAPEUTICS VOLUME 61, NUMBER 4
France) assigned a lower weight to the uncertain data.
Cyclosporine. Whole blood samples were analyzed for cyclosporine by a validated radioimmunoassay with a specific anti-cyclosporine monoclonal anti- body (Cycle-Trac SP-Whole Blood, INCSTAR Cor- poration, Stillwater, Minn.). The unbound fraction of [3H]-cyclosporine resulting from competitive in- teraction with unlabeled cyclosporine was quanti- tated by beta liquid scintillation counting. The method was linear over 25 to 1600 rig/ml with 1 ml of blood. The interrun CV values ranged from 2.4% (150 rig/ml quality control) to 6.8% (60 rig/ml quality control). Assays were conducted by Addenbrooke’s Hospital, Cambridge, England.
Pharmacokinetic model Paired whole blood and plasma sirolimus concen-
tration versus time data were analyzed by use of both PCNONLIN (SC1 Software Inc, Apex, NC.) and P-Pharm; plasma concentrations were related to whole blood concentrations by the whole blood to plasma ratio (B/P). The first simultaneous fitting model used a biexponential function with first-order absorption and lag-time (tlas) to obtain an estima- tion of the intercept coefficients (A and B), the slopes of the distribution (IX) and elimination (B) phases, the absorption rate constant (k,), flag, as well as the ratio (blood/plasma) between concentrations in whole blood (C,) and plasma (CJ:
C, = doSe.(A.e-“‘(‘-“ad + B.e-P’(‘-“ad - (A + B) . e-ka.(’ - t’d) (1)
C, = CdBIP) (2)
For triexponential fittings, (A+B) was changed to (A+B+C) and a third term (C. eY’(’ - tlag)) was added to equation 1. The discrimination between the biexponential and triexponential models was made by use of either graphical (estimated versus observed concentrations) or mathematical (Akaike information criterion, maximum likelihood function value) comparisons.
To have a more physiologically relevant model, apparent elimination clearance (CL), distribution clearance (CL,), and volume terms (central [V,] and peripheral volume [V,]) were introduced in equa- tion 1. Thus clearance and volume terms replaced intercept and slope parameters. The interrelation- ships between these coefficients and parameters are as follows:
Fewon et al. 419
ka WLNp - 4 A = v,‘(k, - cx). (p - LX)
ka K&N, - P) B = v,‘(k, - p).(cx - p)
)I (4 (5)
(6)
The different kinetic models were validated by the assessment of individual and population area under the whole blood concentration-time curve (AUC) bias calculated with the equation 7, taking AUC calculated with the noncompartmental method (AUC ncpt, spline method) as the reference. A cor- rect fitting was considered to provide mean and individual bias of less than 15%. The area under the whole blood concentration of sirolimus versus time curve was calculated as AUC,,, = A/a + B/B - (A + B)/ka for the polyexponential model and as dose/CL for the semiphysiologic model:
Bias (%) = 100 * WC,, - AUGcp3
AUGcpt (7)
Population pharmacostatistical models The goal of population pharmacokinetic analysis
is to quantify parameter variabilities within the stud- ied population and to explain them by the addition of covariate influences. In other words, for an indi- vidual j, the volume of distribution (Vi) can be expressed as a function of the population value (Vcpop) plus an interpatient variability term (rljvc). Assuming a normal distribution for the volume pa- rameter inside the population (rljvc of mean zero, and variance uzv,), equation 8 can be written as follows:
v, = vwp + l)ljVE (8)
If the volume of distribution were found to signif- icantly increase linearly with increased weight (Vcpop = a + b *weight,,,), equation 8 would be trans- formed to equation 9:
V, = a + b *weighty + ~jvc (9)

420 Ferron et al. CLINICAL PHARMACOLOGY & THERAPEUTICS
APRIL 1997
Similar equations can be written for each phar- macokinetic parameter, and the estimated concen- tration (Fij) at time ti for individual j is obtained from equation 1. The observed concentration Cij will differ from the estimated by the residual error (Eij), which was assumed to be proportional to Cij. There- fore, C, can be expressed as equation 10:
Cij = Fij X (1 + EJ (10)
Two-stage approach A traditional two-stage procedure was used to
assess the population kinetic characteristics. In the first stage, individual fittings with use of PCNON- LIN gave the parameter estimates. In the second stage, the individual values were used to provide the parameter distribution and to compute their mean and variance under the assumption of a normal distribution. Independent covariates were directly studied by graphing individual parameter estimates as a function of each covariable (Sigma plot, version 2.0, Jandel Scientific, San Rafael, Calif.), regression analysis (for covariates with a continuous distribu- tion (e.g, weight), or variance analysis for covari- ables with a discrete distribution: (e.g, dose) (SAS/ stat, version 6, SAS Institute Inc., Cary, N.C.).
NMEM method Nonlinear mixed-effect population modeling was
implemented by use of P-Pharm, a new NMEM modeling program for a Windows environment. Population pharmacokinetic parameters were mod- eled in terms of both random (parameter variance) and fixed effects (mean population parameter and influence of independent variables). Fixed effects account for interpatient differences in the values of independent variables identified as covariables (age and weight), and they help to explain part of the parameter variability: for example, decreased renal clearance is often related to increased age. The influence of the covariable was entered by using a linear function. With the example above for patient j, CLj = a + b * agej, in which a is the intercept and b is the slope of the linear relationship. Random effects account for unexplained interpatient variabil- ity, the distribution of the error terms being normal or log-normal. P-Pharm computes the mean popu- lation parameters values together with their variance and CV% with an expected maximization-type algo- rithm.r6 This CV% does not reflect the precision of the population parameter estimate, but provides the variance about the mean population value (e.g., Eq. 8).
This algorithm is an iterative process suitable for com- puting the maximum likelihood estimates in compli- cated problems of missing and incomplete data. With use of a bayesian estimator, individual parameters are estimated in the first step (expected step), assuming that the population characteristics are known. The population parameters are then estimated in the sec- ond step (maximization step) with use of the maximum likelihood principle and linearization about the bayes- ian estimates. P-Pharm has similar performances as the NONMEM first-order conditional estimates method within a limited number of iterations (n < 100) and a much smaller computation time.r7 More- over, a multidimensional regression is implemented in P-Pharm to assist during the covariable inclusion step (F test). During the computation of population param- eters, a standard least-square algorithm was used: the weight was chosen to be one over the square of the estimated concentration value (variance model with constant coefficient of variation). The comparison be- tween the models was based on goodness-of-fit by graphic (estimated versus observed concentrations for plasma and whole blood) and mathematic (likelihood ratio test) evaluations included in P-Pharm.
During the search for the optimum population pharmacokinetic model, the population and inter- patient variability values of each parameter were first computed. Then the variability of each param- eter was studied to assess the influence of specific covariables (i.e., age, weight, height, body surface area, dose in milligrams and in milligrams per square meter of body surface area, cyclosporine ex- posure on day 1, and study site). Both graphic (in- dividual parameter value versus weight, cyclospor- ine exposure, . . .) and statistical evaluations (multilinear regression) were used. The distribution of all parameters was assumed to be normal at the beginning, and this assumption was checked at the end of the analysis by means of the Kolmogorov- Smirnov test.” A search of outlier values for param- eters and residuals was performed with the T meth- od.r9 A graphic validation of this statistical analysis was performed with plots of estimated versus ob- served drug concentrations for plasma and whole blood and individual fittings.
RESULTS Sirolimus pharmacokinetics
Noncompartmental approach.The dose-normalized blood and plasma concentrations of sirolimus are shown in Fig. 1. A rapid absorption phase was fol- lowed by a biexponential decline with a long termi-

CLINICAL I’ HABMACOLOGY &THERAPEUTICS VOLUME 61, NUMBER4
nal half-life (tr& of approximately 60 hours. Both plasma and whole blood concentrations reached a peak (C,,) between 1 and 2 hours after sirolimus dose administration and both showed similar decline. At the latest sampling times, few plasma data were available because of limitations in assay sensitivity.
The individual parameter estimates from non- compartmental analysis are shown in Fig. 2. The sirolimus blood/plasma ratio was variable, with a mean of 34.5 (CV, 52.3%; range, 10 to 70); no significant differences were observed between cen- ters or over the dosage range. The mean t,,,a was 60.7 hours (CV, 27.5%; range, 36.6 to 109.7 hours). This long and variable tli2e was also dose- independent and similar among study sites. Analysis of the whole blood AUC and C,, confirmed their linear relationship with oral doses of 3 to 15 mg/m2 (r = 0.88 and r = 0.85). Thus, in the range of oral doses studied, whole blood and plasma sirolimus pharmacokinetics were linear.
Population approach with a polyexponential model. Both biexponential (equations 1 and 2) and triexpo- nential functions with first-order absorption and tlag were used in characterizing the sirolimus whole blood and plasma data (Fig. 1). The maximum like- lihood and Akaike information criterion values re- mained constant, indicating that the triexponential equation did not significantly improve the charac- terization of sirolimus kinetics. The population pa- rameter values obtained from a biexponential model with the two-stage and NMEM approaches are sum- marized in Table II. Covariate analysis with P-Pharm based on both graphic and statistical asso- ciations revealed an influence of body weight on the distribution slope (a). The analysis showed that 43% of the interpatient variability in (Y was explained by the influence of weight: (Yi = a + b *weight,, in which a = 0.0806 hr-r and b = 0.002674 ? 0.00053 hi’/kg. Similar results were obtained for the influ- ence of body surface area because weight and body surface are highly correlated (r = 0.97). No influ- ence of dose, study site, cyclosporine, or weight was found for any other parameters.
The P-Pharm population value of the distribution intercept (A) was 7.89 r&ml, with an interpatient variability of 38.9% (one outlier detected). These values were lower than those estimated by the two- stage analysis (12.22 rig/ml and 95.7%). The same trend was found for the elimination intercept (B). The difference between the two methods appears to relate to better estimation of the absorption phase with P-Pharm.
Fewon et al. 421
TIME, hours
Fig. 1. Sirolimus whole blood (squares) and plasma (cir- cles) concentrations normalized by the dose as a function of time after single oral administration of doses of 3,5,10, and 15 mg/m’ in 36 kidney transplant patients. Individual (lower panel) and population (upper panel) fittings were obtained with the complete semiphysiologic model.
For the slope parameters, the P-Pharm popula- tion mean and interpatient variability values of (Y were 0.284 hi1 and 25.1%. These values differed from the two-stage analysis (0.442 hr-’ and 63%). The lower CV from NMEM showed that gathering the data increased the precision and accuracy of mean parameter estimations. This was particularly true in characterization of phases for which few data were available for each patient (e.g., the absorption phase). For B, the P-Pharm population mean and interpatient variability were found to be similar to the two-stage estimates. In fact, 4 to 5 data points were obtained in the elimination phase for each patient, allowing good characterization of the termi- nal slope by either method.
For the absorption parameters, gathering data from different patients increased the information

422 Fewon et al. CLINICAL PHAIWACOLOGY &THERAPEUTICS
APRIL 1997
90
120
? 80
2 . 8
= 40
0
225 r B
6000
l
I I I . I I 1 0 0 4 8 12 16 0 4 8 12 16
SIROLIMUS DOSE, mg/m’
Fig. 2. Relationships between administered dose of sirolirnus (mg/m”) and whole blood to plasma ratio (B/P), maximal blood concentration (C,,), elimination half-life (tq3), and whole blood exposure (AUC) values obtained by noncompartmental analysis. Regression lines are shown for C, and AUC panels. Parameter values are designated by center: Germany (squares), United Kingdom (circles), and Sweden (triangles).
Table II. Mean population parameter estimates obtained with the standard two-stage (PCNONLIN) and the nonlinear mixed-effect model (P-Pharm) methods, with the use of the biexponential function
Sirolimus parameters Mean
Two-stage method
Interpatient variability (CV%) Mean
NMEM method
Interpatient variability (CV%)
A (nglml) 12.22 95.7 7.89 38.9 B (n&4 1.25 46.4 1.06 35.5 a (hr-‘) 0.44 63.1 0.28 25.1 P k W’j W )
0.013 30.1 0.011 27.5 6.50 93.0 2.77 48.4
t (W Bb ratio
0.29 51.7 0.27 35.1 34.4 51.2 30.9 48.5
A and B, Intercept coefficients; a, distribution slope; f3. elimination slope; k,, absorption rate constant; t,,,, lag-time; B/P ratio, blood/plasma ratio.
available for fitting this phase. The NMEM mean value of the k, was 2.77 hi’ (CV, 48.4%; range, 0.45 to 4.14 hi’), which was lower than the k, of 6.53 hi’ (CV, 92.97 O; range, 0.40 to 24.2 hi’) obtained with the two-stage method. For the tlag, P-Pharm yielded a mean value of 0.269 hour (CV, 35.1%),
whereas the two-stage value was 0.29 hour (CV, 51.7%). No outlier value was found with NMEM, but several unusual values were observed with the two-stage method.
The P-Pharm population mean of the blood/ plasma ratio was 30.9 (CV, 48.5%), which was very
CLINICAL PHARMACOLOGY & THERAPEUTICS VOLUME 61, NUMBER 4 Fewon et al. 423
100 r B/P ratio
80
60
0 20 40 60 80 100 0 2000 4000 6000
‘ti 25
20
ka, hr-l
0 5 10 15 20 25
0.5 tlagg hr 0.4 0
0.3 g .*‘. @@a
0 t@ l ;0?
0.2 @Da*
0.1
TWO-STAGE ESTIMATES
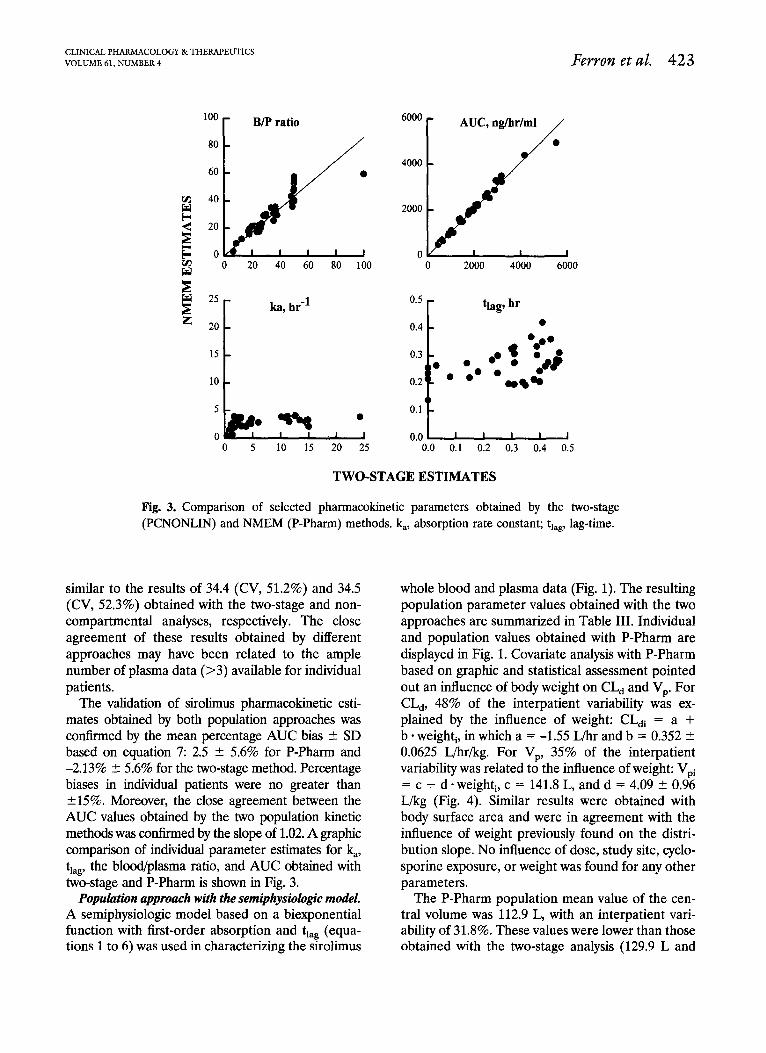
Fig. 3. Comparison of selected pharmacokinetic parameters obtained by the two-stage (PCNONLIN) and NMEM (P-Pharm) methods. k,, absorption rate constant; tlag, lag-time.
similar to the results of 34.4 (CV, 51.2%) and 34.5 (CV, 52.3%) obtained with the two-stage and non- compartmental analyses, respectively. The close agreement of these results obtained by different approaches may have been related to the ample number of plasma data (>3) available for individual patients.
The validation of sirolimus pharmacokinetic esti- mates obtained by both population approaches was contkned by the mean percentage AUC bias C SD based on equation 7: 2.5 + 5.6% for P-Pharm and -2.13% f- 5.6% for the two-stage method. Percentage biases in individual patients were no greater than +15%. Moreover, the close agreement between the AUC values obtained by the two population kinetic methods was confirmed by the slope of 1.02. A graphic comparison of individual parameter estimates for &, tlag, the blood/plasma ratio, and AUC obtained with two-stage and P-Pharm is shown in Fig. 3.
whole blood and plasma data (Fig. 1). The resulting population parameter values obtained with the two approaches are summarized in Table III. Individual and population values obtained with P-Pharm are displayed in Fig. 1. Covariate analysis with P-Pharm based on graphic and statistical assessment pointed out an influence of body weight on CL, and VP. For CL,, 48% of the interpatient variability was ex- plained by the influence of weight: CL,, = a + b * weight,, in which a = -1.55 L/hr and b = 0.352 5 0.0625 L/hrikg. For VP, 35% of the interpatient variability was related to the influence of weight: Vpi = c + d -weight, c = 141.8 L, and d = 4.09 2 0.96 L/kg (Fig. 4). Similar results were obtained with body surface area and were in agreement with the influence of weight previously found on the distri- bution slope. No influence of dose, study site, cyclo- sporine exposure, or weight was found for any other parameters.
Population approach with the semiphysiologic model. The P-Pharm population mean value of the cen- A semiphysiologic model based on a biexponential tral volume was 112.9 L, with an interpatient vari- function with first-order absorption and t,, (equa- ability of 31.8%. These values were lower than those tions 1 to 6) was used in characterizing the sirolimus obtained with the two-stage analysis (129.9 L and

424 Fewon et al, CLINICAL PHARMACOLOGY & THERAPEUTICS
APRIL 1997
18
L 12
% .
i: 6
0
200 -
0
150 - 0 0 .o 00
il * s&P:,
8
l . s- 100 - t 0 0
0 0 50 - .o
0
0 I I I I J 50 70 90 110
30
2 ‘! 20
s u
10
0 . Y 0
800
r
WEIGHT, kg
Fig. 4. Influence of body weight on the clearances (elimination clearance [CL] and distribu- tion clearance [CL,]) and volumes (central volume [V,] and peripheral volume [V,]) terms of the semiphysiologic population model. The CL, and VP parameters increased with body weight as shown by the regression lines.
Table III. Mean population parameter estimates obtained with the standard two-stage (PCNONLIN) and the nonlinear mixed-effect model (P-Pharm) methods, with use of the semiphysiologic function
Two-stage method NMEM method
Interpatient variability Interpatient variability Sirolimus parameters Mean (CV%) Mean (CV%)
CL/F (L/m) 9.32 47.0 8.91 38.2 vc w 129.9 81.4 112.9 31.8 CL, V-W 27.5 65.6 25.2 31.9
462.5 42.4 452.0 26.4 6.50 93.0 2.18 41.3 0.29 51.7 0.24 40.1
34.4 51.2 33.5 48.6
CIJF, Apparent oral clearance; Vc, central volume of distribution; CL,,, distribution clearance; VP, peripheral volume of distribution.
81.4%), whereas similar values were obtained from was 25.2 L/hr (CV, 31.9%), which was similar to the the two methods for the peripheral volume. two-stage approach, 27.5 L/hr (CV, 65.6%).
For the elimination clearance, the NMEM mean For k,, the P-Pharm population mean (interpa- and interpatient variability values were 8.91 L/hr tient variability) was 2.18 hi’ (CV, 41.3%), which and 38.2%, which were lower than the biexponential was very close to that from the biexponential model, model estimates of 9.24 L/hr and 53.4%. For the 2.77 hi’ (CV, 48.4%). One outlier value with a k, of distribution clearance, the NMEM population mean 0.29 hi’ was found with P-Pharm. For tlag, both
CLINICAL P HABMACOLOGY & THERAPEUTICS VOLUME 61, NUMBER 4 Fewon et al. 425
methods gave similar values, but no outlier was found with NMEM compared with the two-stage method.
The validation of sirolimus population pharmaco- kinetic estimates obtained by both population ap- proaches with the semiphysiologic model was re- flected by the low mean percentage AUC bias 2 SD: 5.41% + 9.95% for the P-Pharm method and -2.15% + 5.5% for the two-stage method. No indi- vidual bias was below -15%, but three were found above 15% with P-Pharm, which may have been attributable to the poor characterization of the dis- tribution phase.
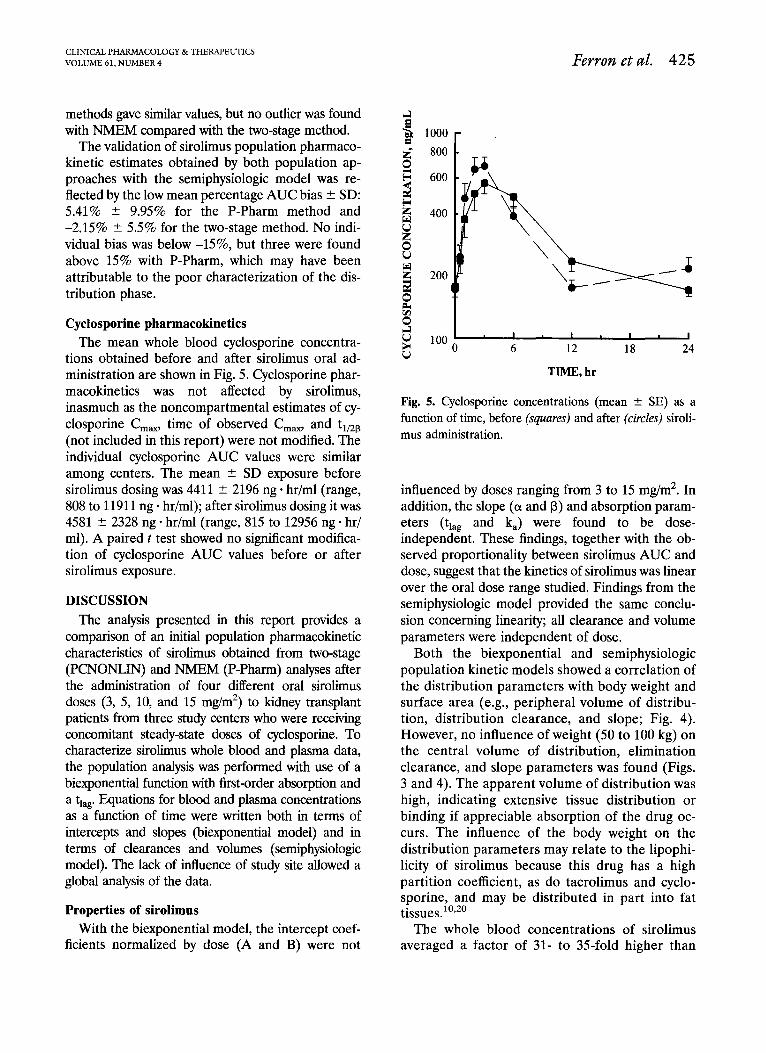
Cyclosporine pharmacokinetics The mean whole blood cyclosporine concentra-
tions obtained before and after sirolimus oral ad- ministration are shown in Fig. 5. Cyclosporine phar- macokinetics was not affected by sirolimus, inasmuch as the noncompartmental estimates of cy- closporine C,,, time of observed C,,, and t,,,a (not included in this report) were not modified. The individual cyclosporine AUC values were similar among centers. The mean + SD exposure before sirolimus dosing was 4411 ? 2196 ng * hr/ml (range, 808 to 11911 ng * hr/ml); after sirolimus dosing it was 4581 + 2328 ng * hr/ml (range, 815 to 12956 ng * hr/ ml). A paired t test showed no significant modifica- tion of cyclosporine AUC values before or after sirolimus exposure.
DISCUSSION The analysis presented in this report provides a
comparison of an initial population pharmacokinetic characteristics of sirohrnus obtained from two-stage (PCNONLIN) and NMEM (P-Pharm) analyses after the administration of four different oral sirolimus doses (3, 5, 10, and 15 mg/m*) to kidney transplant patients from three study centers who were receiving concomitant steady-state doses of cyclosporine. To characterize sirolimus whole blood and plasma data, the population analysis was performed with use of a biexponential function with first-order absorption and a t,,. Equations for blood and plasma concentrations as a function of time were written both in terms of intercepts and slopes (biexponential model) and in terms of clearances and volumes (semiphysiologic model). The lack of influence of study site allowed a global analysis of the data.
Properties of sirolimus
Both the biexponential and semiphysiologic population kinetic models showed a correlation of the distribution parameters with body weight and surface area (e.g., peripheral volume of distribu- tion, distribution clearance, and slope; Fig. 4). However, no influence of weight (50 to 100 kg) on the central volume of distribution, elimination clearance, and slope parameters was found (Figs. 3 and 4). The apparent volume of distribution was high, indicating extensive tissue distribution or binding if appreciable absorption of the drug oc- curs. The influence of the body weight on the distribution parameters may relate to the lipophi- licity of sirolimus because this drug has a high partition coefficient, as do tacrolimus and cyclo- sporine, and may be distributed in part into fat tissues.i’,*’
With the biexponential model, the intercept coef- The whole blood concentrations of sirolimus ficients normalized by dose (A and B) were not averaged a factor of 31- to 35-fold higher than
I I I I 6 12 18 24
TIME. hr
Fig. 5. Cyclosporine concentrations (mean + SE) as a function of time, before (squares) and after (circles) siroli- mus administration.
influenced by doses ranging from 3 to 15 mg/m*. In addition, the slope (01 and B) and absorption param- eters (t,,, and k,) were found to be dose- independent. These findings, together with the ob- served proportionality between sirolimus AUC and dose, suggest that the kinetics of sirolimus was linear over the oral dose range studied. Findings from the semiphysiologic model provided the same conclu- sion concerning linearity; all clearance and volume parameters were independent of dose.

426 Fewon et al. CLINICAL PHARMA COLOGY &THERAPEUTICS
APRIL 1997
plasma concentrations, showing extensive siroli- mus uptake by formed blood elements (Fig. 2). The in vivo blood/plasma ratio of sirolimus was considerably higher than the value of 11 + 2 obtained by Yatscoff et al.‘l after spiking blood in vitro at concentrations of 5 to 100 rig/ml. The latter study showed no in vivo influence of dose or red blood cell concentrations (0.25 to 230 @ml) on sirolimus uptake into the red blood cells. However, these results differ from the nonlinear binding of tacrolimus to FK binding protein (FKRP) and cyclosporine to cyclophylin in the red blood cells. 20,22 Although sirolimus also binds to FK binding protein, the reason for the dissimilar red blood cell binding of sirolimus and tacrolimus is not known. Cyclosporine and sirolimus bind specifically to different red blood cell proteins, explaining the lack of influence of cyclosporine on the blood/plasma ratio of siroli- mus.
Sirolimus has been studied in patients with sta- ble kidney transplants who were administered sin- gle intravenous doses of 0.5, 1, 2, and 3 mg/m’ sirolimus (Wyeth-Ayerst Research, unpublished data, 1994). That study yielded a mean t1,2P value of 68 hours, which was very close to the P-Pharm population mean value of 63 hours. The mean values were 0.024 L/hr/kg for the intravenous clearance and 1.8 L/kg for the steady-state volume of distribution, With the P-Pharm population analysis, the elimination clearance was 0.127 L/hi-/kg and the apparent steady-state volume of distribution was 7.73 L/kg. A comparison between these studies suggests that the systemic oral avail- ability of sirolimus is about 20%. These findings support the characterization of sirolimus as a drug with an apparent low clearance and extensive tis- sue distribution, thereby showing similarities to tacrolimus2’ and cyclosporine.” The noncompart- mental analysis of the data from the Swedish pa- tients has also been reported.”
Comparison with tacrolimus The assessment of sirolimus semiphysiologic
parameters allows a comparison with tacrolimus pharmacokinetics in a population of liver trans- plant patients. 2o The steady-state blood volume of distribution of sirolimus (1.756 L/kg) is double that of tacrolimus (0.906 L/kg); the steady-state plasma volume values also differ (58.9 L/kg for sirolimus versus 30.1 L/kg for tacrolimus). Siroli- mus blood elimination clearance was one-half ta-
crolimus clearance (24 versus 54 ml/h&g), which was probably due to the lower blood/plasma ratio for tacrolimus (lo-30 for tacrolimus versus 33.5 for sirolimus). Sirolimus is more sequestered in the red blood cells, making less drug available for metabolic elimination. Indeed, both compounds undergo an extensive liver metabolism by CYP3A4 enzymes,22,23 followed by biliary excre- tion of the metabolites, as does cyclosporine.24,25 Furthermore, presystemic metabolism by CYP3A4 enzymes in the intestinal mucosa may in part account for the low oral availability of the three immunosuppressants (sirolimus [20%], ta- crolimus [25% + lo%], and cyclosporine [2% to 89%]). Thus the interindividual variability in the systemic oral availability observed with these three immunosuppressants may relate to different intestinal P450 activity and content.22 However, studies in rabbits suggest that the poor solubility of tacrolimus also results in incomplete absorp- tion.26 Moreover, the absorption characteristics of sirolimus and tacrolimus are similar. These two drugs show brief tlag values of 0.27 hour (siroli- mus) and 0.39 hour (tacrolimus), rapid absorption as reflected by k, values of 2.77 hr-’ and 4.48 hi’, and large k, variability of 48% and 67%. However, sirolimus was given in an oral solution, whereas capsules were used for tacrolimus. Thus sirolimus and tacrolimus pharmacokinetics are similar ex- cept for the blood/plasma ratio, which is markedly concentration-dependent for tacrolimus. How- ever, further comparisons should be made by use of similar patient types.
Effect on cyclosporine Cyclosporine blood concentrations were mea-
sured before and after sirolimus administration (Fig. 5). No significant modification of cyclospor- ine oral-dose clearance was observed, because the cyclosporine C,, and AUC remained constant. Moreover, cyclosporine exposure was not a signif- icant covariable in explaining the interpatient variability of the sirolimus pharmacokinetic pa- rameters. Therefore coadministration of steady- state doses of cyclosporine and single doses of sirolimus did not produce a pharmacokinetic in- teraction in the three groups of kidney transplant recipients. It remains to be determined whether these drugs interact in vivo at the level of the immunosuppressive effects in humans; synergistic interactions have been found in vitro in the inhi- bition of proliferation of normal human periph-
CLINICAL PHABMACOLOGY & THERAPEUTICS VOLUME 61, NUMBER4 Ferron et al. 427
era1 blood lymphocytes and in rats with hetero- topic cardiac allografts.*’
In summary, the analysis presented in this re- port shows that the NMEM method (P-Pharm) provides a better characterization of all sirolimus kinetic phases than does the two-stage method. Individual parameters were defined with more ac- curacy, and the interpatient variability was esti- mated more precisely with P-Pharm. In the three patient groups studied, interpatient variabilities of pharmacokinetic parameters were generally less than 40%. Body weight and surface area were the only patient characteristics that showed a signifi- cant influence on the pharmacokinetics of siroli- mus. Sirolimus exposure (C,,, and AUC) was proportional to dose over a dose range from 3 to 15 mg/m*. No pharmacokinetic interactions were observed between sirolimus and cyclosporine.
We thank Ms. Suzette Mis for her computational assis- tance.
References 1. Vezina C, Kudeiski A, Sehgal S. Rapamycin (AY-
22,989), a new antifungal antibiotic; I: taxonomy of the producing streptomycete and isolation of the active principle. J Antibiot (Tokyo) 1975;28: 721-6.
2. Morris RE. Rapamycins: antifungal, antitumor, anti- proliferative, and immunosuppressive macrolides. Transplant Rev 1992;6:39-87.
3. Metclafe SM, Richards FM. Cyclosporine, FK506, and rapamycin: some effects on early activation events in serum-free, mitogen-stimulated mouse spleen cells. Transplantation 1990;49:798-803.
4. Whiting PH, Woo J, Adam BJ, Hasan NU, Thomson AW. The effect of rapamycin on renal function in the rat: a comparative study with cyclosporine. Toxic01 Lett 1991;58:169-79.
5. Michnick SW, Rosen MK, Wandless TJ, Karplus M, Schreiber SL. Solution structure of FKBR, a rotamase enzyme and receptor for FK506 and rapamycin. Sci- ence 1991;252:836-42.
6. Price DJ, Grove LR, Calvo V, Avruch J, Bierer BE. Rapamycin-induced inhibition of the 70-kilodalton S6 protein kinase. Science 1992;257:973-7.
7. Kay JE, Kromwel L, Doe SEA, Denyer M. Inhibition of T and B lymphocyte proliferation by rapamycin. Immunology 1991;72:544-9.
8. Kahan BD, Gibbons S, Tejpal N, Chou TC, Step- kowski S. Synergistic effect of the rapamycin- cyclosporine combination: median effect analysis of in vitro immune performances by human T lym- phocytes in PHA, CD3, and MLR proliferative
and cytotoxicity assays. Transplant Proc 1991;23: 1090-l.
9. Zheng B, Shothouse R, Masek MA, Berry G, Billing- ham ME, Morris RE. Effects of the new and highly active immunosuppressant, rapamycin on lymphoid tissues and cells in vivo. Transplant Proc 1991;23: 851-5.
10. Yee GC. Recent advances in cyclosporine pharmaco- kinetics. Pharmacotherapy 1991;11:13OS-4s.
11. Brattstrom C, Tyden G, Herlenius G, Claesson K, Zim- merman J, Groth CG. Kinetics and dynamics of single oral doses of sirolimus in sixteen renal transplant recip- ients. Ther Drug Monit 1997 [in press].
12. Peters DH, Fitton A, Ploster GL, Faulds D. Tacroli- mus: a review of its pharmacology, and therapeutic potential in hepatic and renal transplantation. Drugs 1993;46:746-94.
13. Takada K, Katayama N, Kiriyama A, Usuda H. Dis- tribution characteristics of immunosuppressants FK506 and cyclosporine in the blood compartment. Biopharm Drug Dispos 1993;14:659-72.
14. Sheiner LB, Raymond JL. Population pharmacoki- netic/pharmacodynamic analysis. Drug Inform J 1991; 25:319-21.
15. Gomeni R, Pineau G, Mentre F. Population kinetics and conditional assessment of the optimal dosage regimen using the P-Pharm software package. Anti- cancer Res 1994;14:2321-6.
16. P-Pharm, a population pharmacokinetic-dynamic data modeling program; user’s manual, version 1.3a. Creteil, France: SIMED, Biostatistics and data mod- eling, 1994.
17. Mentre F, Gomeni R. A two-step iterative algorithm for estimation in nonlinear mixed-effect models with an evaluation in population pharmacokinetics. J Bio- pharm Stat 1995;5:141-58.
18. Sokal RR, Rohlf FJ. Biometry. San Francisco: WH Freeman, 1961.
19. Bolton SP. Pharmaceutical Statistics. New York: Mar- cel Dekker, 1986.
20. Jusko WJ, Piekoszewski W, Klintmalm GB, Shaefer MS, Hebert MF, Piergies AA, et al. Pharmacokinetics of tacrolimus in liver transplant patients. Clin Phar. macol Ther 1995;57:281-90.
21. Yatscoff R, LeGatt D, Keenan R, Chackowsky P. Blood distribution of rapamycin. Transplantation 1993;56:12-6.
22. Christians U, Sattler M, Schiebel HM, et al. Isolation of two immunosuppressive metabolites after in vitro metabolism of rapamycin. Drug Metab Dispos 1992; 20:186-191.
23. Sattler M, Guengerich P, Yun CH, Christians U, Sewing KF. Cytochrome P-450 3A enzymes are responsible for biotransformation of FK506 and rapamycin in man and rat. Drug Metab Dispos 1992;20:753-61.
24. Quesniaux VFJ. Pharmacology of cyclosporine (Sand-

428 Ferron et al. CLINICAL PHARMA COLOGY &THERAPEUTICS
APRIL 1997
immune); III: immunochemistry and monitoring. Pharmacol Rev 1989;41:249-56.
25. Turgeon DK, Leichtman AB, Lown KS, Normolle DP, Deeb GM, Merion RM, et al. P450 3A activity and cyclosporine dosing in kidney and heart trans- plant recipients. Clin Pharmacol Ther 1994;56:253- 60.
26. Piekoszewski W, Chow FS, Jusko WJ. Disposition of
tacrolimus (FK 506) in rabbits, role of red blood cell binding in hepatic clearance. Drug Metab Dispos 1993;21:690-8.
27. Kahan BD, Gibbons S, Tejpal N, Stepkowski SM, Chou TC. Synergistic interactions of cyclosporine and rapamycin to inhibit immune performances of normal human peripheral blood lymphocytes in vitro. Trans- plantation 1991;51:232-9.
N THE MOVE? Don’t miss a single issue of the journal! To ensure prompt service when you change your address, please photocopy and complete the form below.
Please send your change of address notification at least six weeks before your move to ensure continued service. We regret we cannot guarantee replacement of issues missed due to late notification.
JOURNAL TITLE: Fill in the title of the journal here.
OLD ADDRESS: NEW ADDRESS: Affix the address label from a recent issue of the journal here. Clearly print your new address here.
Name
Address
City/State/ZIP
COPY AND MAIL THIS FORM TO: Journal Subscription Services Mosby-Year Book, Inc. 11830 Westline Industrial Dr. St. Louis, MO 63146-3318
OR FAX TO: 314-432-1158
h’i(l Mosby
OR PHONE: l-800-453-4351 Outside the U.S., call 314-453-4351