population pharmacokinetic analysis of avelumab in ... · background • avelumab is a human...
TRANSCRIPT
BACKGROUND
• Avelumab is a human monoclonal antibody that selectively binds PD-L1,which is expressed on many different tumor cells
• Avelumab is approved in the US and EU for treatment of metastatic Merkelcell carcinoma (MCC), in Japan for curatively unresectable MCC, andplatinum-treated advanced urothelial carcinoma (US),1 and is in clinicaldevelopment in other cancer types2
• Avelumab has shown promising clinical activity and manageable safety inmultiple tumor types2-6
• Here, we present results from a population pharmacokinetic (PopPK) analysisaccounting for covariates after multiple doses, considering models fortime-varying clearance (CL) and covariate relationships
METHODS
Patients and treatment• Pharmacokinetic and covariate data from three clinical trials were used for
PopPK analysis:
– JAVELIN Solid Tumor (NCT01772004): A Phase I, Open-label,Multiple-ascending Dose Trial to Investigate the Safety, Tolerability,Pharmacokinetics, Biological and Clinical Activity of Avelumab(MSB0010718C) in Subjects With Metastatic or Locally Advanced SolidTumors and Expansion to Selected Indications (1,688 patients)
– JAVELIN Solid Tumor JPN (NCT01943461): A Phase I Trial to Investigate theTolerability, Safety, Pharmacokinetics, Biological and Clinical Activity ofAvelumab (MSB0010718C) in Japanese Subjects With Metastatic or LocallyAdvanced Solid Tumors, With Expansion Part in Asian Subjects With GastricCancer (51 patients)
– JAVELIN Merkel 200 (NCT02155647): A Phase II, Open-Label, Multicenter Trialto Investigate the Clinical Activity and Safety of Avelumab (MSB0010718C)in Subjects With Merkel Cell Carcinoma (88 patients)
• This analysis includes 10,637 avelumab serum concentration observationsfrom 1,827 patients with 14 different tumor types, which were obtainedaccording to rich and sparse sampling schemes
• Patients received avelumab at 1 mg/kg (n=4), 3 mg/kg (n=18), 10 mg/kg(n=1,778) or 20 mg/kg (n=27) every 2 weeks (Q2W) by intravenous (IV) infusionadministered over 1 hour
Modeling• The PopPK model was built using nonlinear mixed effect modeling software
package (NONMEM; v7.3.0)
• Two-compartment models with covariates including time-constant and time-varying clearance (CL) were tested
• Changes in CL over time were considered using the model according to Liu et al.7:
𝐶𝐶𝐶𝐶𝐶𝐶𝐶𝐶𝐶𝐶𝐶𝐶𝐶𝐶𝐶𝐶𝐶𝐶𝐶𝐶𝐶𝐶 𝐼𝐼𝑚𝑚𝑚𝑚𝑚𝑚𝐶·𝐶𝐶𝑇𝑇𝑚𝑚𝑇𝑇𝛾𝛾𝐶𝐶𝑇𝑇𝛾𝛾+𝐶𝐶𝑇𝑇𝑚𝑚𝑇𝑇𝛾𝛾( )
where CL is clearance (L/hour); TVCL is CL at baseline (L/hour); Imax is the logarithm of maximal change in CL relative to baseline; T50 is time required to reach 50% of Imax (days); ɣ is shape parameter; and Time (days)
• A full-model approach was used for inclusion of covariates in the model8
• Covariates were tested on CL and central volume of distribution (V1)
• Parameters controlling the time variability of CL were assessed individually bytumor type
• Categorical variables were implemented using a linear function, as follows:
𝑃𝐴𝑅𝐶𝑂𝑉𝑖 = 𝑃𝐴𝑅 • (1+𝜃𝐶𝑂𝑉)
where PARCOVi is the parameter value for individual i; PAR is the typical value of the parameter in the population; and 𝜃COV is an estimated parameter corresponding to the unique value of the categorical covariate in individual i; for the largest category, 𝜃COV is defined as 0
• Continuous variables were defined by a power function, as follows:
𝐶𝐶𝐶𝐶𝐶𝐶𝑖𝑖
𝐶𝐶𝐶𝐶𝐶𝐶( )𝑃𝑃𝑃𝑃𝑃𝑃𝐶𝐶𝐶𝐶𝐶𝐶𝑖𝑖 = 𝑃𝑃𝑃𝑃𝑃𝑃 𝑃 𝜃𝜃𝐶𝐶𝐶𝐶𝐶𝐶
where PARCOVi and PAR are as previously defined; COVi is the value of the covariate in individual i; (𝐶𝑂𝑉) is the median value of the covariate in the population; and 𝜃COV is a parameter describing the shape of the relationship of the covariate to the parameter
• Alternatively, time-varying covariates were included in the two-compartmentmodel for CL according to Wählby et al.9:
𝐶𝐿𝐶𝑂𝑉𝑖 ,𝑡 = 𝑇𝑉𝐶𝐿 • [1+𝜃BCOV • (𝐶𝑂𝑉𝑏𝑎𝑠𝑒,𝑖 − 𝐶𝑂𝑉𝑏𝑎𝑠𝑒 ) + 𝜃DCOV • (𝐶𝑂𝑉𝑖 ,𝑡 − 𝐶𝑂𝑉𝑏𝑎𝑠𝑒,𝑖 )]
where CLCOVi,t is the value of the CL in individual i at time t; TVCL is the typical value of CL in the population; θBCOV is a parameter describing the proportional relationship of the normalized covariate at baseline to the parameter; COVbase,i is the value of the covariate at baseline in individual i; COVbase is the median value of the covariate in the population at baseline; θDCOV is a parameter describing the relationship between the parameter and change from baseline in the covariate; and COVi,t is the value of the covariate in individual i at time t
• The following time-varying covariates were included in the model, eachseparately:
– Body weight, albumin, platelet count, C-reactive protein, and tumor size
RESULTS
• Avelumab concentrations increased over time
• Incorporation of time-varying covariates did not result in modelimprovement, as judged by plots of conditional-weighted residuals againsttime (Figure 1) as well as by decrease in Objective Function Value
• A two-compartment model incorporating time-varying CL provided the bestdescription of avelumab concentration (Table 1, Figure 2, Figure 3)
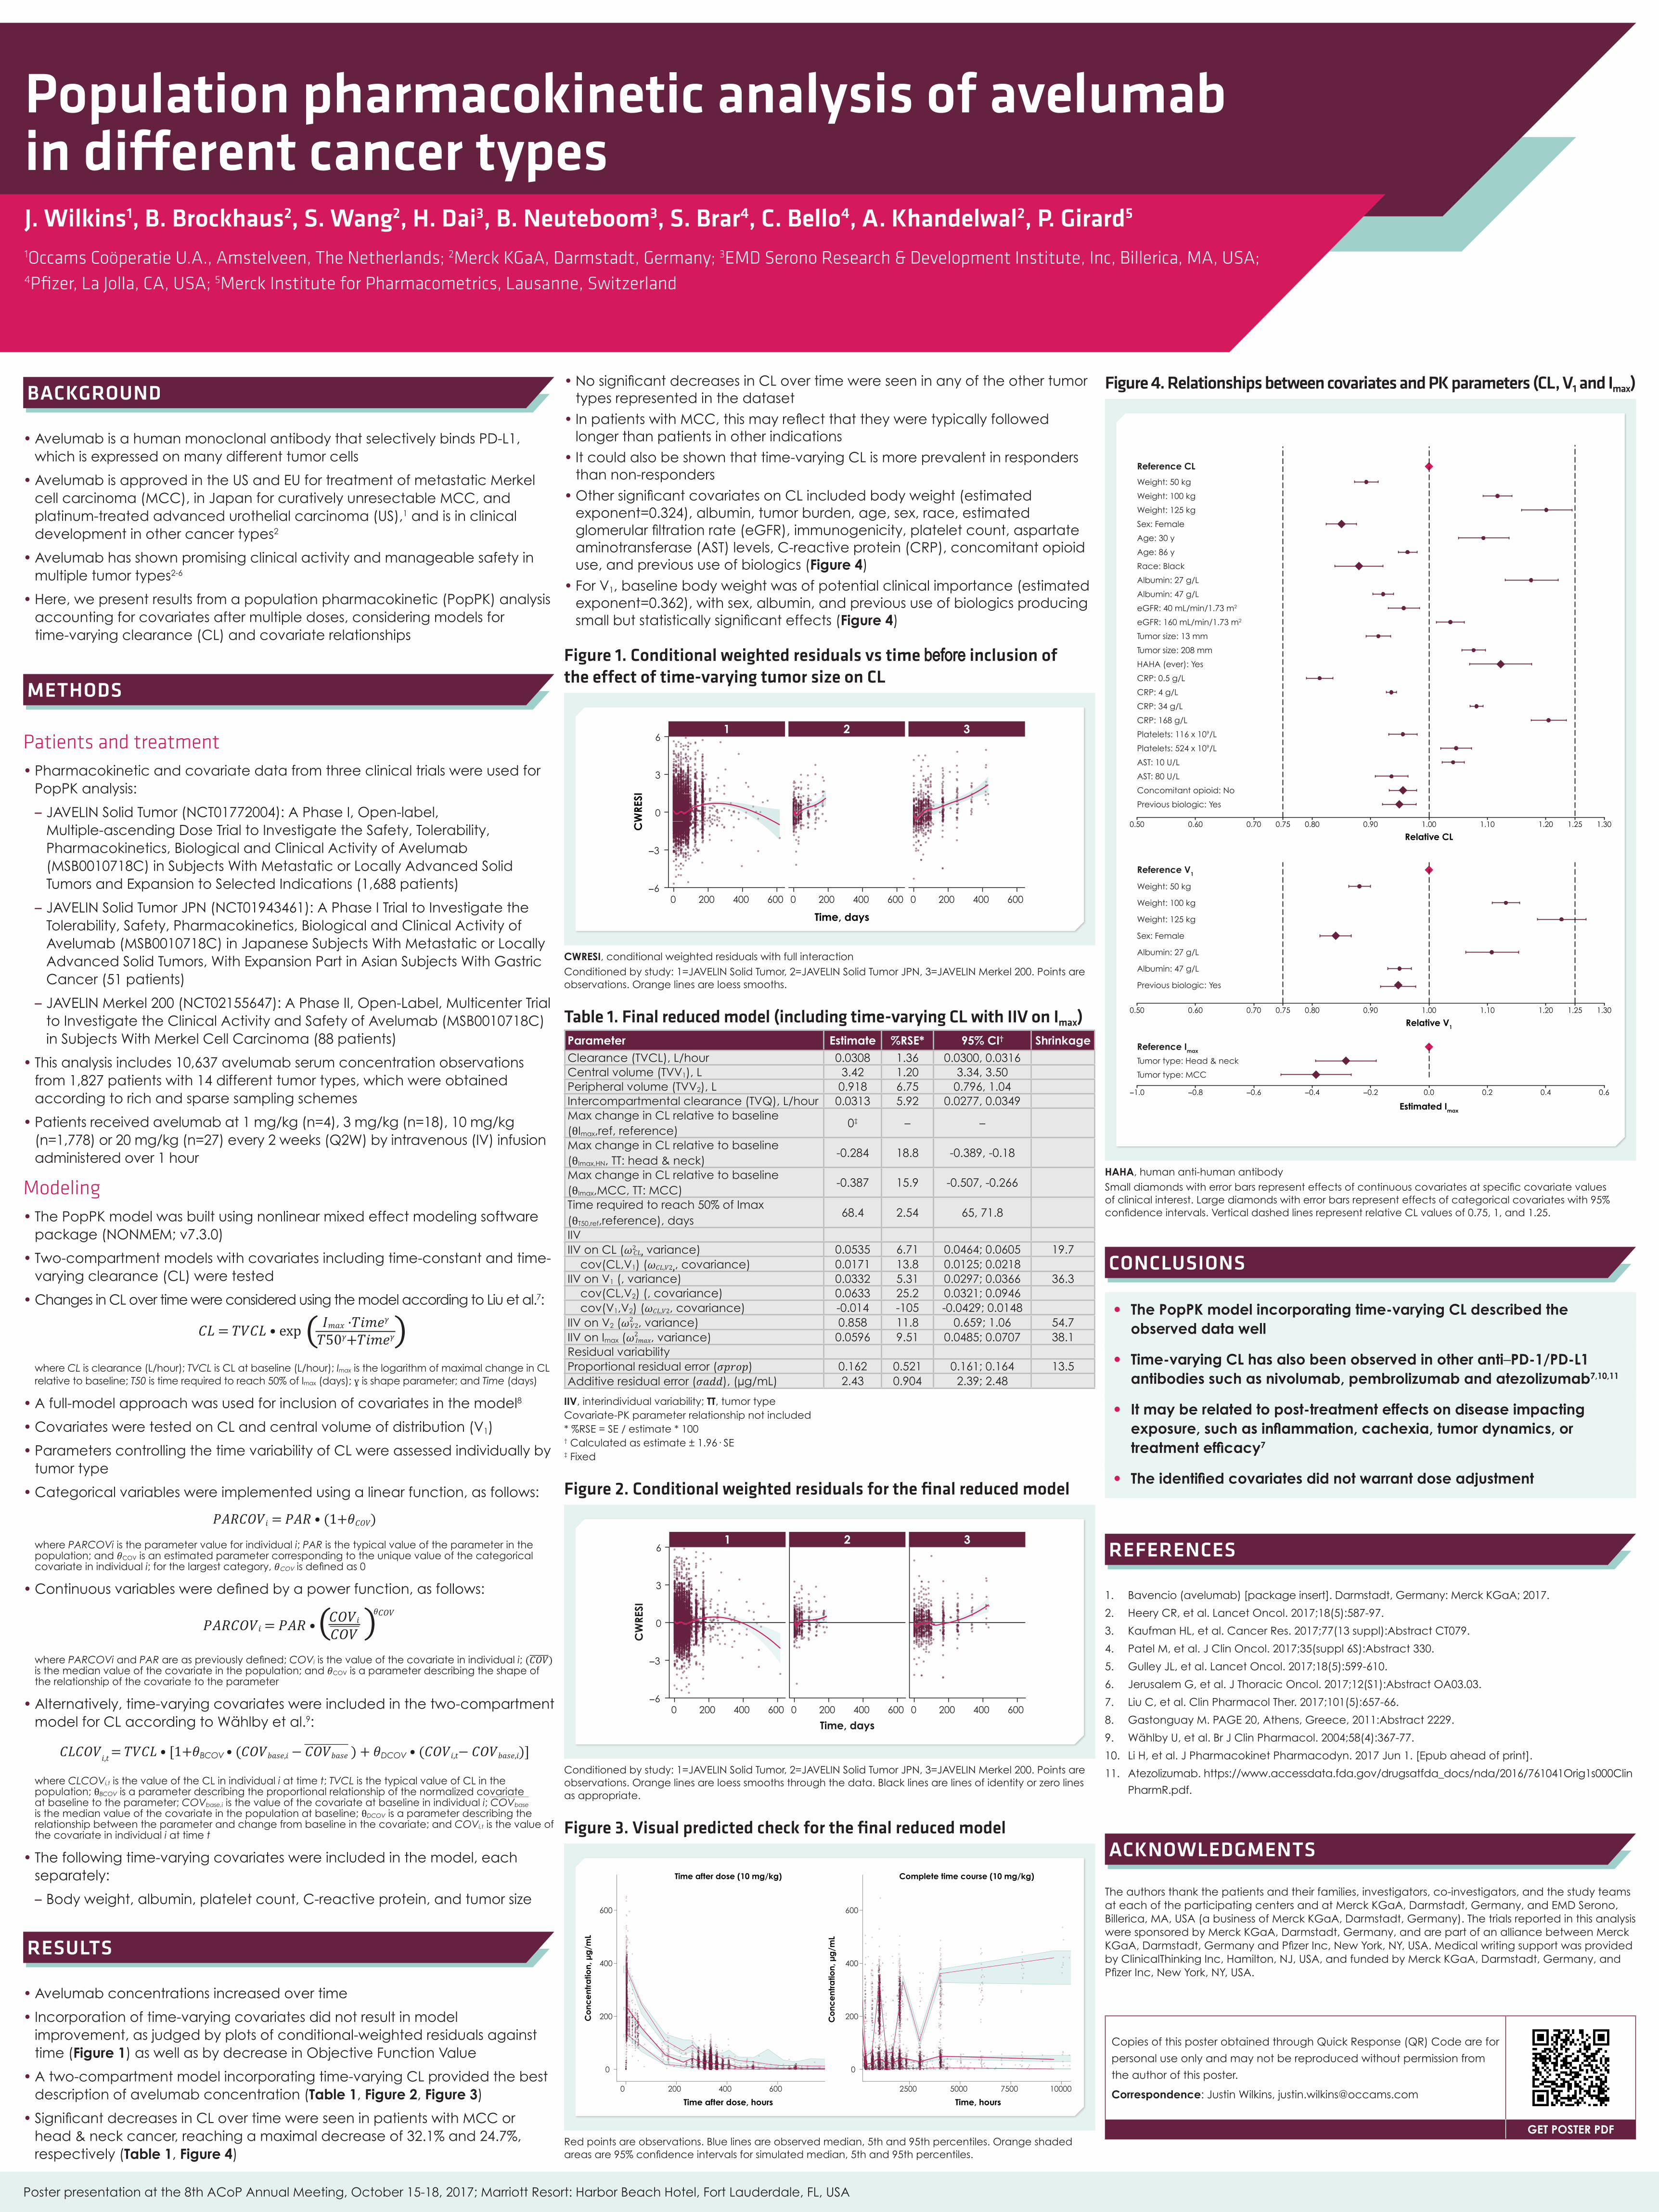
• Significant decreases in CL over time were seen in patients with MCC orhead & neck cancer, reaching a maximal decrease of 32.1% and 24.7%,respectively (Table 1, Figure 4)
• No significant decreases in CL over time were seen in any of the other tumortypes represented in the dataset
• In patients with MCC, this may reflect that they were typically followedlonger than patients in other indications
• It could also be shown that time-varying CL is more prevalent in respondersthan non-responders
• Other significant covariates on CL included body weight (estimatedexponent=0.324), albumin, tumor burden, age, sex, race, estimatedglomerular filtration rate (eGFR), immunogenicity, platelet count, aspartateaminotransferase (AST) levels, C-reactive protein (CRP), concomitant opioiduse, and previous use of biologics (Figure 4)
• For V1, baseline body weight was of potential clinical importance (estimatedexponent=0.362), with sex, albumin, and previous use of biologics producingsmall but statistically significant effects (Figure 4)
Figure 1. Conditional weighted residuals vs time before inclusion of the effect of time-varying tumor size on CL
0 200 400 600 0 200 400 600 0 200 400 600
Time, days
−6
−3
0
3
6
CW
RESI
1 2 3
CWRESI, conditional weighted residuals with full interactionConditioned by study: 1=JAVELIN Solid Tumor, 2=JAVELIN Solid Tumor JPN, 3=JAVELIN Merkel 200. Points are observations. Orange lines are loess smooths.
Table 1. Final reduced model (including time-varying CL with IIV on Imax)Parameter Estimate %RSE* 95% CI† ShrinkageClearance (TVCL), L/hour 0.0308 1.36 0.0300, 0.0316Central volume (TVV1), L 3.42 1.20 3.34, 3.50Peripheral volume (TVV2), L 0.918 6.75 0.796, 1.04Intercompartmental clearance (TVQ), L/hour 0.0313 5.92 0.0277, 0.0349Max change in CL relative to baseline (θImax,ref, reference)
0‡ – –
Max change in CL relative to baseline (θImax,HN, TT: head & neck)
-0.284 18.8 -0.389, -0.18
Max change in CL relative to baseline (θImax,MCC, TT: MCC)
-0.387 15.9 -0.507, -0.266
Time required to reach 50% of Imax (θT50,ref,reference), days
68.4 2.54 65, 71.8
IIVIIV on CL (𝜔2
𝐶𝐿, variance) 0.0535 6.71 0.0464; 0.0605 19.7 cov(CL,V1) (𝜔𝐶𝐿,𝑉2,, covariance) 0.0171 13.8 0.0125; 0.0218IIV on V1 (, variance) 0.0332 5.31 0.0297; 0.0366 36.3 cov(CL,V2) (, covariance) 0.0633 25.2 0.0321; 0.0946 cov(V1,V2) (𝜔𝐶𝐿,𝑉2, covariance) -0.014 -105 -0.0429; 0.0148IIV on V2 (𝜔2
𝑉2, variance) 0.858 11.8 0.659; 1.06 54.7IIV on Imax (𝜔2
𝐼𝑚𝑎𝑥, variance) 0.0596 9.51 0.0485; 0.0707 38.1Residual variabilityProportional residual error (𝜎𝑝𝑟𝑜𝑝) 0.162 0.521 0.161; 0.164 13.5Additive residual error (𝜎𝑎𝑑𝑑), (µg/mL) 2.43 0.904 2.39; 2.48
IIV, interindividual variability; TT, tumor type Covariate-PK parameter relationship not included* %RSE = SE / estimate * 100† Calculated as estimate ± 1.96· SE‡ Fixed
Figure 2. Conditional weighted residuals for the final reduced model
−6
−3
0
3
6
0 200 400 600 0 200 400 600 0 200 400 600
Time, days
CW
RESI
1 2 3
Conditioned by study: 1=JAVELIN Solid Tumor, 2=JAVELIN Solid Tumor JPN, 3=JAVELIN Merkel 200. Points are observations. Orange lines are loess smooths through the data. Black lines are lines of identity or zero lines as appropriate.
Figure 3. Visual predicted check for the final reduced model
Time after dose (10 mg/kg) Complete time course (10 mg/kg)
0
200
400
600
0 200 400 600
0
200
400
600
2500 5000 7500 10000
Time after dose, hours Time, hours
Co
nce
ntra
tion,
µg
/mL
Co
nce
ntra
tion,
µg
/mL
Red points are observations. Blue lines are observed median, 5th and 95th percentiles. Orange shaded areas are 95% confidence intervals for simulated median, 5th and 95th percentiles.
Figure 4. Relationships between covariates and PK parameters (CL, V1 and Imax)
●
●
●
●
●
●
●
●
●
●
●
●
●
●
●
●
●
●
●
Previous biologic: Yes
Concomitant opioid: No
AST: 80 U/L
AST: 10 U/L
Platelets: 524 x 109/L
Platelets: 116 x 109/L
CRP: 168 g/L
CRP: 34 g/L
CRP: 4 g/L
CRP: 0.5 g/L
HAHA (ever): Yes
Tumor size: 208 mm
Tumor size: 13 mm
eGFR: 160 mL/min/1.73 m2
eGFR: 40 mL/min/1.73 m2
Albumin: 47 g/L
Albumin: 27 g/L
Race: Black
Age: 86 y
Age: 30 y
Sex: Female
Weight: 125 kg
Weight: 100 kg
Weight: 50 kg
Reference CL
0.50 0.60 0.70 0.80 0.90 1.00 1.10 1.20 1.300.75 1.25
Relative CL
●
●
●
●
●
Previous biologic: Yes
Albumin: 47 g/L
Albumin: 27 g/L
Sex: Female
Weight: 125 kg
Weight: 100 kg
Weight: 50 kg
Reference V1
0.50 0.60 0.70 0.80 0.90 1.00 1.10 1.20 1.300.75 1.25
Relative V1
Tumor type: MCC
Tumor type: Head & neck
Reference Imax
−1.0 −0.8 −0.6 −0.4 −0.2 0.0 0.2 0.4 0.6
Estimated Imax
HAHA, human anti-human antibodySmall diamonds with error bars represent effects of continuous covariates at specific covariate values of clinical interest. Large diamonds with error bars represent effects of categorical covariates with 95% confidence intervals. Vertical dashed lines represent relative CL values of 0.75, 1, and 1.25.
CONCLUSIONS
• The PopPK model incorporating time-varying CL described theobserved data well
• Time-varying CL has also been observed in other anti–PD-1/PD-L1antibodies such as nivolumab, pembrolizumab and atezolizumab7,10,11
• It may be related to post-treatment effects on disease impactingexposure, such as inflammation, cachexia, tumor dynamics, ortreatment efficacy7
• The identified covariates did not warrant dose adjustment
REFERENCES
1. Bavencio (avelumab) [package insert]. Darmstadt, Germany: Merck KGaA; 2017.
2. Heery CR, et al. Lancet Oncol. 2017;18(5):587-97.
3. Kaufman HL, et al. Cancer Res. 2017;77(13 suppl):Abstract CT079.
4. Patel M, et al. J Clin Oncol. 2017;35(suppl 6S):Abstract 330.
5. Gulley JL, et al. Lancet Oncol. 2017;18(5):599-610.
6. Jerusalem G, et al. J Thoracic Oncol. 2017;12(S1):Abstract OA03.03.
7. Liu C, et al. Clin Pharmacol Ther. 2017;101(5):657-66.
8. Gastonguay M. PAGE 20, Athens, Greece, 2011:Abstract 2229.
9. Wählby U, et al. Br J Clin Pharmacol. 2004;58(4):367-77.
10. Li H, et al. J Pharmacokinet Pharmacodyn. 2017 Jun 1. [Epub ahead of print].
11. Atezolizumab. https://www.accessdata.fda.gov/drugsatfda_docs/nda/2016/761041Orig1s000Clin
PharmR.pdf.
ACKNOWLEDGMENTS
The authors thank the patients and their families, investigators, co-investigators, and the study teams at each of the participating centers and at Merck KGaA, Darmstadt, Germany, and EMD Serono, Billerica, MA, USA (a business of Merck KGaA, Darmstadt, Germany). The trials reported in this analysis were sponsored by Merck KGaA, Darmstadt, Germany, and are part of an alliance between Merck KGaA, Darmstadt, Germany and Pfizer Inc, New York, NY, USA. Medical writing support was provided by ClinicalThinking Inc, Hamilton, NJ, USA, and funded by Merck KGaA, Darmstadt, Germany, and Pfizer Inc, New York, NY, USA.
Copies of this poster obtained through Quick Response (QR) Code are for
personal use only and may not be reproduced without permission from
the author of this poster.
Correspondence: Justin Wilkins, [email protected]
GET POSTER PDF
Poster presentation at the 8th ACoP Annual Meeting, October 15-18, 2017; Marriott Resort: Harbor Beach Hotel, Fort Lauderdale, FL, USA
Population pharmacokinetic analysis of avelumab in different cancer typesJ. Wilkins1, B. Brockhaus2, S. Wang2, H. Dai3, B. Neuteboom3, S. Brar4, C. Bello4, A. Khandelwal2, P. Girard5
1Occams Coöperatie U.A., Amstelveen, The Netherlands; 2Merck KGaA, Darmstadt, Germany; 3EMD Serono Research & Development Institute, Inc, Billerica, MA, USA; 4Pfizer, La Jolla, CA, USA; 5Merck Institute for Pharmacometrics, Lausanne, Switzerland