population nih public access author manuscript … · vesicle invasion (svi), extra-capsular...
TRANSCRIPT
Validation of a Genomic Classifier that Predicts MetastasisFollowing Radical Prostatectomy in an At Risk PatientPopulation
R. Jeffrey Karnes1, Eric J. Bergstralh2, Elai Davicioni3, Mercedeh Ghadessi3, ChristineBuerki3, Anirban P. Mitra4, Anamaria Crisan3, Nicholas Erho3, Ismael A. Vergara3, Lucia L.Lam3, Rachel Carlson2, Darby J. S. Thompson5, Zaid Haddad3, Benedikt Zimmermann3,Thomas Sierocinski3, Timothy J. Triche3,4, Thomas Kollmeyer6, Karla V. Ballman2, Peter C.Black7, George G. Klee6, and Robert B. Jenkins6
1Department of Urology, Mayo Clinic, Rochester, MN, USA
2Department of Health Sciences Research, Mayo Clinic, Rochester, MN, USA
3GenomeDx Biosciences Inc., Vancouver, BC, Canada
4Department of Pathology, University of Southern California, Los Angeles, CA, USA
5EMMES Canada, Burnaby, BC, Canada
6Department of Laboratory Medicine and Pathology, Mayo Clinic, Rochester, MN, USA
7Department of Urologic Sciences, University of British Columbia, Vancouver, BC, Canada
Abstract
Purpose—Prostate cancer patients with locally advanced disease after radical prostatectomy
(RP) are candidates for secondary therapy. However, this higher risk population is heterogeneous
and many will not metastasize even when conservatively managed. Given the limited specificity
of pathologic features to predict metastasis, newer risk-prediction models are needed. This
represents a validation study of a genomic classifier (GC) that predicts post-RP metastasis in a
high-risk population.
Materials and Methods—A case-cohort design was used to sample 1,010 post-RP patients at
high risk of recurrence treated between 2000-2006. Patients had preoperative PSA >20 ng/mL,
Gleason ≥8, pT3b or GPSM score ≥10. Patients with metastasis at diagnosis or any prior treatment
for prostate cancer were excluded. 20% random sampling created a subcohort that included all
cases with metastasis. 22-marker GC scores were generated for 219 patients with available
genomic data. Receiver operating characteristic and decision curves, competing risk, and weighted
regression models assessed GC performance.
Address correspondence to: R. Jeffrey Karnes, M.D. Department of Urology Mayo Clinic 200 First Street SW Rochester, MN55905, USA [email protected].
DISCLOSURE / CONFLICTS OF INTERESTThis study was partly funded by GenomeDx Biosciences Inc. Elai Davicioni, Mercedeh Ghadessi, Christine Buerki, Anamaria Crisan,Nicholas Erho, Ismael A. Vergara, Lucia L. Lam, Zaid Haddad, Benedikt Zimmermann, Thomas Sierocinski, and Timothy J. Tricheare employees of GenomeDx Biosciences Inc. Darby J. S. Thompson and Peter C. Black are consultants for GenomeDx BiosciencesInc.
NIH Public AccessAuthor ManuscriptJ Urol. Author manuscript; available in PMC 2014 July 15.
Published in final edited form as:J Urol. 2013 December ; 190(6): 2047–2053. doi:10.1016/j.juro.2013.06.017.
NIH
-PA
Author M
anuscriptN
IH-P
A A
uthor Manuscript
NIH
-PA
Author M
anuscript
Results—GC had area under the curve of 0.79 for predicting 5-year metastasis post-RP. Decision
curves showed that net benefit of GC exceeded clinical-only models. GC was the predominant
predictor of metastasis in multivariable analysis. Cumulative incidence of metastasis at 5 years
post-RP was 2.4%, 6.0% and 22.5% for patients with low (60% of patients), intermediate (21% of
patients), and high (19% of patients) GC scores, respectively (p<0.001).
Conclusions—These results indicate that genomic information from the primary tumor can
identify patients with adverse pathology who are most at risk for metastasis and potentially lethal
prostate cancer.
Keywords
prostate cancer; prognosis; metastasis; transcriptome analysis
INTRODUCTION
Prostate cancer is the most common cancer in men and the global burden is expected to
increase to 1.7 million new cases and 499,000 deaths annually by 2030.1 In the US, among
the ~2.5 million men with prostate cancer, 5-year relative survival for loco-regional disease
(~96% of diagnoses) is nearly 100%.2 However, this overall favorable statistic hides the fact
that 29,000 men died from prostate cancer in 2012.3 Most men who die of prostate cancer
have localized disease on initial biopsy, but after radical prostatectomy (RP) are found to
have tumors with one or more adverse pathological features.4 These ‘high-risk’ men often
developed rising prostate-specific antigen (PSA) or biochemical recurrence (BCR).
Following RP, some high-risk men developed bone metastasis and/or died from disease
(typically within 10 years of diagnosis).5, 6 Unfortunately, in men with high-risk prostate
cancer the mortality rate has not effectively improved over the last 20 years.2
These findings highlight the need for identification at diagnosis of truly aggressive tumors
with an inherently greater potential for early metastasis.7 These are the men who have the
most to gain from early secondary therapies and clinical trials.8-11 Currently, adverse
pathological features such as Gleason pattern ≥4, positive surgical margins (SM+), seminal
vesicle invasion (SVI), extra-capsular extension (ECE) and preoperative PSA ≥20 ng/ml are
used to identify high-risk men. These are candidates for secondary therapy such as
postoperative radiation;12 however, few will develop metastasis and die of prostate cancer –
even when managed expectantly.6, 13 Thus clinicians are reluctant to recommend
postoperative radiation, despite evidence8-10 that demonstrates its efficacy in high-risk
men.14 Metastatic progression can be delayed if not prevented by early secondary
intervention.4 However, clinicians perceive that the sum of costs and morbidity of secondary
therapy will exceed its benefits if applied to all patients with adverse pathology.13
We previously reported the development and validation of a post-RP genomic classifier
(GC, Decipher™) that predicts early metastasis through an oligonucleotide microarray to
profile RNA from formalin-fixed, paraffin-embedded RP specimens. Using a retrospective,
nested, case-control design with a median follow-up of 16.9 years, we found unique patterns
of differential expression for 192 early metastasis cases (i.e., within 5 years of rising PSA)
in comparison to 271 controls irrespective of BCR.15 We used these expression patterns to
Karnes et al. Page 2
J Urol. Author manuscript; available in PMC 2014 July 15.
NIH
-PA
Author M
anuscriptN
IH-P
A A
uthor Manuscript
NIH
-PA
Author M
anuscript
develop and validate a 22-marker GC to predict early clinical metastasis.16 The GC was a
more specific predictor of aggressive disease than clinical variables or previously reported
gene signatures. Here, we report a blinded study of a prospectively-designed cohort to
evaluate GC for predicting clinical metastasis in a contemporary, high-risk population of
patients treated with RP.
MATERIALS AND METHODS
Study Design
Patients treated with RP between 2000 and 2006 were identified from the Mayo Clinic
tumor registry for a case-cohort study design. This involved identification of all patients
with metastasis and a representative of the full cohort (see Appendix). Thus, men at high
risk of recurrence post-RP (open/robotic) with no prior neoadjuvant/prostate cancertreatment were selected based on any of preoperative PSA >20 ng/mL, pathological Gleason
score (GS) ≥8, SVI, or GPSM (GS; preoperative PSA; SVI; margins) score ≥10.17 The
cohort of 1,010 men included 73 cases with metastasis as evidenced by CT or bone scan. A
20% random sample (n=202) was drawn from the cohort. This included 19 of 73 metastatic
cases. To increase sampling of metastasis, the remaining 54 metastatic cases were added
(Table S1), resulting in a final study set of 256 patients (Figure S1). Patients not
experiencing metastasis regardless of BCR (defined as follow-up PSA ≥0.4 ng/mL >30 days
post-RP) were censored at last follow-up. The study was approved by Mayo Clinic
Institutional Review Board.
Tissue Processing and Application of Prognostic Classifiers
Following histopathological re-review, the dominant Gleason lesion (highest grade) was
macrodissected for 238 available patient samples for microarray analysis. GC scores were
computed for 219 samples that passed quality control based on the predefined 22-marker
classifier.16 Study participants except Mayo Clinic statisticians who selected the study
population were blinded to outcomes and clinical data. Previously described clinical-only
(CC), combined genomic-clinical classifiers16 and scores for two validated prediction
models, GPSM17 and Stephenson nomogram18 were evaluated. GC was also assessed on
384 additional post-RP patients from three independent datasets (see Appendix).
Statistical Analysis
Discrimination was measured by area under the receiver-operating characteristic curve
(AUC) for censored survival data (survival ROC). Net clinical benefit was estimated using
an extension of decision curve analysis for survival data. Univariable (UVA) and
multivariable (MVA) Cox proportional hazards models were used for risk ratio estimation.19
Cumulative incidence curves were constructed using Fine-Gray competing risks analysis.20
Survival analyses were weighted to estimate parameters in the cohort (For further details
see Appendix).
Karnes et al. Page 3
J Urol. Author manuscript; available in PMC 2014 July 15.
NIH
-PA
Author M
anuscriptN
IH-P
A A
uthor Manuscript
NIH
-PA
Author M
anuscript
RESULTS
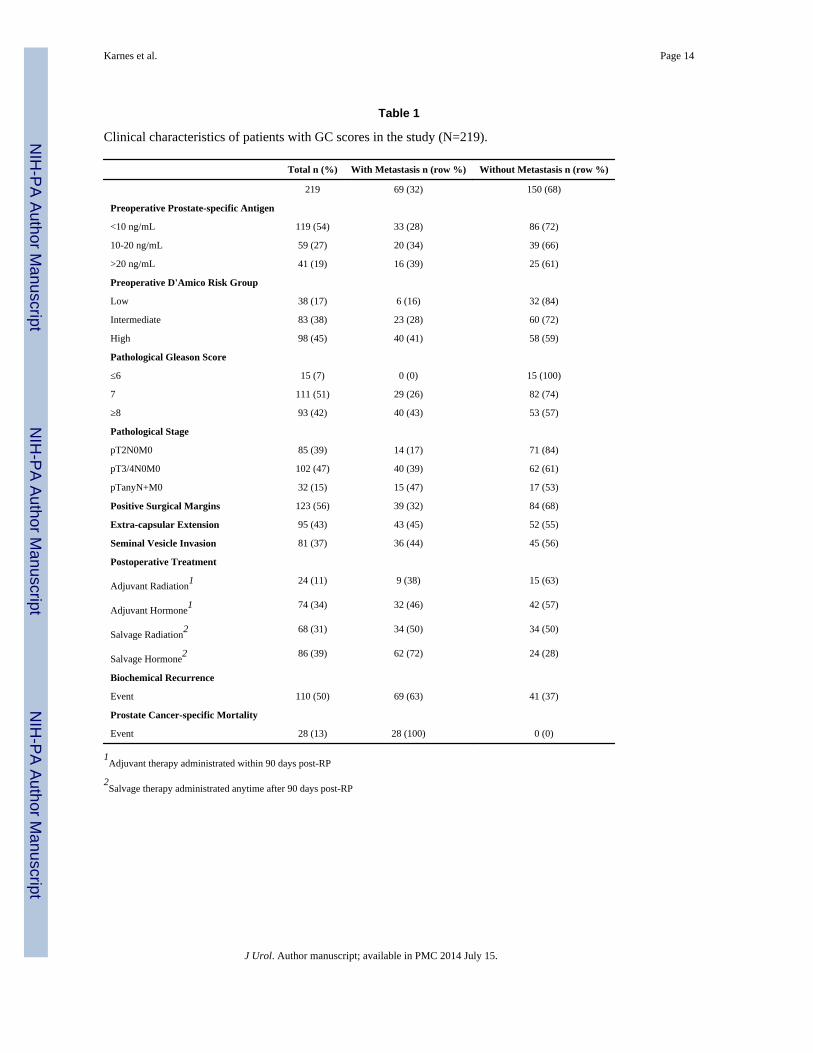
This study profiled RNA from formalin-fixed, paraffin-embedded primary prostate cancer
specimens from patients treated with RP. After exclusion for tissue unavailability and
quality control, the study consisted of 219 patients including 69 cases with metastasis, with a
median follow-up of 6.7 years (Figure S1). BCR rates at 3 years (35%) and metastasis at 5
years (6%) post-RP were similar to the original cohort, indicating representative sampling
(Table S1). Median age was 63 years (46-78 years) and 93% of tumors were GS ≥7, 47%
pT3, and 56% SM+ (Table 1). Interestingly, most patients with adverse pathology (55%)
met criteria for low-intermediate D'Amico risk groups prior to RP, suggesting many were
significantly up-graded and up-staged post-RP. Median times to BCR and metastasis post-
RP were 1.2 and 3.1 years, respectively.
Survival ROC curves were used to assess classifier discrimination. The AUC for GC was
0.79 (95% CI: 0.68-0.87), outperforming all clinical variables (AUCs: 0.49-0.65; Figure 1).
Incorporating all clinical variables into GC marginally increased the AUC to 0.82 (95% CI:
0.72-0.88, data not shown). Median GC scores were consistently higher in patients who
metastasized compared to those who did not experience metastasis at last follow-up in this
study and in three independent datasets (Figure S2). Decision curves compared the net
clinical benefit (i.e., clinical implication of false positives) of genomic-based classifiers with
clinical-only models. Overall, the higher net benefit of genomic-based classifiers compared
to clinical-only risk models suggests that GC models have increased specificity (i.e., lower
false positives), without sacrificing sensitivity (Figure 2).
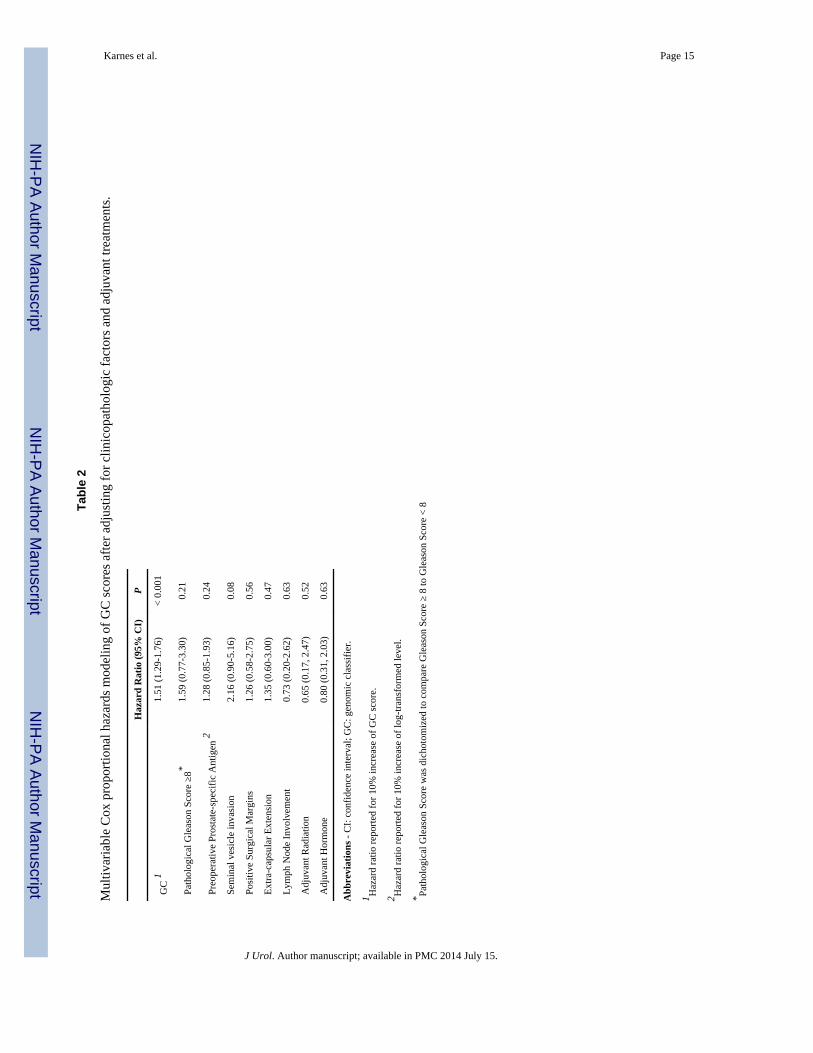
By UVA, GC had the highest significant hazard ratio (HR) among classifiers (1.58 for each
10% score increase). Among clinical variables, ECE, GS and SVI were significant
prognostic factors (Table S2). Node positivity, preoperative PSA and SM+ were not
significant. Patients receiving adjuvant hormone therapy had increased HR (1.97, p=0.02)
for metastasis, likely because they were patients who were perceived most at risk. By MVA,
only GC retained a significant HR when adjusted for clinical variables and postoperative
adjuvant therapy (Table 2; p<0.001). GS was alternatively parameterized (e.g., 3+4, 4+3, 8,
9-10), but this did not change the significance of GC (Table S3). Three additional MVAs
were performed to model GC with clinical-only nomograms. Only the Stephenson
nomogram retained a significant HR (p=0.04) with GC as the dominant variable (Table S4).
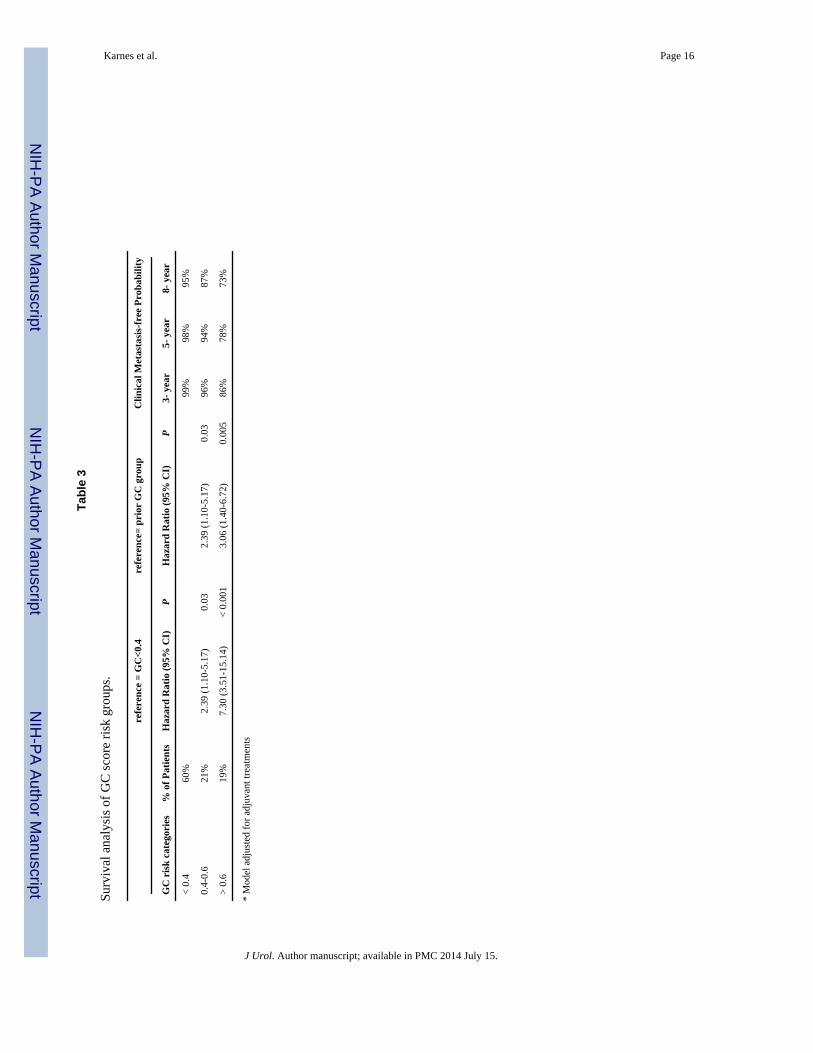
To investigate the magnitude of HR for increments in GC score, we evaluated the effect size
of each 10% increase for predicting metastasis after adjusting for postoperative treatment
(Table S5, Appendix).21 We observed a general trend of increasing HR and decreasing
probability of metastasis-free survival with increasing deciles (Cochran-Armitage trend
independence test, p<0.035), although differences between deciles were not statistically
significant, likely due to fewer patients in higher GC score deciles. Score deciles were then
incrementally collapsed to create three GC risk groups (GC<0.4, 0.4-0.6, >0.6), which
showed significant differences in HR (and metastasis-free survival) in comparison to the
reference group and to the prior level (Table 3). Progression-free probability estimates and
cumulative incidence plots (Figure 3) showed that 60% of patients had GC<0.4 (i.e., number
at risk at t=0), and they have a 5-year cumulative incidence of metastasis of just 2.4%. In
Karnes et al. Page 4
J Urol. Author manuscript; available in PMC 2014 July 15.
NIH
-PA
Author M
anuscriptN
IH-P
A A
uthor Manuscript
NIH
-PA
Author M
anuscript
contrast, the 20% of patients with GC>0.6 had 22.5% 5-year cumulative incidence
(p<0.001). Similar results were obtained when patients receiving adjuvant treatment were
excluded (Figure S3).
Since GS was the strongest clinical predictor of metastasis, we compared the distribution of
GC scores across GS groups; as expected median GC increased with higher GS groups
(Figure 4, Table 4). Among patients with GS ≤6, none had GC>0.6 or had clinical
metastasis on study follow-up. Among patients with GS 7 tumors, 41% had GC≥0.4 and
44% of these men had clinical metastasis. Conversely, for GS 7 tumors with low GC (<0.4),
86% of them did not metastasize and only 3% died of their disease. As expected, 40% of
patients with GS ≥8 had high GC scores (>0.6), of whom 62% experienced metastasis and
41% died of their disease. However, more than a third of patients with GS ≥8 (36%) had low
GC scores, and the majority of these men did not have metastasis (77%) or die of prostate
cancer (85%). This reclassification was significant (McNemar's chi square p=2.2×10⁻¹⁶).
The data suggests that GC may identify a subset of men with ‘high-risk’ GS ≥8 tumors that
may never develop clinical metastasis and, conversely, among patients with ‘intermediate
risk’ GS 7 tumors, a subset enriched for clinical metastasis events, although such
interpretations may need to be made in the context of additional clinical data.
DISCUSSION
This blinded, prospectively designed study independently validates a novel GC for
prediction of prostate cancer metastasis following RP. The results show that GC has
improved performance over any individual clinicopathologic variable or multivariable
prediction model. In this contemporary (2000-2006) population of 1,010 men at risk of
recurrence following RP, the cumulative incidence of metastasis was only 6% at 5 years
(7.2% at 10 years). The GC score re-stratified this population such that low-score group
patients had nearly three times lower cumulative incidence of metastasis than average and
high-score group patients had nearly four times higher cumulative incidence of metastasis.
Even after adjusting for postoperative therapy and clinical variables, GC provided
independent prediction of metastasis. When assessed in 384 patients from independent
datasets, GC retained its prognostic potential with higher scores in patients who
metastasized (see Appendix). Further, clinical utility studies indicate that GC can potentially
modify patient management,22 and this is also evident at the individual patient level.
Stephenson et al. previously developed and validated a nomogram to predict the probability
of prostate cancer-specific mortality using standard clinical parameters.23 Few of the
patients in Stephenson et al. had a predicted 15-year metastasis incidence greater than 5%.
The authors concluded that there is a “difficulty in identifying patients at substantially
increased risk on the basis of clinical parameters alone and the need for novel markers
specifically associated with the biology of lethal prostate cancer is evident”.23 Drawing from
advances in expression profiling and genomics, many signatures of aggressive disease have
been proposed,24 but to our knowledge none have demonstrated significant improvements in
prediction of aggressive prostate cancer over risk prediction models such as the Stephenson
nomogram. This is probably because most studies involving RP patients used BCR as an
endpoint, a non-specific surrogate for metastatic and lethal disease.25 In fact, our
Karnes et al. Page 5
J Urol. Author manuscript; available in PMC 2014 July 15.
NIH
-PA
Author M
anuscriptN
IH-P
A A
uthor Manuscript
NIH
-PA
Author M
anuscript
investigations using transcriptome-wide expression profiling to compare patients who
develop BCR (but not metastasis with long term follow-up) and those with no evidence of
disease in the absence of secondary treatment have revealed very few differences in RNA
expression between these groups.15 This contrasts with patients who develop metastasis.
Their primary tumors show many thousands of differentially expressed RNAs when
compared to patients with no evidence of disease or BCR-only. Furthermore, most previous
studies represented a broader prostate cancer population, which, in the era of PSA screening,
consisted of RP cases that are not necessarily representative of current cancer
presentations.25
In our previous study, we used high-density (~1.4 million features) expression arrays to
discover and validate primary tumor differential expression patterns associated with prostate
cancer death and/or metastasis as endpoints.16 The transcriptome-wide approach allowed
interrogation of a richer genomic dataset, including thousands of non-coding RNAs
(ncRNA), compared to previous efforts that were primarily protein-coding “gene-centric”.26
Indeed, recent investigations of ncRNA have demonstrated key regulatory functions on
genes involved in metastatic disease progression.27 Perhaps ncRNAs in GC encode
additional prognostic information missing from previous protein-coding gene expression
signatures and can therefore provide improved prediction of aggressive disease over
clinicopathologic variables and nomograms in the clinically high-risk population.26
Although majority of patients with aggressive prostate cancer have adverse pathology post-
RP, patients with intermediate risk tumors (e.g., GS 7 and SM-) may also progress to
advanced disease.4 Indeed, based on preoperative clinical criteria, most patients in this study
had low-intermediate D'Amico risk disease. Therefore additional studies are warranted to
determine whether GC scores obtained from diagnostic biopsy specimens can predict
metastasis as well as in postoperative specimens. In this cohort, nearly 15% of patients were
N+ and 45% received adjuvant therapy; the overall validation of GC on an adjuvant therapy-
rich cohort may represent a limitation. While adjusting for secondary therapy in
multivariable analysis showed that GC remained an independent and significant predictor of
metastasis, we could not determine whether GC predicts benefit from local (i.e, radiation) or
systemic (e.g., hormone) therapies as patients were not randomized to these treatments.
Evaluation of GC in randomized clinical trial datasets will help to better understand the
relationship between GC and benefit from specific therapies, and in turn can also lead to
better selection of truly high-risk patients for future trials.
Experience over the last decade suggests that RP is used more frequently to manage more
aggressive disease.28 Recent PSA screening guidelines may also likely result in greater
proportions of men presenting with more aggressive disease features.29 As a result, many
contemporary patients with adverse pathology may require additional post-RP intervention
as long-term cancer control may not be achieved by surgery alone.4 Three large randomized
trials have shown improved outcomes for patients with adverse pathology when treated with
adjuvant radiotherapy.8-10 Initial reports from the RTOG 96-01 trial indicated that
intensification with multimodal therapy post-RP reduced the incidence of metastases.30
Despite this evidence, application of postoperative secondary therapy for individual patients
remains challenging. Concerns for over-treatment causing toxicity and morbidity must be
Karnes et al. Page 6
J Urol. Author manuscript; available in PMC 2014 July 15.
NIH
-PA
Author M
anuscriptN
IH-P
A A
uthor Manuscript
NIH
-PA
Author M
anuscript
weighed with the potential harm of disease progression. The alternative is often observation
with intervention only when the PSA rises, which may prevent over-treatment but may delay
treatment until the disease has already disseminated. A better predictor of metastasis from
analysis of the primary tumor, long before metastasis manifests clinically, would enable
more tailored application of multimodal therapy and enhanced clinical trial design for high-
risk prostate cancer.
CONCLUSIONS
We show that genomic information significantly improves prediction of metastatic disease
compared to established clinicopathologic risk factors in a contemporary cohort of men at
high-risk of recurrence post-RP. Furthermore, we document that most of the prognostic
information for predicting metastatic disease is captured by genomic variables measured in
the primary tumor. These data suggest that genomic alterations in aggressive prostate cancer
manifest early, many years before the metastatic disease is detected clinically. Use of
genomic information to characterize the true biological potential of a tumor to metastasize
may ultimately lead to improved treatment of prostate cancer patients.
Supplementary Material
Refer to Web version on PubMed Central for supplementary material.
Acknowledgments
The authors would like to thank Stephanie Fink for her assistance with these experiments.
Funding support: NIH P50 CA91956 Mayo Prostate Cancer SPORE grant; Richard M. Schulze FamilyFoundation; National Research Council of Canada Industrial Research Assistance Program; GenomeDxBiosciences Inc.
REFERENCES
1. Center MM, Jemal A, Lortet-Tieulent J, et al. International variation in prostate cancer incidenceand mortality rates. Eur Urol. 2012; 61:1079. [PubMed: 22424666]
2. Brawley OW. Prostate cancer epidemiology in the United States. World J Urol. 2012; 30:195.[PubMed: 22476558]
3. Siegel R, Naishadham D, Jemal A. Cancer statistics, 2012. CA Cancer J Clin. 2012; 62:10.[PubMed: 22237781]
4. Swanson GP, Basler JW. Prognostic factors for failure after prostatectomy. J Cancer. 2011; 2:1.[PubMed: 21197260]
5. Uchio EM, Aslan M, Wells CK, et al. Impact of biochemical recurrence in prostate cancer amongUS veterans. Arch Intern Med. 2010; 170:1390. [PubMed: 20696967]
6. Pound CR, Partin AW, Eisenberger MA, et al. Natural history of progression after PSA elevationfollowing radical prostatectomy. JAMA. 1999; 281:1591. [PubMed: 10235151]
7. Bastian PJ, Boorjian SA, Bossi A, et al. High-risk prostate cancer: from definition to contemporarymanagement. Eur Urol. 2012; 61:1096. [PubMed: 22386839]
8. Thompson IM, Tangen CM, Paradelo J, et al. Adjuvant radiotherapy for pathological T3N0M0prostate cancer significantly reduces risk of metastases and improves survival: long-term followupof a randomized clinical trial. J Urol. 2009; 181:956. [PubMed: 19167731]
Karnes et al. Page 7
J Urol. Author manuscript; available in PMC 2014 July 15.
NIH
-PA
Author M
anuscriptN
IH-P
A A
uthor Manuscript
NIH
-PA
Author M
anuscript
9. Bolla M, van Poppel H, Tombal B, et al. Postoperative radiotherapy after radical prostatectomy forhigh-risk prostate cancer: long-term results of a randomised controlled trial (EORTC trial 22911).The Lancet. 2012; 380:2018.
10. Wiegel T, Bottke D, Steiner U, et al. Phase III postoperative adjuvant radiotherapy after radicalprostatectomy compared with radical prostatectomy alone in pT3 prostate cancer withpostoperative undetectable prostate-specific antigen: ARO 96-02/AUO AP 09/95. J Clin Oncol.2009; 27:2924. [PubMed: 19433689]
11. Schubert M, Joniau S, Gontero P, et al. The role of adjuvant hormonal treatment after surgery forlocalized high-risk prostate cancer: results of a matched multiinstitutional analysis. Adv Urol.2012; 2012:612707. [PubMed: 22400018]
12. Roehl KA, Han M, Ramos CG, et al. Cancer progression and survival rates following anatomicalradical retropubic prostatectomy in 3,478 consecutive patients: long-term results. J Urol. 2004;172:910. [PubMed: 15310996]
13. Boorjian SA, Thompson RH, Tollefson MK, et al. Long-term risk of clinical progression afterbiochemical recurrence following radical prostatectomy: the impact of time from surgery torecurrence. Eur Urol. 2011; 59:893. [PubMed: 21388736]
14. Hoffman KE, Nguyen PL, Chen MH, et al. Recommendations for post-prostatectomy radiationtherapy in the United States before and after the presentation of randomized trials. J Urol. 2011;185:116. [PubMed: 21074194]
15. Crisan A, Vergara I, Ghadessi M, et al. Clinical and genomic analysis of metastatic diseaseprogression in a background of biochemical recurrence. J Urol. 2013; 189:e918.
16. Erho N, Crisan A, Vergara IA, et al. Discovery and Validation of a Prostate Cancer GenomicClassifier that Predicts Early Metastasis Following Radical Prostatectomy. PLoS One. 2013 InPress.
17. Thompson RH, Blute ML, Slezak JM, et al. Is the GPSM scoring algorithm for patients withprostate cancer valid in the contemporary era? J Urol. 2007; 178:459. [PubMed: 17561132]
18. Stephenson AJ, Scardino PT, Eastham JA, et al. Postoperative nomogram predicting the 10-yearprobability of prostate cancer recurrence after radical prostatectomy. J Clin Oncol. 2005; 23:7005.[PubMed: 16192588]
19. Lin DY, Ying Z. Cox Regressio with Incomplete Covariate Measurements. Journal of AmericanStatistical Association. 1993; 88:1341.
20. Fine JP, Gray RJ. A proportional hazards model for the subdistribution of a competing risk. J AMStat Assoc. 1999; 94:496.
21. Cooperberg MR, Hilton JF, Carroll PR. The CAPRA-S score: A straightforward tool for improvedprediction of outcomes after radical prostatectomy. Cancer. 2011; 117:5039. [PubMed: 21647869]
22. Badani K, Thompson DJ, Buerki C, et al. Impact of a genomic classifier of metastatic risk onpostoperative treatment recommendations for prostate cancer patients: a report from the DECIDEstudy group. Oncotarget. 2013; 4:600. [PubMed: 23592338]
23. Stephenson AJ, Kattan MW, Eastham JA, et al. Prostate cancer-specific mortality after radicalprostatectomy for patients treated in the prostate-specific antigen era. J Clin Oncol. 2009; 27:4300.[PubMed: 19636023]
24. Sorensen KD, Orntoft TF. Discovery of prostate cancer biomarkers by microarray gene expressionprofiling. Expert Rev Mol Diagn. 2010; 10:49. [PubMed: 20014922]
25. Cuzick J, Swanson GP, Fisher G, et al. Prognostic value of an RNA expression signature derivedfrom cell cycle proliferation genes in patients with prostate cancer: a retrospective study. LancetOncol. 2011; 12:245. [PubMed: 21310658]
26. Vergara IA, Erho N, Triche TJ, et al. Genomic “Dark Matter” in Prostate Cancer: Exploring theClinical Utility of ncRNA as Biomarkers. Front Genet. 2012; 3:23. [PubMed: 22371711]
27. Prensner JR, Iyer MK, Balbin OA, et al. Transcriptome sequencing across a prostate cancer cohortidentifies PCAT-1, an unannotated lincRNA implicated in disease progression. Nat Biotechnol.2011; 29:742. [PubMed: 21804560]
28. Silberstein JL, Vickers AJ, Power NE, et al. Reverse stage shift at a tertiary care center: escalatingrisk in men undergoing radical prostatectomy. Cancer. 2011; 117:4855. [PubMed: 21484780]
Karnes et al. Page 8
J Urol. Author manuscript; available in PMC 2014 July 15.
NIH
-PA
Author M
anuscriptN
IH-P
A A
uthor Manuscript
NIH
-PA
Author M
anuscript
29. Moyer VA. Screening for Prostate Cancer: U.S. Preventive Services Task Force RecommendationStatement. Ann Intern Med. 2012; 157:120. [PubMed: 22801674]
30. Shipley WU, Hunt D, Lukka H, et al. Initial Report of RTOG 9601: A Phase III Trial in ProstateCancer: Anti-androgen Therapy (AAT) with Bicalutamide during and after Radiation Therapy(RT) Improves Freedom from Progression and Reduces the Incidence of Metastatic Disease inPatients following Radical Prostatectomy (RP) with pT2-3, N0 Disease, and Elevated PSA Levels.International Journal of Radiation Oncology Biology Physics. 2010; 78:S27.
Karnes et al. Page 9
J Urol. Author manuscript; available in PMC 2014 July 15.
NIH
-PA
Author M
anuscriptN
IH-P
A A
uthor Manuscript
NIH
-PA
Author M
anuscript
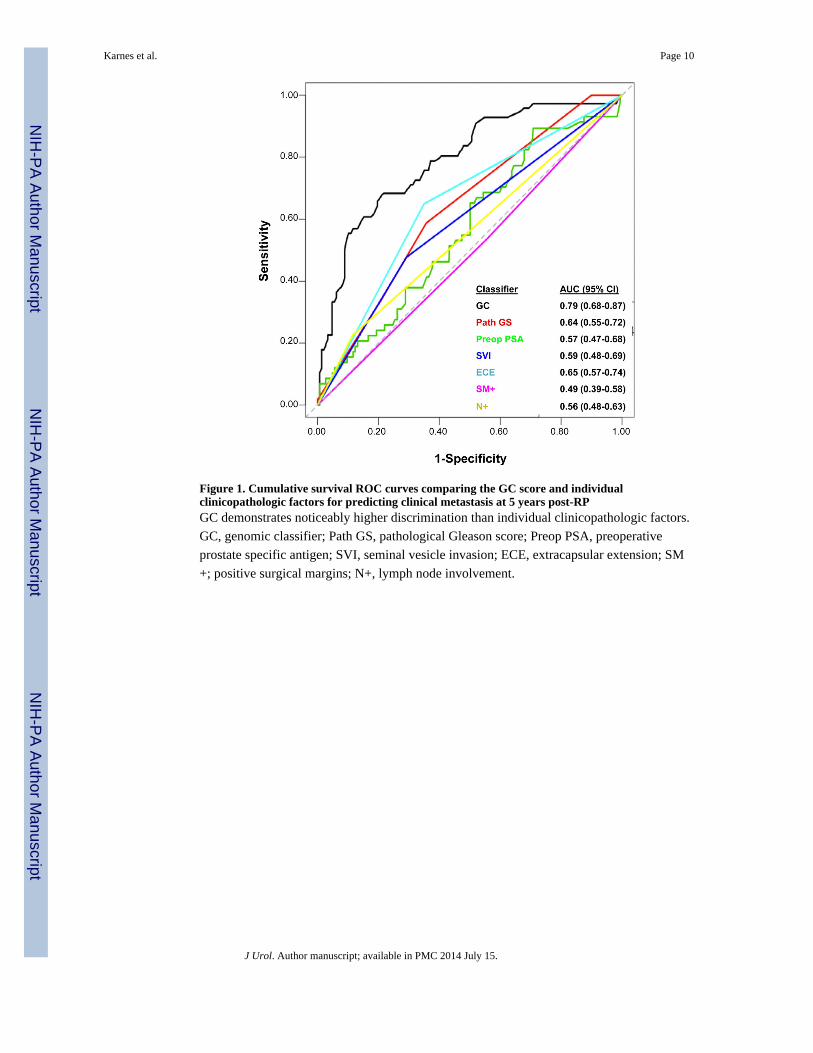
Figure 1. Cumulative survival ROC curves comparing the GC score and individualclinicopathologic factors for predicting clinical metastasis at 5 years post-RPGC demonstrates noticeably higher discrimination than individual clinicopathologic factors.
GC, genomic classifier; Path GS, pathological Gleason score; Preop PSA, preoperative
prostate specific antigen; SVI, seminal vesicle invasion; ECE, extracapsular extension; SM
+; positive surgical margins; N+, lymph node involvement.
Karnes et al. Page 10
J Urol. Author manuscript; available in PMC 2014 July 15.
NIH
-PA
Author M
anuscriptN
IH-P
A A
uthor Manuscript
NIH
-PA
Author M
anuscript
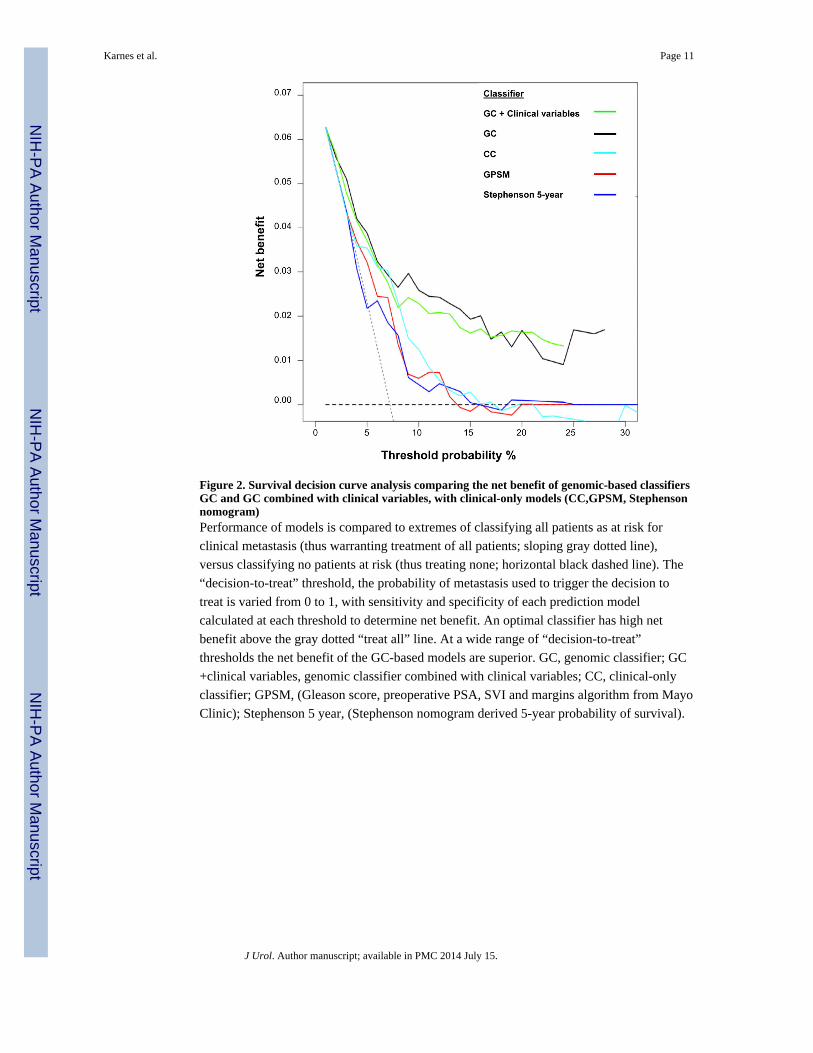
Figure 2. Survival decision curve analysis comparing the net benefit of genomic-based classifiersGC and GC combined with clinical variables, with clinical-only models (CC,GPSM, Stephensonnomogram)Performance of models is compared to extremes of classifying all patients as at risk for
clinical metastasis (thus warranting treatment of all patients; sloping gray dotted line),
versus classifying no patients at risk (thus treating none; horizontal black dashed line). The
“decision-to-treat” threshold, the probability of metastasis used to trigger the decision to
treat is varied from 0 to 1, with sensitivity and specificity of each prediction model
calculated at each threshold to determine net benefit. An optimal classifier has high net
benefit above the gray dotted “treat all” line. At a wide range of “decision-to-treat”
thresholds the net benefit of the GC-based models are superior. GC, genomic classifier; GC
+clinical variables, genomic classifier combined with clinical variables; CC, clinical-only
classifier; GPSM, (Gleason score, preoperative PSA, SVI and margins algorithm from Mayo
Clinic); Stephenson 5 year, (Stephenson nomogram derived 5-year probability of survival).
Karnes et al. Page 11
J Urol. Author manuscript; available in PMC 2014 July 15.
NIH
-PA
Author M
anuscriptN
IH-P
A A
uthor Manuscript
NIH
-PA
Author M
anuscript
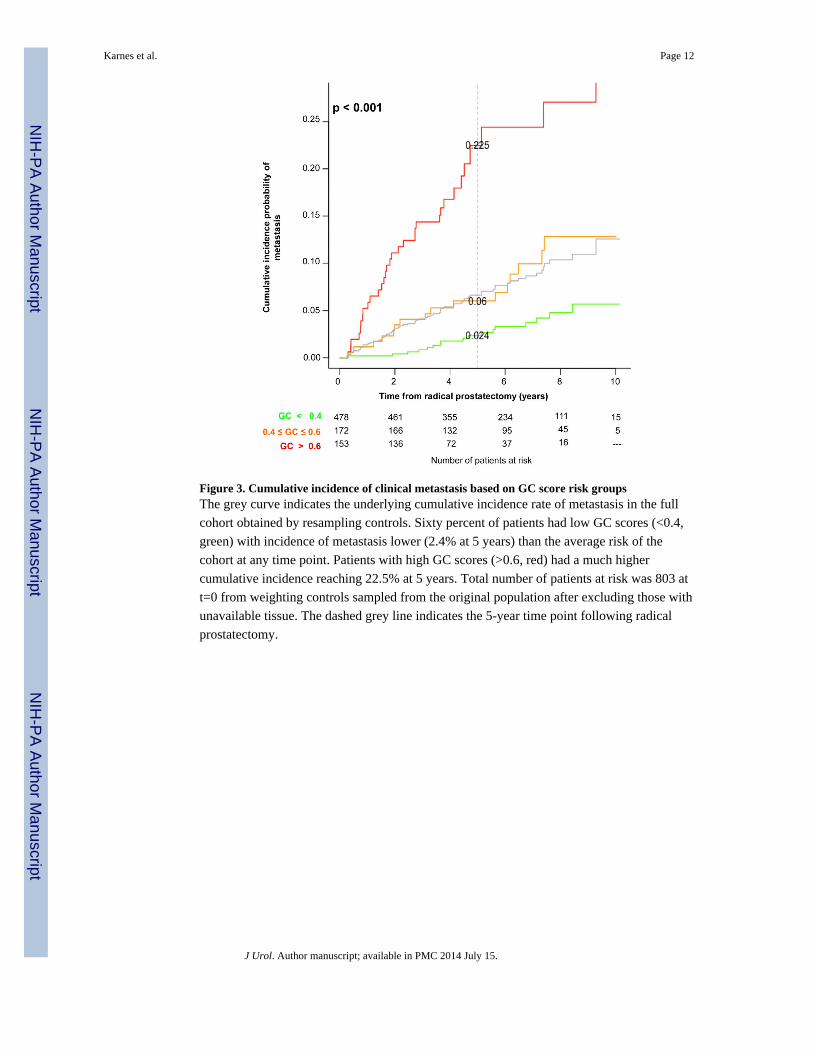
Figure 3. Cumulative incidence of clinical metastasis based on GC score risk groupsThe grey curve indicates the underlying cumulative incidence rate of metastasis in the full
cohort obtained by resampling controls. Sixty percent of patients had low GC scores (<0.4,
green) with incidence of metastasis lower (2.4% at 5 years) than the average risk of the
cohort at any time point. Patients with high GC scores (>0.6, red) had a much higher
cumulative incidence reaching 22.5% at 5 years. Total number of patients at risk was 803 at
t=0 from weighting controls sampled from the original population after excluding those with
unavailable tissue. The dashed grey line indicates the 5-year time point following radical
prostatectomy.
Karnes et al. Page 12
J Urol. Author manuscript; available in PMC 2014 July 15.
NIH
-PA
Author M
anuscriptN
IH-P
A A
uthor Manuscript
NIH
-PA
Author M
anuscript
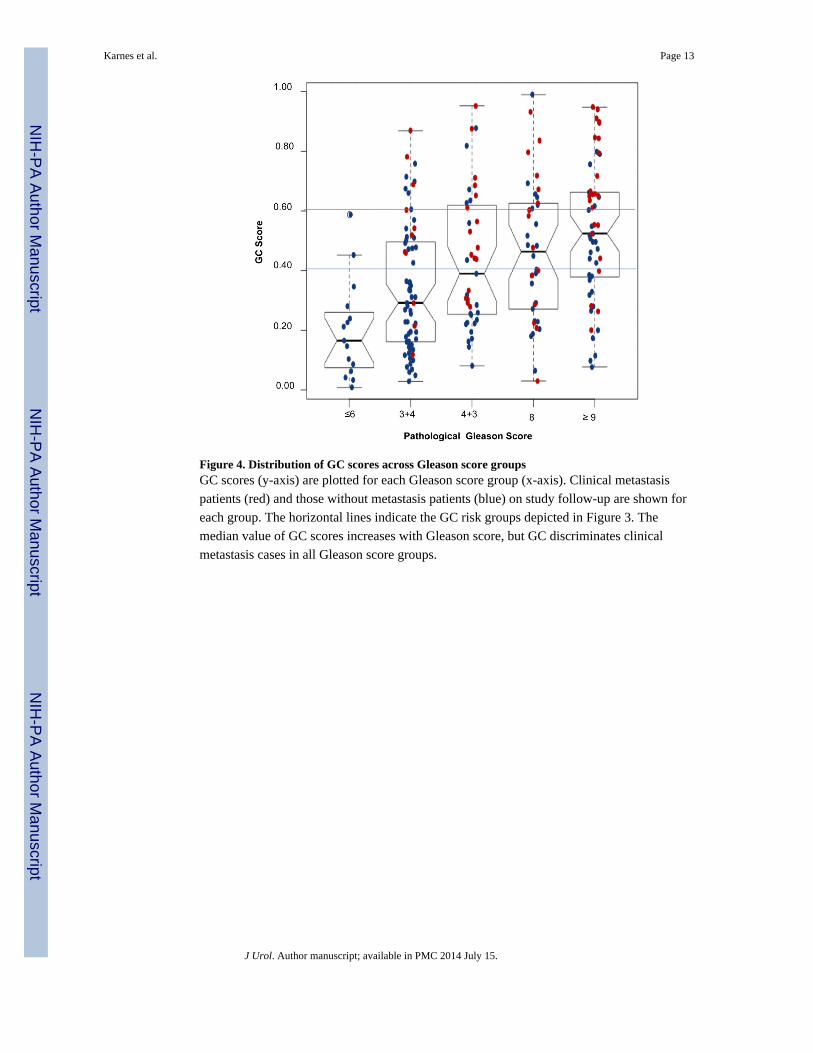
Figure 4. Distribution of GC scores across Gleason score groupsGC scores (y-axis) are plotted for each Gleason score group (x-axis). Clinical metastasis
patients (red) and those without metastasis patients (blue) on study follow-up are shown for
each group. The horizontal lines indicate the GC risk groups depicted in Figure 3. The
median value of GC scores increases with Gleason score, but GC discriminates clinical
metastasis cases in all Gleason score groups.
Karnes et al. Page 13
J Urol. Author manuscript; available in PMC 2014 July 15.
NIH
-PA
Author M
anuscriptN
IH-P
A A
uthor Manuscript
NIH
-PA
Author M
anuscript
NIH
-PA
Author M
anuscriptN
IH-P
A A
uthor Manuscript
NIH
-PA
Author M
anuscript
Karnes et al. Page 14
Table 1
Clinical characteristics of patients with GC scores in the study (N=219).
Total n (%) With Metastasis n (row %) Without Metastasis n (row %)
219 69 (32) 150 (68)
Preoperative Prostate-specific Antigen
<10 ng/mL 119 (54) 33 (28) 86 (72)
10-20 ng/mL 59 (27) 20 (34) 39 (66)
>20 ng/mL 41 (19) 16 (39) 25 (61)
Preoperative D'Amico Risk Group
Low 38 (17) 6 (16) 32 (84)
Intermediate 83 (38) 23 (28) 60 (72)
High 98 (45) 40 (41) 58 (59)
Pathological Gleason Score
≤6 15 (7) 0 (0) 15 (100)
7 111 (51) 29 (26) 82 (74)
≥8 93 (42) 40 (43) 53 (57)
Pathological Stage
pT2N0M0 85 (39) 14 (17) 71 (84)
pT3/4N0M0 102 (47) 40 (39) 62 (61)
pTanyN+M0 32 (15) 15 (47) 17 (53)
Positive Surgical Margins 123 (56) 39 (32) 84 (68)
Extra-capsular Extension 95 (43) 43 (45) 52 (55)
Seminal Vesicle Invasion 81 (37) 36 (44) 45 (56)
Postoperative Treatment
Adjuvant Radiation1 24 (11) 9 (38) 15 (63)
Adjuvant Hormone1 74 (34) 32 (46) 42 (57)
Salvage Radiation2 68 (31) 34 (50) 34 (50)
Salvage Hormone2 86 (39) 62 (72) 24 (28)
Biochemical Recurrence
Event 110 (50) 69 (63) 41 (37)
Prostate Cancer-specific Mortality
Event 28 (13) 28 (100) 0 (0)
1Adjuvant therapy administrated within 90 days post-RP
2Salvage therapy administrated anytime after 90 days post-RP
J Urol. Author manuscript; available in PMC 2014 July 15.
NIH
-PA
Author M
anuscriptN
IH-P
A A
uthor Manuscript
NIH
-PA
Author M
anuscript
Karnes et al. Page 15
Tab
le 2
Mul
tivar
iabl
e C
ox p
ropo
rtio
nal h
azar
ds m
odel
ing
of G
C s
core
s af
ter
adju
stin
g fo
r cl
inic
opat
holo
gic
fact
ors
and
adju
vant
trea
tmen
ts.
Haz
ard
Rat
io (
95%
CI)
P
GC
11.
51 (
1.29
-1.7
6)<
0.0
01
Path
olog
ical
Gle
ason
Sco
re ≥
8*1.
59 (
0.77
-3.3
0)0.
21
Preo
pera
tive
Pros
tate
-spe
cifi
c A
ntig
en 2
1.28
(0.
85-1
.93)
0.24
Sem
inal
ves
icle
inva
sion
2.16
(0.
90-5
.16)
0.08
Posi
tive
Surg
ical
Mar
gins
1.26
(0.
58-2
.75)
0.56
Ext
ra-c
apsu
lar
Ext
ensi
on1.
35 (
0.60
-3.0
0)0.
47
Lym
ph N
ode
Invo
lvem
ent
0.73
(0.
20-2
.62)
0.63
Adj
uvan
t Rad
iatio
n0.
65 (
0.17
, 2.4
7)0.
52
Adj
uvan
t Hor
mon
e0.
80 (
0.31
, 2.0
3)0.
63
Abb
revi
atio
ns -
CI:
con
fide
nce
inte
rval
; GC
: gen
omic
cla
ssif
ier.
1 Haz
ard
ratio
rep
orte
d fo
r 10
% in
crea
se o
f G
C s
core
.
2 Haz
ard
ratio
rep
orte
d fo
r 10
% in
crea
se o
f lo
g-tr
ansf
orm
ed le
vel.
* Path
olog
ical
Gle
ason
Sco
re w
as d
icho
tom
ized
to c
ompa
re G
leas
on S
core
≥ 8
to G
leas
on S
core
< 8
J Urol. Author manuscript; available in PMC 2014 July 15.
NIH
-PA
Author M
anuscriptN
IH-P
A A
uthor Manuscript
NIH
-PA
Author M
anuscript
Karnes et al. Page 16
Tab
le 3
Surv
ival
ana
lysi
s of
GC
sco
re r
isk
grou
ps.
refe
renc
e =
GC
<0.4
refe
renc
e= p
rior
GC
gro
upC
linic
al M
etas
tasi
s-fr
ee P
roba
bilit
y
GC
ris
k ca
tego
ries
% o
f P
atie
nts
Haz
ard
Rat
io (
95%
CI)
PH
azar
d R
atio
(95
% C
I)P
3- y
ear
5- y
ear
8- y
ear
< 0
.460
%99
%98
%95
%
0.4-
0.6
21%
2.39
(1.
10-5
.17)
0.03
2.39
(1.
10-5
.17)
0.03
96%
94%
87%
> 0
.619
%7.
30 (
3.51
-15.
14)
< 0
.001
3.06
(1.
40-6
.72)
0.00
586
%78
%73
%
* M
odel
adj
uste
d fo
r ad
juva
nt tr
eatm
ents
J Urol. Author manuscript; available in PMC 2014 July 15.