population - gov.wales · population digest of welsh historical statistics 1974 - 1996 3 1.1 census...
TRANSCRIPT
1Digest of Welsh Historical Statistics 1974 - 1996
POPULATION
The 20th century has seen several markedchanges in Welsh population trends. At thebeginning of the century population wasrapidly increasing. The first decade inparticular saw a spectacular rise of 20 percent through a combination of resilientnatural increase (i.e. excess of births overdeaths) and large inward migration (mostlyfrom the agricultural counties of Southernand South West England into the SouthWales coalfield). Although from about 1914onwards the migration flow was reversed,the continuing natural increase wassufficient to sustain an overall rise inpopulation till 1925. Thereafter the flood ofoutward migration swamped a still strongnatural increase with the result that, not justthe rate of growth, but the actual, absolutepopulation of Wales was falling for most ofthe second quarter of the century. The trendwas again reversed from c 1950: the nexttwo decades saw a modest populationincrease mostly because the outwardmigration fell to levels which were lowerthan the continuing natural increase. (Digestof Welsh Historical Statistics, vol.1.)
The overall gently rising population trendhas continued in the recent decadescovered in the present volume. But therehas been a marked change in the relativeimportance of the components of thatgrowth: in the 1970s and 1980s inwardmigration contributed more than naturalincrease. (Table 1.3). The shift seems torepresent a significant change. Therelatively high rate of natural increase whichhad been a consistent feature of Welshpopulation change since this first becamemeasurable with reasonable reliability in1841 almost disappeared in the 1970s andwas still very low in the 1980s. On the otherhand migration which had been negative inevery decade between 1911 and 1971became positive in the two decadesbetween 1971 and 1991. Equally interestingwas the broad geographic pattern of theserecent trends within Wales. Broadlyspeaking the more rural areas (Dyfed,Gwynedd, Powys and West Clwyd), whichhad been losing population throughmigration for the previous century, nowbecame the main recipients of inwardmigration whilst at the same time exhibiting
natural decrease. In the industrial areasnatural change has been just positive whilemigration continues, though at a verymodest level (Table 1.3).
These broad demographic trends underpinmuch of what has governed the economic,social and cultural nature of late twentiethcentury Wales. It needs therefore to beasked: how well-founded are they?Essentially this means questioning thestatistical base on which they rest. In thisrespect it is possible to be pretty confidentabout the trends so far mentioned (Tables1.1 to 1.3). The information is drawn fromthe decennial censuses which, based onstatutory requirement and an experiencestretching back over nearly two centuries,had become pretty finely honed by the lastquarter of the twentieth century. None theless they are not totally problem-free: someaccommodation might not be identified orsome households in a building not beknown, whilst some of the information couldbe incorrectly given or incorrectlyprocessed. Normally these make for veryminor errors: for the 1981 census carefulchecks suggested that there was a netunder-estimate of the population present oncensus night of about a half per cent formost areas of England and Wales, but thisrose to about 2.5 per cent for inner London.This exceptionally high degree of accuracyhas become the norm for the UK census: itis thus necessary to notice that there was aslight shortfall from this standard for one ofthe years covered in this volume. The 1991census was estimated to have missed 2.2per cent of the resident population of GreatBritain: but for Wales the 1991 Report forWales (part 1) p.13 gives a smallerestimated under count of 1.6 per cent(47,000 in total). It is likely that theincreased under-coverage reflected theattempts, especially by the more mobileelements of the population, to evade payingthe unpopular local Poll Tax, a likelihood

2 Digest of Welsh Historical Statistics 1974 - 1996
increased by the fact that the estimatedunder-coverage rose in Inner London andother metropolitan areas and was given asabout 9 per cent for men in their twenties. InWales, with its lack of metropolitan areas,the discrepancy in the figure for youngmales was probably less. A further possiblesource of error for county figures onmigration would result from boundary shiftsbetween the counties: details of these aregiven in the census volumes for each countyand fortunately for Wales during these yearsthe small boundary adjustments involvedtiny numbers of people. The largest netchanges discovered related to a movementof 238 persons from Gwent to MidGlamorgan between 1974 and 1981 (theonly shift in those years), and although therewere several tiny moves between 1981 and1991, the largest of these removed 169persons from West Glamorgan to MidGlamorgan.
These comments apply to most of the tablesin this section which are drawn from thecensus results; they are also pertinent forthe tables (1.3, 1.5 and 1.6) based on theRegistrar General’s annual estimates sincethese use the most recent census as a baseand use registered births and deaths andestimated migration to estimate the annualpopulation until the next census benchmarkis available. Because of problems ofavailability and consistency, the figures onWelsh language (Table 1.8) are confined tonumbers speaking Welsh and do notinclude the ability to read and write inWelsh. This table has also involved agreater degree of recalculation both totranslate the 1971 census results on to thebasis of the new
counties, and to limit the age categories tomanageable proportions. The table providessome support for both those who arepessimistic and those who are optimisticabout the future health of the language: theformer will note the ominous fact that ineach county the highest proportion of Welshspeakers is found amongst the elderly; thelatter that in each county the proportion ofthe youngest group able to speak Welshhas risen over these three censuses. Thoseaged 16 to 44 in 1991 represented the lostgeneration of Welsh speakers. Throughoutthe table only Welsh speakers in Wales areincluded: no similar language question wasincluded in the census forms distributed inEngland.
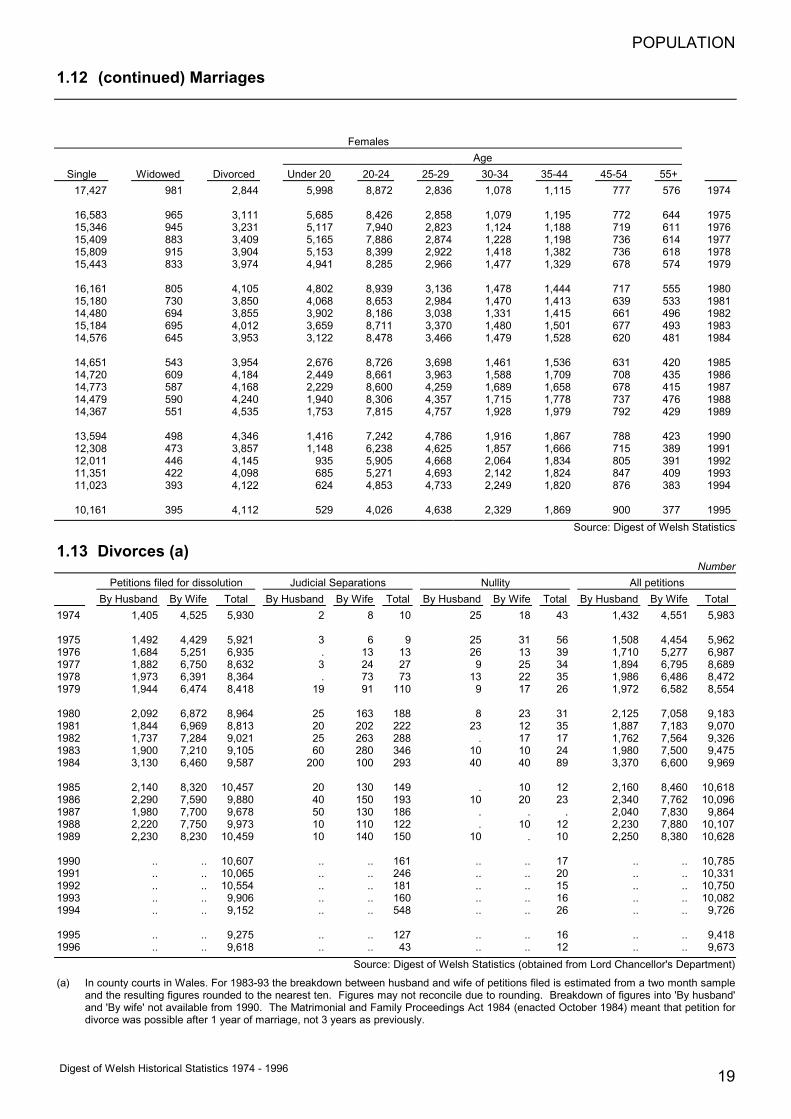
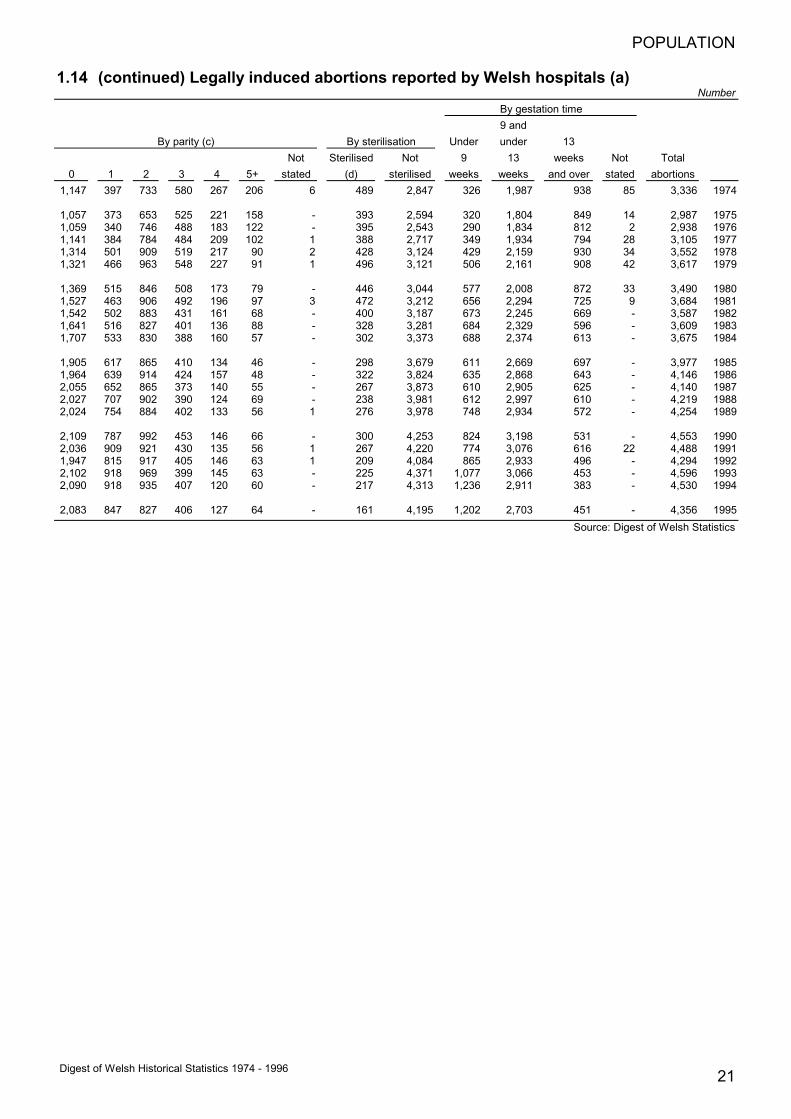
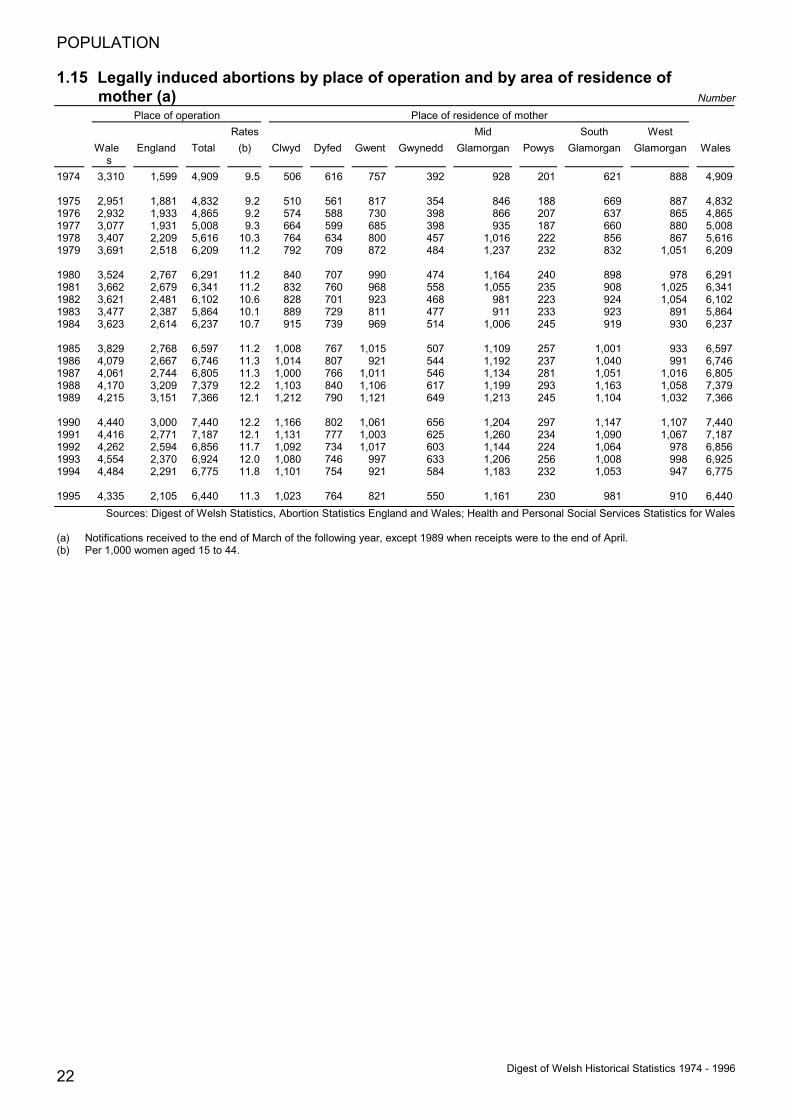
The information on births, marriages anddeaths are specific and reliable because ofthe compulsory requirement to registerthese events (Tables 1.9 to 1.12). Causesof death (Table 1.11) are necessarily moresubjective, and from 1993 changes weremade to the rules for coding of deathsincluding those to bring England and Walesmore into line with international practice.Table 1.13 on divorce petitions in Welshcounty courts is derived from the LordChancellor’s department and can beaccepted as reasonably accurate within theconstraints imposed by (for the years 1983-93) being drawn from a sample of just twomonths in each year. The abortion statistics(Tables 1.14 and 1.15) may be taken as areliable indicator of the abortions legallyperformed in hospitals, which during theseyears would cover the vast majority, but notall, abortions.

POPULATION
3Digest of Welsh Historical Statistics 1974 - 1996
1.1 Census population bases (a)
1971 1981 19911 Present residents enumerated but not identifiable 2,718,086 2,719,2232 Visitors enumerated but not identifiable enumerated but not
identifiable92,642
3 Absent residents (part of household present) not enumerated enumerated but notidentifiable
47,614
4 Absent residents (wholly absent household -enumerated) not enumerated not enumerated 35,733
5 Absent residents (wholly absent household -imputed) not enumerated not enumerated 32,503
Persons present: 1971 base (1+2) 2,731,204 2,790,500 2,811,865Residents: 1981 base (1+3) .. 2,749,640 2,766,837Residents: 1991 base (1+3+4+5) .. .. 2,835,073
(a) The table presents comparable data from the three censuses, though each has a different ‘base’ - see figures in bold.
POPULATION
4 Digest of Welsh Historical Statistics 1974 - 1996
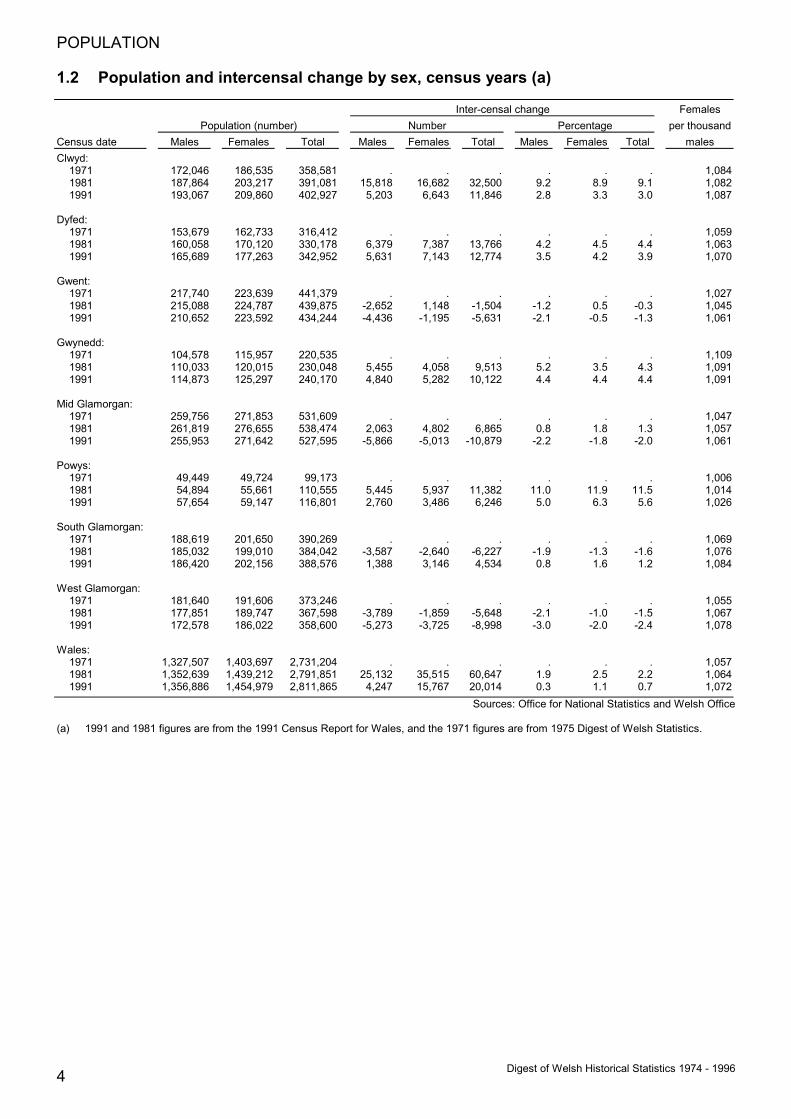
1.2 Population and intercensal change by sex, census years (a)
Inter-censal change FemalesPopulation (number) Number Percentage per thousand
Census date Males Females Total Males Females Total Males Females Total malesClwyd:
1971 172,046 186,535 358,581 . . . . . . 1,0841981 187,864 203,217 391,081 15,818 16,682 32,500 9.2 8.9 9.1 1,0821991 193,067 209,860 402,927 5,203 6,643 11,846 2.8 3.3 3.0 1,087
Dyfed:1971 153,679 162,733 316,412 . . . . . . 1,0591981 160,058 170,120 330,178 6,379 7,387 13,766 4.2 4.5 4.4 1,0631991 165,689 177,263 342,952 5,631 7,143 12,774 3.5 4.2 3.9 1,070
Gwent:1971 217,740 223,639 441,379 . . . . . . 1,0271981 215,088 224,787 439,875 -2,652 1,148 -1,504 -1.2 0.5 -0.3 1,0451991 210,652 223,592 434,244 -4,436 -1,195 -5,631 -2.1 -0.5 -1.3 1,061
Gwynedd:1971 104,578 115,957 220,535 . . . . . . 1,1091981 110,033 120,015 230,048 5,455 4,058 9,513 5.2 3.5 4.3 1,0911991 114,873 125,297 240,170 4,840 5,282 10,122 4.4 4.4 4.4 1,091
Mid Glamorgan:1971 259,756 271,853 531,609 . . . . . . 1,0471981 261,819 276,655 538,474 2,063 4,802 6,865 0.8 1.8 1.3 1,0571991 255,953 271,642 527,595 -5,866 -5,013 -10,879 -2.2 -1.8 -2.0 1,061
Powys:1971 49,449 49,724 99,173 . . . . . . 1,0061981 54,894 55,661 110,555 5,445 5,937 11,382 11.0 11.9 11.5 1,0141991 57,654 59,147 116,801 2,760 3,486 6,246 5.0 6.3 5.6 1,026
South Glamorgan:1971 188,619 201,650 390,269 . . . . . . 1,0691981 185,032 199,010 384,042 -3,587 -2,640 -6,227 -1.9 -1.3 -1.6 1,0761991 186,420 202,156 388,576 1,388 3,146 4,534 0.8 1.6 1.2 1,084
West Glamorgan:1971 181,640 191,606 373,246 . . . . . . 1,0551981 177,851 189,747 367,598 -3,789 -1,859 -5,648 -2.1 -1.0 -1.5 1,0671991 172,578 186,022 358,600 -5,273 -3,725 -8,998 -3.0 -2.0 -2.4 1,078
Wales:1971 1,327,507 1,403,697 2,731,204 . . . . . . 1,0571981 1,352,639 1,439,212 2,791,851 25,132 35,515 60,647 1.9 2.5 2.2 1,0641991 1,356,886 1,454,979 2,811,865 4,247 15,767 20,014 0.3 1.1 0.7 1,072
Sources: Office for National Statistics and Welsh Office
(a) 1991 and 1981 figures are from the 1991 Census Report for Wales, and the 1971 figures are from 1975 Digest of Welsh Statistics.

POPULATION
5Digest of Welsh Historical Statistics 1974 - 1996
1.3 Components of population change (a)Thousands
1961-1971 1971-1981 1981-1991Total Natural Migration Total Natural Migration Total Natural Migration
change change and other (b) change change and other (b) change change and other (b)Clwyd 38.7 12.6 26.1 31.7 -1.0 32.7 19.9 -0.1 20.0Dyfed -0.8 2.3 -3.1 17.4 -6.4 23.8 16.4 -3.5 19.9Gwent 18.4 25.0 -6.6 -0.4 4.3 -4.7 6.8 8.4 -1.5Gwynedd 7.1 0.8 6.3 11.3 -4.0 15.3 8.1 -3.0 11.1Mid Glamorgan 12.9 22.4 -9.5 9.1 6.8 2.3 1.0 11.4 -10.4Powys -2.6 1.3 -3.9 11.6 -1.8 13.4 7.9 -1.3 9.3South Glamorgan 8.2 23.2 -15.0 -5.0 5.6 -10.6 18.8 12.2 6.6West Glamorgan 6.4 10.6 -4.2 -2.6 -1.4 -1.2 -1.0 0.9 -1.9
Wales 88.3 98.2 -9.9 73.2 2.1 71.1 78.0 25.0 53.0Source: Office for National Statistics and Welsh Office
(a) The 1961-1971 figures are from the 1983 Digest of Welsh Statistics; the 1971-1981 and 1981-1991 figures are from the 1994 Digest ofWelsh Statistics. The figures are based on the Registrar General's Mid-Year Estimates.
(b) The 'other' changes include changes in the armed forces stationed in the area as well as reconciliation adjustments.
POPULATION
6 Digest of Welsh Historical Statistics 1974 - 1996
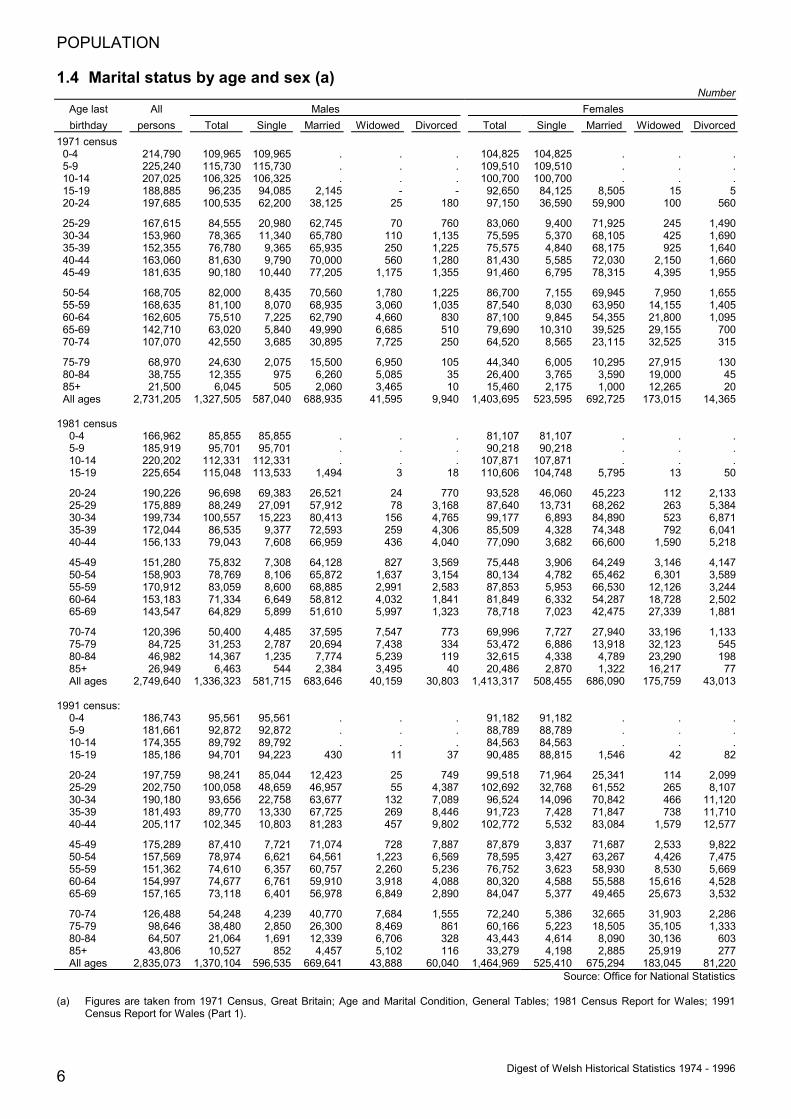
1.4 Marital status by age and sex (a)Number
Age last All Males Femalesbirthday persons Total Single Married Widowed Divorced Total Single Married Widowed Divorced
1971 census0-4 214,790 109,965 109,965 . . . 104,825 104,825 . . .5-9 225,240 115,730 115,730 . . . 109,510 109,510 . . .10-14 207,025 106,325 106,325 . . . 100,700 100,700 . . .15-19 188,885 96,235 94,085 2,145 - - 92,650 84,125 8,505 15 520-24 197,685 100,535 62,200 38,125 25 180 97,150 36,590 59,900 100 560
25-29 167,615 84,555 20,980 62,745 70 760 83,060 9,400 71,925 245 1,49030-34 153,960 78,365 11,340 65,780 110 1,135 75,595 5,370 68,105 425 1,69035-39 152,355 76,780 9,365 65,935 250 1,225 75,575 4,840 68,175 925 1,64040-44 163,060 81,630 9,790 70,000 560 1,280 81,430 5,585 72,030 2,150 1,66045-49 181,635 90,180 10,440 77,205 1,175 1,355 91,460 6,795 78,315 4,395 1,955
50-54 168,705 82,000 8,435 70,560 1,780 1,225 86,700 7,155 69,945 7,950 1,65555-59 168,635 81,100 8,070 68,935 3,060 1,035 87,540 8,030 63,950 14,155 1,40560-64 162,605 75,510 7,225 62,790 4,660 830 87,100 9,845 54,355 21,800 1,09565-69 142,710 63,020 5,840 49,990 6,685 510 79,690 10,310 39,525 29,155 70070-74 107,070 42,550 3,685 30,895 7,725 250 64,520 8,565 23,115 32,525 315
75-79 68,970 24,630 2,075 15,500 6,950 105 44,340 6,005 10,295 27,915 13080-84 38,755 12,355 975 6,260 5,085 35 26,400 3,765 3,590 19,000 4585+ 21,500 6,045 505 2,060 3,465 10 15,460 2,175 1,000 12,265 20All ages 2,731,205 1,327,505 587,040 688,935 41,595 9,940 1,403,695 523,595 692,725 173,015 14,365
1981 census0-4 166,962 85,855 85,855 . . . 81,107 81,107 . . .5-9 185,919 95,701 95,701 . . . 90,218 90,218 . . .10-14 220,202 112,331 112,331 . . . 107,871 107,871 . . .15-19 225,654 115,048 113,533 1,494 3 18 110,606 104,748 5,795 13 50
20-24 190,226 96,698 69,383 26,521 24 770 93,528 46,060 45,223 112 2,13325-29 175,889 88,249 27,091 57,912 78 3,168 87,640 13,731 68,262 263 5,38430-34 199,734 100,557 15,223 80,413 156 4,765 99,177 6,893 84,890 523 6,87135-39 172,044 86,535 9,377 72,593 259 4,306 85,509 4,328 74,348 792 6,04140-44 156,133 79,043 7,608 66,959 436 4,040 77,090 3,682 66,600 1,590 5,218
45-49 151,280 75,832 7,308 64,128 827 3,569 75,448 3,906 64,249 3,146 4,14750-54 158,903 78,769 8,106 65,872 1,637 3,154 80,134 4,782 65,462 6,301 3,58955-59 170,912 83,059 8,600 68,885 2,991 2,583 87,853 5,953 66,530 12,126 3,24460-64 153,183 71,334 6,649 58,812 4,032 1,841 81,849 6,332 54,287 18,728 2,50265-69 143,547 64,829 5,899 51,610 5,997 1,323 78,718 7,023 42,475 27,339 1,881
70-74 120,396 50,400 4,485 37,595 7,547 773 69,996 7,727 27,940 33,196 1,13375-79 84,725 31,253 2,787 20,694 7,438 334 53,472 6,886 13,918 32,123 54580-84 46,982 14,367 1,235 7,774 5,239 119 32,615 4,338 4,789 23,290 19885+ 26,949 6,463 544 2,384 3,495 40 20,486 2,870 1,322 16,217 77All ages 2,749,640 1,336,323 581,715 683,646 40,159 30,803 1,413,317 508,455 686,090 175,759 43,013
1991 census:0-4 186,743 95,561 95,561 . . . 91,182 91,182 . . .5-9 181,661 92,872 92,872 . . . 88,789 88,789 . . .10-14 174,355 89,792 89,792 . . . 84,563 84,563 . . .15-19 185,186 94,701 94,223 430 11 37 90,485 88,815 1,546 42 82
20-24 197,759 98,241 85,044 12,423 25 749 99,518 71,964 25,341 114 2,09925-29 202,750 100,058 48,659 46,957 55 4,387 102,692 32,768 61,552 265 8,10730-34 190,180 93,656 22,758 63,677 132 7,089 96,524 14,096 70,842 466 11,12035-39 181,493 89,770 13,330 67,725 269 8,446 91,723 7,428 71,847 738 11,71040-44 205,117 102,345 10,803 81,283 457 9,802 102,772 5,532 83,084 1,579 12,577
45-49 175,289 87,410 7,721 71,074 728 7,887 87,879 3,837 71,687 2,533 9,82250-54 157,569 78,974 6,621 64,561 1,223 6,569 78,595 3,427 63,267 4,426 7,47555-59 151,362 74,610 6,357 60,757 2,260 5,236 76,752 3,623 58,930 8,530 5,66960-64 154,997 74,677 6,761 59,910 3,918 4,088 80,320 4,588 55,588 15,616 4,52865-69 157,165 73,118 6,401 56,978 6,849 2,890 84,047 5,377 49,465 25,673 3,532
70-74 126,488 54,248 4,239 40,770 7,684 1,555 72,240 5,386 32,665 31,903 2,28675-79 98,646 38,480 2,850 26,300 8,469 861 60,166 5,223 18,505 35,105 1,33380-84 64,507 21,064 1,691 12,339 6,706 328 43,443 4,614 8,090 30,136 60385+ 43,806 10,527 852 4,457 5,102 116 33,279 4,198 2,885 25,919 277All ages 2,835,073 1,370,104 596,535 669,641 43,888 60,040 1,464,969 525,410 675,294 183,045 81,220
Source: Office for National Statistics
(a) Figures are taken from 1971 Census, Great Britain; Age and Marital Condition, General Tables; 1981 Census Report for Wales; 1991Census Report for Wales (Part 1).

POPULATION
7Digest of Welsh Historical Statistics 1974 - 1996
1.5 Population by County and District, quinquennially (a)Thousands
1974 1979 1984 1989 1994Clwyd: 378.6 390.8 395.8 409.8 417.4
Alyn and Deeside 69.5 72.9 73.1 73.9 75.3Colwyn 46.8 48.5 49.9 55.1 57.4Delyn 62.2 65.3 65.5 66.8 70.0Glyndðr 40.3 40.2 40.1 41.9 42.3Rhuddlan 50.5 52.0 53.1 55.9 55.0Wrexham Maelor 109.3 111.9 114.2 116.1 117.4
Dyfed: 324.4 332.2 333.5 348.0 352.9Carmarthen 50.2 51.5 52.8 55.6 56.8Ceredigion 57.8 59.9 61.1 67.1 69.7Dinefwr 36.9 37.4 37.1 38.7 38.9Llanelli 77.5 76.4 74.4 74.4 73.4Preseli Pembrokeshire 64.4 68.5 70.2 70.3 71.7South Pembrokeshire 37.6 38.5 38.0 41.8 42.5
Gwent: 443.9 441.4 439.2 446.2 452.2Blaenau Gwent 84.9 81.4 78.4 76.9 77.3Islwyn 66.6 65.3 65.5 66.1 66.8Monmouth 67.7 70.7 73.7 76.7 80.2Newport 134.9 133.5 131.3 135.2 137.4Torfaen 89.8 90.5 90.4 91.3 90.6
Gwynedd: 226.7 230.6 232.2 239.2 240.3Aberconwy 51.3 51.3 51.7 53.5 54.9Arfon 53.8 54.9 54.2 55.4 57.3Dwyfor 26.4 25.8 26.2 27.6 27.2Meirionnydd 31.5 31.6 31.8 32.8 32.4Ynys Môn 63.7 67.0 68.4 69.9 68.4
Mid Glamorgan: 542.6 542.0 533.8 538.3 544.5Cynon Valley 70.1 68.5 66.3 65.5 65.2Merthyr Tydfil 61.6 61.1 59.1 58.9 59.5Ogwr 128.8 129.8 130.3 134.4 135.3Rhondda 88.0 83.7 80.5 78.8 77.6Rhymney Valley 104.4 105.9 103.9 104.3 104.3Taff-Ely 89.7 93.0 93.7 96.4 102.7
Powys: 103.0 109.4 110.6 116.3 120.2Brecknock 38.2 40.4 40.7 40.9 41.3Montgomeryshire 45.0 47.8 48.4 52.1 54.7Radnorshire 19.8 21.2 21.6 23.3 24.2
South Glamorgan: 391.7 390.6 394.0 402.9 414.6Cardiff 287.5 282.4 282.5 288.1 300.0Vale of Glamorgan 104.2 108.2 111.5 114.7 114.6
West Glamorgan: 374.3 373.1 366.6 368.8 371.0Port Talbot (Afan) 58.2 55.9 52.8 51.3 51.4Lliw Valley 57.7 59.5 60.1 62.7 64.6Neath 67.0 66.8 65.5 66.2 66.2Swansea 191.4 190.9 188.2 188.6 188.8
Wales 2,785.2 2,810.1 2,805.8 2,869.4 2,913.0Source: Office for National Statistics and Welsh Office
(a) Registrar General's mid-year estimates of resident population: i.e. all those usually resident in the area whatever their nationality.Members of HM. and non-UK armed forces are taken to be resident at stationed address and students at their term-time address. 1984and 1989 figures are taken from the Digest of Welsh Statistics; 1974 and 1979 are taken from Local Authority Vital Statistics, England andWales.

POPULATION
8 Digest of Welsh Historical Statistics 1974 - 1996
1.6 Estimated mid-year population by county and sex (a)
Clwyd Dyfed Gwent Gwynedd Mid GlamorganTotal Male Female Total Male Female Total Male Female Total Male Female Total Male Female
1974 378.6 182.3 196.3 324.4 157.0 167.4 443.9 217.6 226.3 226.7 108.4 118.3 542.6 263.5 279.1
1975 382.3 184.3 198.0 327.9 159.4 168.5 444.3 218.0 226.3 228.5 109.5 119.0 543.6 264.3 279.31976 383.6 185.1 198.5 328.8 160.0 168.8 443.5 217.4 226.1 229.6 110.2 119.4 542.6 263.9 278.71977 384.9 185.6 199.3 329.5 160.4 169.1 442.7 216.8 225.9 230.3 110.6 119.7 542.5 263.9 278.61978 387.8 186.8 201.0 331.0 161.0 170.0 441.8 216.2 225.6 230.1 110.4 119.7 542.1 263.7 278.41979 390.8 188.2 202.6 332.2 161.5 170.7 441.4 215.9 225.5 230.6 110.7 119.9 542.0 263.5 278.5
1980 392.8 189.1 203.7 333.8 162.1 171.7 441.9 216.2 225.7 231.2 111.0 120.2 542.4 263.7 278.71981 393.6 189.2 204.4 333.6 161.7 171.9 441.7 216.0 225.7 231.2 110.9 120.3 540.8 262.8 278.01982 394.1 189.4 204.7 332.9 161.3 171.6 440.0 214.7 225.3 231.5 111.0 120.5 538.7 261.7 277.11983 395.0 189.9 205.0 334.3 162.0 172.3 439.7 214.5 225.2 231.7 111.3 120.4 536.3 260.6 275.71984 395.8 190.4 205.4 333.5 161.7 171.8 439.2 214.3 224.9 232.2 111.7 120.6 533.8 259.6 274.2
1985 397.4 191.3 206.1 333.9 161.9 172.0 439.8 214.7 225.1 233.1 112.1 121.0 533.7 259.7 274.01986 399.0 192.3 206.7 336.4 163.4 173.0 441.4 215.7 225.7 233.9 112.6 121.3 534.5 260.4 274.11987 401.8 193.8 208.0 339.9 165.2 174.7 442.5 216.2 226.2 235.2 113.3 121.9 534.6 260.7 274.01988 405.8 195.7 210.1 344.5 167.3 177.1 444.7 217.3 227.4 237.7 114.5 123.2 536.0 261.4 274.61989 409.8 197.7 212.1 348.0 169.0 179.0 446.2 218.1 228.1 239.2 115.1 124.1 538.3 262.7 275.7
1990 410.3 198.0 212.3 348.8 169.3 179.5 447.0 218.5 228.5 239.3 115.0 124.3 540.2 263.8 276.41991 413.5 199.5 214.0 350.0 170.2 179.9 448.5 219.5 229.0 239.3 115.3 124.0 541.8 264.7 277.21992 414.6 200.0 214.6 351.2 170.7 180.4 449.4 220.0 229.3 239.7 115.7 124.1 542.8 265.2 277.61993 415.9 200.9 215.0 351.5 170.8 180.7 450.3 220.7 229.6 240.2 116.1 124.0 544.3 266.2 278.11994 417.4 201.7 215.6 352.9 172.0 180.9 452.2 221.6 230.6 240.3 116.3 124.0 544.5 266.3 278.2
1995 418.3 202.5 215.7 353.3 172.3 180.9 452.6 222.0 230.5 240.4 116.6 123.8 544.0 266.3 277.7
(a) Figures taken from Digest of Welsh Statistics and Registrar General’s annual reports, taking into account revisions to historic estimates inthe light of later census information.
POPULATION
9Digest of Welsh Historical Statistics 1974 - 1996
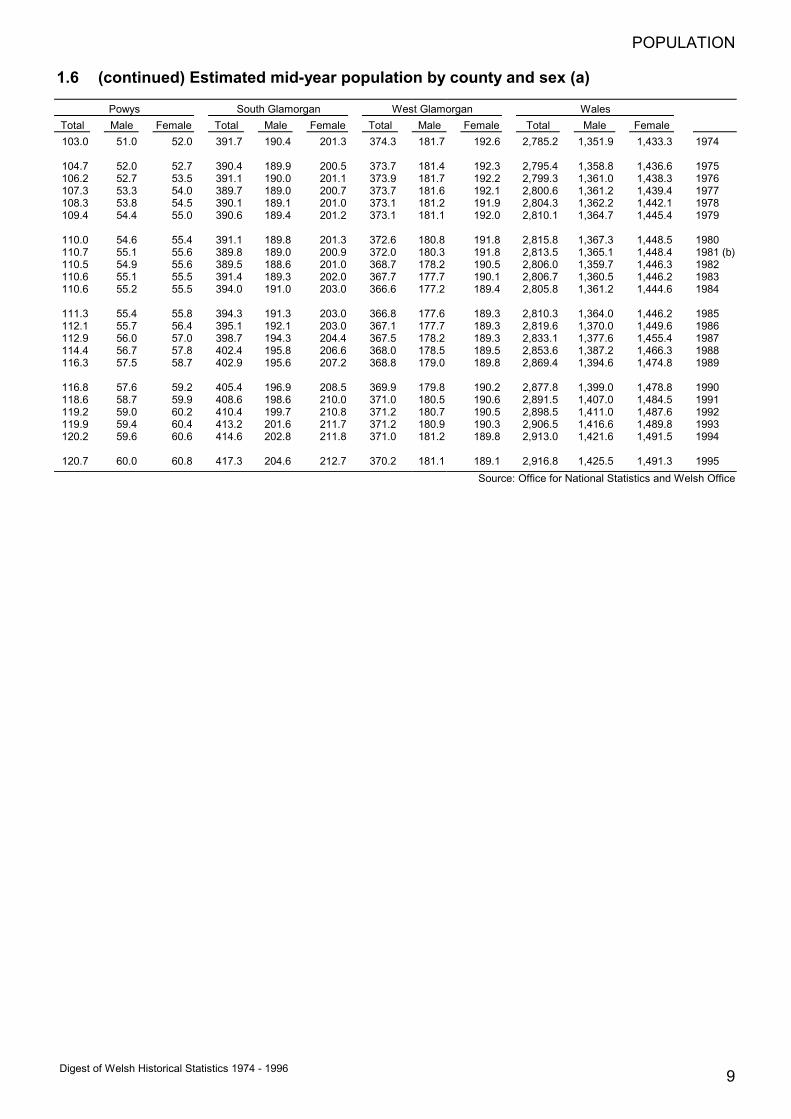
1.6 (continued) Estimated mid-year population by county and sex (a)
Powys South Glamorgan West Glamorgan WalesTotal Male Female Total Male Female Total Male Female Total Male Female103.0 51.0 52.0 391.7 190.4 201.3 374.3 181.7 192.6 2,785.2 1,351.9 1,433.3 1974
104.7 52.0 52.7 390.4 189.9 200.5 373.7 181.4 192.3 2,795.4 1,358.8 1,436.6 1975106.2 52.7 53.5 391.1 190.0 201.1 373.9 181.7 192.2 2,799.3 1,361.0 1,438.3 1976107.3 53.3 54.0 389.7 189.0 200.7 373.7 181.6 192.1 2,800.6 1,361.2 1,439.4 1977108.3 53.8 54.5 390.1 189.1 201.0 373.1 181.2 191.9 2,804.3 1,362.2 1,442.1 1978109.4 54.4 55.0 390.6 189.4 201.2 373.1 181.1 192.0 2,810.1 1,364.7 1,445.4 1979
110.0 54.6 55.4 391.1 189.8 201.3 372.6 180.8 191.8 2,815.8 1,367.3 1,448.5 1980110.7 55.1 55.6 389.8 189.0 200.9 372.0 180.3 191.8 2,813.5 1,365.1 1,448.4 1981 (b)110.5 54.9 55.6 389.5 188.6 201.0 368.7 178.2 190.5 2,806.0 1,359.7 1,446.3 1982110.6 55.1 55.5 391.4 189.3 202.0 367.7 177.7 190.1 2,806.7 1,360.5 1,446.2 1983110.6 55.2 55.5 394.0 191.0 203.0 366.6 177.2 189.4 2,805.8 1,361.2 1,444.6 1984
111.3 55.4 55.8 394.3 191.3 203.0 366.8 177.6 189.3 2,810.3 1,364.0 1,446.2 1985112.1 55.7 56.4 395.1 192.1 203.0 367.1 177.7 189.3 2,819.6 1,370.0 1,449.6 1986112.9 56.0 57.0 398.7 194.3 204.4 367.5 178.2 189.3 2,833.1 1,377.6 1,455.4 1987114.4 56.7 57.8 402.4 195.8 206.6 368.0 178.5 189.5 2,853.6 1,387.2 1,466.3 1988116.3 57.5 58.7 402.9 195.6 207.2 368.8 179.0 189.8 2,869.4 1,394.6 1,474.8 1989
116.8 57.6 59.2 405.4 196.9 208.5 369.9 179.8 190.2 2,877.8 1,399.0 1,478.8 1990118.6 58.7 59.9 408.6 198.6 210.0 371.0 180.5 190.6 2,891.5 1,407.0 1,484.5 1991119.2 59.0 60.2 410.4 199.7 210.8 371.2 180.7 190.5 2,898.5 1,411.0 1,487.6 1992119.9 59.4 60.4 413.2 201.6 211.7 371.2 180.9 190.3 2,906.5 1,416.6 1,489.8 1993120.2 59.6 60.6 414.6 202.8 211.8 371.0 181.2 189.8 2,913.0 1,421.6 1,491.5 1994
120.7 60.0 60.8 417.3 204.6 212.7 370.2 181.1 189.1 2,916.8 1,425.5 1,491.3 1995Source: Office for National Statistics and Welsh Office
POPULATION
10 Digest of Welsh Historical Statistics 1974 - 1996
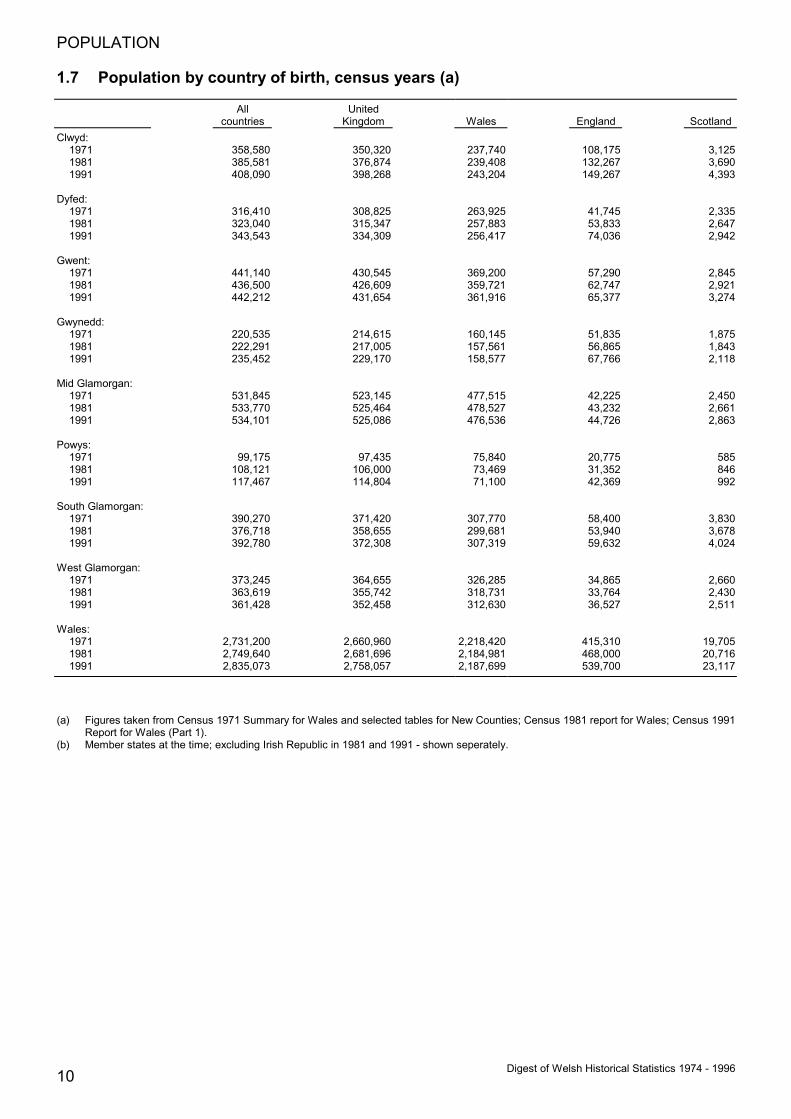
1.7 Population by country of birth, census years (a)
All Unitedcountries Kingdom Wales England Scotland
Clwyd:1971 358,580 350,320 237,740 108,175 3,1251981 385,581 376,874 239,408 132,267 3,6901991 408,090 398,268 243,204 149,267 4,393
Dyfed:1971 316,410 308,825 263,925 41,745 2,3351981 323,040 315,347 257,883 53,833 2,6471991 343,543 334,309 256,417 74,036 2,942
Gwent:1971 441,140 430,545 369,200 57,290 2,8451981 436,500 426,609 359,721 62,747 2,9211991 442,212 431,654 361,916 65,377 3,274
Gwynedd:1971 220,535 214,615 160,145 51,835 1,8751981 222,291 217,005 157,561 56,865 1,8431991 235,452 229,170 158,577 67,766 2,118
Mid Glamorgan:1971 531,845 523,145 477,515 42,225 2,4501981 533,770 525,464 478,527 43,232 2,6611991 534,101 525,086 476,536 44,726 2,863
Powys:1971 99,175 97,435 75,840 20,775 5851981 108,121 106,000 73,469 31,352 8461991 117,467 114,804 71,100 42,369 992
South Glamorgan:1971 390,270 371,420 307,770 58,400 3,8301981 376,718 358,655 299,681 53,940 3,6781991 392,780 372,308 307,319 59,632 4,024
West Glamorgan:1971 373,245 364,655 326,285 34,865 2,6601981 363,619 355,742 318,731 33,764 2,4301991 361,428 352,458 312,630 36,527 2,511
Wales:1971 2,731,200 2,660,960 2,218,420 415,310 19,7051981 2,749,640 2,681,696 2,184,981 468,000 20,7161991 2,835,073 2,758,057 2,187,699 539,700 23,117
(a) Figures taken from Census 1971 Summary for Wales and selected tables for New Counties; Census 1981 report for Wales; Census 1991Report for Wales (Part 1).
(b) Member states at the time; excluding Irish Republic in 1981 and 1991 - shown seperately.
POPULATION
11Digest of Welsh Historical Statistics 1974 - 1996
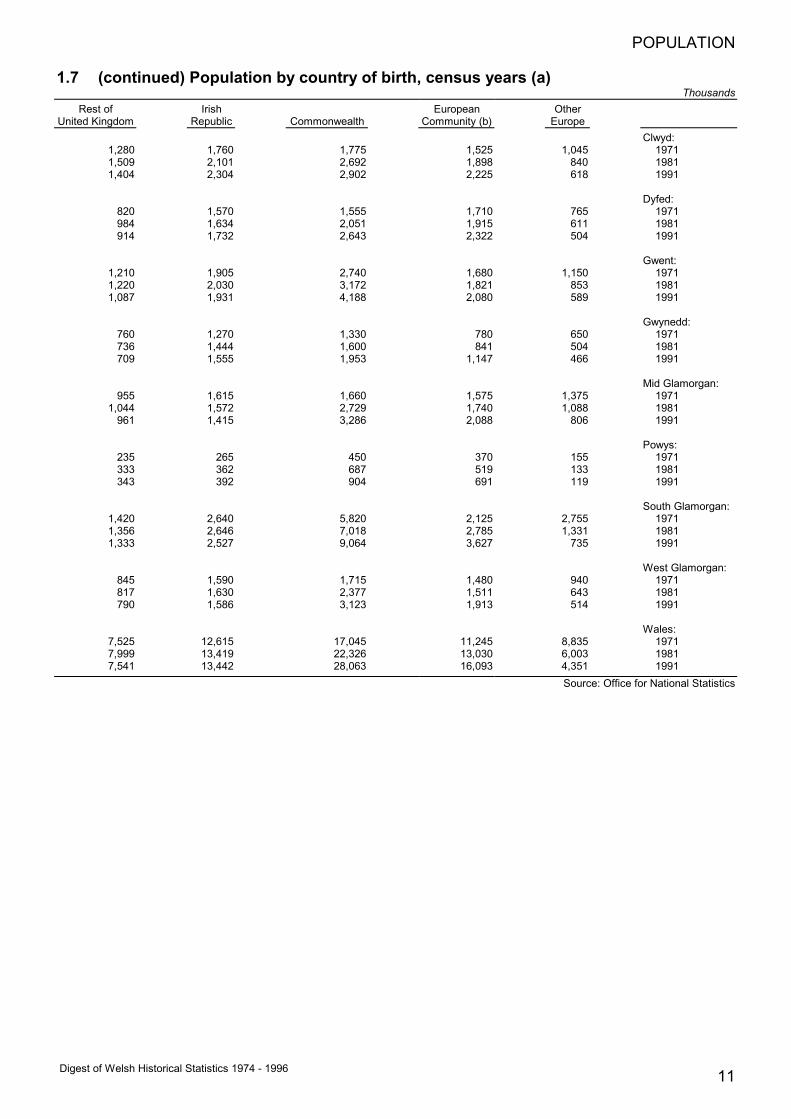
1.7 (continued) Population by country of birth, census years (a)Thousands
Rest of Irish European OtherUnited Kingdom Republic Commonwealth Community (b) Europe
Clwyd:1,280 1,760 1,775 1,525 1,045 19711,509 2,101 2,692 1,898 840 19811,404 2,304 2,902 2,225 618 1991
Dyfed:820 1,570 1,555 1,710 765 1971984 1,634 2,051 1,915 611 1981914 1,732 2,643 2,322 504 1991
Gwent:1,210 1,905 2,740 1,680 1,150 19711,220 2,030 3,172 1,821 853 19811,087 1,931 4,188 2,080 589 1991
Gwynedd:760 1,270 1,330 780 650 1971736 1,444 1,600 841 504 1981709 1,555 1,953 1,147 466 1991
Mid Glamorgan:955 1,615 1,660 1,575 1,375 1971
1,044 1,572 2,729 1,740 1,088 1981961 1,415 3,286 2,088 806 1991
Powys:235 265 450 370 155 1971333 362 687 519 133 1981343 392 904 691 119 1991
South Glamorgan:1,420 2,640 5,820 2,125 2,755 19711,356 2,646 7,018 2,785 1,331 19811,333 2,527 9,064 3,627 735 1991
West Glamorgan:845 1,590 1,715 1,480 940 1971817 1,630 2,377 1,511 643 1981790 1,586 3,123 1,913 514 1991
Wales:7,525 12,615 17,045 11,245 8,835 19717,999 13,419 22,326 13,030 6,003 19817,541 13,442 28,063 16,093 4,351 1991
Source: Office for National Statistics

POPULATION
12 Digest of Welsh Historical Statistics 1974 - 1996
1.8 Number and proportion speaking Welsh by age and county, census years
Aged 3 and over Aged 3 to 15Percentage Speaking Welsh Speaking Welsh
Total Born born in Per Perpersons in Wales Wales Total Number cent Total Number cent
Clwyd:1971 (a) 343,120 237,740 69.3 340,200 72,800 21.4 68,220 10,535 15.41981 385,581 239,408 62.1 371,232 69,578 18.7 74,177 13,822 18.61991 408,090 243,204 59.6 392,812 71,405 18.2 65,749 18,335 27.9
Dyfed:1971 (a) 303,275 263,925 87.0 303,000 159,100 52.5 55,825 23,255 41.71981 323,040 257,883 79.8 311,351 146,213 47.0 57,477 23,177 40.31991 343,543 256,417 74.6 331,528 144,998 43.7 54,769 26,086 47.6
Gwent:1971 (a) 439,155 369,200 84.1 421,100 8,000 1.9 93,125 825 0.91981 436,500 359,721 82.4 419,970 10,550 2.5 83,517 1,880 2.31991 442,212 361,916 81.8 423,794 10,339 2.4 73,460 3,558 4.8
Gwynedd:1971 (a) 218,155 160,145 73.4 210,700 136,300 64.7 38,740 24,985 67.11981 222,291 157,561 70.9 214,230 135,067 63.0 41,537 28,791 69.31991 235,452 158,577 67.4 226,862 138,413 61.0 36,546 28,256 77.3
Mid Glamorgan:1971 (a) 540,150 477,515 88.4 501,900 52,700 10.5 98,260 5,345 5.41981 533,770 478,527 89.7 511,943 42,691 8.3 103,561 8,926 8.61991 534,101 476,536 89.2 511,656 43,263 8.5 91,726 14786 16.1
Powys:1971 (a) 114,775 75,840 66.1 95,400 22,600 23.7 21,765 3,190 14.71981 108,121 73,469 68.0 104,302 21,358 20.5 19,667 3,288 16.71991 117,467 71,100 60.5 113,335 22,871 20.2 18,416 5,517 30.0
South Glamorgan:1971 (a) 383,945 307,770 80.2 374,000 18,700 5.0 79,330 3,560 4.51981 376,718 299,681 79.6 362,090 20,684 5.7 69,301 5,114 7.41991 392,780 307,319 78.2 375,857 24,541 6.5 66,102 7,888 11.9
West Glamorgan:1971 (a) 334,635 326,285 97.5 356,700 72,400 20.3 64,640 4,985 7.71981 363,619 318,731 87.7 349,996 57,408 16.4 65,205 6,039 9.31991 361,428 312,630 86.5 347,779 52,268 15.0 58,878 8,810 15.0
Wales:1971 (a) 2,731,205 2,218,425 81.2 2,607,700 542,400 20.8 519,903 77,535 14.91981 2,749,640 2,184,981 79.5 2,645,114 503,549 19.0 514,442 91,037 17.71991 2,835,073 2,187,699 77.2 2,723,623 508,098 18.7 465,646 113,236 24.3
(a) Data on Welsh speakers in 1971 by age for the eight counties have been derived by adjusting the data for the 1971 administrative areas,using the reworked figures published in the 1991 Census Report on the Welsh Language.

POPULATION
13Digest of Welsh Historical Statistics 1974 - 1996
1.8 (continued) Number and proportion speaking Welsh by age and county,census years
Aged 16 to 44 Aged 45 to 64 Aged 65 and overSpeaking Welsh Speaking Welsh Speaking Welsh
Per Per PerTotal Number cent Total Number cent Total Number cent
Clwyd:131,175 24,300 18.5 87,390 22,680 26.6 56,335 16,465 29.2 1971 (a)
148,942 21,932 14.7 83,668 17,460 20.9 64,445 16,364 25.4 1981 162,252 22,944 14.1 91,756 14,939 16.3 73,055 15,187 20.8 1991
Dyfed:115,600 55,615 48.1 84,265 50,115 59.5 47,595 30,110 62.3 1971 (a)
121,596 49,805 41.0 78,460 40,928 52.2 53,818 32,303 60.0 1981 129,198 49,335 38.2 82,461 35,757 43.4 65,100 33,820 52.0 1991
Gwent:177,470 3,255 1.8 112,045 2,975 2.7 56,520 2,206 3.9 1971 (a)
173,511 3,707 2.1 102,080 2,918 2.9 60,862 2,045 3.4 1981 178,451 3,466 1.9 100,467 1,859 1.9 71,416 1,456 2.0 1991
Gwynedd:76,653 48,790 63.7 54,320 36,795 67.9 38,565 24,520 63.6 1971 (a)
81,017 48,343 59.7 50,350 32,436 64.4 41,326 25,497 61.7 1981 88,627 53,183 60.0 54,972 31,000 56.4 46,717 25,974 55.6 1991
Mid Glamorgan:192,265 10,520 5.5 126,065 17,920 14.2 58,975 18,535 31.7 1971 (a)
214,143 10,647 5.0 121,301 9,403 7.8 72,938 13,715 18.8 1981 217,747 12,954 5.9 118,091 5,722 4.8 84,092 9,801 11.7 1991
Powys:43,305 7,875 18.2 29,885 7,730 25.9 10,060 5,120 50.9 1971 (a)
41,061 6,900 16.8 25,182 6,151 24.4 18,392 5,019 27.3 1981 44,812 7,132 15.9 27,861 5,122 18.4 22,246 5,100 22.9 1991
South Glamorgan:156,915 7,670 4.9 96,135 4,885 5.1 56,560 3,415 6.0 1971 (a)
152,190 7,838 5.2 85,730 4,256 5.0 54,869 3,476 6.3 1981 165,538 9,957 6.0 81,090 3,668 4.5 63,127 3,028 4.8 1991
West Glamorgan:132,185 20,310 15.3 91,480 25,980 28.4 46,395 17,065 36.8 1971 (a)
141,335 15,990 11.3 87,507 17,863 20.4 55,949 17,516 31.3 1981 141,523 13,833 9.8 82,519 13,098 15.9 64,859 16,527 25.5 1991
Wales:1,025,568 178,335 17.4 681,585 169,080 24.8 371,005 117,430 31.6 1971 (a)1,073,795 165,162 15.4 634,278 131,415 20.7 422,599 115,935 27.4 1981
1,128,148 172,804 15.3 639,217 111,165 17.4 490,612 110,893 22.6 1991Source: Census Reports on Welsh language in Wales. 1971, 1981, and 1991

POPULATION
14 Digest of Welsh Historical Statistics 1974 - 1996
1.9 Births - number and rateNumber
Live birthsRate per
1,000 Still births (a)women Males born Rate per
Within Outside aged per 1,000 1,000Total Males Females marriage marriage 15 to 44 females born Number total births
1974 36,206 18,697 17,509 33,216 2,990 69.5 1,068 425 12
1975 33,972 17,603 16,369 31,134 2,838 64.8 1,075 372 111976 33,378 17,324 16,054 30,510 2,868 62.9 1,079 360 111977 31,765 16,327 15,438 28,944 2,821 59.2 1,057 308 101978 33,308 17,301 16,007 30,316 2,992 61.1 1,078 313 91979 36,174 18,662 17,512 32,830 3,344 65.4 1,066 307 8
1980 37,357 19,263 18,094 33,461 3,896 66.5 1,065 245 71981 35,842 18,333 17,509 31,820 4,022 63.1 1,047 264 71982 35,720 18,342 17,378 31,106 4,614 62.3 1,055 205 61983 35,494 18,057 17,437 30,349 5,145 61.3 1,036 213 61984 35,861 18,411 17,450 29,835 6,026 61.7 1,055 209 6
1985 36,771 18,855 17,916 29,807 6,964 63.0 1,052 214 61986 37,038 19,084 17,954 29,215 7,823 62.9 1,063 209 61987 37,816 19,406 18,410 28,988 8,828 63.8 1,054 196 51988 38,824 19,860 18,964 28,711 10,113 65.1 1,047 186 51989 38,019 19,606 18,413 27,301 10,718 63.7 1,065 176 5
1990 38,866 19,863 19,003 27,466 11,400 65.4 1,046 180 51991 38,079 19,538 18,541 25,780 12,299 64.3 1,054 177 51992 37,523 19,132 18,391 24,769 12,754 64.3 1,040 153 41993 36,578 18,782 17,796 23,685 12,893 63.3 1,055 215 51994 35,366 18,011 17,355 22,625 12,741 61.6 1,038 209 6
1995 34,477 17,661 16,816 21,352 13,125 60.0 1,050 175 51996 34,894 17,966 16,928 20,524 14,370 61.1 1,061 172 5
Source: Digest of Welsh Statistics
(a) The legal definition of a still birth changed on 1 October 1992 to include babies born dead between 24 and 27 weeks gestation. Data from1993 onwards are shown using this definition. Data up to and including the 1992 figure are presented on the former definition of 28 or morecompleted weeks’ gestation. The number of still births for 1992 using the new definition is 167.
POPULATION
15Digest of Welsh Historical Statistics 1974 - 1996
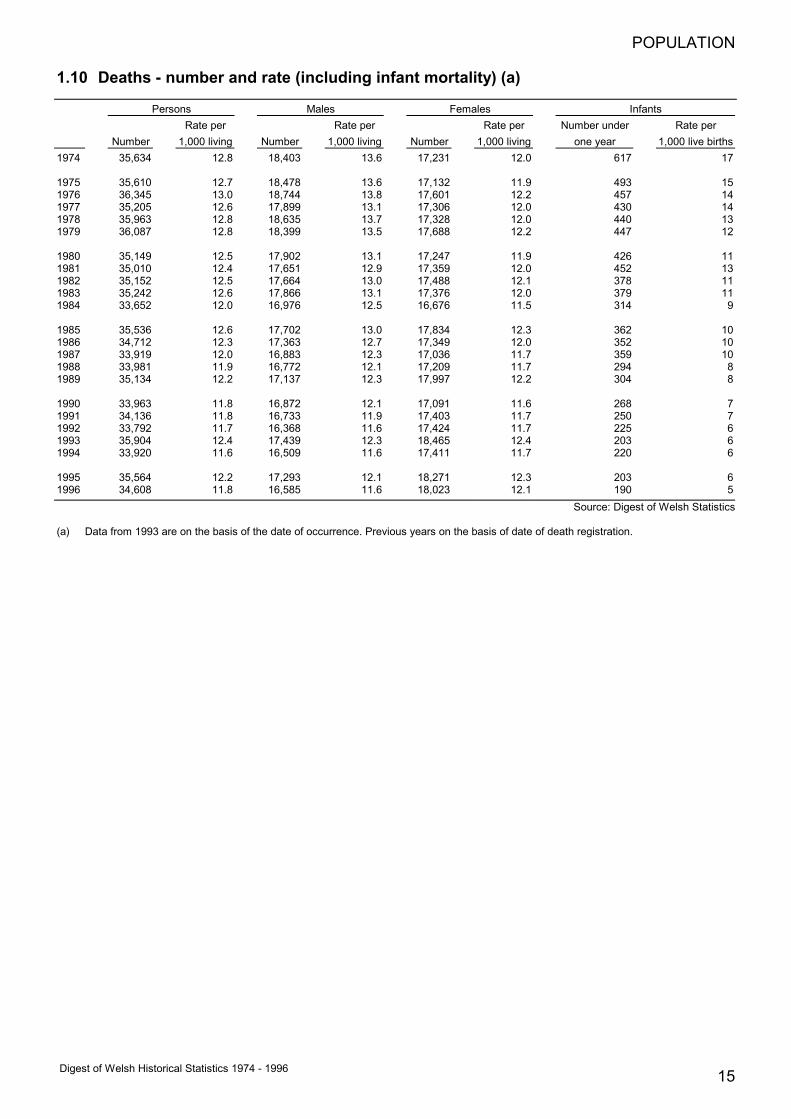
1.10 Deaths - number and rate (including infant mortality) (a)
Persons Males Females InfantsRate per Rate per Rate per Number under Rate per
Number 1,000 living Number 1,000 living Number 1,000 living one year 1,000 live births1974 35,634 12.8 18,403 13.6 17,231 12.0 617 17
1975 35,610 12.7 18,478 13.6 17,132 11.9 493 151976 36,345 13.0 18,744 13.8 17,601 12.2 457 141977 35,205 12.6 17,899 13.1 17,306 12.0 430 141978 35,963 12.8 18,635 13.7 17,328 12.0 440 131979 36,087 12.8 18,399 13.5 17,688 12.2 447 12
1980 35,149 12.5 17,902 13.1 17,247 11.9 426 111981 35,010 12.4 17,651 12.9 17,359 12.0 452 131982 35,152 12.5 17,664 13.0 17,488 12.1 378 111983 35,242 12.6 17,866 13.1 17,376 12.0 379 111984 33,652 12.0 16,976 12.5 16,676 11.5 314 9
1985 35,536 12.6 17,702 13.0 17,834 12.3 362 101986 34,712 12.3 17,363 12.7 17,349 12.0 352 101987 33,919 12.0 16,883 12.3 17,036 11.7 359 101988 33,981 11.9 16,772 12.1 17,209 11.7 294 81989 35,134 12.2 17,137 12.3 17,997 12.2 304 8
1990 33,963 11.8 16,872 12.1 17,091 11.6 268 71991 34,136 11.8 16,733 11.9 17,403 11.7 250 71992 33,792 11.7 16,368 11.6 17,424 11.7 225 61993 35,904 12.4 17,439 12.3 18,465 12.4 203 61994 33,920 11.6 16,509 11.6 17,411 11.7 220 6
1995 35,564 12.2 17,293 12.1 18,271 12.3 203 61996 34,608 11.8 16,585 11.6 18,023 12.1 190 5
Source: Digest of Welsh Statistics
(a) Data from 1993 are on the basis of the date of occurrence. Previous years on the basis of date of death registration.

POPULATION
16 Digest of Welsh Historical Statistics 1974 - 1996
1.11 Deaths by cause and sex (a)
Malignant neoplasm of ChronicTrachea, rheumatic
Tuberculosis bronchus Diabetes heart(all forms) Stomach and lung Breast Uterus Leukaemia mellitus disease
Males:1974 68 485 1,335 - - 86 118 143
1975 53 461 1,429 - - 94 102 1401976 65 487 1,382 - - 106 107 1431977 53 438 1,349 - - 86 145 1391978 54 461 1,372 - - 109 105 1271979 52 464 1,420 - - 94 129 69
1980 42 448 1,415 - - 97 109 771981 47 442 1,361 - - 89 138 711982 39 464 1,373 - - 73 122 711983 38 445 1,391 - - 114 115 811984 34 461 1,413 - - 104 155 54
1985 30 400 1,365 - - 108 168 401986 35 440 1,430 - - 103 205 541987 22 388 1,396 - - 108 203 431988 35 390 1,383 - - 118 159 481989 18 362 1,435 - - 97 220 40
1990 28 379 1,380 - - 107 185 401991 24 369 1,357 - - 121 206 381992 32 355 1,324 - - 122 226 351993 15 343 1,393 - - 116 156 261994 18 344 1,308 - - 99 162 27
1995 24 341 1,257 - - 117 183 321996 22 308 1,141 - - 118 170 42
Females:1974 29 349 283 617 218 73 211 220
1975 23 345 313 639 218 77 174 2661976 24 336 295 648 217 81 200 2521977 29 343 284 704 238 98 160 2151978 26 331 351 663 248 86 169 2051979 23 351 367 692 238 92 202 178
1980 17 287 351 713 211 95 197 1501981 14 331 396 745 223 77 171 1611982 16 309 456 740 223 84 176 1491983 19 313 474 748 228 92 140 1531984 13 321 434 806 221 88 227 138
1985 24 292 505 768 236 82 257 1491986 26 263 501 774 223 101 269 1101987 10 250 544 810 242 95 234 1211988 19 297 576 844 237 98 255 1191989 24 246 616 856 205 95 289 122
1990 16 234 600 772 223 87 251 1101991 17 234 598 769 246 109 251 1101992 17 225 653 824 203 104 285 1291993 20 208 624 800 197 94 191 991994 11 225 658 783 179 98 179 101
1995 18 206 607 745 179 104 220 1051996 10 172 636 730 172 84 214 99
(a) Deaths analysed according to the International Classification of Diseases, 9th revision (1975). From 1986 neonatal deaths within 28 daysof birth are not recorded in terms of one underlying cause of death and are not included in this table. Typical values range from 58-116. Achange in the application of coding rules from 1984 onwards means that data on deaths are not strictly comparable with earlier years;data on deaths due to pneumonia, influenza and diabetes mellitus are especially affected by this change. A further change in codingprocedures occurred from 1993 with the introduction of automated cause coding and with it the reversing of the 1984 coding (WHO3) rulechange, as well as moving to presenting figures for the number of occurrences rather than registration (of deaths) in each calendar year.
(b) The statistical definition of suicide has changed. From 1993 the definition uses ICD codes E950-E959, E980-E989 excluding E988.8. Inearlier years, codes E950-E959 only were used.
POPULATION
17Digest of Welsh Historical Statistics 1974 - 1996
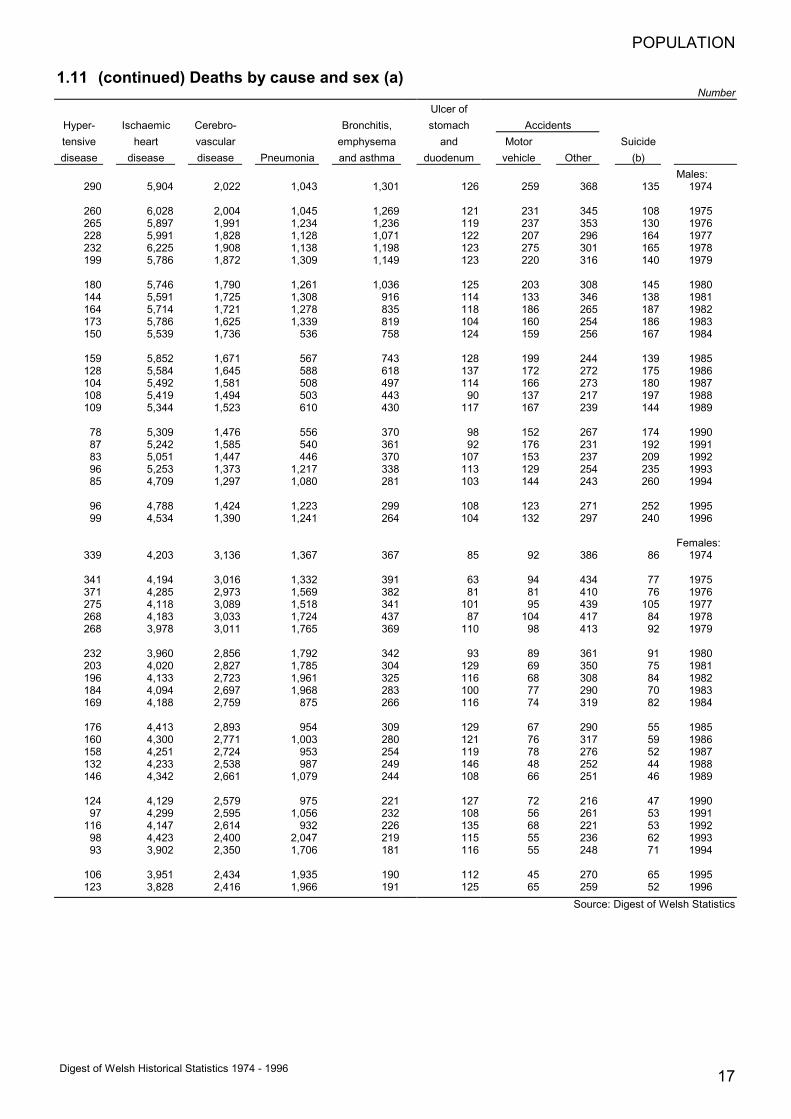
1.11 (continued) Deaths by cause and sex (a)Number
Ulcer ofHyper- Ischaemic Cerebro- Bronchitis, stomach Accidentstensive heart vascular emphysema and Motor Suicidedisease disease disease Pneumonia and asthma duodenum vehicle Other (b)
Males:290 5,904 2,022 1,043 1,301 126 259 368 135 1974
260 6,028 2,004 1,045 1,269 121 231 345 108 1975265 5,897 1,991 1,234 1,236 119 237 353 130 1976228 5,991 1,828 1,128 1,071 122 207 296 164 1977232 6,225 1,908 1,138 1,198 123 275 301 165 1978199 5,786 1,872 1,309 1,149 123 220 316 140 1979
180 5,746 1,790 1,261 1,036 125 203 308 145 1980144 5,591 1,725 1,308 916 114 133 346 138 1981164 5,714 1,721 1,278 835 118 186 265 187 1982173 5,786 1,625 1,339 819 104 160 254 186 1983150 5,539 1,736 536 758 124 159 256 167 1984
159 5,852 1,671 567 743 128 199 244 139 1985128 5,584 1,645 588 618 137 172 272 175 1986104 5,492 1,581 508 497 114 166 273 180 1987108 5,419 1,494 503 443 90 137 217 197 1988109 5,344 1,523 610 430 117 167 239 144 1989
78 5,309 1,476 556 370 98 152 267 174 199087 5,242 1,585 540 361 92 176 231 192 199183 5,051 1,447 446 370 107 153 237 209 199296 5,253 1,373 1,217 338 113 129 254 235 199385 4,709 1,297 1,080 281 103 144 243 260 1994
96 4,788 1,424 1,223 299 108 123 271 252 199599 4,534 1,390 1,241 264 104 132 297 240 1996
Females:339 4,203 3,136 1,367 367 85 92 386 86 1974
341 4,194 3,016 1,332 391 63 94 434 77 1975371 4,285 2,973 1,569 382 81 81 410 76 1976275 4,118 3,089 1,518 341 101 95 439 105 1977268 4,183 3,033 1,724 437 87 104 417 84 1978268 3,978 3,011 1,765 369 110 98 413 92 1979
232 3,960 2,856 1,792 342 93 89 361 91 1980203 4,020 2,827 1,785 304 129 69 350 75 1981196 4,133 2,723 1,961 325 116 68 308 84 1982184 4,094 2,697 1,968 283 100 77 290 70 1983169 4,188 2,759 875 266 116 74 319 82 1984
176 4,413 2,893 954 309 129 67 290 55 1985160 4,300 2,771 1,003 280 121 76 317 59 1986158 4,251 2,724 953 254 119 78 276 52 1987132 4,233 2,538 987 249 146 48 252 44 1988146 4,342 2,661 1,079 244 108 66 251 46 1989
124 4,129 2,579 975 221 127 72 216 47 199097 4,299 2,595 1,056 232 108 56 261 53 1991
116 4,147 2,614 932 226 135 68 221 53 199298 4,423 2,400 2,047 219 115 55 236 62 199393 3,902 2,350 1,706 181 116 55 248 71 1994
106 3,951 2,434 1,935 190 112 45 270 65 1995123 3,828 2,416 1,966 191 125 65 259 52 1996
Source: Digest of Welsh Statistics

POPULATION
18 Digest of Welsh Historical Statistics 1974 - 1996
1.12 Marriages
Personsmarryingper 1,000 Males
Total population Aged:marriages aged 15+ Single Widowed Divorced Under 20 20-24 25-29 30-34 35-44 45-54 55+
1974 21,252 19.9 17,461 867 2,924 2,158 9,598 4,677 1,672 1,421 856 870
1975 20,659 19.2 16,638 879 3,142 1,914 9,152 4,691 1,607 1,512 877 9061976 19,522 18.1 15,328 911 3,283 1,684 8,565 4,389 1,659 1,464 881 8801977 19,701 18.1 15,320 819 3,562 1,770 8,319 4,450 1,920 1,512 845 8851978 20,628 18.8 15,803 826 3,999 1,710 8,641 4,652 2,129 1,711 886 8991979 20,250 18.3 15,569 779 3,902 1,638 8,486 4,604 2,159 1,663 846 854
1980 21,071 18.9 15,950 777 4,344 1,625 8,655 4,855 2,339 1,882 886 8291981 19,760 17.7 15,094 710 3,956 1,333 8,168 4,668 2,150 1,827 826 7881982 19,029 17.0 14,489 688 3,852 1,241 7,759 4,603 2,058 1,817 792 7591983 19,891 17.7 15,038 680 4,173 1,169 8,004 4,937 2,133 2,025 839 7841984 19,171 17.0 14,460 643 4,071 918 7,532 4,998 2,154 2,016 828 728
1985 19,148 16.9 14,385 574 4,189 858 7,394 5,118 2,135 2,122 847 6741986 19,513 17.1 14,482 606 4,425 706 7,109 5,531 2,236 2,258 910 7631987 19,528 17.0 14,613 548 4,367 662 6,953 5,679 2,441 2,196 895 7021988 19,309 16.7 14,299 578 4,432 587 6,490 5,714 2,422 2,378 959 7591989 19,453 16.7 14,256 533 4,664 479 6,063 5,964 2,658 2,520 1,049 720
1990 18,438 15.8 13,426 495 4,517 444 5,372 5,894 2,616 2,394 997 7211991 16,638 14.3 12,127 467 4,044 324 4,530 5,623 2,444 2,155 899 6631992 16,602 14.2 11,922 442 4,238 264 4,250 5,402 2,654 2,298 1,031 7031993 15,871 13.6 11,258 446 4,167 193 3,591 5,288 2,747 2,263 1,103 6861994 15,538 13.3 10,970 422 4,146 163 3,193 5,254 2,887 2,284 1,066 691
1995 14,668 12.5 10,279 417 3,972 131 2,669 4,939 2,876 2,218 1,161 674
POPULATION
19Digest of Welsh Historical Statistics 1974 - 1996
1.12 (continued) Marriages
FemalesAge
Single Widowed Divorced Under 20 20-24 25-29 30-34 35-44 45-54 55+17,427 981 2,844 5,998 8,872 2,836 1,078 1,115 777 576 1974
16,583 965 3,111 5,685 8,426 2,858 1,079 1,195 772 644 197515,346 945 3,231 5,117 7,940 2,823 1,124 1,188 719 611 197615,409 883 3,409 5,165 7,886 2,874 1,228 1,198 736 614 197715,809 915 3,904 5,153 8,399 2,922 1,418 1,382 736 618 197815,443 833 3,974 4,941 8,285 2,966 1,477 1,329 678 574 1979
16,161 805 4,105 4,802 8,939 3,136 1,478 1,444 717 555 198015,180 730 3,850 4,068 8,653 2,984 1,470 1,413 639 533 198114,480 694 3,855 3,902 8,186 3,038 1,331 1,415 661 496 198215,184 695 4,012 3,659 8,711 3,370 1,480 1,501 677 493 198314,576 645 3,953 3,122 8,478 3,466 1,479 1,528 620 481 1984
14,651 543 3,954 2,676 8,726 3,698 1,461 1,536 631 420 198514,720 609 4,184 2,449 8,661 3,963 1,588 1,709 708 435 198614,773 587 4,168 2,229 8,600 4,259 1,689 1,658 678 415 198714,479 590 4,240 1,940 8,306 4,357 1,715 1,778 737 476 198814,367 551 4,535 1,753 7,815 4,757 1,928 1,979 792 429 1989
13,594 498 4,346 1,416 7,242 4,786 1,916 1,867 788 423 199012,308 473 3,857 1,148 6,238 4,625 1,857 1,666 715 389 199112,011 446 4,145 935 5,905 4,668 2,064 1,834 805 391 199211,351 422 4,098 685 5,271 4,693 2,142 1,824 847 409 199311,023 393 4,122 624 4,853 4,733 2,249 1,820 876 383 1994
10,161 395 4,112 529 4,026 4,638 2,329 1,869 900 377 1995Source: Digest of Welsh Statistics
1.13 Divorces (a)Number
Petitions filed for dissolution Judicial Separations Nullity All petitionsBy Husband By Wife Total By Husband By Wife Total By Husband By Wife Total By Husband By Wife Total
1974 1,405 4,525 5,930 2 8 10 25 18 43 1,432 4,551 5,983
1975 1,492 4,429 5,921 3 6 9 25 31 56 1,508 4,454 5,9621976 1,684 5,251 6,935 . 13 13 26 13 39 1,710 5,277 6,9871977 1,882 6,750 8,632 3 24 27 9 25 34 1,894 6,795 8,6891978 1,973 6,391 8,364 . 73 73 13 22 35 1,986 6,486 8,4721979 1,944 6,474 8,418 19 91 110 9 17 26 1,972 6,582 8,554
1980 2,092 6,872 8,964 25 163 188 8 23 31 2,125 7,058 9,1831981 1,844 6,969 8,813 20 202 222 23 12 35 1,887 7,183 9,0701982 1,737 7,284 9,021 25 263 288 . 17 17 1,762 7,564 9,3261983 1,900 7,210 9,105 60 280 346 10 10 24 1,980 7,500 9,4751984 3,130 6,460 9,587 200 100 293 40 40 89 3,370 6,600 9,969
1985 2,140 8,320 10,457 20 130 149 . 10 12 2,160 8,460 10,6181986 2,290 7,590 9,880 40 150 193 10 20 23 2,340 7,762 10,0961987 1,980 7,700 9,678 50 130 186 . . . 2,040 7,830 9,8641988 2,220 7,750 9,973 10 110 122 . 10 12 2,230 7,880 10,1071989 2,230 8,230 10,459 10 140 150 10 . 10 2,250 8,380 10,628
1990 .. .. 10,607 .. .. 161 .. .. 17 .. .. 10,7851991 .. .. 10,065 .. .. 246 .. .. 20 .. .. 10,3311992 .. .. 10,554 .. .. 181 .. .. 15 .. .. 10,7501993 .. .. 9,906 .. .. 160 .. .. 16 .. .. 10,0821994 .. .. 9,152 .. .. 548 .. .. 26 .. .. 9,726
1995 .. .. 9,275 .. .. 127 .. .. 16 .. .. 9,4181996 .. .. 9,618 .. .. 43 .. .. 12 .. .. 9,673
Source: Digest of Welsh Statistics (obtained from Lord Chancellor's Department)
(a) In county courts in Wales. For 1983-93 the breakdown between husband and wife of petitions filed is estimated from a two month sampleand the resulting figures rounded to the nearest ten. Figures may not reconcile due to rounding. Breakdown of figures into 'By husband'and 'By wife' not available from 1990. The Matrimonial and Family Proceedings Act 1984 (enacted October 1984) meant that petition fordivorce was possible after 1 year of marriage, not 3 years as previously.

POPULATION
20 Digest of Welsh Historical Statistics 1974 - 1996
1.14 Legally induced abortions reported by Welsh hospitals (a)
By marital status By ageSingle Married Others (b) Not stated Under 16 16-19 20-34 35-44 45 & over Not stated
1974 1,154 1,813 354 15 97 630 1,888 676 20 25
1975 1,074 1,589 324 - 106 621 1,644 592 23 11976 1,048 1,570 320 - 110 614 1,589 595 30 -1977 1,133 1,578 392 2 120 667 1,649 635 33 11978 1,274 1,831 440 7 108 763 1,904 742 31 41979 1,294 1,822 497 4 103 735 2,007 739 31 2
1980 1,372 1,632 483 3 112 793 1,850 700 34 11981 1,550 1,666 461 7 115 878 1,950 714 27 -1982 1,593 1,486 508 - 136 838 1,916 669 28 -1983 1,721 1,449 439 - 138 891 1,880 685 15 -1984 1,800 1,391 484 - 133 930 1,970 616 26 -
1985 2,048 1,394 534 1 150 1,016 2,149 648 14 -1986 2,157 1,413 567 9 139 1,007 2,367 617 16 -1987 2,339 1,272 523 6 156 1,003 2,388 574 19 -1988 2,427 1,227 562 3 142 1,040 2,464 560 12 11989 2,472 1,229 546 7 114 998 2,592 535 15 -
1990 2,698 1,260 589 6 132 1,026 2,768 610 16 11991 2,697 1,174 599 17 124 973 2,876 498 16 11992 2,636 1,131 507 20 134 888 2,787 475 10 -1993 2,920 1,158 496 22 119 1,004 2,945 515 13 -1994 2,970 1,082 429 49 150 917 2,956 495 12 -
1995 2,919 985 400 52 160 888 2,821 469 18 -
(a) Notifications received up to the end of March of the following year.(b) Widowed, divorced or separated.(c) The number of previous live births and still births.(d) Includes hysterectomy.
POPULATION
21Digest of Welsh Historical Statistics 1974 - 1996
1.14 (continued) Legally induced abortions reported by Welsh hospitals (a)Number
By gestation time9 and
By parity (c) By sterilisation Under under 13Not Sterilised Not 9 13 weeks Not Total
0 1 2 3 4 5+ stated (d) sterilised weeks weeks and over stated abortions1,147 397 733 580 267 206 6 489 2,847 326 1,987 938 85 3,336 1974
1,057 373 653 525 221 158 - 393 2,594 320 1,804 849 14 2,987 19751,059 340 746 488 183 122 - 395 2,543 290 1,834 812 2 2,938 19761,141 384 784 484 209 102 1 388 2,717 349 1,934 794 28 3,105 19771,314 501 909 519 217 90 2 428 3,124 429 2,159 930 34 3,552 19781,321 466 963 548 227 91 1 496 3,121 506 2,161 908 42 3,617 1979
1,369 515 846 508 173 79 - 446 3,044 577 2,008 872 33 3,490 19801,527 463 906 492 196 97 3 472 3,212 656 2,294 725 9 3,684 19811,542 502 883 431 161 68 - 400 3,187 673 2,245 669 - 3,587 19821,641 516 827 401 136 88 - 328 3,281 684 2,329 596 - 3,609 19831,707 533 830 388 160 57 - 302 3,373 688 2,374 613 - 3,675 1984
1,905 617 865 410 134 46 - 298 3,679 611 2,669 697 - 3,977 19851,964 639 914 424 157 48 - 322 3,824 635 2,868 643 - 4,146 19862,055 652 865 373 140 55 - 267 3,873 610 2,905 625 - 4,140 19872,027 707 902 390 124 69 - 238 3,981 612 2,997 610 - 4,219 19882,024 754 884 402 133 56 1 276 3,978 748 2,934 572 - 4,254 1989
2,109 787 992 453 146 66 - 300 4,253 824 3,198 531 - 4,553 19902,036 909 921 430 135 56 1 267 4,220 774 3,076 616 22 4,488 19911,947 815 917 405 146 63 1 209 4,084 865 2,933 496 - 4,294 19922,102 918 969 399 145 63 - 225 4,371 1,077 3,066 453 - 4,596 19932,090 918 935 407 120 60 - 217 4,313 1,236 2,911 383 - 4,530 1994
2,083 847 827 406 127 64 - 161 4,195 1,202 2,703 451 - 4,356 1995Source: Digest of Welsh Statistics
POPULATION
22 Digest of Welsh Historical Statistics 1974 - 1996
1.15 Legally induced abortions by place of operation and by area of residence ofmother (a) Number
Place of operation Place of residence of motherRates Mid South West
Wales
England Total (b) Clwyd Dyfed Gwent Gwynedd Glamorgan Powys Glamorgan Glamorgan Wales
1974 3,310 1,599 4,909 9.5 506 616 757 392 928 201 621 888 4,909
1975 2,951 1,881 4,832 9.2 510 561 817 354 846 188 669 887 4,8321976 2,932 1,933 4,865 9.2 574 588 730 398 866 207 637 865 4,8651977 3,077 1,931 5,008 9.3 664 599 685 398 935 187 660 880 5,0081978 3,407 2,209 5,616 10.3 764 634 800 457 1,016 222 856 867 5,6161979 3,691 2,518 6,209 11.2 792 709 872 484 1,237 232 832 1,051 6,209
1980 3,524 2,767 6,291 11.2 840 707 990 474 1,164 240 898 978 6,2911981 3,662 2,679 6,341 11.2 832 760 968 558 1,055 235 908 1,025 6,3411982 3,621 2,481 6,102 10.6 828 701 923 468 981 223 924 1,054 6,1021983 3,477 2,387 5,864 10.1 889 729 811 477 911 233 923 891 5,8641984 3,623 2,614 6,237 10.7 915 739 969 514 1,006 245 919 930 6,237
1985 3,829 2,768 6,597 11.2 1,008 767 1,015 507 1,109 257 1,001 933 6,5971986 4,079 2,667 6,746 11.3 1,014 807 921 544 1,192 237 1,040 991 6,7461987 4,061 2,744 6,805 11.3 1,000 766 1,011 546 1,134 281 1,051 1,016 6,8051988 4,170 3,209 7,379 12.2 1,103 840 1,106 617 1,199 293 1,163 1,058 7,3791989 4,215 3,151 7,366 12.1 1,212 790 1,121 649 1,213 245 1,104 1,032 7,366
1990 4,440 3,000 7,440 12.2 1,166 802 1,061 656 1,204 297 1,147 1,107 7,4401991 4,416 2,771 7,187 12.1 1,131 777 1,003 625 1,260 234 1,090 1,067 7,1871992 4,262 2,594 6,856 11.7 1,092 734 1,017 603 1,144 224 1,064 978 6,8561993 4,554 2,370 6,924 12.0 1,080 746 997 633 1,206 256 1,008 998 6,9251994 4,484 2,291 6,775 11.8 1,101 754 921 584 1,183 232 1,053 947 6,775
1995 4,335 2,105 6,440 11.3 1,023 764 821 550 1,161 230 981 910 6,440Sources: Digest of Welsh Statistics, Abortion Statistics England and Wales; Health and Personal Social Services Statistics for Wales
(a) Notifications received to the end of March of the following year, except 1989 when receipts were to the end of April.(b) Per 1,000 women aged 15 to 44.