population expansion, current and past gene flow in gould ... · pdf filepopulation expansion,...
TRANSCRIPT
RESEARCH ARTICLE
Population expansion, current and past gene flow in Gould’spetrel: implications for conservation
A. Iglesias-Vasquez1 • B. Gangloff1,5 • S. Ruault1 • C. Ribout1 • D. Priddel2 •
N. Carlile2 • V. L. Friesen3 • A. Cibois4 • V. Bretagnolle1
Received: 4 November 2015 / Accepted: 13 September 2016 / Published online: 21 September 2016
� Springer Science+Business Media Dordrecht 2016
Abstract Seabird life-history traits such as long generation
time, low annual fecundity and delayed sexual maturation
make them more prone to population loss and consequently
to extinction; petrels are indeed amongst the most threat-
ened birds. Based on coalescence and multiloci inference
this study examines the extent of genetic differentiation of
a vulnerable New Caledonia (caledonica) and Australia
(leucoptera) subspecies of Pterodroma leucoptera
(Gould’s Petrel), and whether the genetic relationship
between them results from the influence of past events like
variation in sea level, or is dominated by contemporary
gene flow. Sequences of two mitochondrial genes and five
nuclear introns were obtained from 86 individuals from
both populations. Haplotype networks were used to infer
relationships between the haplotypes of both populations.
The demographic history of the P. leucoptera complex was
studied using neutrality tests and Extended Bayesian Sky-
line Plots. A weak population differentiation was revealed.
The Extended Bayesian Skyline plot suggested a popula-
tion expansion approximately 80,000 years before present
(bp) for caledonica and 30,000 years bp for leucoptera.
The split was dated to 30,000 years bp by means of mul-
tilocus inference through *BEAST. Despite genetic simi-
larity of the two taxa, we advocate to consider them as
independent units for conservation management, given
their strong ecological distinctiveness (foraging distribu-
tion, winter distribution, breeding phenology and breeding
distribution).
Keywords Phylogeography � Extended Bayesian Skyline
plot � Procellariiformes � Seabird � Isolation with
Migration � Conservation genetics
Introduction
Anthropogenic impacts on islands, in particular biological
invasion and habitat destruction, have been identified as the
most important causes of genetic diversity loss, population
extinction and, island fauna depletion (Lande 1998;
Steadman 2006; Illera et al. 2012). Population extinction is
(usually) a long process through which the population first
declines in size, then experiences demographic stochas-
ticity and finally becomes extinct (Caughley 1994). Indeed,
population genetic theory predicts that when a population
declines, genetic diversity is lost as a result of genetic drift
and inbreeding depression (Frankham et al. 2002; Allen-
dorf and Luikart 2009). However, disentangling the rela-
tive roles of contemporary and historical processes on the
overall genetic diversity and population differentiation, and
ultimately, survival of populations, is notoriously difficult
(Chiucchi and Gibbs 2010; Henriques et al. 2014).
Electronic supplementary material The online version of thisarticle (doi:10.1007/s10592-016-0886-6) contains supplementarymaterial, which is available to authorized users.
& A. Iglesias-Vasquez
1 Centre d’Etudes Biologiques de Chize, UMR 7372, CNRS &
Universite de La Rochelle, 79360 Villiers en Bois, France
2 Office of Environment and Heritage,
PO Box 1967, Hurstville, NSW 2220, Australia
3 Department of Biology, Queen’s University, Kingston,
ON K7L3N6, Canada
4 Department of Mammalogy and Ornithology, Natural History
Museum of Geneva, 1211 Geneva 6, Geneva, Switzerland
5 Service de Systematique Moleculaire, UMS 2700 OMSI,
MNHN – CNRS, 75005 Paris, France
123
Conserv Genet (2017) 18:105–115
DOI 10.1007/s10592-016-0886-6

Maximum likelihood and Bayesian analyses based on
coalescent theory, when applied to DNA (site and length
polymorphism), may provide insights into demographic
history and genetic structure (Rocha et al. 2011; Brown
et al. 2012; Zielinski et al. 2013). Coalescent theory
assumes that for any two genetic sequences drawn from a
population at random, the probability that they coalesce at
a given time is a function of population size at that time
(Kingman 1982). Coalescent theory also allows estimation
of historic gene flow (Beerli and Felsenstein 1999; Hey and
Nielsen 2004). This approach has proved useful in con-
servation genetics to understand patterns of intraspecific
diversity, especially when population size and gene flow
are key factors for the long-term survival of conservation
units (Hey 2005; Rocha et al. 2011; Zielinski et al. 2013).
Pleistocene climatic oscillations have influenced popu-
lation distribution, gene flow and genetic variability
through changes in habitat availability in various marine
organisms (e.g. Pielou 2008; Cheang et al. 2012). In par-
ticular, Pleistocene glacial/interglacial cycles seems to
have had marked effects on seabirds due to their current
extreme characteristics in life-history traits (Gomez-Dıaz
et al. 2006; Mareile Techow et al. 2009; Techow et al.
2010; Gangloff et al. 2012; Silva et al. 2015) that make
them particularly suitable for investigating past and recent
population changes using genetic tools. Among seabirds,
petrels (Procellariidae) are the most extreme in regard to
demographic parameters (as reviewed in Dobson and
Jouventin 2007). They usually show large distributions and
have very high dispersal abilities (Shaffer et al. 2006). In
addition, they breed on remote oceanic islands and exhibit
high natal philopatry, often returning to breed within a few
meters of their natal nest (Rabouam et al. 1998; Huyvaert
and Anderson 2004). High dispersal ability and philopatry
act in opposition: strong dispersal capacities should pro-
mote gene flow (van Bekkum et al. 2006), while their
strong philopatry should promote genetic differentiation
(Burg and Croxall 2001; Dearborn et al. 2003).
Within the petrels, the genus Pterodroma (c.35 species)
alone accounts for 10 % of all seabird species. Gould’s
Petrel Pterodroma leucoptera is a small pelagic gadfly
petrel (200–250 g), breeding only on two sites separated by
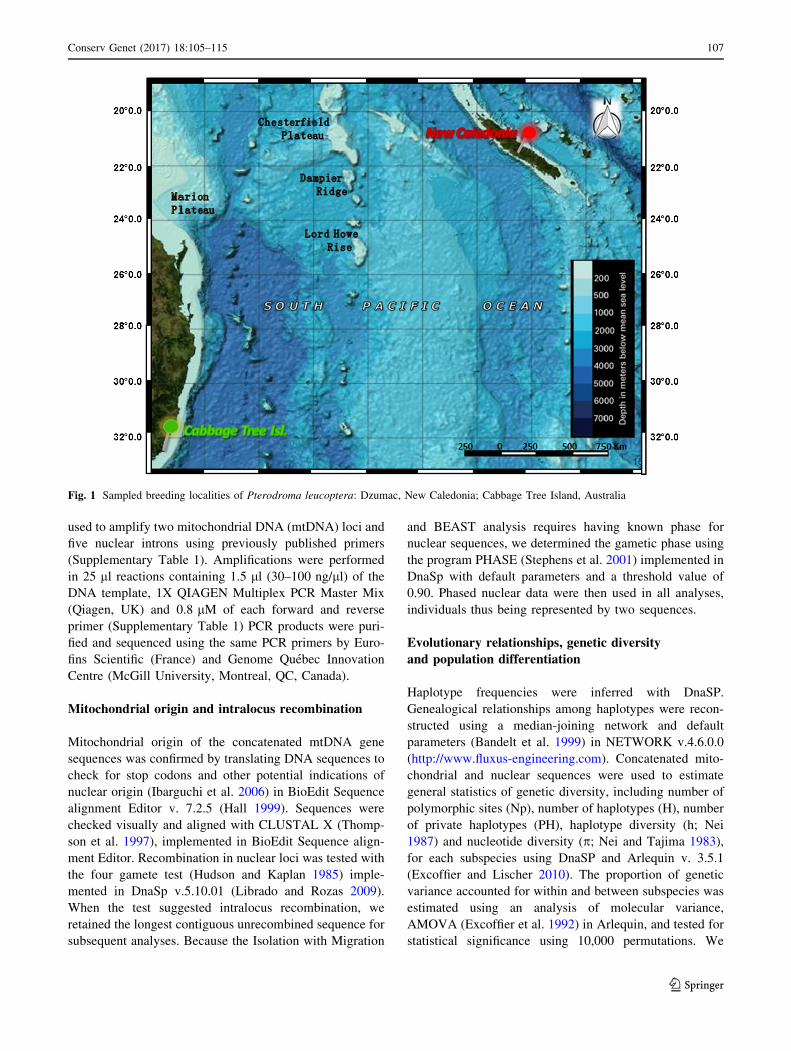
c.1500 km in the Southwest Pacific Ocean (Fig. 1). Each
population has been treated as an endemic subspecies
because of subtle differences in morphology and coloration
(Imber and Jenkins 1981; Bretagnolle and Shirihai 2010).
The Australian subspecies, P. l. leucoptera (hereafter leu-
coptera), now breeds only on two small islands in New
South Wales (Cabbage Tree Island and Boondelbah Island
separated by 1.6 km: Carlile et al. 2003), while the New
Caledonian subspecies (P. l. caledonica, hereafter cale-
donica) is restricted to the south central chain of New
Caledonia (Naurois and Rancurel 1978; Bretagnolle and
Shirihai 2010). Several thousands of birds have been ringed
but no exchange has ever been documented; however long-
term ringing has been done only on Cabbage Tree Island
(Priddel et al. 2014). Subspecies also differ in breeding
behavior and habitats (leucoptera nests in natural cavities
among rock scree close to sea level, caledonica excavates
soil burrows high in the mountains), breeding phenology (a
lag of one month; Priddel et al. 2014), foraging zones while
breeding, and migration and non-breeding areas (Priddel
et al. 2014). However, the genetic relationship between the
two taxa remains mostly unknown. Both taxa experienced
recent fluctuations in population sizes: leucoptera was
numerous when discovered in the eighteenth century
(Gould 1865), but decreased to fewer than 1500 individuals
in 1992 (c. 200 pairs). Classified as vulnerable (IUCN
2015), its population recovered to 1000 pairs thanks to a
recent restoration program (Priddel and Carlile 1995;
2009). Although no precise information on population
trend exists for caledonica, its numbers decreased follow-
ing the introduction of predators (black rats Rattus rattus,
cats Felis catus and pigs Sus scrofa) with European set-
tlement approximately 190 years ago (Miller and Mullette
1985; Armstrong 1992; IUCN 2015).
In this study, seven molecular markers were used (two
mitochondrial genes and five nuclear introns), (i) to clarify
whether taxonomic treatment of the two subspecies is
supported by molecular data, (ii) to test whether present
genetic structure results from demographic fluctuations
(expansions and bottlenecks) due to Pleistocene climatic
oscillations, or from more recent changes likely related to
anthropogenic pressure; and (iii) to estimate time of
divergence of the two populations and their past effective
population sizes.
Methods
Sampling, DNA purification, gene amplification,
and sequencing
A total of 86 samples of Pterodroma leucoptera, consisting
of blood (45) and feathers (41), were collected from the
two known breeding localities (Fig. 1). Feathers were
sampled from live adult birds from the Mt. Dzumac colony,
New Caledonia, during the breeding seasons of 2005–2006
and 2008–2009. Similarly, blood samples were collected
from Australian birds at the Cabbage Tree Island colony
from 2005 to 2008. Blood was collected from veins on the
leg or wing using microcapillaries. Samples were stored
until analysis in 70 % ethanol at -20 �C. Total genomic
DNA was isolated from blood samples using Qia-
genDNeasy Blood and Tissue extraction kits (Qiagen, Inc.,
Valencia, CA). Polymerase Chain Reaction (PCR) was
106 Conserv Genet (2017) 18:105–115
123
used to amplify two mitochondrial DNA (mtDNA) loci and
five nuclear introns using previously published primers
(Supplementary Table 1). Amplifications were performed
in 25 ll reactions containing 1.5 ll (30–100 ng/ll) of the
DNA template, 1X QIAGEN Multiplex PCR Master Mix
(Qiagen, UK) and 0.8 lM of each forward and reverse
primer (Supplementary Table 1) PCR products were puri-
fied and sequenced using the same PCR primers by Euro-
fins Scientific (France) and Genome Quebec Innovation
Centre (McGill University, Montreal, QC, Canada).
Mitochondrial origin and intralocus recombination
Mitochondrial origin of the concatenated mtDNA gene
sequences was confirmed by translating DNA sequences to
check for stop codons and other potential indications of
nuclear origin (Ibarguchi et al. 2006) in BioEdit Sequence
alignment Editor v. 7.2.5 (Hall 1999). Sequences were
checked visually and aligned with CLUSTAL X (Thomp-
son et al. 1997), implemented in BioEdit Sequence align-
ment Editor. Recombination in nuclear loci was tested with
the four gamete test (Hudson and Kaplan 1985) imple-
mented in DnaSp v.5.10.01 (Librado and Rozas 2009).
When the test suggested intralocus recombination, we
retained the longest contiguous unrecombined sequence for
subsequent analyses. Because the Isolation with Migration
and BEAST analysis requires having known phase for
nuclear sequences, we determined the gametic phase using
the program PHASE (Stephens et al. 2001) implemented in
DnaSp with default parameters and a threshold value of
0.90. Phased nuclear data were then used in all analyses,
individuals thus being represented by two sequences.
Evolutionary relationships, genetic diversity
and population differentiation
Haplotype frequencies were inferred with DnaSP.
Genealogical relationships among haplotypes were recon-
structed using a median-joining network and default
parameters (Bandelt et al. 1999) in NETWORK v.4.6.0.0
(http://www.fluxus-engineering.com). Concatenated mito-
chondrial and nuclear sequences were used to estimate
general statistics of genetic diversity, including number of
polymorphic sites (Np), number of haplotypes (H), number
of private haplotypes (PH), haplotype diversity (h; Nei
1987) and nucleotide diversity (p; Nei and Tajima 1983),
for each subspecies using DnaSP and Arlequin v. 3.5.1
(Excoffier and Lischer 2010). The proportion of genetic
variance accounted for within and between subspecies was
estimated using an analysis of molecular variance,
AMOVA (Excoffier et al. 1992) in Arlequin, and tested for
statistical significance using 10,000 permutations. We
Fig. 1 Sampled breeding localities of Pterodroma leucoptera: Dzumac, New Caledonia; Cabbage Tree Island, Australia
Conserv Genet (2017) 18:105–115 107
123

calculated pairwise differentiation between subspecies
using UST (with Tamura-Nei substitution model), a direct
analogue of Wright’s Fst for nucleotide sequence
divergence.
Population size fluctuations through time
Two tests were used to assess if genetic variation deviated
from neutral expectations due to either a recent population
expansion or selection: Tajima’s D (Tajima 1989) and Fu’s
Fs (Fu 1997) both implemented in Arlequin. Tajima’s D
values[0 suggest either a recent population bottleneck or
balancing selection, while D\ 0 indicates a population
expansion or directional selection. These values are con-
sidered significant when p\ 0.05. Fu’s Fs tends to be
negative when there is an excess of recent mutations
(therefore an overabundance of rare alleles), characteristic
of a recent population expansion. Positive Fu’s Fs values
indicate a deficiency of rare alleles, suggesting a popula-
tion bottleneck or overdominant selection. Following (Fu
1997) Fu’s Fs values are regarded as significant if
p\ 0.02. which corresponds to the conventional signifi-
cant p\ 0.05 for Tajima’s D. Significant negative Taji-
ma’s D and Fu’s Fs indices may also indicate selection and
genetic hitchhiking associated with selective sweeps. These
analyses were conducted for all genes.
A coalescent-based graphical method, the Extended
Bayesian Skyline Plot (EBSP) was carried out in BEAST v.
2.1.3 (Drummond and Rambaut 2007) for both populations
independently and pooled together to infer potential his-
torical fluctuations in effective population size (Ne). The
EBSP allows simultaneous analysis of data from multiple
unlinked loci, taking into account their specific mode of
inheritance, thus significantly improving the reliability of
demographic inferences over single-locus analyses (Heled
and Drummond 2008; Shapiro and Ho 2011). EBSP anal-
ysis was run using strict clock models as it is considered a
good approximation for intra-population level analyses,
and it simplifies the coalescent model, helping conver-
gence. Per lineage mutation rate (mu) was calculated by
using l = dxy/2T (Nei 1987), where dxy stands for inter-
lineage divergence and T is the divergence time since two
unique lineages diverged (See Supplementary Table 3).
For concatenated mtDNA, dxy = 1.89 9 10-8 s/s/y (sub-
stitution/site/years) (Weir and Schluter 2008) and for
nuclear introns dxy = 3.6 9 10-9 s/s/y (Axelsson et al.
2004); All analyses were run three times to check for
convergence with 7 9 107 generations, and sampling every
2 9 103 generations. The first 30 % of the genealogies
were discarded as burn-in. Convergence, stationarity,
effective sample size for each parameter of interest and the
appropiate burn-in were evaluated using the software
TRACER v.1.6 (Rambaut et al. 2014). The uncorrected
median population size obtained by EBSP, which is the
product Neg where Ne is the effective population size and
g generation time (expressed in the same units as the
divergence times) was rescaled and expressed as Ne by
dividing by g (Drummond and Bouckaert 2015). A gen-
eration time of 20 years as indicated by (Gangloff et al.
2013) was used to rescale the uncorrected population size.
Estimation of gene flow and population connectivity
Patterns of historical and contemporary connectivity
between the two subspecies were disentangled through a
coalescent inference using the Isolation with Migration
under Changing Population Size model (IM) (Hey and
Nielsen 2004; Hey 2005). The following parameters were
calculated between leucoptera and caledonica: effective
population sizes (Ne caledonica; Ne leucoptera; Ne
ancestral), population divergence time (T), the splitting
parameter (S) allowing for population size change through
time, and migration rates (M1, M2), where M1 indicates the
probability of migration per generation migrating from
caledonica to leucoptera forwards in time, and M2 indi-
cates migration in the other direction. Concatenated
mtDNA and multilocus nuclear DNA were used both
jointly and separately to perform the IM analysis. Several
preliminary runs were conducted to optimize priors
(looking for posterior density curves that rise from zero,
peak and then fall to zero within the range for each of the
required demographic parameters) following Hey 2009.
The final analysis was carried out with the HKY mutation
model (Hasegawa et al. 1985) for both nuclear introns and
mtDNA, a geometric heating scheme (g1 = 0.96 and
g2 = 0.9), 10 chains, and a chain length of 2 million steps
following a 1 million step burn-in. To assess convergence,
three separate runs were conducted with different random
seed numbers. Effective sample size (ESS) values were
monitored to ensure proper mixing of the Markov chain. To
convert raw parameter estimates into demographic values,
we used the per-locus mutation rates (substitution/year)
obtained by multiplying per lineage mutation rate (as used
in EBSP) by the number of base pairs of each sequence.
The geometric mean of the per-locus mutation rates (l)
was calculated and then used to compute the divergence
time by using T = t/l, expressed in years before present (t,
is the maximum likelihood estimate of the parameter T).
To calculate effective population size (Ne), we used
Ne = h/(4G l), with a generation time (G) of 20 years
(Gangloff et al. 2013). To estimate the population migra-
tion rate (M), we used 2NeM = Nem/2, where m stands for
the maximum likelihood estimate of the parameter M. The
number of migrants from the ancestral to the leucoptera
population was calculated as (1-s)ha (where (1-s) rep-
resents the size of the P. leucoptera population and ha
108 Conserv Genet (2017) 18:105–115
123

stands for the effective size of the ancestral population
(Hey 2005).
As the divergence time obtained with IM was unreliable
(Supplementary Table 5; Fig. 1), we also used *Beast
(Heled and Drummond 2010), implemented in BEAST
v.1.6.1 (Drummond and Rambaut 2007), which provides
simultaneously phylogenies and divergence time estimates.
To root the tree four related species were used as out-
groups, two of them, P. brevipes and P. oculta, were
amplified and sequenced in this study while sequences
from P. feae and P. madeira were obtained from GeneBank
(Supplementary Table 4). Three runs of 5 9 107 genera-
tions, sampling every 1000 generations with a burn in of
2000 trees were performed and then combined in
LogCombiner v.1.6.1 (Heled and Drummond 2010). HKY
nucleotide substitution model and a strict clock model with
an uncorrelated lognormal distribution were used. Per lin-
eage mutation rate of 4.87 9 10-3 s/s/My was used. For
the species tree, a Yule process speciation under a coa-
lescent model assuming a constant population over the time
period was chosen. Finally, Tracer v.1.6 (Drummond and
Rambaut 2007) was used to visualize the results of the runs
and to check the effective sample size of each parameter.
Results
We sequenced 1327 base pairs for concatenated CO1 and
Cytb (see Table 1 for exact numbers of individuals
sequenced for each gene) and 500, 481, 924, 637, and 452
base pairs for the introns PAXIPI, CSDE1, bfibint7,
IRF2F1 and TPM1 respectively. Of the five nuclear introns,
Bfibint7 was the only one presenting signals of recombi-
nation, so we kept the longest possible contiguous unre-
combined sequence (918 base pairs) for subsequent
analyses. As TPM1 did not present any variation, it was
withdrawn from any further analysis. The concatenated
mtDNA data did not display insertions or deletions, and
after translation, no nonsense or stop codons were found.
No ambiguous sites were detected, and true mitochondrial
origin of obtained sequences was therefore very likely.
DNA was amplified with specific primers designed for
Pterodroma species (Primmer et al. 2002; Kimball et al.
2009; Jesus et al. 2009; Gangloff et al. 2013) rather than
universal primers, which is supposed to reduce the risk of
the coamplification of nuclear copies of mitochondrial
genes (numts) amplification (Sorenson and Quinn 1998;
Ibarguchi et al. 2006).
Table 1 Diversity indices and
results of tests for deviations
from neutrality for two
subspecies of Pterodroma
leucoptera
Gene Subspecies N Np Nh ph Diversity indices Neutrality tests
Hd [SD (910-2)] p % (SD) Tajima’s D Fu’s Fs
CO1-Cytb
caledonica 17 13 11 9 0.93 (0.05) 0.16 (0.09) -1.04 25.19
leucoptera 20 7 8 6 0.79 (0.07) 0.063 (0.05) -1.40 24.46
PAXIPI
caledonica 26 2 4 2 0.28 (7.0) 0.04 (0.06) -0.64 -2.12
leucoptera 56 5 7 5 0.21 (5.2) 0.05 (0.06) 21.41 25.81
CSDE1
caledonica 16 10 8 6 0.68 (5.6) 0.08 0.06) 21.62 23.08
leucoptera 50 5 5 3 0.38(5.0) 0.03 (0.03) -1.16 -1.83
bfibint7
caledonica 15 19 17 13 0.88 (5.1) 0.09 (0.06) 21.87 212.9
leucoptera 35 7 8 4 0.56 (4.8) 0.031 (0.03) -1.25 23.91
IRF2F1
caledonica 26 4 5 3 0.68 (6.0) 0.25 (0.18) 0.47 -0.24
leucoptera 45 3 3 1 0.46 (6.0) 0.19 (0.15) 0.86 1.89
TPM1
caledonica 15 0 1 0 0 0
leucoptera 18 0 1 0 0 0
Number of individuals sequenced (N), number of polymorphic sites (Np); number of haplotypes (Nh);
number of private haplotypes (ph); haplotype diversity (Hd), nucleotide diversity (p, in %), average number
of nucleotide differences between haplotypes (K). Significant values for tests of neutrality: p\ 0.05 for
Tajima’s D and p\ 0.02 for Fu’s Fs are shown in bold
Conserv Genet (2017) 18:105–115 109
123

Molecular variability
Concatenated mitochondrial data contained 18 polymor-
phic sites with a total of 17 different haplotypes (13 for
caledonica and 7 for leucoptera; Table 1). Nuclear data
exhibited a total of 55 variable sites (7 in PAXIP1, 15 in
CSDE1, 26 in bfibint7 and 7 in IRF2F1), leading to 7, 9, 17
and 4 haplotypes respectively (after phasing the nuclear
intron sequences). Haplotype and nucleotide diversities
tended to be lower in leucoptera than in caledonica
(Table 1).
Population structure and evolutionary relationships
Pairwise single locus estimates of population (subspecies)
differentiation for mtDNA and nuDNA were low but sig-
nificantly different from 0 between the two subspecies
taken together (p\ 0.05 for all global mtDNA and nuDNA
except PAXIPI (p[ 0.05) (Supplementary Table 2).
Indeed, [90 % of genetic variation was detected at the
intra-population level for all loci. No pronounced phylo-
geographic structure could be detected in the haplotype
networks, either for mitochondrial or nuclear markers
(Fig. 2). Indeed, all networks were characterized by one or
more dominant haplotypes shared by the two subspecies.
Similarly, most networks showed star-like topologies, with
one central prevalent haplotype, and other haplotypes
having much lower frequencies, suggesting possible past
and rapid population expansion (Slatkin and Hudson 1991;
Kulikova et al. 2005). Pterodroma l. caledonica showed a
higher number of private haplotypes despite a lower sam-
ple size (Table 1; Fig. 2).
Past population history
Most estimates of Tajima’s D and Fu’s Fs were negative,
suggesting a recent population expansion for either cale-
donica or leucoptera (see Table 1 for all values and asso-
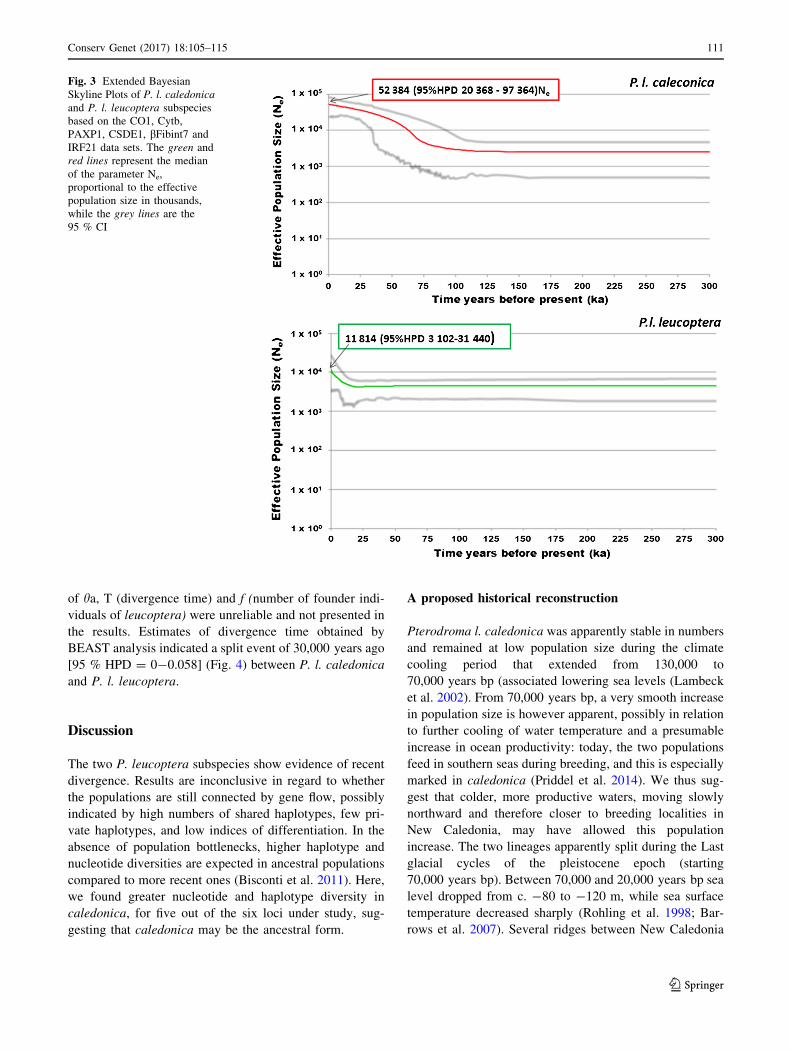
ciated statistics). Reconstruction of the population size
history by means of EBSP suggested an expansion episode
for both caledonica and leucoptera (Fig. 3). EBSP further
underlined an earlier population increase in caledonica (c.
60,000 years bp) than in leucoptera (c. 15,000 years bp).
Estimation of gene flow and population connectivity
Migration rates, divergence time and present effective
population sizes were obtained with IM analysis only for
the two mitochondrial loci since our data failed to find
convergence when using all loci. Posterior density curves
were acceptable (see Hey 2007) for all but three parameters
(Supplementary Table 5; Fig. 2), and therefore, estimates
Fig. 2 Haplotype networks obtained with concatenated mtDNA CO1
and Cytb genes, and five nuclear introns, PAXIP1, bFibint7, CSDE1
and IRF21 within Pterodroma leucoptera (TPM1 not shown since
there was no variation). Node sizes are proportional to number of
individuals found with that haplotype, while color codes refer to
sampling site (see Fig. 1 for sample site locations). Polygons
correspond to intermediate (non-sampled) haplotypes. Branch lengths
are not scale to improve visualization. Numbers on branches show the
number of mutations between alleles. When no number is indicated,
only one mutation step occurred
110 Conserv Genet (2017) 18:105–115
123
of ha, T (divergence time) and f (number of founder indi-
viduals of leucoptera) were unreliable and not presented in
the results. Estimates of divergence time obtained by
BEAST analysis indicated a split event of 30,000 years ago
[95 % HPD = 0-0.058] (Fig. 4) between P. l. caledonica
and P. l. leucoptera.
Discussion
The two P. leucoptera subspecies show evidence of recent
divergence. Results are inconclusive in regard to whether
the populations are still connected by gene flow, possibly
indicated by high numbers of shared haplotypes, few pri-
vate haplotypes, and low indices of differentiation. In the
absence of population bottlenecks, higher haplotype and
nucleotide diversities are expected in ancestral populations
compared to more recent ones (Bisconti et al. 2011). Here,
we found greater nucleotide and haplotype diversity in
caledonica, for five out of the six loci under study, sug-
gesting that caledonica may be the ancestral form.
A proposed historical reconstruction
Pterodroma l. caledonica was apparently stable in numbers
and remained at low population size during the climate
cooling period that extended from 130,000 to
70,000 years bp (associated lowering sea levels (Lambeck
et al. 2002). From 70,000 years bp, a very smooth increase
in population size is however apparent, possibly in relation
to further cooling of water temperature and a presumable
increase in ocean productivity: today, the two populations
feed in southern seas during breeding, and this is especially
marked in caledonica (Priddel et al. 2014). We thus sug-
gest that colder, more productive waters, moving slowly
northward and therefore closer to breeding localities in
New Caledonia, may have allowed this population
increase. The two lineages apparently split during the Last
glacial cycles of the pleistocene epoch (starting
70,000 years bp). Between 70,000 and 20,000 years bp sea
level dropped from c. -80 to -120 m, while sea surface
temperature decreased sharply (Rohling et al. 1998; Bar-
rows et al. 2007). Several ridges between New Caledonia
Fig. 3 Extended Bayesian
Skyline Plots of P. l. caledonica
and P. l. leucoptera subspecies
based on the CO1, Cytb,
PAXP1, CSDE1, bFibint7 and
IRF21 data sets. The green and
red lines represent the median
of the parameter Ne,
proportional to the effective
population size in thousands,
while the grey lines are the
95 % CI
Conserv Genet (2017) 18:105–115 111
123

and Australia, currently underwater (e.g. Chesterfield
Ridge; Fig. 1), were presumably above sea level, providing
many lowland islets. P. l. caledonica may have colonized
one or several islets halfway between New Caledonia and
Australia at this time (see Fig. 1). Divergence hypotheti-
cally occurred between the populations, leading to the
leucoptera lineage. Interestingly, these new islands were
lowland islets, a character now found in the breeding
habitat of leucoptera. Around 18,000 years bp, sea level
and sea surface temperatures started to rise. Breeding sites
became unavailable for leucoptera and the population then
presumably colonized or survived only on the few islands
off the Australian coast, where they are breeding today.
This proposed historical scenario, however, relies on an
accurate estimate of time of divergence as well as popu-
lation size estimates. However, our IM simulations did not
fully converge for parameters such as divergence time and
long-term effective size. Indeed similar lack of conver-
gence was already found in other petrel studies (Welch
et al. 2011), with the posterior distribution of the curves
showing two distinct peaks, hence very wide HPD. Low
resolution in parameter estimates with IM can result from
sensitivity to inadequate sampling of target populations
(Jacobsen and Omland 2012) since parameter estimates
will also depend on the level of gene flow between
unsampled populations. Besides, low numbers of loci
coverage was suggested to promote failure convergence of
the IM parameters estimates (Hey 2005; Jacobsen and
Omland 2012). In our study we also used multi locus
coalescence-based approaches implemented in EBSP and
*BEAST rather than concatenated sequences analysis
(Degnan and Rosenberg 2006; Kubatko and Degnan 2007),
the latter accounting for discrepancies between gene and
species trees history when studying closely related species
(Zink and Barrowclough 2008). Indeed *BEAST accepts
shared polymorphisms originated from incomplete lineage
sorting but excludes introgression, treating the latter by
conducting separate analyses for each marker (Heled and
Drummond 2010; Drummond and Bouckaert 2015; Meyer
et al. 2016). To conclude, polyphyly and dissimilarities in
gene tree topologies were expected since we analysed
closely related species or subspecies, as was appointed by
Maddison and Knowles 2006.
The accuracy of estimates of divergence times based on
evolutionary substitution rates is also increasingly debated
(Garcia-Moreno 2004; Lovette 2004; Ho et al. 2007; Sha-
piro and Ho 2011), since they are affected by base com-
position, calibration point sensitivity, generation time,
metabolic rates and population size (Lovette 2004; Ho
et al. 2005). For instance, Nunn and Stanley 1998 used a
calibration point older than 12 Myr, causing saturation of
mutations in their cytb sequences and consequently
underestimating sequence divergence. It is indeed recom-
mended to use calibrations derived from lineages as close
as possible to the organism under study (Lovette 2004;
Peterson 2006). For these reasons, we used the interlineage
molecular rate derived from (Weir and Schluter 2008) and
converted it to a per lineage mutation rate. There was some
Fig. 4 *Beast tree using two mitochondrial genes (concatenated CO1
and Cytb) and four nuclear intron (PAXIP1, CSDE1, bfibint7,
IRF2F1) showing simultaneously the phylogeny and divergence time
of P. l. caledonica and P. l. leucoptera sub-species under a relaxed
clock assumption. The divergence times expressed in Million years
are displayed at each node. Purple bars represent the 95 %HPD
interval of the node ages. Numbers on branches represent the posterior
probability of each clade
112 Conserv Genet (2017) 18:105–115
123
discrepancy between our estimate of *30,000 years bp
divergence time as obtained with BEAST and the fact that
IM analysis suggested that one of the taxon started to
increase in size earlier, 60,000 years bp in caledonica. It
should however be noted that both estimates stay within
respective confidence intervals, so discrepancy may result
from large uncertainty in estimated times.
Contemporary differentiation and taxonomic
consequences
These two populations are currently classified as separate
subspecies based on slight morphological and color dif-
ferentiation (Imber and Jenkins 1981). Some researchers
even suggested species status (e.g. Onley and Scofield
(2007) despite strong overlap in measurements and col-
oration (Bretagnolle and Shirihai 2010). Our haplotype
networks, based on seven loci including both nuclear
introns and mitochondrial DNA, revealed very low popu-
lation differentiation between the two taxa based on UST
statistics (mitochondrial UST = 0.01, nuclear UST ranging
0.0049–0.0876) and no phylogeographic differentiation in
haplotype networks. Several petrel studies have now used
both nuclear and mtDNA, revealing, in general, greater
resolution in mitochondrial loci and deeper levels of
genetic divergence than for nuclear loci (Silva et al. 2011;
Welch et al. 2011; Gangloff et al. 2012; Silva et al. 2015).
Unlike other petrels (Ovenden et al. 1991; Friesen et al.
2006), our two taxa showed few locally restricted haplo-
types. Conversely, these populations differ in their breed-
ing as well as non-breeding ecology (Priddel et al. 2014).
Differences in ecological traits despite similarity at neutral
molecular markers and few locally restricted haplotypes
may suggest recent divergence with on-going gene flow
between caledonica and leucoptera, with lineages currently
unsorted but likely in the process of divergence, rather than
a remnant of a large ancestral population.
Conservation implications
Conservation management should target demographically
independent populations whose population dynamics
depend largely on local birth and death rates rather than on
migration (Palsbøll et al. 2007). Conservation genetics can
help decide whether subspecies or populations within a
species should be managed as separate units (Moritz 2002).
Furthermore, independently evolving populations are argu-
ably worth conserving even if they are not different species
or taxa (Tobias et al. 2010). The present study provides an
interesting case, where neutral molecular markers failed to
find strong differences between two populations that are
traditionally considered separate conservation units given
their different ecological requirements and breeding
habitats. In addition, these populations currently have dif-
ferent potential fates: leucoptera shows a very small but
increasing breeding population on safe islands, while cale-
donica shows a much bigger but currently declining popu-
lation on an unsafe island where predation by invasive
species occurs. Overall, Pterodroma leucoptera is consid-
ered vulnerable (Birdlife International 2015). Given differ-
ences in ecology and conservation status, and despite the
weak neutral genetic and morphological differentiation, we
thus recommend that both populations should be protected to
preserve the evolutionary potential of these lineages. In
particular, as a source of variability able to maintain the
genetic diversity of this species, taxon caledonica warrants
more conservation effort.
Acknowledgments The authors would like to thank T.P. Birt for
alignment advice and primer dessign. We also thank to the Genome
Quebec Innovation Centre (McGill University Montreal, QC, Canada)
for facilitating part of the sequencing of this work. We are also
grateful to A. Gotscho and S.P. Tseng for discussions that improved
the IM and EBSP analyses. For field work in New Caledonia, VB
thanks I. Brun, M. Pandolfi and especially L. Renaudet and P. Villard.
We thank A. Welch who helped to improve the manuscript, and P.
Duncan for English corrections on a first draft. Thanks also go to the
editors and referees for commenting on and correcting the manuscript.
We also thank M. Guichard and E. Pante who provided critical
assistance with the SuperMachine YMIR- Universite de la Rochelle.
Finally this work was supported by the Region Poitou–Charentes and
Deux-Sevres department, who funded AI-V PHD grant.
Authors contributions VB, DP and NC collected the samples. VB,
BG and AI-V conceived the research. SR, CR, BG and AI-V per-
formed the laboratory work. AI-V analyzed the data, with the help of
AC and BG. AI-V and VB wrote the manuscript. All the authors read
and approved the final manuscript.
References
Allendorf FW, Luikart G (2009) Conservation and the genetics of
populations. Wiley
Armstrong PH (1992) Human impacts on Australia’s Indian ocean
tropical island ecosystems: a review. Environmentalist 12:
191–206
Axelsson E, Smith NGC, Sundstrom H et al (2004) Male-biased
mutation rate and divergence in autosomal, z-linked and
w-linked introns of chicken and Turkey. Mol Biol Evol 21:
1538–1547
Bandelt HJ, Forster P, Rohl A (1999) Median-joining networks for
inferring intraspecific phylogenies. Mol Biol Evol 16:37–48
Barrows TT, Juggins S, De Deckker P et al (2007) Long-term sea
surface temperature and climate change in the Australian-New
Zealand region. Paleoceanography 22:1–17
Beerli P, Felsenstein J (1999) Maximum-likelihood estimation of
migration rates and effective population numbers in two
populations using a coalescent approach. Genetics 152:763–773
Birdlife International (2015) Species fact sheet: Pterodroma leu-
coptera. http://www.birdlife.org/datazone/speciesfactsheet.php?
id=3887
Bisconti R, Canestrelli D, Colangelo P, Nascetti G (2011) Multiple
lines of evidence for demographic and range expansion of a
Conserv Genet (2017) 18:105–115 113
123

temperate species (Hyla sarda) during the last glaciation. Mol
Ecol 20:5313–5327
Bretagnolle V, Shirihai H (2010) A new taxon of collared petrel
pterodroma brevipes from the Banks Islands. Vanuatu
130:286–301
Brown RP, Tejangkura T, El Mouden EH et al (2012) Species
delimitation and digit number in a North African skink. Ecol
Evol 2:2962–2973
Burg TM, Croxall JP (2001) Global relationships amongst black-
browed and grey-headed albatrosses: analysis of population
structure using mitochondrial DNA and microsatellites. Mol
Ecol 10:2647–2660
Carlile N, Priddel D, Zino F et al (2003) A review of four successful
recovery programmes for threatened sub-tropical petrels. Mar
Ornithol 31:185–192
Caughley G (1994) Directions in conservation biology. J Anim Ecol
63:215–244
Cheang CC, Tsang LM, Ng WC et al (2012) Phylogeography of the
cold-water barnacle chthamalus challengeri in the north-western
pacific: effect of past population expansion and contemporary
gene flow. J Biogeogr 39:1819–1835
Chiucchi JE, Gibbs HL (2010) Similarity of contemporary and
historical gene flow among highly fragmented populations of an
endangered rattlesnake. Mol Ecol 19:5345–5358
Dearborn DC, Anders AD, Schreiber EA et al (2003) Inter-island
movements and population differentiation in a pelagic seabird.
Mol Ecol 12:2835–2843
Degnan JH, Rosenberg NA (2006) Discordance of species trees with
their most likely gene trees. PLoS Genet 2:e68
Dobson FS, Jouventin P (2007) How slow breeding can be selected
in seabirds: testing lack’s hypothesis. Proc R Soc B 274:
275–279
Drummond A, Bouckaert R (2015) Bayesian evolutionary analysis
with BEAST. Cambridge University press, Cambridge
Drummond AJ, Rambaut A (2007) BEAST: bayesian evolutionary
analysis by sampling trees. BMC Evol Biol 7:214
Excoffier L, Lischer HEL (2010) Arlequin suite ver 3.5: a new series
of programs to perform population genetics analyses under linux
and windows. Mol Ecol Resour 10:564–567
Excoffier L, Smouse PE, Quattro JM (1992) Analysis of molecular
variance inferred from metric distances among DNA haplotypes:
application to human mitochondrial DNA restriction data.
Genetics 131:479–491
Frankham R, Briscoe DA, Ballou JD (2002) Introduction to conser-
vation genetics. Cambridge University Press
Friesen VL, Gonzalez JA, Cruz-Delgado F (2006) Population genetic
structure and conservation of the Galapagos petrel (Pterodroma
phaeopygia). Conserv Genet 7:105–115
Fu YX (1997) Statistical tests of neutrality of mutations against
population growth, hitchhiking and background selection.
Genetics 14:915–925
Gangloff B, Shirihai H, Watling D et al (2012) The complete
phylogeny of Pseudobulweria, the most endangered seabird
genus: systematics, species status and conservation implications.
Conserv Genet 13:39–52
Gangloff B, Zino F, Shirihai H et al (2013) The evolution of north-
east Atlantic gadfly petrels using statistical phylogeography. Mol
Ecol 22:495–507
Garcia-Moreno J (2004) Is there a universal molecular clock for
birds? J Avian Biol 35:465–468
Gomez-Dıaz E, Gonzalez-Solıs J, Peinado MA, Page RDM (2006)
Phylogeography of the Calonectris shearwaters using molecular
and morphometric data. Mol Phylogenet Evol 41:322–332
Gould J (1865) Handbook to the birds of Australia, vol Vol 1.
Cambridge University, London
Hall T (1999) BioEdit: a user-friendly biological sequence alignment
editor and analysis program for Windows 95/98/NT. Nucleic
Acids Symp Ser 41:95–98
Hasegawa M, Kishino H, Yano TA (1985) Dating of the human-ape
splitting by a molecular clock of mitochondrial DNA. J Mol Evol
22:160–174
Heled J, Drummond AJ (2008) Bayesian inference of population size
history from multiple loci. BMC Evol Biol 15:1–15
Heled J, Drummond AJ (2010) Bayesian inference of species trees
from multilocus data. Mol Biol Evol 27:570–580
Henriques R, Potts WM, Santos CV et al (2014) Population
connectivity and phylogeography of a coastal fish, Atractoscion
aequidens (Sciaenidae), across the Benguela current region:
evidence of an ancient vicariant event. PLoS One 9:e87907
Hey J (2005) On the number of new world founders: a population
genetic portrait of the peopling of the Americas. PLoS Biol
3:0965–0975
Hey J. (2007). Introduction to the IM and IMa computer programs.
http://lifesci.rutgers.edu/*heylab/Programsand-Data/Programs/
IM
Hey J (2009) Using IM documentation. https://bio.cst.temple.edu/
*hey/software/software.htm
Hey J, Nielsen R (2004) Multilocus methods for estimating popula-
tion sizes, migration rates and divergence time, with applications
to the divergence of Drosophila pseudoobscura and D. persim-
ilis. Genetics 167:747–760
Ho SYW, Phillips MJ, Cooper A, Drummond AJ (2005) Time
dependency of molecular rate estimates and systematic overes-
timation of recent divergence times. Mol Biol Evol
22:1561–1568
Ho SYW, Heupink TH, Rambaut A, Shapiro B (2007) Bayesian
estimation of sequence damage in ancient DNA. Mol Biol Evol
24:1416–1422
Hudson RR, Kaplan NL (1985) Statistical properties of the number of
recombination events in the history of a sample of DNA
sequences. Genetics 111:147–164
Huyvaert K, Anderson D (2004) Limited dispersal by Nazca boobies
Sula granti. J Avian Biol 35:46–53
Ibarguchi G, Friesen VL, Lougheed SC (2006) Defeating numts:
Semi-pure mitochondrial DNA from eggs and simple purifica-
tion methods for field-collected wildlife tissues. Genome
49(11):1438–1450
Illera JC, Rando JC, Richardson DS, Emerson BC (2012) Age, origins
and extinctions of the avifauna of Macaronesia: a synthesis of
phylogenetic and fossil information. Quat Sci Rev 50:14–22
Imber MJ, Jenkins JAF (1981) The New Caledonian Petrel. Depart-
ment of Internal Affaires
IUCN (2015) The IUCN Red List of Threatened Species. Version
2015.1. http://www.iucnredlist.org. Downloaded on 1 Feb 2015
Jacobsen F, Omland KE (2012) Extensive introgressive hybridization
within the northern oriole group (genus icterus) revealed by
three-species isolation with migration analysis. Ecol Evol
2:2413–2429
Jesus J, Menezes D, Gomes S et al (2009) Phylogenetic relationships
of gadfly petrels Pterodroma spp. from the Northeastern Atlantic
Ocean: molecular evidence for specific status of Bugio and Cape
Verde petrels and implications for conservation. Bird Conserv
Int 19(3):199–214
Kimball RT, Braun EL, Barker FK et al (2009) A well-tested set of
primers to amplify regions spread across the avian genome. Mol
Phylogenet Evol 50:654–660
Kingman JFC (1982) The coalescent. Stoch Process Appl 13:235–248
Kubatko LS, Degnan JH (2007) Inconsistency of phylogenetic
estimates from concatenated data under coalescence. Syst Biol
56:17–24
114 Conserv Genet (2017) 18:105–115
123
Kulikova IV, Drovetski SV, Gibson DD et al (2005) Phylogeography
of the Mallard (Anas Platyrhynchos): hybridization, dispersal,
and lineage sorting contribute to complex geographic structure.
Auk 122:949–965
Lambeck K, Esat TM, Potter E-K (2002) Links between climate and
sea levels for the past three million years. Nature 419:199–206
Lande R (1998) Anthropogenic, ecological and genetic factors in
extinction and conservation. Res. Popul. Ecol. (Kyoto) 40:
259–269
Librado P, Rozas J (2009) DnaSP v5: a software for comprehensive
analysis of DNA polymorphism data. Bioinformatics 25:1451–1452
Lovette I (2004) Mitochondrial dating and mixed support for the ‘‘2%
rule’’ in birds. Auk 121:1–6
Maddison WP, Knowles LL (2006) Inferring phylogeny despite
incomplete lineage sorting. Syst Biol 55:21–30
Mareile Techow N, Ryan P, O’Ryan C (2009) Phylogeography and
taxonomy of white-chinned and spectacled petrels. Mol Phylo-
genet Evol 52:25–33
Meyer BS, Matschiner M, Salzburger W (2016) Disentangling
incomplete lineage sorting and introgression to refine species-
tree estimates for Lake Tanganyika cichlid fishes. BioRxiv.
doi:10.1093/sysbio/syw069
Miller B, Mullette KJ (1985) Rehabilitation of an endangered
Australian bird: the Lord Howe Island woodhen Tricholimnas
sylvestris (Sclater). Biol Conserv 34:55–95
Moritz C (2002) Strategies to protect biological diversity and the
evolutionary. Syst Biol 51:238–254
Naurois R, Rancurel P (1978) Observations nouvelles sur les Laridae
reproducteurs en Nouvelle-Caledonie. Sci Nat 287:495–498
Nei M (1987) Molecular evolutionary genetics. Columbia University
Press, New York
Nei M, Tajima F (1983) Maximum likelihood estimation of the
number of nucleotide substitutions from restriction sites data.
Genetics 105:207–217
Nunn G, Stanley S (1998) Corrigendum for: body size effects and
rates of cytochrome-b evolution in tube-nosed seabirds. Mol Biol
Evol 17:1774
Onley D, Scofield P (2007) Field Guide to the albatrosses. petrels and
shearwaters of the World Christopher Helm Publishers Ltd
Ovenden J, Wust-Saucy A, Bywater R et al (1991) Genetic evidence
for philopatry in a colonially nesting seabird, the Fairy Prion
(Pachyptila turtur). Auk 108:688–694
Palsbøll PJ, Berube M, Allendorf FW (2007) Identification of
management units using population genetic data. Trends Ecol
Evol 22:11–16
Peterson AT (2006) Application of molecular clocks in ornithology
revisited. J Avian Biol 37:541–544
Pielou E (2008) After the ice age: the return of life to glaciated North
America. University of Chicago Press, Chicago
Priddel D, Carlile N (1995) Mortality of adult Gould’s petrels
Pterodroma leucoptera leucoptera at the nesting site on Cabbage
Tree Island, New South Wales. Emu 95:259–264
Priddel D, Carlile N (2009) Key elements in achieving a successful
recovery programme: a discussion illustrated by the Gould’s
Petrel case study. Ecol Manag Restor 10:97–102
Priddel D, Carlile N, Portelli D et al (2014) Pelagic distribution of
Gould’s petrel (Pterodroma leucoptera): linking shipboard and
onshore observations with remote-tracking data. Emu 114(4):
360–370
Primmer CR, Borge T, Lindell J, Sætre GP (2002) Single-nucleotide
polymorphism characterization in species with limited available
sequence information: high nucleotide diversity revealed in the
avian genome. Mol Ecol 11:603–612
Rabouam C, Thibault J, Bretagnolle V (1998) Natal philopatry and
close inbreeding in Cory’s shearwater (Calonectris diomedea).
Auk 115:483–486
Rambaut A, Suchard M, Xie D, Drummond A (2014) Tracer v1.6.
Available from http://beast.bio.ed.ac.uk/Tracer
Rocha S, Harris DJ, Posada D (2011) Cryptic diversity within the
endemic prehensile-tailed gecko Urocotyledon inexpectata
across the Seychelles Islands: patterns of phylogeographical
structure and isolation at the multilocus level. Biol J Linn Soc
104:177–191
Rohling EJ, Fenton M, Jorinsen FJ et al (1998) Magnitudes of sea-
level lowstands of the past 500,000 years. Nature 394(6689):
162–165
Shaffer SA, Tremblay Y, Weimerskirch H et al (2006) Migratory
shearwaters integrate oceanic resources across the Pacific Ocean
in an endless summer. Proc Natl Acad Sci USA 103:12799–
12802
Shapiro B, Ho S (2011) Skyline-plot methods for estimating
demographic history from nucleotide sequences. Mol Ecol
Resour 11(3):423–434
Silva MC, Duarte MA, Coelho MM (2011) Anonymous nuclear loci
in the white-faced storm-petrel Pelagodroma marina and their
applicability to other Procellariiform seabirds. J Hered
102:362–365
Silva MC, Matias R, Wanless RM et al (2015) Understanding the
mechanisms of anti-tropical divergence in the seabird white-
faced Storm-petrel (Procellariiformes: pelagodroma marina)
using a multi-locus approach. Mol Ecol 24:3122–3137
Slatkin M, Hudson RR (1991) Pairwise comparisons of mitochondrial
DNA sequences in stable and exponentially growing popula-
tions. Genetics 129:555–562
Sorenson MD, Quinn TW (1998) Numts: a challenge for avian
systematics and population biology. Auk 115:214–221
Steadman DW (2006) Extinction and biogeography of tropical Pacific
birds. University of Chicago Press
Stephens M, Smith NJ, Donnelly P (2001) A new statistical method
for haplotype reconstruction from population data. Am J Hum
Genet 68:978–989
Tajima F (1989) The effect of change in population size on DNA
polymorphism. Genetics 123:597–601
Techow NM, Ryan PG, O’Ryan C (2009) Phylogeography and
taxonomy of white-chinned and Spectacled Petrels. Mol Phylo-
genet Evol 52:25–33
Techow NMSM, O’Ryan C, Phillips RA et al (2010) Speciation and
phylogeography of giant petrels Macronectes. Mol Phylogenet
Evol 54:472–487
Thompson JD, Gibson TJ, Plewniak F et al (1997) The CLUSTAL X
windows interface: flexible strategies for multiple sequence
alignment aided by quality analysis tools. Nucleic Acids Res
25:4876–4882
Tobias JA, Seddon N, Spottiswoode CN et al (2010) Quantitative
criteria for species delimitation. Ibis 152(4):724–746
van Bekkum M, Sagar PM, Stahl J-C, Chambers GK (2006) Natal
philopatry does not lead to population genetic differentiation in
Buller’s albatross (Thalassarche bulleri bulleri). Mol Ecol
15:73–79
Weir JT, Schluter D (2008) Calibrating the avian molecular clock.
Mol Ecol 17:2321–2328
Welch AJ, Yoshida AA, Fleischer RC (2011) Mitochondrial and
nuclear DNA sequences reveal recent divergence in morpholog-
ically indistinguishable petrels. Mol Ecol 20:1364–1377
Zielinski P, Nadachowska-Brzyska K, Wielstra B et al (2013) No
evidence for nuclear introgression despite complete mtDNA
replacement in the Carpathian newt (Lissotriton montandoni).
Mol Ecol 22:1884–1903
Zink RM, Barrowclough GF (2008) Mitochondrial DNA under siege
in avian phylogeography. Mol Ecol 17:2107–2121
Conserv Genet (2017) 18:105–115 115
123