population dynamics chapters 3 and 4 apes. questions to ask yourself… why do some populations grow...
TRANSCRIPT

POPULATION DYNAMICS
Chapters 3 and 4
APES
Questions to Ask Yourself…
• Why do some populations grow to enormous size while other do not?
• What causes abrupt population increases or decreases?
• How many individuals does it take to make a viable population?
• What roles do competition, genetic diversity, and ecological adaptations play in maintaining or reducing wild species?
Determining Population Size
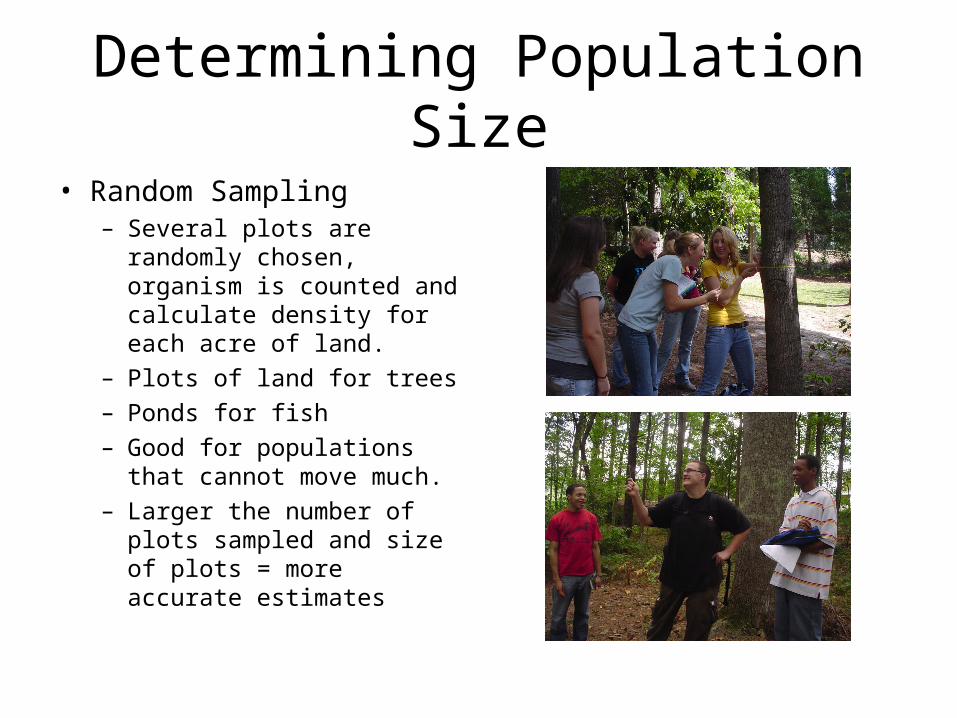
• Random Sampling– Several plots are randomly
chosen, organism is counted and calculate density for each acre of land.
– Plots of land for trees – Ponds for fish– Good for populations that
cannot move much.– Larger the number of plots
sampled and size of plots = more accurate estimates
Determining Population Size
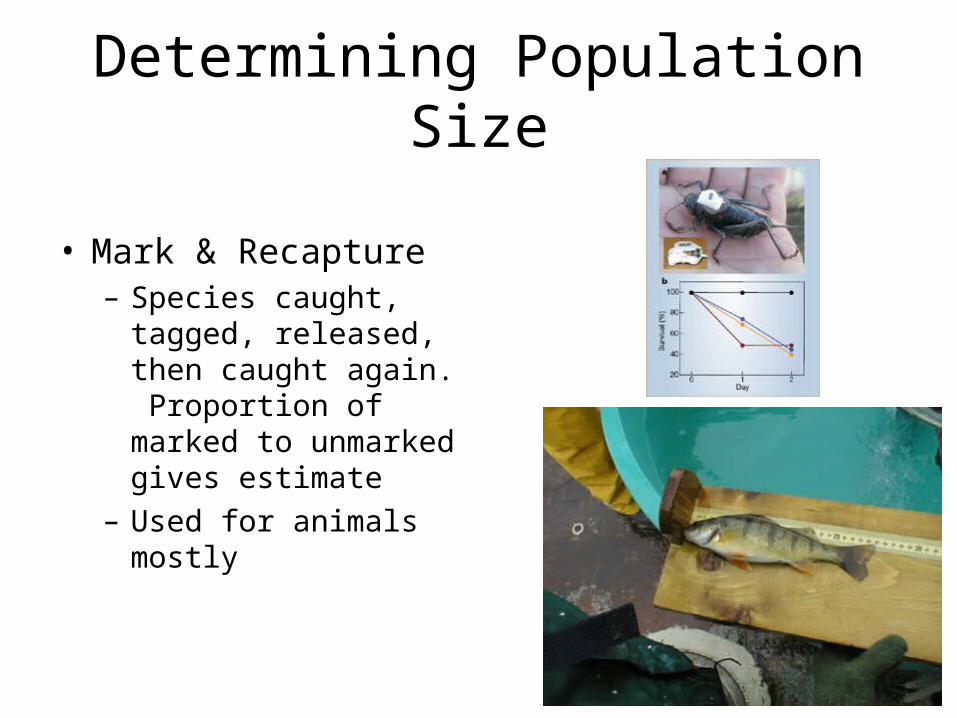
• Mark & Recapture– Species caught,
tagged, released, then caught again. Proportion of marked to unmarked gives estimate
– Used for animals mostly
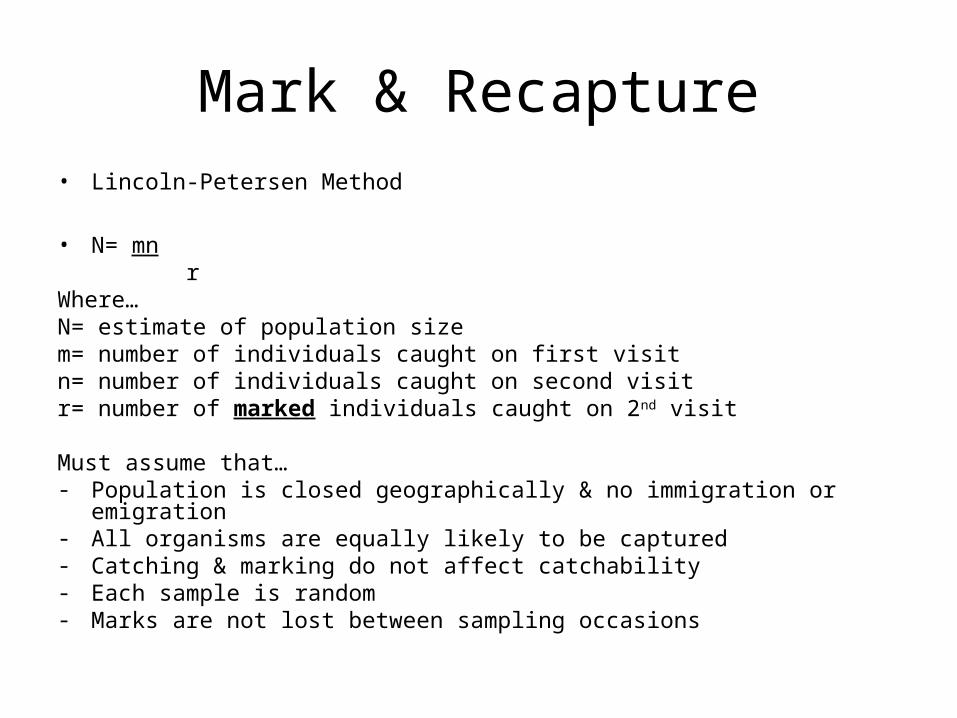
Mark & Recapture• Lincoln-Petersen Method
• N= mn r
Where…N= estimate of population sizem= number of individuals caught on first visitn= number of individuals caught on second visitr= number of marked individuals caught on 2nd visit
Must assume that…- Population is closed geographically & no immigration or emigration- All organisms are equally likely to be captured- Catching & marking do not affect catchability- Each sample is random- Marks are not lost between sampling occasions
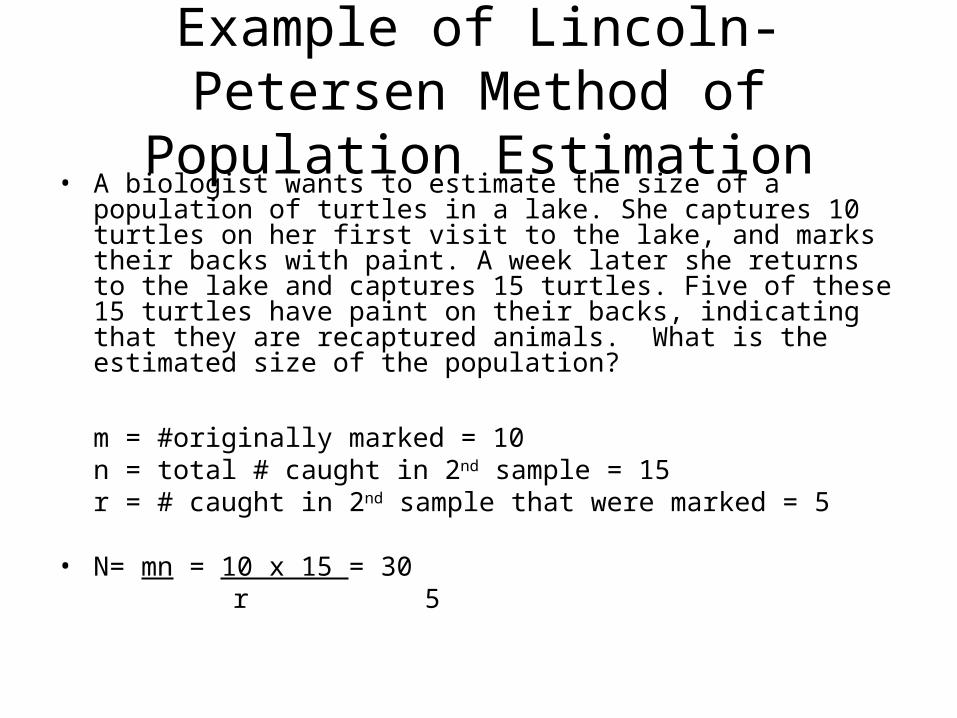
Example of Lincoln-Petersen Method of Population Estimation
• A biologist wants to estimate the size of a population of turtles in a lake. She captures 10 turtles on her first visit to the lake, and marks their backs with paint. A week later she returns to the lake and captures 15 turtles. Five of these 15 turtles have paint on their backs, indicating that they are recaptured animals. What is the estimated size of the population?
m = #originally marked = 10n = total # caught in 2nd sample = 15r = # caught in 2nd sample that were marked = 5
• N= mn = 10 x 15 = 30 r 5
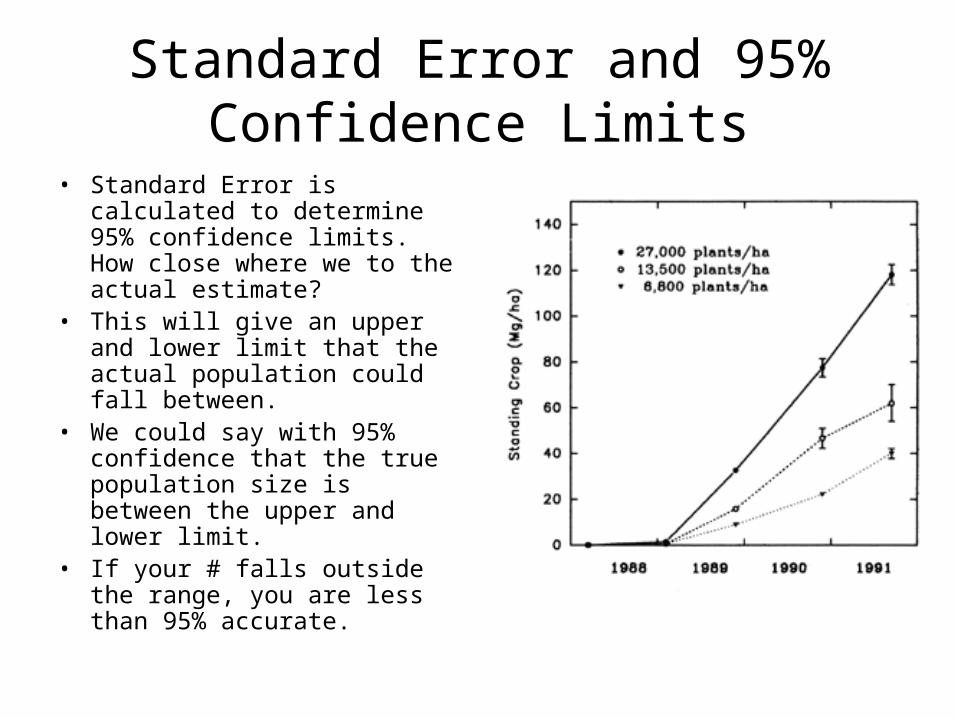
Standard Error and 95% Confidence Limits
• Standard Error is calculated to determine 95% confidence limits. How close where we to the actual estimate?
• This will give an upper and lower limit that the actual population could fall between.
• We could say with 95% confidence that the true population size is between the upper and lower limit.
• If your # falls outside the range, you are less than 95% accurate.

Population Distribution- can have an affect on how population is sampled, which can affect density measurement.Clumped most common because resources are usually clumped.
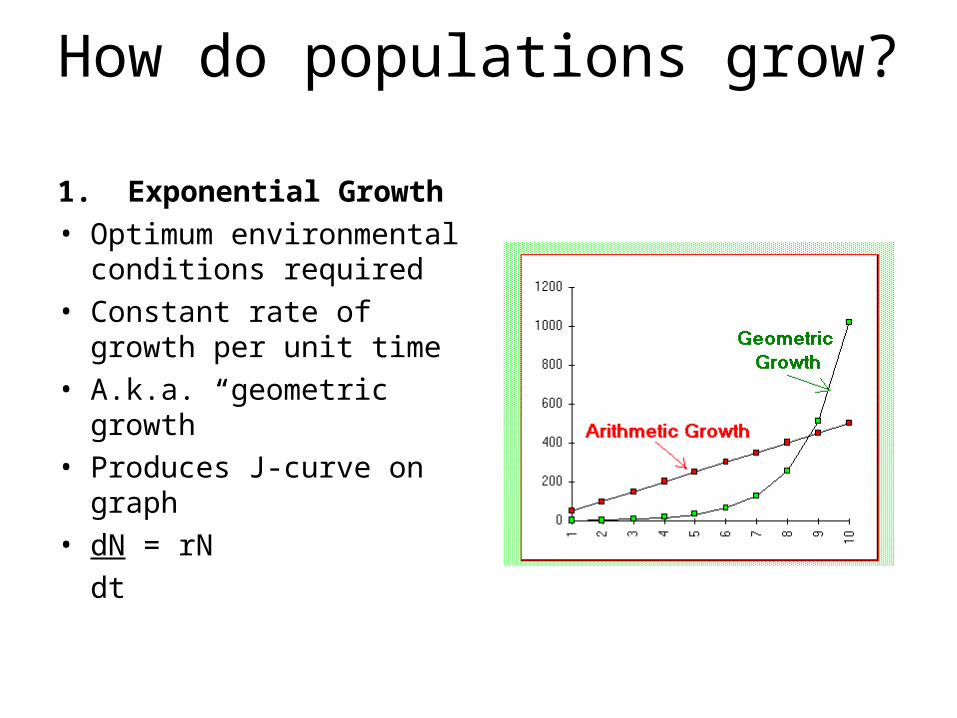
How do populations grow?
1. Exponential Growth• Optimum environmental
conditions required• Constant rate of growth
per unit time• A.k.a. “geometric growth”• Produces J-curve on
graph• dN = rN
dt
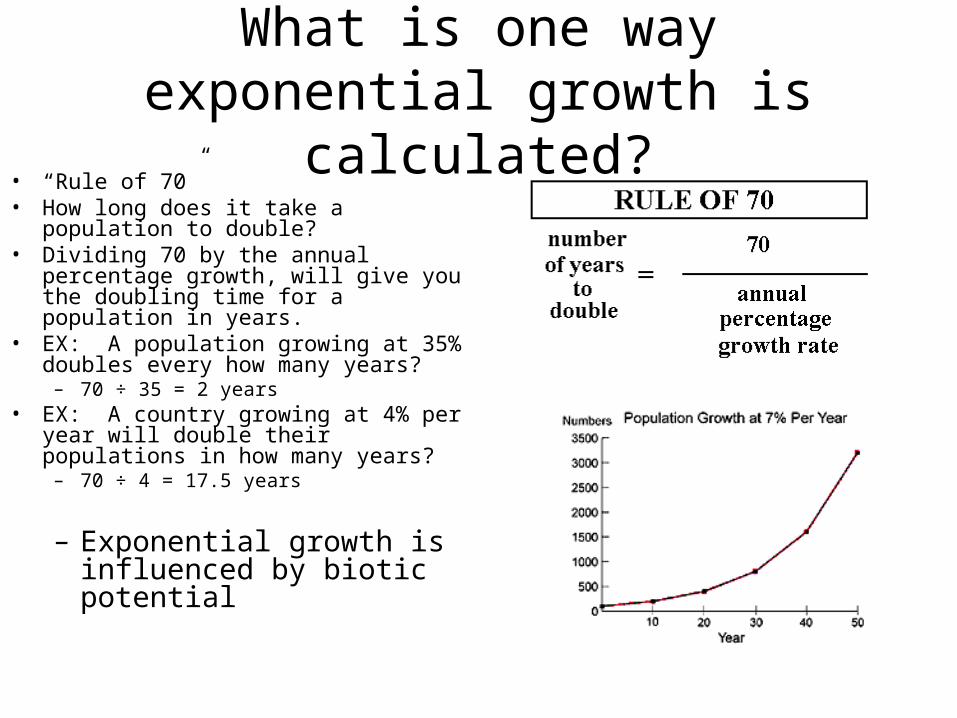
What is one way exponential growth is calculated?
• “Rule of 70”• How long does it take a population to
double?• Dividing 70 by the annual percentage
growth, will give you the doubling time for a population in years.
• EX: A population growing at 35% doubles every how many years?
– 70 ÷ 35 = 2 years• EX: A country growing at 4% per year
will double their populations in how many years?
– 70 ÷ 4 = 17.5 years
– Exponential growth is influenced by biotic potential

What is biotic potential?
• Reproductive rate of an organism
• High reproductive rates give species the potential to produce enormous populations very quickly given unlimited resources and no limiting factors.
• Affected by…– Age at reproduction– Frequency of reproduction– # of offspring produced– Reproductive life span– Avg. death rate
Biotic Potential Problem
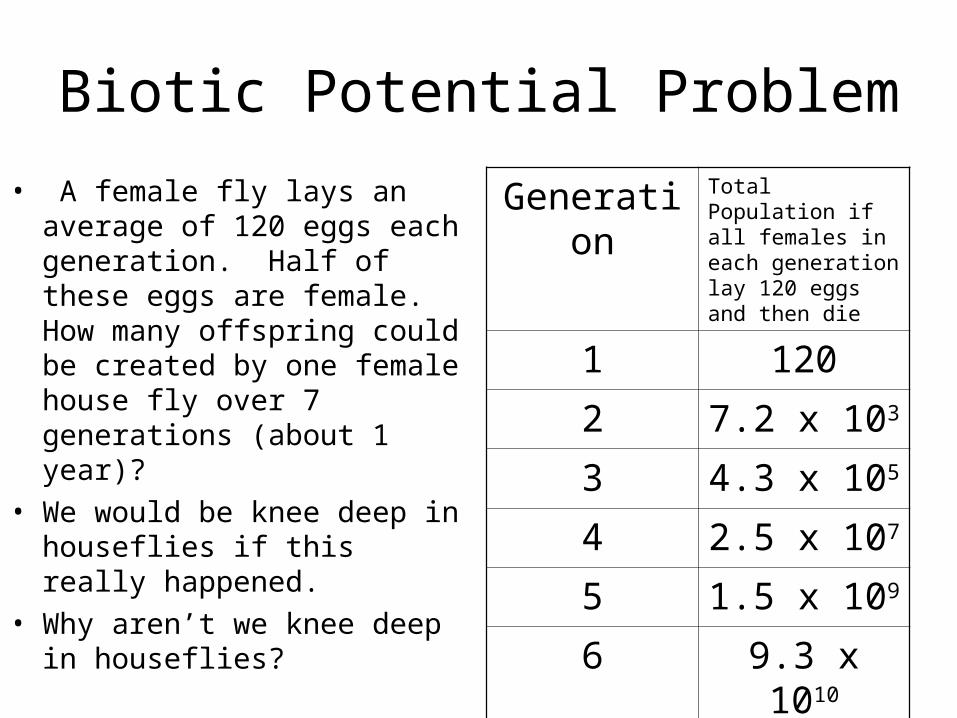
• A female fly lays an average of 120 eggs each generation. Half of these eggs are female. How many offspring could be created by one female house fly over 7 generations (about 1 year)?
• We would be knee deep in houseflies if this really happened.
• Why aren’t we knee deep in houseflies?
Generation Total Population if all females in each generation lay 120 eggs and then die
1 120
2 7.2 x 10³
3 4.3 x 10⁵
4 2.5 x 10⁷
5 1.5 x 10⁹
6 9.3 x 10¹⁰
7 5.5 x 10¹²
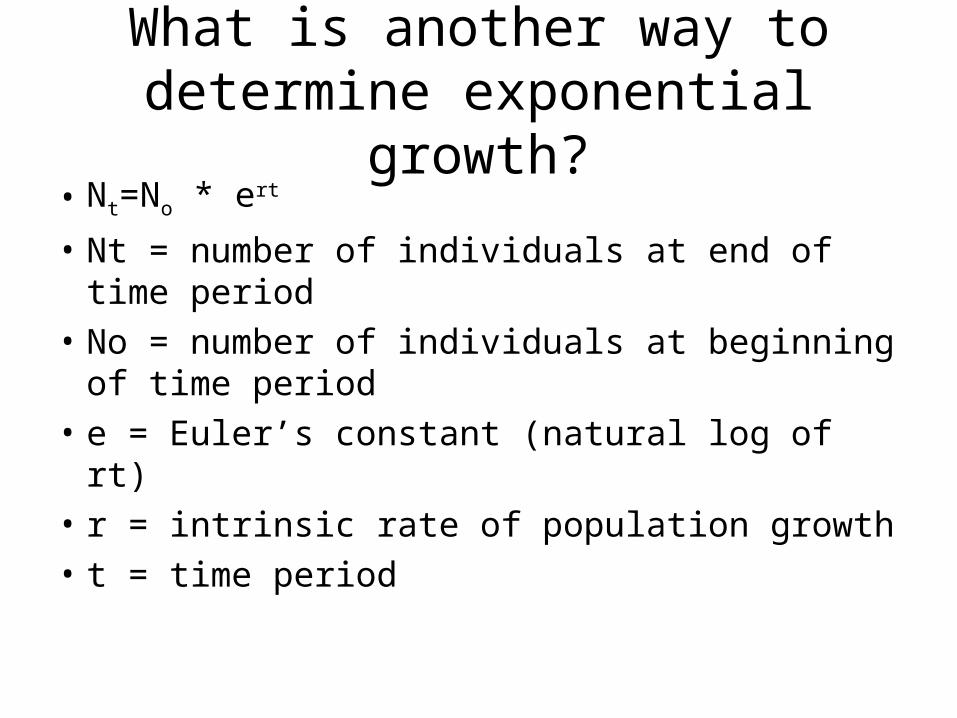
What is another way to determine exponential growth?
• Nt=No * ert
• Nt = number of individuals at end of time period
• No = number of individuals at beginning of time period
• e = Euler’s constant (natural log of rt)
• r = intrinsic rate of population growth
• t = time period
• See Population Problems WKST for examples…
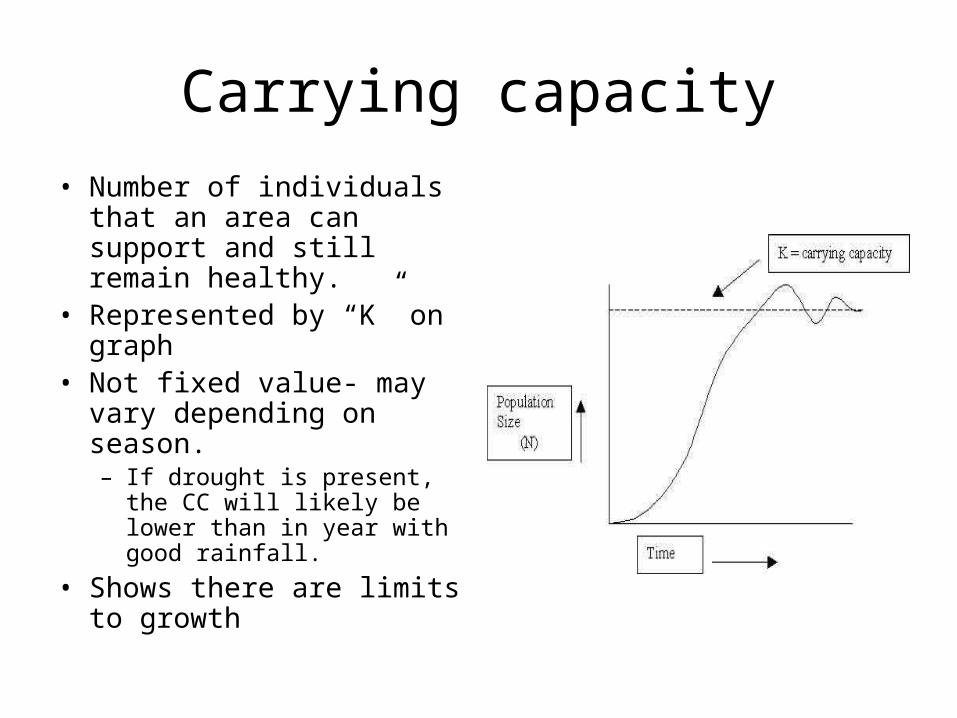
Carrying capacity
• Number of individuals that an area can support and still remain healthy.
• Represented by “K” on graph
• Not fixed value- may vary depending on season.– If drought is present, the
CC will likely be lower than in year with good rainfall.
• Shows there are limits to growth
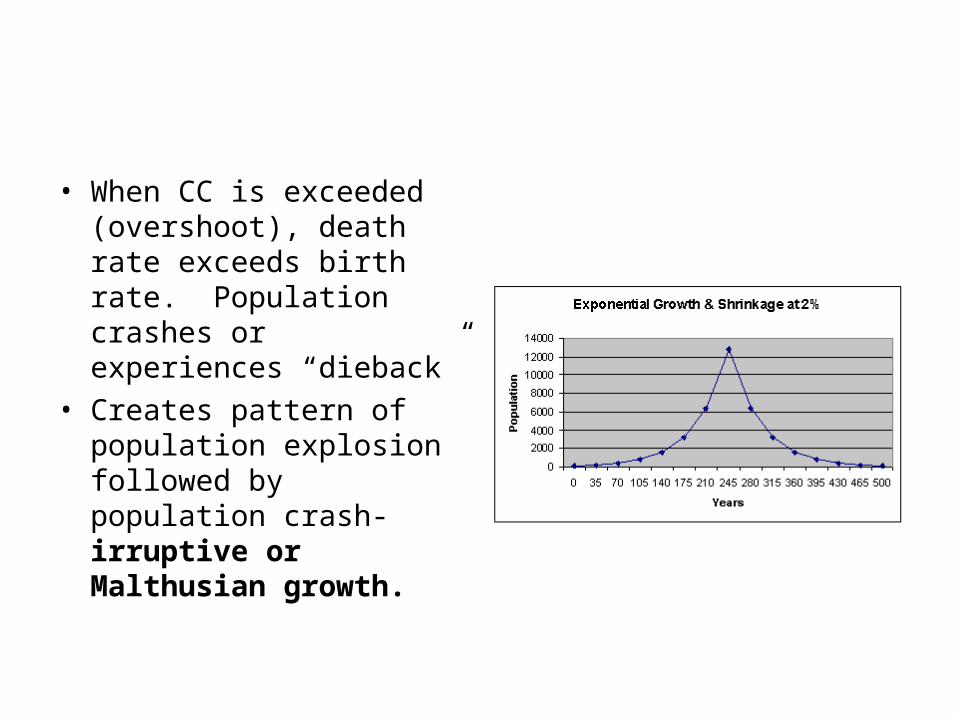
• When CC is exceeded (overshoot), death rate exceeds birth rate. Population crashes or experiences “dieback”
• Creates pattern of population explosion followed by population crash- irruptive or Malthusian growth.
How do populations grow?
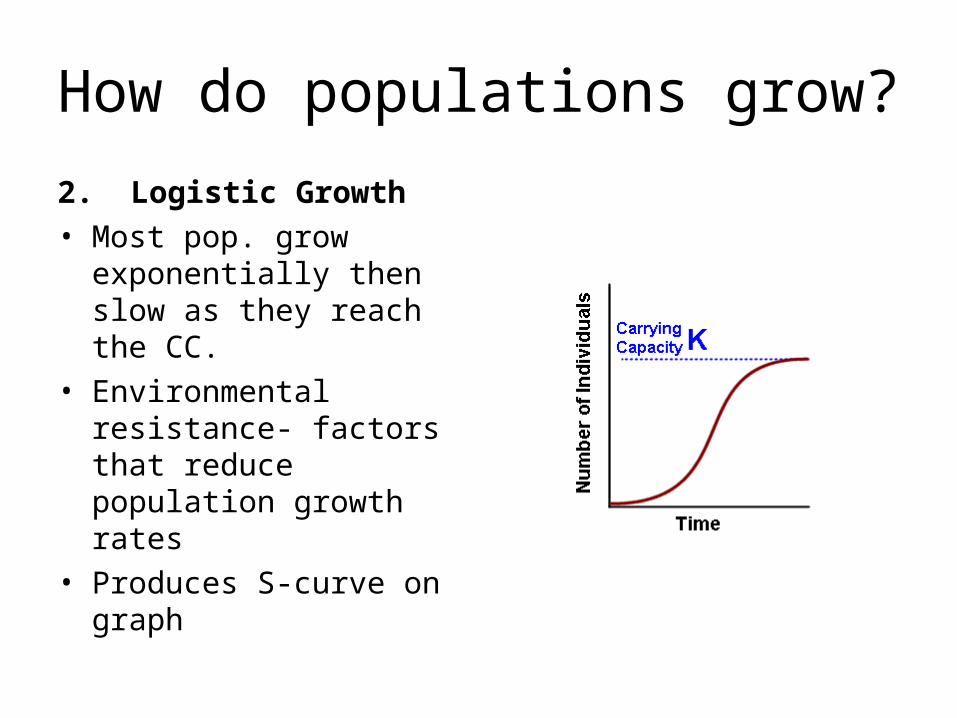
2. Logistic Growth• Most pop. grow
exponentially then slow as they reach the CC.
• Environmental resistance- factors that reduce population growth rates
• Produces S-curve on graph
REPRODUCTIVE STRATEGIES
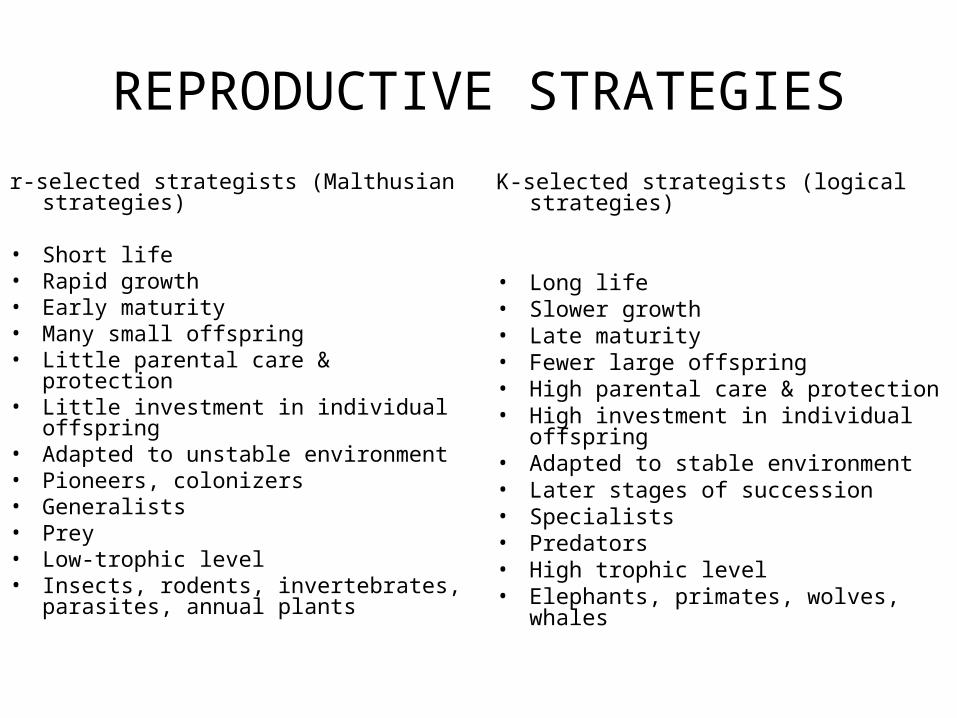
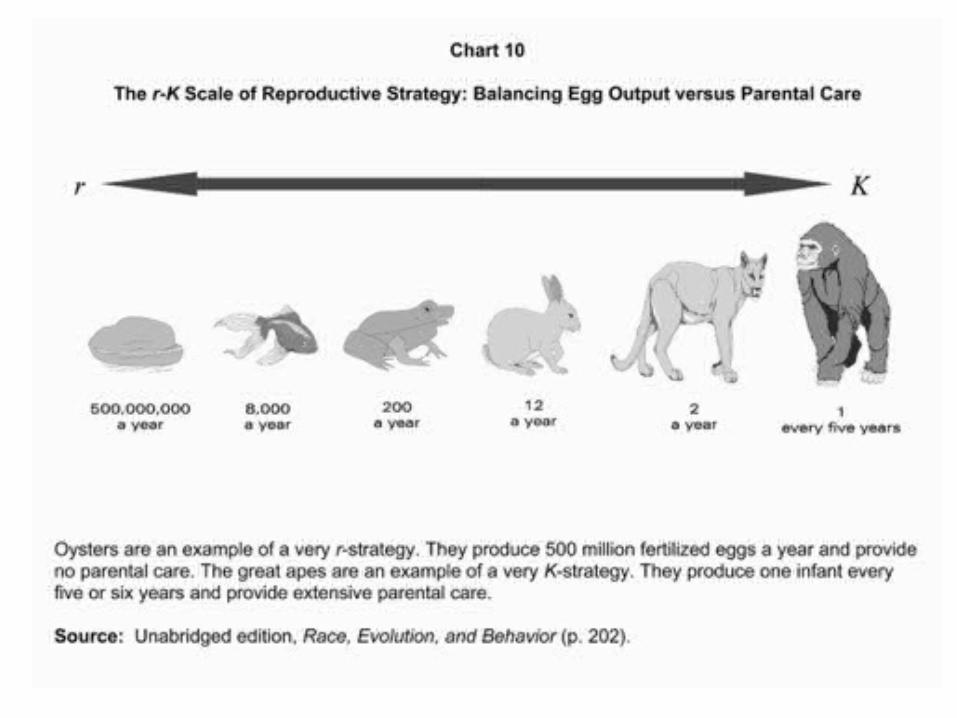
r-selected strategists (Malthusian strategies)
• Short life• Rapid growth• Early maturity• Many small offspring• Little parental care & protection• Little investment in individual offspring• Adapted to unstable environment• Pioneers, colonizers• Generalists• Prey• Low-trophic level• Insects, rodents, invertebrates,
parasites, annual plants
K-selected strategists (logical strategies)
• Long life• Slower growth• Late maturity• Fewer large offspring• High parental care & protection• High investment in individual offspring• Adapted to stable environment• Later stages of succession• Specialists• Predators• High trophic level• Elephants, primates, wolves, whales
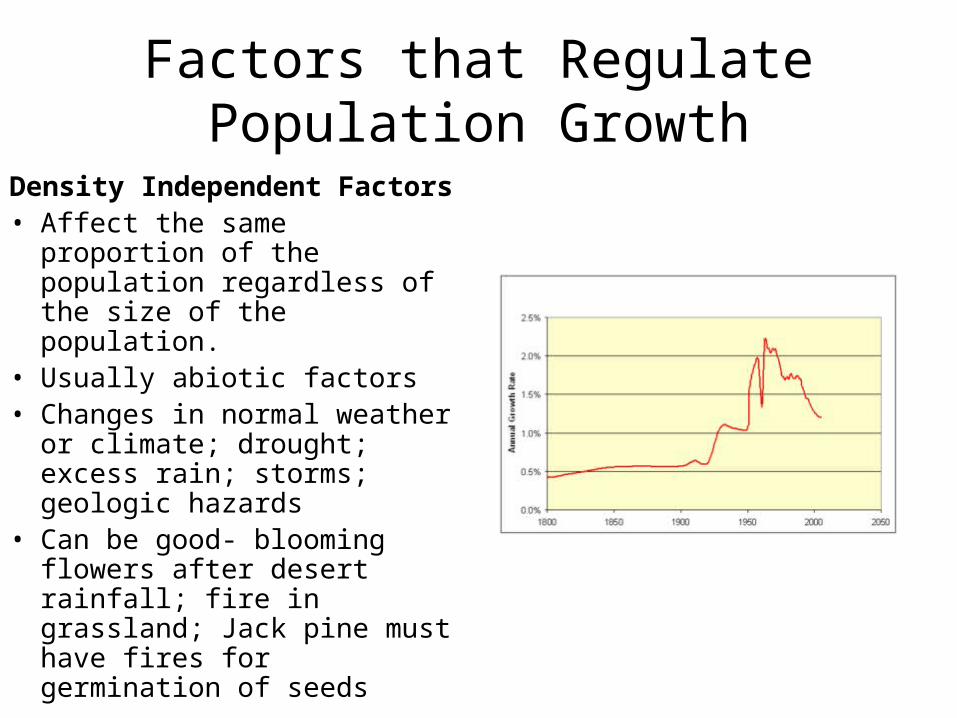
Factors that Regulate Population Growth
Density Independent Factors• Affect the same proportion of
the population regardless of the size of the population.
• Usually abiotic factors• Changes in normal weather
or climate; drought; excess rain; storms; geologic hazards
• Can be good- blooming flowers after desert rainfall; fire in grassland; Jack pine must have fires for germination of seeds
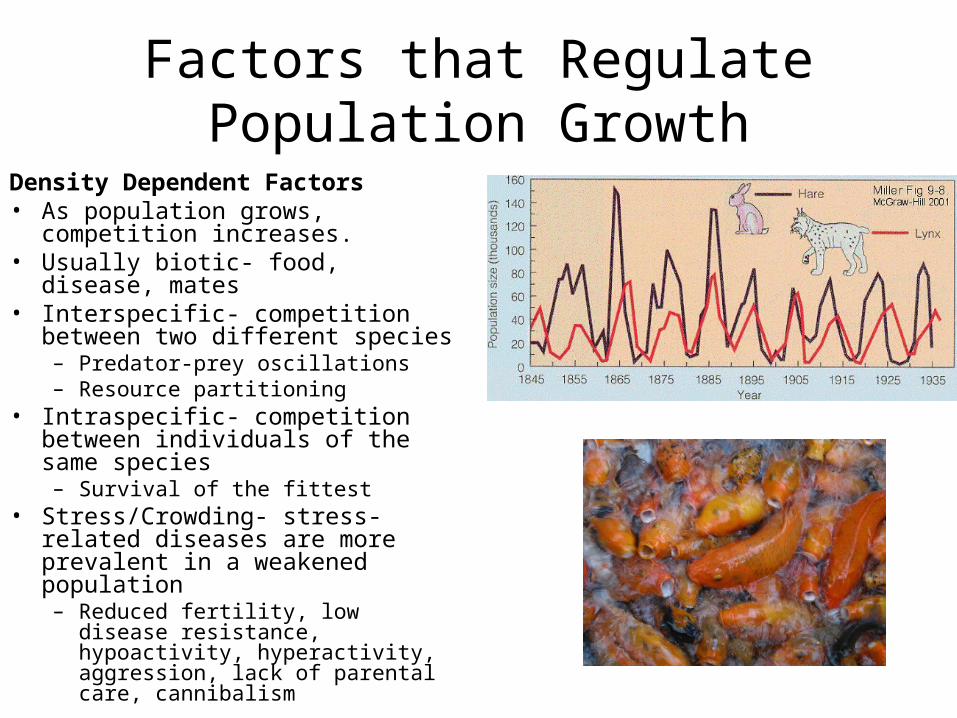
Factors that Regulate Population Growth
Density Dependent Factors• As population grows, competition
increases.• Usually biotic- food, disease,
mates• Interspecific- competition between
two different species– Predator-prey oscillations– Resource partitioning
• Intraspecific- competition between individuals of the same species– Survival of the fittest
• Stress/Crowding- stress-related diseases are more prevalent in a weakened population– Reduced fertility, low disease
resistance, hypoactivity, hyperactivity, aggression, lack of parental care, cannibalism
Factors that Increase or Decrease Populations
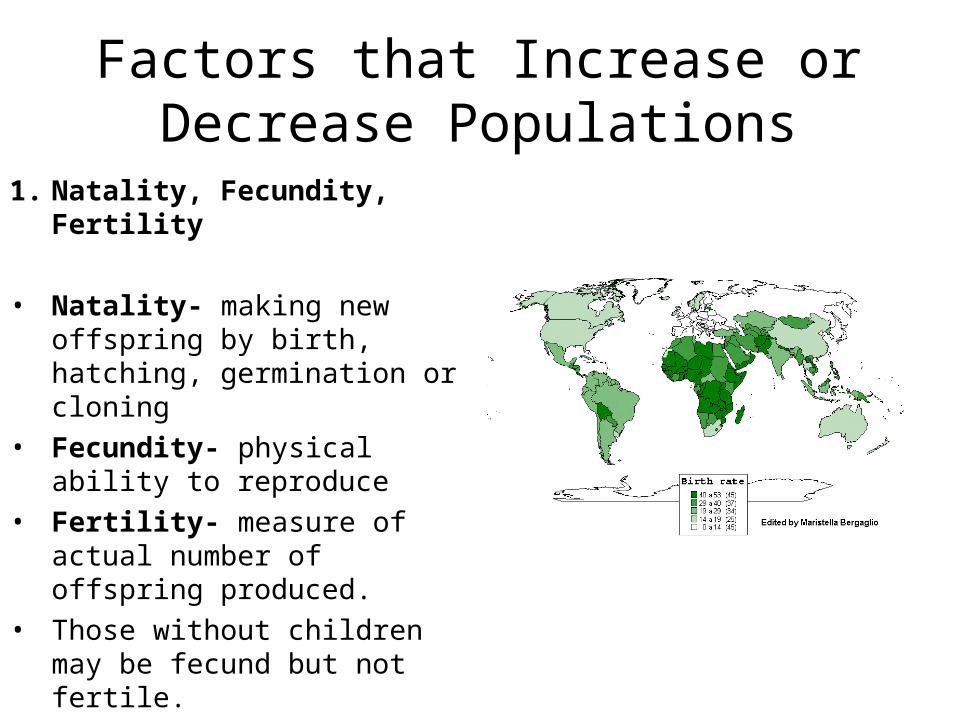
1. Natality, Fecundity, Fertility
• Natality- making new offspring by birth, hatching, germination or cloning
• Fecundity- physical ability to reproduce
• Fertility- measure of actual number of offspring produced.
• Those without children may be fecund but not fertile.
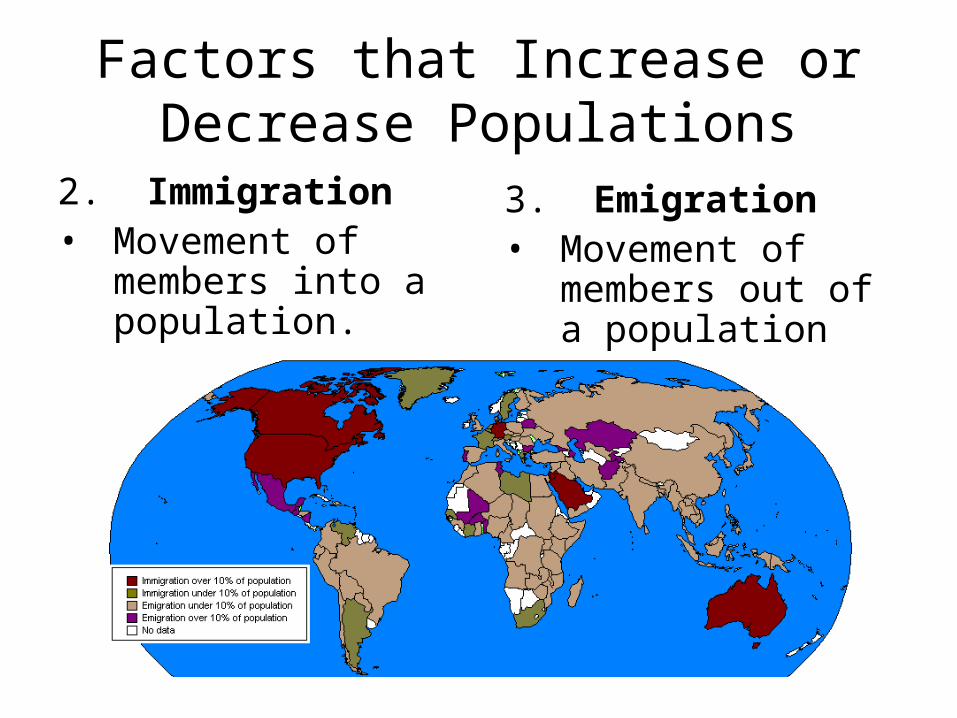
Factors that Increase or Decrease Populations
2. Immigration• Movement of
members into a population.
3. Emigration• Movement of
members out of a population
Factors that Increase or Decrease Populations
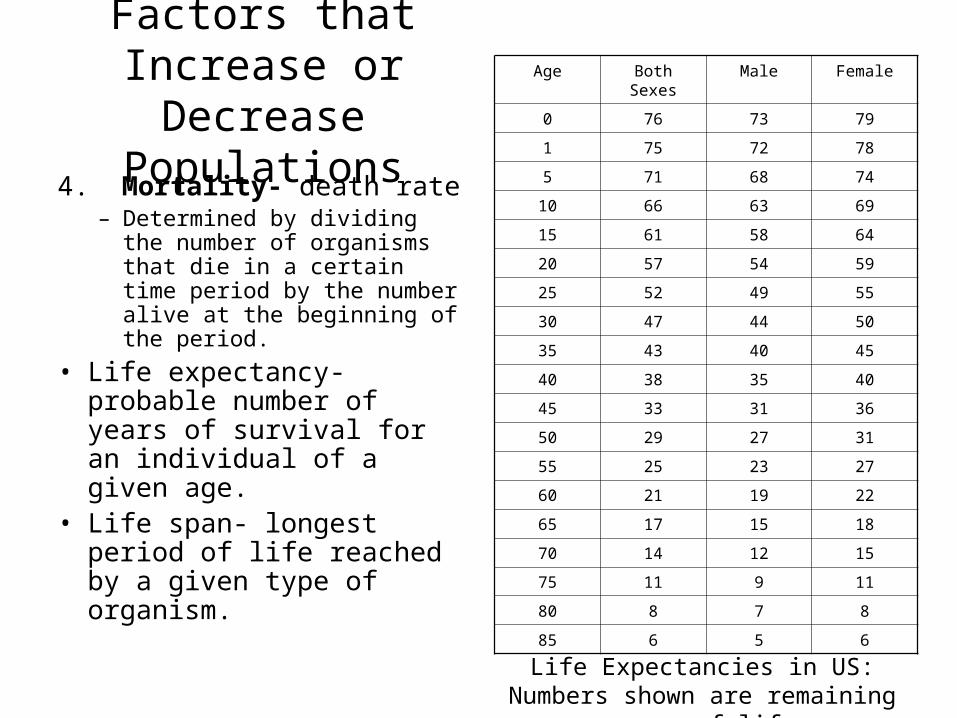
4. Mortality- death rate– Determined by dividing the
number of organisms that die in a certain time period by the number alive at the beginning of the period.
• Life expectancy- probable number of years of survival for an individual of a given age.
• Life span- longest period of life reached by a given type of organism.
Age Both Sexes Male Female
0 76 73 79
1 75 72 78
5 71 68 74
10 66 63 69
15 61 58 64
20 57 54 59
25 52 49 55
30 47 44 50
35 43 40 45
40 38 35 40
45 33 31 36
50 29 27 31
55 25 23 27
60 21 19 22
65 17 15 18
70 14 12 15
75 11 9 11
80 8 7 8
85 6 5 6
Life Expectancies in US: Numbers shown are remaining years of life
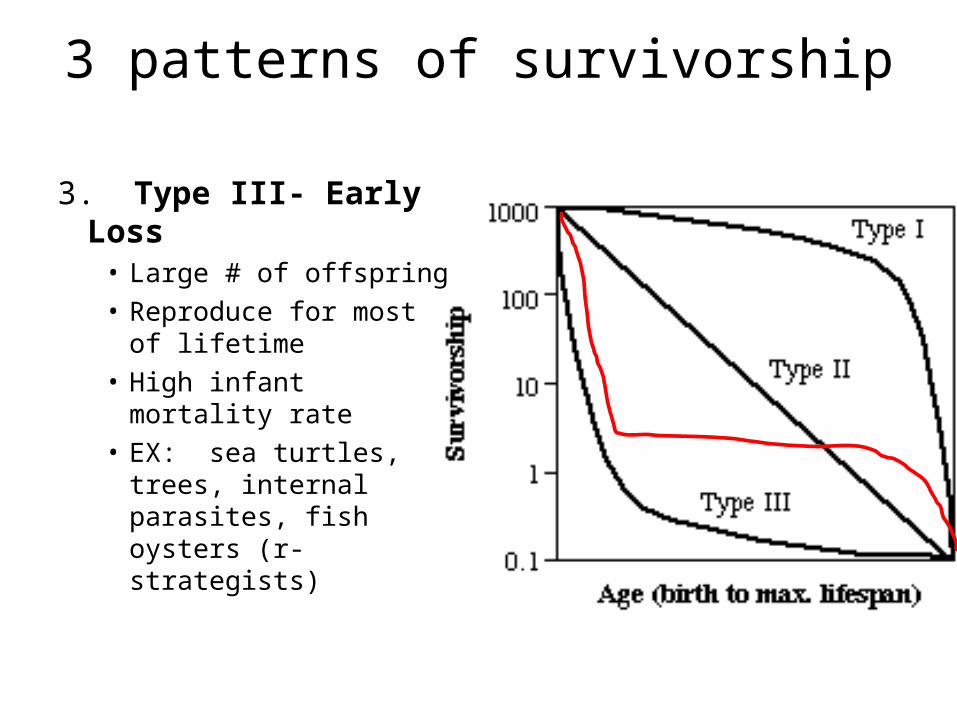
Survivorship
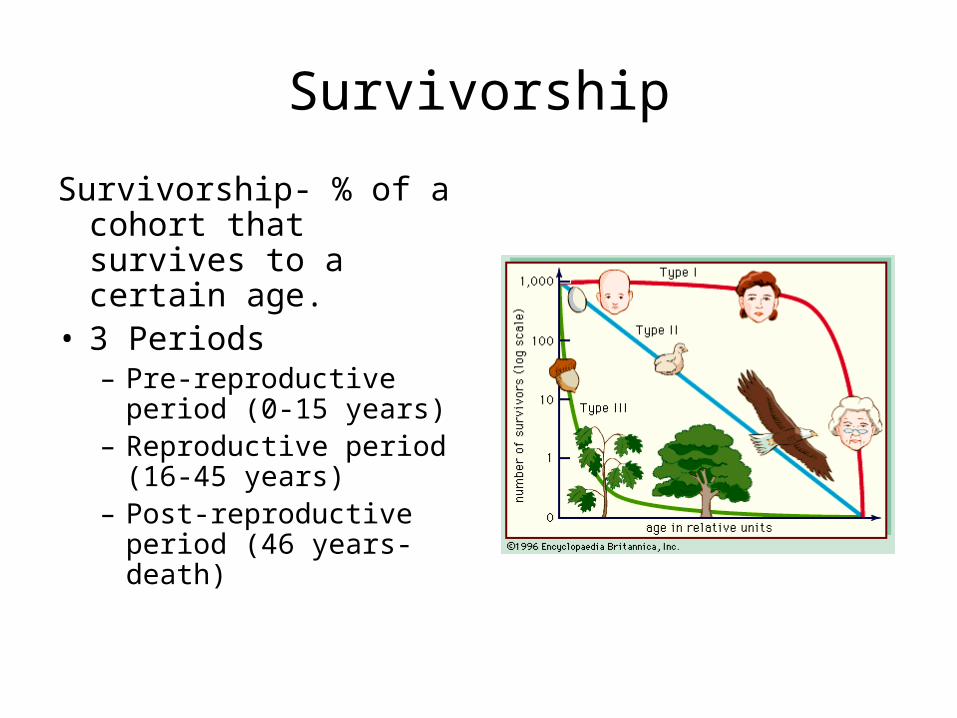
Survivorship- % of a cohort that survives to a certain age.
• 3 Periods– Pre-reproductive
period (0-15 years)– Reproductive period
(16-45 years)– Post-reproductive
period (46 years-death)
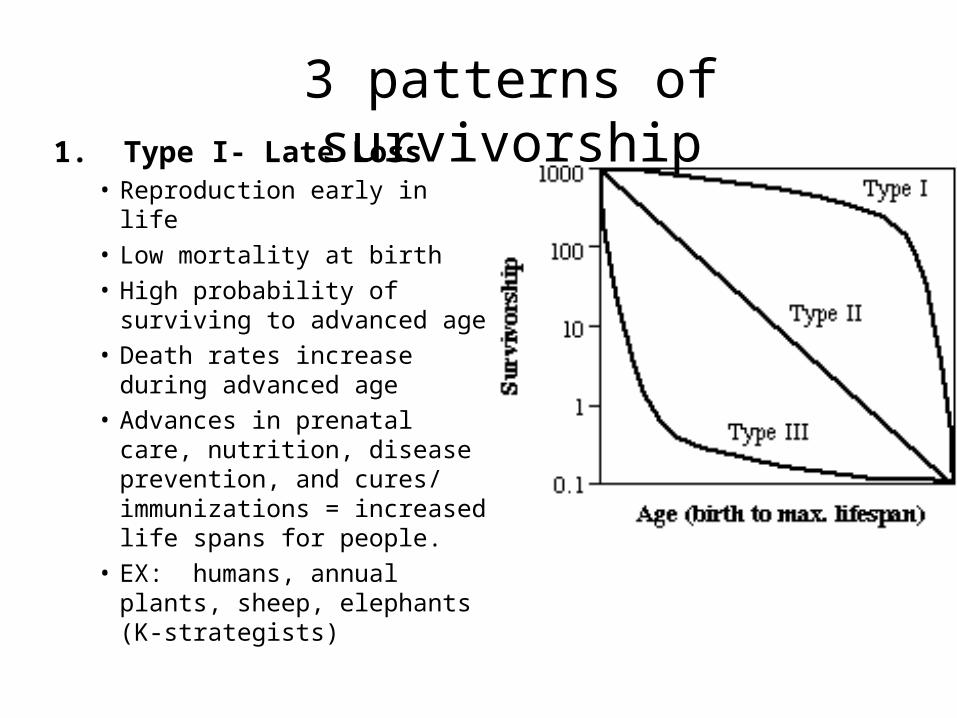
1. Type I- Late Loss• Reproduction early in life• Low mortality at birth• High probability of surviving to
advanced age• Death rates increase during
advanced age• Advances in prenatal care,
nutrition, disease prevention, and cures/ immunizations = increased life spans for people.
• EX: humans, annual plants, sheep, elephants (K-strategists)
3 patterns of survivorship
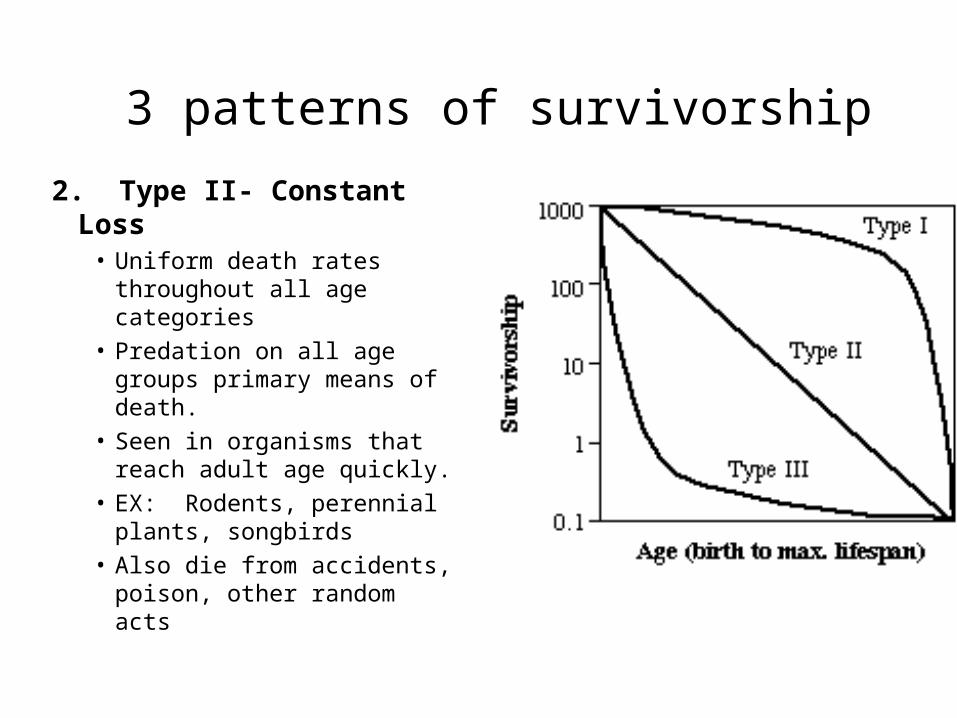
2. Type II- Constant Loss• Uniform death rates
throughout all age categories
• Predation on all age groups primary means of death.
• Seen in organisms that reach adult age quickly.
• EX: Rodents, perennial plants, songbirds
• Also die from accidents, poison, other random acts
3 patterns of survivorship
3 patterns of survivorship
3. Type III- Early Loss• Large # of offspring• Reproduce for most of
lifetime• High infant mortality rate• EX: sea turtles, trees,
internal parasites, fish oysters (r-strategists)
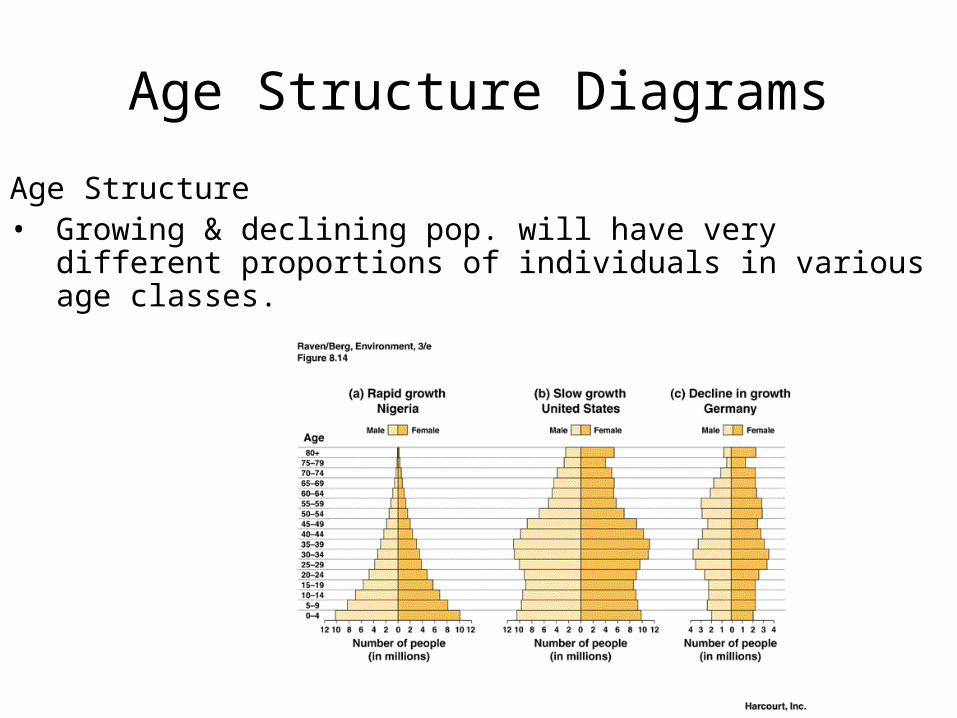
Age Structure Diagrams
Age Structure• Growing & declining pop. will have very different
proportions of individuals in various age classes.
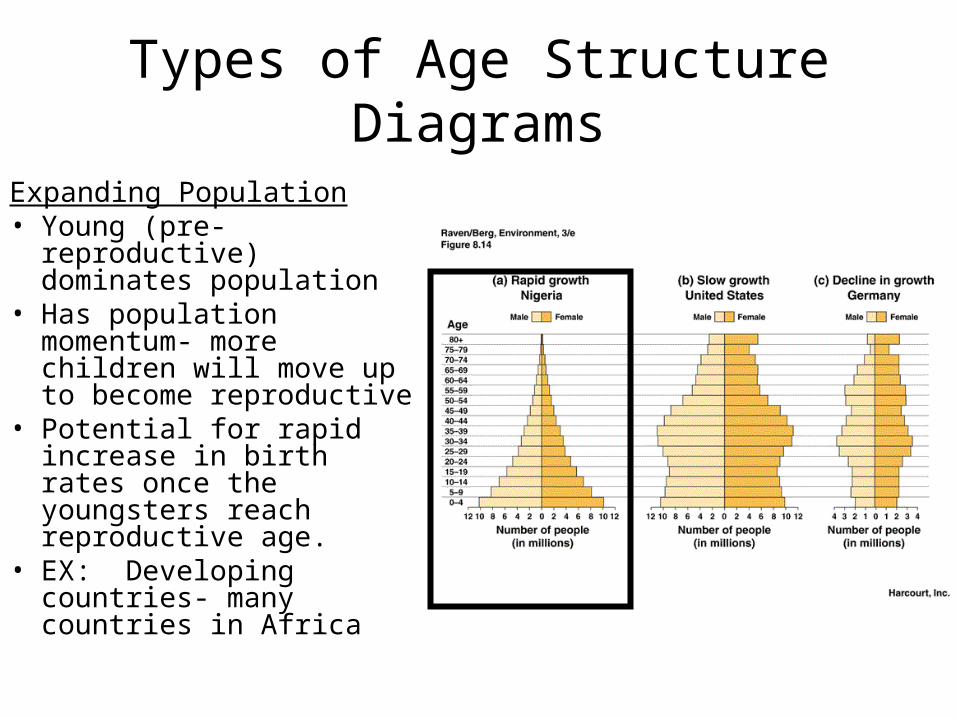
Types of Age Structure Diagrams
Expanding Population• Young (pre-reproductive)
dominates population• Has population
momentum- more children will move up to become reproductive
• Potential for rapid increase in birth rates once the youngsters reach reproductive age.
• EX: Developing countries- many countries in Africa
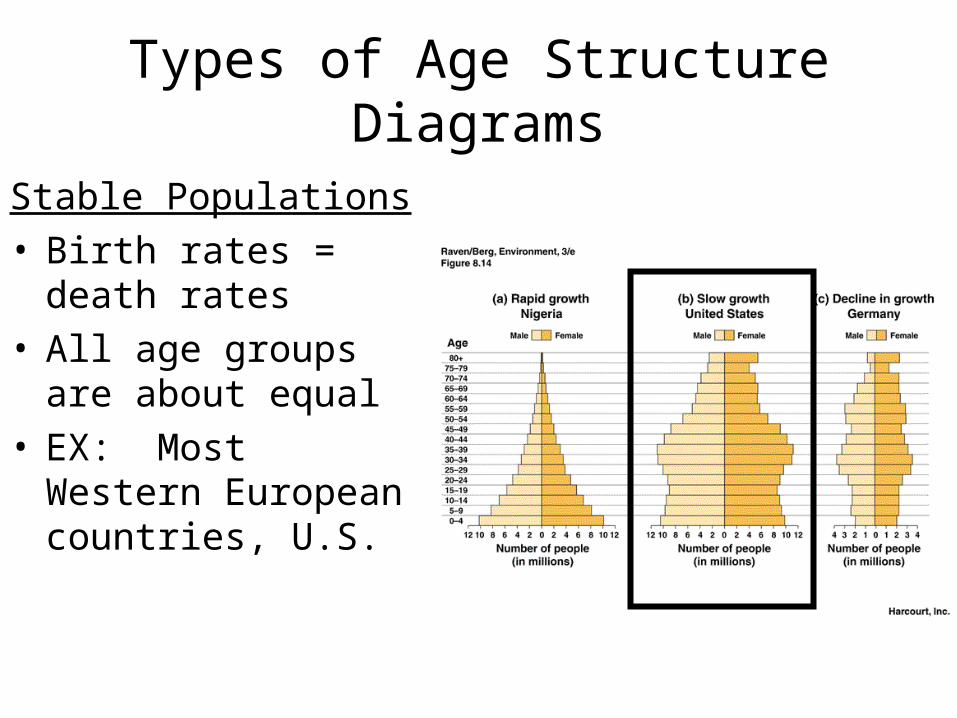
Types of Age Structure Diagrams
Stable Populations• Birth rates = death
rates• All age groups are
about equal• EX: Most Western
European countries, U.S.
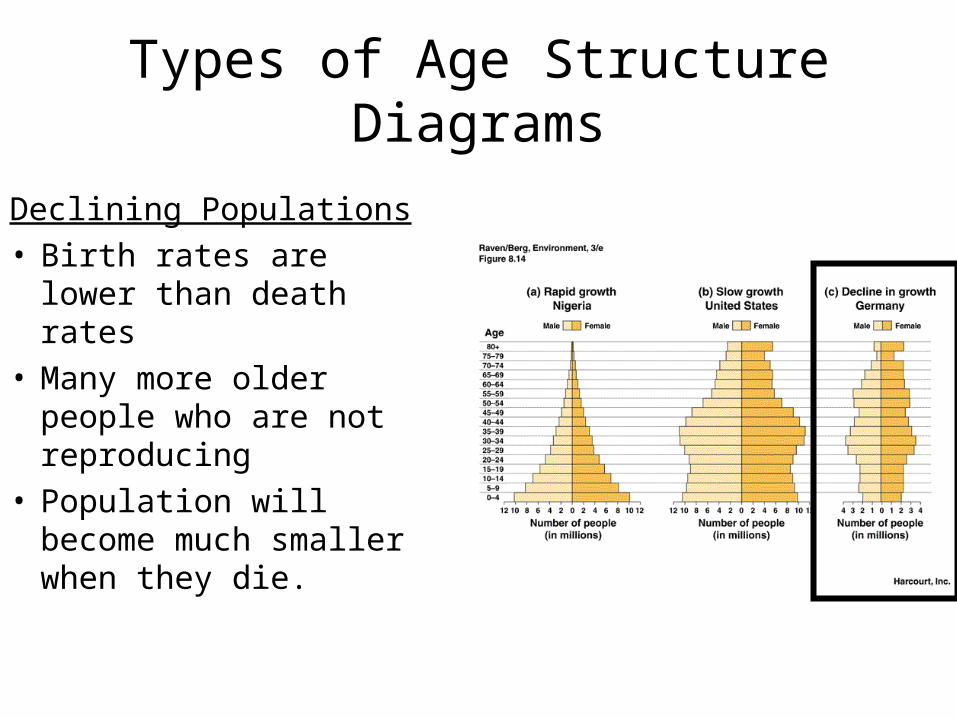
Types of Age Structure Diagrams
Declining Populations• Birth rates are lower
than death rates• Many more older
people who are not reproducing
• Population will become much smaller when they die.