population and major livelihoods in dalocha and silti ... · show that c.98% of holdings in the...
TRANSCRIPT

Department of Geography and Environmental StudiesAddis Ababa UniversityEthiopia
Rap
port
/ R
epor
t
NTN
UN
orge
s te
knis
k-na
turv
itens
kape
lige
univ
ersi
tet
Faku
ltet
for
sam
funn
svite
nska
p og
te
knol
ogile
dels
e G
eogr
afisk
inst
itutt
Beyene Doilicho Population and Major Livelihoods in Silte and Dalocha Woredas of Silte Zone
Working papers on population and land use change in central Ethiopia, nr. 11
Acta Geographica-Trondheim
Serie A, Nr. 19 Series A, No. 19
Avhandlinger og rapporter/Theses and reports
October 2007
I n n o v a t i o n a n d C r e a t i v i t yI n n o v a t i o n a n d C r e a t i v i t y
Addis Ababa University
Addis Ababa University
Acta Geographica-Trondheim is the continuation of Papers from the Department of Geography, University of Trondheim, which came out 1978-2001.
http://www.ntnu.no/geografiISSN 1502-2390
www.ntnu.no/geografi

Beyene Doilicho, 1
Population and Major Livelihoods in Silte and Dalocha
Woredas of Silte Zone
1 PhD, Department of Geography and environmental sciences, Addis Ababa University
1

Abstract (2)3
Population growth, land use changes, land degradation and livelihoods are analysed in some PAs belonging to 2 woredas , Silte and Dalocha, in the Alkesso area. The area is severely degraded and the population is still growing fast. Land degradation, declining size of land holdings, declining yields and landlessness lead to widespread poverty and push many households to undertake various off-farms activities. Households also turn to seasonal and permanent migrations for securing their livelihoods. If the current land tenure, population growth and land conservation conditions are to continue for significantly long time, the practised coping mechanisms are unlikely to be sufficient to meet people’s basic needs.
2 This study was supported by the NUFU funded collaboration programme between the Department of Geography of Addis Ababa University and the Geography Department at NTNU, Trondheim (Norway): “Population growth and land use change in Central Ethiopia”. 3 Front cover picture: Houses in the study area (Beyene Doilicho, 2003)
2

1. Introduction The population of Ethiopia grew from approximately 42 million in 1984 to approximately 69 million in 2002. The UN’s estimate for the year 2005 was 77.4 million. The rate of growth has been generally high but somewhat uneven. The estimated rates of growth for the periods 1960–1965, 1970–1975, 1975–1980, and 1980–1985 were 2.2%, 2.3%, 2.3%, 2.6%, and 2.8% respectively (CSA 1988). The rate of growth for 1984 was 2.9% (CSA 1984) and it was not significantly less in the period 1984–1994. As one of the least developed countries of the world, Ethiopia has a high fertility rate. Its total fertility rate increased from approximately 5.7 children per woman in the late 1970s to 7.7 children per woman in the early 1990s. The current estimated rate is approximately 5.7. It is not surprising, then, that its regions and woredas also experience high fertility rates. The current crude density of population is approximately 63 persons per km2. Over 88% of Ethiopians reside in the highlands, where the crude density reaches approximately 114 persons/km2 (Sonneveld & Johannes 2002: 10). It is therefore important to determine whether there are any systematic variations in the densities of the regions, as these would have important implications. Regional crude densities vary from 121.8 for SNNPR (Southern Nations, Nationalities, and People’s Region) to only 8.8 in Gambella. Amara, Tigray and Oromia have densities of 111.0, 80.0 and 69.1 persons/km2 respectively (CSA 2002). These are also regions with higher proportions of highlands, unlike Gambella, Afar and Benishangul Gumuz. Variations in densities by woreda are extremely high. The highest density woredas are in the SNNP and those with the lowest are in the dominantly low regions of Afar, Benishangul Gumuz and Gambella. Several woredas in Kembata and Tembaro, Woliata, Sidama and Gedeo have densities of greater than 500 persons/km2, with the highest being 987.7 persons/km2 in Wenago. The population density figures for Silti and Dalocha woredas are 289 and 225 persons/km2, respectively. As most parts of these woredas are among the most severely degraded areas of the country the population densities may have even greater implications for further deterioration of the cultivable land than in the aforementioned highest density woredas. For most woredas in Afar, Gambella and Benishangul Gumuz the densities are below 10 persons/km2. Agriculture, the mainstay of the Ethiopian economy, accounts for c.90% of the total foreign exchange earning, 50% of the GDP, and provides employment for over 85% of the country’s labour force. While this makes it the most important sector in the country, it has been characterized by poor and relatively declining performance since the late 1960s and early 1970s. The result of this has been progressively increasing grain imports and food aid. For instance, cereal production has been negative since 1972 with the exception of a few years (Alemayehu 1986: 11).
3

As a consequence, there have been progressively increasing grain imports and food aid. Between 1979/1980 and 1990/1991, Ethiopia’s cereal imports increased from 111,000 metric tons to 894,000 metric tons and food aid increased from 397,000 metric tons to 802,000 metric tons. A study of the International Food Policy and Research Institute reveals that food aid amounted to 10 million metric tons between 1984 and 1998, which is almost 10% of the annual cereal production (Quisumbing 2003: 1). The population growth rate of the country, although falling slightly, is still high. The estimated current growth rate is c.2.5% or higher. The sizes of holding are declining as the population size is increasing fast. As far back as 1974/75, c.57.6% of the holdings in Ethiopia were less than 1 ha in size (Desalegn 1984). Studies of some of the most densely populated parts of the country, such as Kembata and Hadiya in south-central Ethiopia, show that c.98% of holdings in the mid-1990s were less than or equal to 1 ha (Beyene 1998). The seriousness of the problem can be seen when this is looked at in relation to the large sizes of households, which range from five to six members in most of the densely populated highlands; in fact, there are areas even with greater households sizes. Problems of small sizes of landholding are further aggravated by the fragmentation and scattering of holdings into several plots in almost all areas of sedentary agriculture. It is common for the majority of households to have more than a one plot of land. Some studies dating from the 1990s (both early and late) have shown that the number of plots operated by individual households was greater than two in most cases. Yibletal’s (1995) study results for Dale and Shashamene showed that the average number of plots operated was 3.62 and 2.65 respectively. In fact, there were some individual households with six or more plots. Further, in some of the most densely populated areas where the majority of the households had 0.5 ha or less, most holdings consisted of two or more plots (Beyene 1998). The central highland areas, which are areas of high population density, are also areas with very high levels of continuing land degradation and declining carrying capacity under the prevailing agricultural practices and technology. According to Sonneveld & Johannes (2002: 12):
More than 67 percent of the population lives on 30 percent of the area with moderately to very severely affected soils. Forty two percent lives on 17 percent of the area with moderately degraded soils while the ‘severely’ to ‘very severely’ degraded soils occupy 12 percent of the area, carrying 25 percent of the population.
One of the major factors influencing the sizes of holdings and the level of fragmentation of land, particularly after the military government came to power in the early 1970s, has been land tenure. There can be little doubt that has generally resulted in declining agricultural productivity and production as well as accelerated land degradation. Hence, for the purposes of this study it is worth very briefly examining the land tenure situation of the last three decades. This will provide the background to the discussion in the following sections of this study.
4

Ethiopia had a clear break from the land tenure problems of the Imperial Government with the March 1975 Land Reform Proclamation, which was the result of the 1974 popular revolution. The proclamation gave use rights to land to the peasants and abolished tenancy, and it also provided for the formation of Peasant Associations for grass-roots self-administration as well as the distribution of land among peasant formers. At the beginning, the organization of peasants was only up to Awraja level. It prohibited transfer of land by sale, lease, mortgage, or similar means. It also went to the extent of prohibiting the use of employed labour for farm activities on person’s holding. As the law instituted that every peasant household head is entitled to his share of land only where he resides, claims to land at different places in the rist system ceased. Although there were various problems in the implementation of the proclamation, initially, the peasant farmers benefited from it significantly (Pausewang 1990). The infringement of the government on the relative autonomy of peasants started to be stronger with the formation of peasant association offices at regional and national levels. This effectively changed the Peasant Association leaders into the executive bodies of government decisions. This legacy has continued to date in the EPRDF (Ethiopian People’s Revolutionary Democratic Front) -led Government. After the Land Reform Proclamation, the distribution of land was started without detailed instruction or proper guidance and training from above. Consequently, the responsibility, pace, criteria, and methods of land allocation varied by region and locality. In some areas the responsibility of land allocation was left to the PA leadership, while in some it was given to a special land allocation committee made up of members of executive committees, and in others it was made solely the responsibility of special distribution committees (Beyene 1998: 57). The factors with major influence on the pace of distribution were the pre-land reform land tenure system and the size of the arable land fund, while allocation criteria were mostly influenced by the size and quality considerations of the arable land as well as the size of the landless- and near landless households in the respective areas. The pace was generally slower in the previously rist system areas where people already had use rights. Where there were not serious shortages of arable land, the attempts were very limited. In fact, these were also areas where the land reform proclamation did not have much enthusiastic reception as landlessness and tenancy were not problems. People in areas where tenancy was predominant, generally in the south of the country, embraced land reform proclamation very enthusiastically. In these areas the initial distribution of land was done during the zemecha (Development Campaign) period following the issuance of the proclamation. Even within these regions peasants did not engage in a complete land redistribution beyond allocation of land to the landless and near landless in areas with little problem of arable land (Dessalegn 1984). Measures of land allocation in almost all parts of the country, at least initially, included considerations such as household size, accommodation of the landless, and augmenting the land size of the near landless. However, in some areas of extreme scarcity of arable land, the landless were given land with no consideration of household size, while in
5

others with no pressing problem of land scarcity, apportionment of land was also based on the household’s ability to farm (Dessalegn 1984). In most cases, the minimum was that of the newly formed households (Dessalegn 1984; Teferi 1995; Yared 1995). For the first few years, the duration varied from region to region, or even from locality to locality, but plots were added with increasing size of household depending on the level of availability of arable land reserves within the PA area. However, with population continuous growth and fast increasing numbers of households this was no longer possible in most areas of high population density and/or serious land degradation. In fact, not only additions but also even the initial offer of land to newly forming households became extremely difficult as time went by and the pressure increased. In most cases, attempts were made to find land for some of the new couples from households whose members had been reduced due to permanent out-migration, full-time off-farm employment, marriage out of the PA, or death. As the pressure for land was extremely high, these measures not contribute to the solution of the problem in a meaningful way. The process of land redistribution ended at various times in different parts of the country mainly due to the lack of arable land to be distributed. The official end of land redistribution during the Derg (military) regime came with the implementation of the mixed economy policy of 1990. After the mixed economy policy, which was the official end of the land redistribution process in each PA, one of the remaining few venues of access to farm land for newly formed households became sharing small plots on family holdings. Again, it was not been possible for all to have access to land this way. In fact, even in cases where this was possible, there were instances of intergenerational and intra-generational conflicts; the former between fathers and sons and the latter between or among siblings (Teferi 1992). Other venues of access to land have included sharecropping with and mortgaging from primarily the aged and female heads of households (Aklilu & Tadesse 1994; Yared 1995). For some, marriage with women who had land also served as way of accessing farmland (Aklilu & Tadesse 1994). Various studies, including the ones referred to from Northern Shewa, Central Ethiopia, indicate that all these measures did little to reduce the problem of lack of access to land, which was further aggravated by the large numbers of returnees from resettlement areas and the homecoming of ex-soldiers which marked the coming to power of the EPRDF Government. As the chances for off-farm and non-farm employment are very limited, the levels of rural underemployment and unemployment have increased rapidly and are bound to continue to increase further. Contrary to expectations, land redistribution did not come to an end in all parts of Ethiopia before the EPRDF came to power. It was resurrected at least in much of the ‘Amhara’ region, with the apparent objectives of addressing the problem of the landless and near landless, equality of women, as well as enhancing productivity and production (Yigremew 2001). However, Yigremew’s (2001) study revealed that the process of land redistribution was secretive and politically motivated, and instead of the apparently stated objectives the results were largely tenure insecurity, land degradation, holding diminution, and reductions in productivity and production. Allan Hoben (2001: 6) also made the same observations when he said, ‘As the program was implemented, however,
6

it became evident that it had punitive and political objectives as well. Household heads classified as remaining feudal or former bureaucrat were allowed to keep only one hectare of land, while all others could keep up to three’. These and other studies, as well as occasional visits to rural areas of the country, have shown that rural farming households have been in a land-insecure and uncertain situation for a long time with all the implication for agricultural productivity, long-term investment in land, and conservation of land resources in general. Although the case of the Amhara Region might be considered excessive, varying numbers of distributions have taken place almost everywhere in Ethiopia and farmers still do not own land. Hence, insecurity of holding continues, with all its implications. As will be seen later in the present paper, the study area did not have as much redistribution as in many other areas, but has its own specific problems regarding land tenure, land use and the worsening of land degradation with fast population growth. 1.1 The Problem The study PAs are mainly within moderately to severely degraded area. The area around the small town of Alkesso in Silte woreda is characterized by huge gullies, very severe soil erosion and cultivable land that is patchy in nature. In fact, much of the area, including two of the study PAs in Silte woreda, namely Anshebesso and Albazer-Zemoshadger, is severely degraded. An occasional visit to the area clearly showed the immense land degradation and farmland shortage problems which the rural population of the area is facing. The question of what kinds of land use/land cover changes have been taking place and what alternative and/or supplementary ways of earning a living exist for the people of the area led to this area being chosen as the study area. 1.2. Objectives This Link research sub-project is titled Population Growth and Land Use/Land Cover Change in Silte and Dalocha woredas focusing on Selected Peasant Administrations. Its broad objective is split into two main objectives, respectively titled The Study of Some Population Characteristics and Livelihoods and The Study of Land Use/Land Cover Change. The present paper is part of the sub-project titled Some Population Characteristics and Livelihoods, which has as its specific objectives, to:
a) briefly describe the patterns of settlement, the types of houses and construction materials, and problems relating to construction and fuel materials
b) examine some characteristics of population c) examine the size of landholding and the situation of agriculture under the
prevailing population growth regime d) present a general overview the importance of non-agricultural/off-farm
activities, including migration, as supplementary livelihoods.
7

1.3 The Study PAs A six-day field visit was made to the Alkesso area, 16–21 June 2003. The stay offered an opportunity to talk to individual farmers, the staff in Zonal and woredas offices (administrators and the staff in capacity building office), and also schoolteachers. Information was obtained on the number of woredas and kebeles in Silte Zone, including some estimates of land use categories by woredas. Of the six woredas of Silte Zone, with 179 kebeles, three kebeles were selected for socio-economic study, namely Anshebesso, Albazer-Zemoshadger and Dalocha-Talikessa. The following statements about each of these PAs are intended to shed some light on why they were selected for study. Anshebesso Anshebesso is a kebele around the small town of Alkesso located at a distance of 161 km from Addis Ababa on the road between Hossana and Butajira, at approximately 07º56′ N and 38º14′ E. At 2357 metres above mean sea level, it is higher in elevation than both Dalocha-Talikessa and Albazer-Zemoshadger. Badlands are characteristic features of the area. It was the badlands here that initially attracted the attention of one of the groups in the Link project. The group found it important to study how the people in the area conceive the development of these badlands, how they manage the use of the plots of land that are increasingly reduced by the development of the badland phenomenon, and what additional livelihood strategies are carried out in order to meet the needs that cannot be met by production and income from the farms. Albazer-Zemoshadger Albazer-Zemoshadger kebele is on a highland slope above the town of Worabe, the new capital of Silte Zone. As it is only 9 km south of Worabe, which n turn is quite close to Alkesso. Its average elevation is c.2100 metres above mean sea level. The area has a wider coverage of a major perennial crop, enset. There is little enset in Anshebesso and almost none in Dalocha-Talikessa. According to information from local people, this is an area where male migrations are common and women assume greater responsibilities in day-to-day household activities. Dalocha-Talikessa Dalocha-Talikessa is adjacent to the town of Dalocha, the capital of Dalocha woredas of Silti Zone, located south-east of Butajira, at a distance of c.170 km from Addis Ababa. It is a lower Woina-Dega area with an average elevation of slightly less than 2000 metres above mean sea level. As in many other parts of Ethiopia, at this altitude perennials are
8

not very common. Climatic variations are much more common compared to the other two study areas. The level of dissection of land in much of the area is also much less as the slopes are very gentle. The major crops grown in the area are maize, teff and millet. The holding sizes also appear to be better. The level and pattern of migrations and the role women play in the support of their families is somewhat different from the other two kebeles. 1.4 Methodology The major sources of data for this study are household questionnaires, group discussions, and informal conversations with some knowledgeable and elderly persons in the respective areas. Discussions have also been held at various times with people in government offices, particularly in Agricultural and Rural Development offices. Obviously, some important inputs to the study come from personal observations. Questionnaires were sent to 180 sample households: 60 from each of the three study kebeles. The households were systematically drawn from random lists obtained from kebele offices. Two intensively trained young men administered the questionnaires to the selected households in each kebele. Most of them already had some experience of this type of work. Group discussions involved elderly persons, women and young men. In each case, six to ten people were involved. As the study is basically descriptive, mostly tables and some descriptive statistics are used in the analysis. 1.5 Limitations At the time of conception and proposal of this study we believed that we could stay in the study areas for a much longer period of time and make extensive and detailed studies of the items proposed than we were actually able to. Unfortunately, due to various factors, mainly to very heavy teaching, advisement and administrative commitments in the department, we have admittedly fallen somewhat short of what we anticipated, both in depth and breadth.
9

2. The Study Area 2.1 Location and Topography All of the study Peasant Administrations of the Link project are located within the catchment of the river Dijo, a river with many tributaries, most which have little or no water during dry season (Maps 1 and 2). While much of the area is in Silte woreda, the highest parts included in the catchment area are from Alicho Wirero woredas and the lowest are from Dalocha woreda. The elevation generally varies between c.3100 meters above mean sea level at Qao-Qoto of Alicho Wirero and 1960 metres at Dalocha town of Dalocha woreda. The area has a general north-west to south-east inclination.
10

Map 2: Altitude and drainage pattern of the study area.
11

2.2 Climate and Vegetation The temperature and the rainfall conditions of the area generally vary with the general elevation of the area. No climatic data is available for Alkesso, Dalocha or Worabe. For this reason, the climatic data of stations which are not far distant and not much different in elevation may serve as approximations for the situation at the study sites. In Table 1, the data for Butajira are used to show the climatic conditions in Alkesso and Worabe area while data for Zeway, located north-east of Dalocha and a town in the same agro-climatic zone and with a high degree of resemblance, are used to give some indication of the climatic conditions of Dalocha and its surroundings. Table 1: Mean monthly rainfall and mean monthly temperatures for Butajira (1986–2003) and Zeway (1985–2005).
Butajira Zeway Month Mean monthly
rainfall (mm) Mean monthly
temp (°C) Mean monthly rainfall (mm)
Mean monthly temp (°C)
January 32.1 18.7 15.9 19.4 February 80.6 19.2 31.6 20.7 March 152.1 19.6 53.0 21.8 April 143.8 19.5 79.9 21.8 May 104.0 19.6 70.2 22.1 June 145.6 18.7 81.8 21.3 July 171.6 17.4 143.2 19.8 August 161.5 18.1 116.1 19.9 September 117.5 18.9 79.1 20.2 October 48.0 19.1 34.9 20.0 November 11.6 19.2 2.3 19.2 December 19.1 17.6 5.3 18.6 Source: National Meteorological Services Agency, NMSA The mean monthly rainfall data for the two areas shows that both Butajira and Zeway are in the summer maximum rainfall area, while Butajira area, at a higher altitude, generally experiences greater amount of rainfall. The annual average rainfall over the 15-year period for Butajira is 1200.5 mm, while it is 713.3 mm for Zeway over a period of 21 years. As can be expected, variations in mean monthly rainfall are higher for Zeway. If amounts for specific months over the years are examined, the level of variability is found to be much higher. In both cases, like many other areas in the summer maximum rainfall area in the country, November, December, January and February are months with the lowest amounts of moisture. The annual average temperature for Butajira is 18.8°C, and all the mean monthly temperatures are not much different (Table 1). For Zeway, which is below an elevation of 2000 metres above mean sea level, the average annual temperature is significantly higher at 20.4°C, with obvious implications for moisture effectiveness.
12
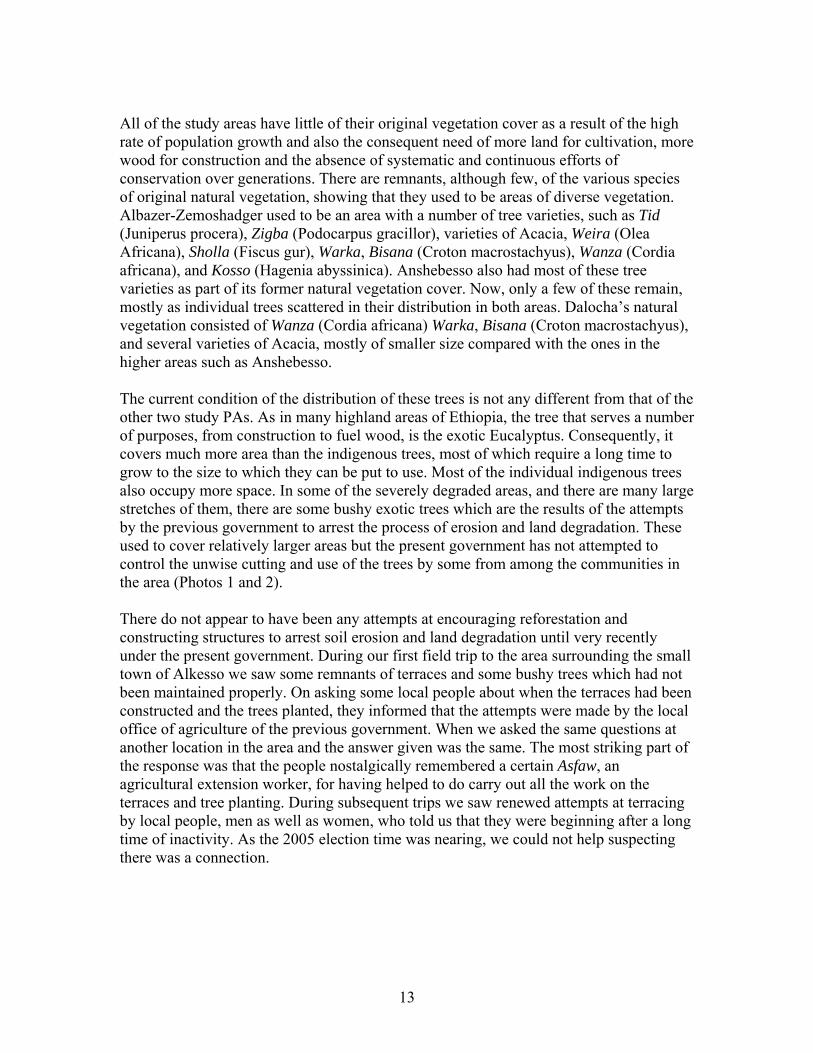
All of the study areas have little of their original vegetation cover as a result of the high rate of population growth and also the consequent need of more land for cultivation, more wood for construction and the absence of systematic and continuous efforts of conservation over generations. There are remnants, although few, of the various species of original natural vegetation, showing that they used to be areas of diverse vegetation. Albazer-Zemoshadger used to be an area with a number of tree varieties, such as Tid (Juniperus procera), Zigba (Podocarpus gracillor), varieties of Acacia, Weira (Olea Africana), Sholla (Fiscus gur), Warka, Bisana (Croton macrostachyus), Wanza (Cordia africana), and Kosso (Hagenia abyssinica). Anshebesso also had most of these tree varieties as part of its former natural vegetation cover. Now, only a few of these remain, mostly as individual trees scattered in their distribution in both areas. Dalocha’s natural vegetation consisted of Wanza (Cordia africana) Warka, Bisana (Croton macrostachyus), and several varieties of Acacia, mostly of smaller size compared with the ones in the higher areas such as Anshebesso. The current condition of the distribution of these trees is not any different from that of the other two study PAs. As in many highland areas of Ethiopia, the tree that serves a number of purposes, from construction to fuel wood, is the exotic Eucalyptus. Consequently, it covers much more area than the indigenous trees, most of which require a long time to grow to the size to which they can be put to use. Most of the individual indigenous trees also occupy more space. In some of the severely degraded areas, and there are many large stretches of them, there are some bushy exotic trees which are the results of the attempts by the previous government to arrest the process of erosion and land degradation. These used to cover relatively larger areas but the present government has not attempted to control the unwise cutting and use of the trees by some from among the communities in the area (Photos 1 and 2). There do not appear to have been any attempts at encouraging reforestation and constructing structures to arrest soil erosion and land degradation until very recently under the present government. During our first field trip to the area surrounding the small town of Alkesso we saw some remnants of terraces and some bushy trees which had not been maintained properly. On asking some local people about when the terraces had been constructed and the trees planted, they informed that the attempts were made by the local office of agriculture of the previous government. When we asked the same questions at another location in the area and the answer given was the same. The most striking part of the response was that the people nostalgically remembered a certain Asfaw, an agricultural extension worker, for having helped to do carry out all the work on the terraces and tree planting. During subsequent trips we saw renewed attempts at terracing by local people, men as well as women, who told us that they were beginning after a long time of inactivity. As the 2005 election time was nearing, we could not help suspecting there was a connection.
13

2.3 Observable soil erosion and land degradation As outlined in the Location and Topography section, the general inclination of the area is from north-west to south-east, towards Dalocha town. At least four major streams, Demegeren, Kalid, Zewiyat and one other stream, drain into Dijo river. Demegeren passes just to the east of Alkesso and Kalid to the west of Alkesso. Zewiyat flows right through the centre of the area, while the other major stream flow down from the northernmost part of the catchment area, through the western part of the study area, passes close to Worabe and joins Zewiyat a little south of Worabe. Each of the streams has many tributaries most of which are dry during dry seasons. However, they carry immense quantities of water from the remaining thin layers of soils into the major streams which ultimately carry the water into Dijo. This, at least partly, has contributed to the development and expansion of many large gullies and near-complete removal of soils over a very extensive area, the worst of which of which is to be found around the town of Alkesso. There can be little doubt that the underlying rock and the nature of the soil, together with the land tenure and management systems over the years, have played their role in the loss of soils and laying extensive areas of land as nearly waste. The approximate magnitude of the problem can be seen from the photographs taken around the small town of Alkesso and the capital of the Silte Zone, Worabe (Photos 1 and 2). In the worst affected areas, there are very small and scattered plots with very shallow soil depth, cultivated by farmers who lack better land for cultivation. Apart from the usual economic and social considerations, this practice seems to have added to land fragmentation. It is common to see very large tracts of land with extremely thin or little soil left to serve as poor grazing, with a thin cover of some bushes and eucalyptus trees. Some of the trees are the remnants of the reforestation attempts of the Derg government (Photos 1 and 2).
14

Photos 1 and 2: Some of the severely eroded landscapes of the study area.
15

2.4 Settlement Patterns and Housing
2.4.1 Settlement Patterns The settlements are dispersed in the sense that there are no large numbers of community members found together at one place. However, there is a tendency for a relatively large number of extended family members to have houses within very short distances from one another. The only time when grouped settlements emerged in most parts of southern Ethiopia was during the ideologically and basically forced villagization programme of the Derg. This programme was reversed in practically all areas following the issuance of the mixed economy policy by the regime in 1990, shortly before its demise. The density of the settlements clearly reflects the availability of the increasingly diminishing important resource of the area, namely cultivated land. Immediately adjacent to the main road to Hossana, particularly from around Alkesso to Worabe, settlements are lightly scattered. They are found on the few scattered patches of cultivable land, surrounded by severely degraded relatively large stretches of uncultivable land, and in some cases by gullies of various sizes. This patchy nature of the cultivable land has had the effect of limiting the number of houses in each of the homesteads to very few.
2.4.2 Construction Materials and House Types Generally, the houses in the study area, as in many adjacent areas, are constructed from locally available materials, such as eucalyptus trees, bamboo, indigenous coniferous trees (tid), and some other tree species. Enset fibre, most often together with wodero, is used to tie the vertical and horizontal poles used in the construction of walls and roofs. Construction materials in the area are scarce. Even so, from the responses of the sample households, the majority evidently obtain much of the construction materials from their own land. Many also purchase many of the materials from others, while a few acquire some or all of the materials as gifts from relatives and/or friends. Whether the materials are obtained from people’s own land or in other ways, transporting them takes a variable amount of time. Generally, transporting from within a person’s own land takes the least amount of time, 10 minutes or less. In other cases, the time taken can substantially more and many reported travelling up to 30 minutes, while some took between 30 minutes and one hour. There were also people who travelled for over one hour. Since very little of the natural vegetation remains and planted trees are not yet sufficient, the scarcity of most construction materials is bound to increase with the increase in population under the prevailing situation of landownership and management.
16

The floor plans of the houses are mostly circular while the roofs are conical in shape. The walls are plastered with mud and the roofs are thatched with grass. it is also possible to find a very few widely scattered houses with corrugated iron roofs (Photo 3) (Figure 1).
Photo 3: Typical houses in the study area. The sizes of the houses and the quality of workmanship vary depending on the socio-economic status of the owners. The local availability of appropriate construction materials also plays a role in determining size. Depending on the socio-economic status, a family may have two houses, one big and one small. In some cases, the smaller house could be mainly for housing livestock and the bigger one for people. In other cases, the smaller one may be kept for guests while the family shares the bigger one with livestock. As this is a predominantly Muslim area, some families have a third house that serves as a mosque. Thus, not only the size and quality, but also the number of houses in use is a reflection of the socio-economic status of a family. In cases where the big house is shared between family and livestock, there is a fireplace at the centre near the central supporting post. Upon entering the house, there is generally a cattle pen to the left-hand side and a living and sleeping area for people on the right-hand side. The right half is divided into two: the sheltered back area is for sleeping and front is used as a living area. The livestock side is partitioned to accommodate cattle, calves and other animals, such as donkeys, horses or mules (Figure 2).
17

Stable (cattle)
Stable (calves)
Living Room
Front AreaFireplace
Fig. 1: The interior of a typical house in the study area.
18

Door
Living Room
S t a b l e f o r
C a t t l e
Bedroom
Kitchen
Fireplace
Stable (calves)
Fig. 2: Floor plan of a typical house in the study area.
19

2.4.3 Construction Materials, Fuel Materials and Conservation Efforts Even casual observation shows that the study area is experiencing materials for construction and fuel wood problems. Sample household heads and a number of other people were asked about the magnitude of the problem. Most of them felt that the problem is very serious while many others felt that it is serious. Only a few of them felt that the problem is not so serious. Regarding the causes of the materials problem, most considered that increases in population density, expansion of farmland, problems relating to land tenure, and little land for planting trees are important factors. Surprisingly, very few mentioned deforestation among the causes of the problem. However, it can be seen that people are aware of both population growth centred factors and institutional problems relating to the prevailing land tenure system. Most households, over 90%, use mainly wood for fuel. In addition, some of them use dung cakes to supplement fuel wood. Very few people use dung cakes as a primary source of fuel in Anshebesso compared to in Albazer-Zemoshadger and Dalocha-Talikessa. Very little of the enset residues are used for fuel in Anshebesso. The responses of the sample households clearly indicate that the primary sources of fuel wood are the few shrubs and bushes on the community land, followed by trees and bushes from own holdings. A few households also purchase fuel wood and dung cakes from others. Many of the people have various ideas concerning ways of overcoming the problems, not only of fuel wood but also of construction materials. Frequently mentioned remedial actions included controlling population growth, planting trees in areas under serious threat of erosion, raising the level of awareness regarding the importance of afforestation of community lands, and planting trees on individual holdings. Discussions with Dalocha woreda Environmental Protection Office Staff in mid-May 2004 revealed that attempts had been made to undertake conservation activities with the participation of the local people. The attempts focused on constructing structures, mainly terraces, both off-farm and on-farm. Water diversion ditches had also been dug. Efforts also included identifying severely degraded areas for protection and planting trees which could be used for fuel wood, construction and fodder. This work has been supported by funds from the European Union in terms food for work and cash for work. It is said that the European Union support lasted up to the year 1993. Similar efforts were supported on private holdings by Action Aid until very recently. However, it was indicated that only 30–40% of the work undertaken had survived because the same people destroyed most of the inputs, either for food or to increase the size of their farmland, or both. Evidently most of the attempts did not leave very positive and lasting marks, most likely because the general policy environment and the way things were managed did not create a sense of ownership in the hearts and minds of the communities concerned. However, the
20

problems with previous attempts at implementation, and how implementation can be improved in the future have not been fully discussed. 3. Aspects of Population and Socio-Economic Conditions of the Study PAs 3.1 Population Distribution As briefly outlined in the section on settlement patterns (2.4), settlements in the study area are dispersed in the sense that there are not large numbers of community members living in any one place. However, there is a tendency for a relatively large number of extended family members to have houses within very short distances from one another. Generally, in terms of crude density the area may not be among the most densely settled places of the region but in terms of land resources close observation shows that some of the most densely settled areas with better land resources offer better agricultural opportunities. Hence, if agricultural densities were to be calculated for the study areas they would, perhaps, be even higher. The only time grouped settlements emerged in most parts of the south of the country, including the study area, was during the ideologically and basically forced villagization programme of the Derg. It was reversed in practically all areas with the issuance of the regime’s mixed economy policy in 1990, shortly before its demise. 3.2 Population Characteristics 3.2.1 Size of Household As indicated in the Introduction, 180 sample households from the three PAs were studied, of which 19 (about 10%) were female headed. Ten of the female-headed households in the sample were from Anshebesso (Table 2). This is very low when compared to the percentage of female-headed households in SNNPR (23.3%) as well as the country as a whole (24.7%) (CSA 2004). However, since the sample in this case is quite small, such comparisons may not be entirely valid. Table 2: The distribution of sample household heads by sex.
Study PAs Males Females Total Anshebesso 50 10 60 Albazer-Zemoshadger 55 5 60 Dalocha-Talikessa 56 4 60 Study Area 161 19 180 The mean age of the heads of households in the study PAs is about 45 years. As can be seen from Table 2, the mean age of the heads of households for Anshebesso is nearly 49
21

while it is significantly less for Albazer-Zemoshadger and Dalocha-Talikessa (43.60 and 43.15, respectively). Nearly 96% of the household heads are married while the remaining few are widowed, and there seems to be little variation across the study PAs in this regard. A significant number of male heads of households (23.6%) have two wives. Again, Anshebesso stands out sharply with 40% of male heads of households having two wives, despite the fact that Anshebesso is located in an area with severely degraded land resources. The average size of household for the study PAs is 7.3. Here too, the household size for Anshebesso is the highest (7.5). Apparently, there is some relationship between these statistics and the mean age of heads of households and the number of wives, as shown in Table 3. Generally, the average size of household in this area is much higher than both regional (5.16) and national (5.15) estimates (CSA 2005). Table 3: The distribution of sample households by average age of household heads, marital status, number of wives, and size of household.
Marital Status Number of Wives
Study PA
Mean Age of Household
Heads married widowed one two
Average Size of Household
Anshebesso 48.95 57 3 30 20 7.47 Albazer-Zemoshadger
43.6 58 2 48 7 7.15
Dalocha-Talikessa
43.15 57 3 45 11 7.22
Study Area 45.23 172 8 123 38 7.28 As can be seen from the distribution of household size by classes (Table 3), the average size of sample households for the three PAs varies between 3.8 and 7.3. The average for the class of less than 5 is 3.8, while it varies for all other classes, including the uppermost where the averages are greater than 12. While this could show the extent of variation in the size of households, it is good to note that most households have members between 5 and 10 members. Table 4: Mean size distribution of sample households of the PAs by size categories.
Number of Persons per Household Study PA <5 5-6 7-8 9-10 >10 Total
Anshebesso 3.8 5.7 7.4 9.6 12.2 7.5 Albazer-Zemoshadger
3.8 5.6 7.5 9.3 12.7 7.2
Dalocha-Talikessa 3.8 5.7 7.5 9.2 13.5 7.3 Study Area 3.8 5.7 7.4 9.3 12.5 7.3
22

In cases where there are two wives, the number of children born to the senior wife is generally greater: the average is 5 for the study PAs. Again, the number tends to be greater for Anshebesso where greater numbers of male household heads have two wives. 3.2.2 Population Increase and Movement Population growth is the result of the three elements of population dynamics – births, deaths and migration. Establishing the exact level of the growth of population based on these three PAs and the small number of sample household is not the aim of this study. Instead of trying to find out exact figures for births and deaths for the sample households, only the number of births, attitudes towards birth and whether there is knowledge and use of family planning methods are taken as indicators of population growth. Certainly, this is done with the knowledge that mortality and morbidity conditions are not significantly different from other areas in the region. It seems that the area experiences significant population movement, both permanent and seasonal migration, possibly the latter more than the former. However, the level of permanent migration cannot be assumed to significantly reduce the growth of population and sufficiently offset the pressure of population on land resources in the area. Migratory movements will be briefly discussed later in this paper. 3.2.3 Some Indicators of Unabated Population Growth Table 5: Distribution of the Average Number of Children Born to the Senior Wife and Average Number of Wives in the Households by PAs.
Children Born to the Senior Wife Study PA Number of Wives (average) Males Females Both Sexes
Anshebesso 1.35 2.5 2.7 5.1 Albazer-Zemoshadger 1.12 2.3 2.4 4.7 -Talikessa 1.20 2.2 2.3 4.6 Study Area 1.22 2.3 2.5 4.8 Table 5 shows a summary of responses to questions regarding optimum, actual and desired additional numbers of children. The sum of the actual and desired additional number of children is almost the same as the optimum number of children for the study area. For Anshebesso PA the two numbers are equal, while for Albazer-Zemoshadger the optimum is greater and for Dalocha-Talikessa it is less. With larger samples the differences could be insignificant. What is significant, however, is the fact that the number of children per household is very large, but there still exists a desire for significant number of additional children.
23

Table 6: Mean Optimum, Mean Additional Desired, and Desired +Actual Number of Children in the Households.
Study PA Mean Optimum No. of Children
Mean Additional Children Desired
Desired + Actual A/C
Anshebesso 6.68 1.78 6.83 1.00 Albazer-Zemoshadger
7.82 2.28 6.97 1.12
Dalocha-Talikessa 5.13 1.43 5.98 0.86 Study Area 6.60 1.83 6.59 1.00 An attempt was made to determine the number of live births during the 12 months preceding the survey (Table 7). The reported number of live births in the 180 sample households was 53 (29.4%). This means that nearly one-third of the sample households had live births, which is a high rate of reproduction for an area with a serious land resource constraint during years of infant mortality rates which can be considered normal for the area. The percentages of live births among the three PAs vary, with the highest for Anshebesso (31.7%) and the lowest for Dalocha-Talikessa (26.7%). Table 7: Distribution of Sample Households with or without Live Births in the Preceding 12 Months.
Study PA With Live Births Without Live Births Percentage with Live Births
Anshebesso 19 41 31.7 Albazer-Zemoshadger 18 42 30.0 Dalocha-Talikessa 16 44 26.7 Study Area 53 127 29.4 It seems that no significant attempts have been made to lower birth rates. The majority of the heads of the sample households, 54 in Anshebesso and 48 in Albazer-Zemoshadger, said they had no knowledge of family planning methods. In Dalocha-Talikessa the situation is radically different, as 59 claimed to know about family planning methods. However, as the methods were not being practised in any of the households, the knowledge must have been acquired very recently (Table 8). In fact, when it comes to practice, Albazer-Zemoshadger has a significant number of households followed by a few in Anshebesso.
24

Table 8: Distribution of Sample Households by Knowledge and Use of Family Planning Methods.
Study PA Neither Know nor
Use
Know but Don’t Use
Know as Well as Use
Total
Anshebesso 54 1 5 60 Albazer-Zemoshadger
48 0 12 60
Dalocha-Talikessa 1 59 0 60 Study Area 103 60 17 180 More or less the same applies to the knowledge of the Government Population Policy issued in 1993 (Table 9). Of all the heads of sample households only 64 knew something about the policy. Again, 59 of those who claimed to know about the Population Policy are from Dalocha-Talikessa while only 5 are from Anshebesso. Paradoxically, in Albazer-Zemoshadger, where 12 households claimed to be practicing some kind of family planning method, none claimed to know about the Population Policy. It is evident that the issuance of the policy has not been followed up by systematic awareness creation efforts and the provision of the necessary family planning services and supplies. This points to the fact that the situation of reproduction continues to be the same as that of generations in the past, regardless of changing socio-economic conditions. It appears that the resource implications of numbers’ are not fully appreciated yet, as in most other rural areas of Ethiopia. Table 9: Distribution of Sample Households by Knowledge of Government Population Policy of 1993.
Study PA Know Don’t Know Anshebesso 5 55 Albazer-Zemoshadger 0 60 Dalocha-Talikessa 59 1 Study Area 64 116 3.2.4 Division of Labour In rural societies men, women, and children aged of seven or eight years and older participate in various activities to sustain households. Generally, women are engaged in everyday household chores such as the preparation of food, cleaning the house, and fetching water from springs or rivers. In many cultures, women do even more. Men are usually engaged in farming activities, which include land preparation, ploughing, planting/sowing, weeding, and harvesting. In areas of sedentary agriculture, men also construct houses. Female children usually assist their mothers in most of what they do,
25

including caring for younger children in the family. Male children assist their fathers or elder brothers in farming and other activities that are within their capacity (Photo 4). They usually tend livestock during day time. Both female children and male children often collect fuel wood.
Photo 4: A small child aged eight or nine years engaged in ploughing. Basically, the division of labour in the study area is not very much different from the general pattern in sedentary agricultural areas of Ethiopia. However, women do many more things in addition to engaging daily domestic chores. In a group discussion in Albazer-Zemoshadger and Anshebesso, and earlier by the staff of the Offices of Rural Development in Dalocha and Silte it was acknowledged that during peak agricultural season men work approximately 6–7 hours per day while women work continuously from sunrise to bedtime. The survival of the households in the study area is dependent upon women more than men, as will be discussed later in this paper. 3.2.5 Enrolment and the Desire for Child Education The responses to the question concerning the number of children attending school indicate that a substantial number of children are in school from each of the sample households. Table 10 shows that, on average, significantly greater than two persons
26

attend school from each of the sample households. Most of these, however, are in local schools which provide education mostly up to Grade 8. Only a very small fraction of them are in schools elsewhere that are basically secondary level. More males attend school than females. Our informal conversations with some local people as well as with the enumerators (also local) about education in the area showed that the number of people with college education and working with it is not significant. Hence, education has contributed little or nothing towards relieving the pressure of population on local land resources. Table 10: Distribution of the Average Number of Persons Attending School from the Sample Households in the Study PAs.
In Local Schools In Schools Elsewhere
Total Study PA
Males Females Both Sexes Both Sexes Anshebesso 1.10 1.07 0.17 2.34 Albazer-Zemoshadger 1.03 0.87 0.02 1.92 Dalocha-Talikessa 1.43 0.78 0.00 2.21 Study Area 1.19 0.91 0.06 2.16 Very few parents wish to limit the education of their children to below Grade 10. However, although most parents want their children to be educated at college, it was hard to find persons with college education in the sample PAs (Table 11). Table 11: The Distribution of Parents by Desired Level of Education for Their Children.
Grade Level PA 1-8 9-10 11-12 College Total
Anshebesso 1 0 1 56 58 Albazer-Zemoshadger 1 6 10 31 48 Dalocha-Talikessa 0 1 18 36 55 Study Area 2 7 29 123 161 Only a few families had children attending high schools. Although the area is much closer to Kembata and Hadiya zones, with generally high levels of enrolment and education, it is far behind in terms of both student enrolment and motivation. The fact that almost all of the people are Muslim might be the reason for this situation. The inclination of the Muslim population is mostly towards trade. However, the general lack of families’ financial resources to enable them to send and keep their children in school is also one of the factors for the low level of education. Until the situation changes for the better it is unlikely that many children will continue to higher levels of education.
27

Some parents did not express what level of education they desired for their children, either because they were not able to send their children to school for various reasons or because their children were not yet of school age. 4. Livelihoods in the Study Area In this paper, livelihood simply refers to the means of subsistence in a general way. The aim is to shed some light on the different ways people use to make a living. In most rural communities the basic means of subsistence is agriculture. However, in areas where sizes of holdings are small or the quality of agricultural land is poor, or both, many households depend in a significant way on non-agricultural activities to meet many of their basic needs. The study area is one such area, and the following is an attempt to briefly discuss the livelihoods of the study area in the sense in which the term is defined here. 4.1 Land Use, Size of Holding and Problems of Agriculture 4.1.1 Land Use and Major Crops Close to 60% of the total land area in Silte and Dalocha woredas is cultivated. Of the total land area, perennials occupy 9.5% in Silte and 6.7% in Dalocha. Table 12 shows that both woredas have very small areas which could be cultivated, only 5.1% in Silte and 3.9% in Dalocha. The percentage of grazing land is much greater in Dalocha than in Silte. In Table 12, land classified as ‘others’ is that which cannot be put to any immediate use, and this accounts for a very large portion of the land in Silte and quite a substantial portion in Dalocha. If bush and scrubland are included, then the portion of land which cannot be used for cultivation increases to 25.8% in Silte and 19.2% in Dalocha. Table 12: Land Use Types in Silte and Dalocha woredas (2003/2004).
Silte Dalocha Land Use Type Area (ha) Per cent Area (ha) Per cent
Cultivated 26595 58.3 41475 58.5 Cultivable 2323 5.1 2786 3.9 Grazing 4945 10.8 13105 18.5 Bush & Scrub 2094 4.6 3736 5.3 Others 9647 21.2 9826 13.9 Total 45604* 100.0 70928* 100.0 Annuals 22263 48.8 36735 51.8 Perennials 4332 9.5 4740 6.7 Grazing 1945 10.8 13105 18.5 All Others 11741 25.8 13562 19.2 Source: Rural Development Office, Silte Zone (percentages calculated by the author). * Adjusted as land use types add up to these figures. Respective original figures for Silte and Dalocha were 46,359 ha and 71,895 ha.
28

The major crops of both Silte and Dalocha are maize, wheat, sorghum, barley, teff, and pepper. Some beans and peas, including haricot beans, are also cultivated. In rank order, maize, wheat, sorghum, teff, and barley cover the largest area in Silte, and maize, teff and wheat cover the largest area in Dalocha (Table 13). Table 13: Major Crops of Silte and Dalocha woredas by Area and Yield (2003/2004).
Silte Dalocha Major Crops Area (ha) Production
(quintal) Yield (quintal)
Area (ha)
Production (quintals)
Yield (quintals)
Maize 7345 85291 11.6 10102 147819 14.6 Sorghum 1875 24375 13.0 3919 31672 8.1 Wheat 5647 76956 13.6 7972 79933 10.0 Teff 2682 14356 5.4 9008 52995 5.9 Barley 1357 14760 10.9 200 1600 8.0 Peas 845.5 4704 5.6 65 290 4.5 Beans 541 3246 6.0 104 568 5.5 Haricot Beans
121 242 2.0 157.5 1275 8.1
Pepper 1508 5789 3.8 192 1152 6.0 Source: Rural Development Office, Silte Zone Note: figures for yield are calculated by the author Yields for most crops in Ethiopia are among the lowest in the world. For instance, the 2004/05 meher (main season) yields for maize, sorghum, wheat, and barley were 17.2, 13.7, 15.6, and 12.1 quintals/ha, respectively (CSA 2005a: 13). National figures for the season for teff, beans and field peas were 9.5, 11.9 and 8.9 quintals/ha. Yields of most major crops in the study area are much lower than even these very low figures. This could be a reflection partly of the poor state of the soils and partly insufficient use of appropriate fertilizers. As can be seen from Table 13, the yields of maize, sorghum, wheat, and barley are respectively 11.6, 13.0, 13.6, and 10.9 quintals/ha for Silte. The respective figures for Dalocha are 14.6, 8.1, 10.0, and 8.0 quintals/ha. Except for maize and haricot beans, yields are generally higher for Silte than Dalocha. A crop that occupies large areas in both Silte and Dalocha, but which has one of the lowest yields is teff, the staple food crop for the urban population of the country. Like other summer maximum rainfall areas of Ethiopia, under normal conditions, the study area also has two rainy seasons. The season of the big rains is summer – June, July, August, and parts of September. The belg season has periods of smaller rainfall during the months of February, March and April. Some crops, such as maize and sorghum, are cultivated during the belg season. Depending on the agro-climatic conditions, the types of crops grown differ. Preparation of land, particularly ploughing, for the crops of this
29

season begins in February and sowing, weeding and protection continue through the months of March, April and May. Preparation for the main rainy season crops of wheat, barley, beans, peas, teff, and some other crops begins in May. Most of these crops are sown during the months of June and July. August is the month of weeding for most of these crops. Harvesting of some the crops starts around mid-October, and continues up until December, depending on the time of sowing and the pace of maturation of a given crop. By far the largest amount of production, over 90%, is during this season. Although there are certain activities to be done, the months of December, January, February, and part of March are not busy months for the male population. 4.1.2 Size of Holding and Land Tenure This is one of the areas in Ethiopia where landholdings are generally small. As can be seen from Table 14, the sample households have an average of 4.1 timads of land. The averages calculated for the sample households in the three PAs, Anshebesso, Albazer-Zemoshadger, and Dalocha-Talikessa, are 0.82 ha, 1.1 ha and 1.14 ha respectively, and the average for the three is 1.02 ha. The average from the survey data (4.1 timads) is also approximately 1.02 ha, and in an area with seven or more persons in a household the average is only 0.14 ha per person. In fact, the average for the households is somewhat exaggerated by relatively larger sizes of holdings in Dalocha-Talikessa PA. Dalocha-Talikessa’s problem is not one of small landholdings but of highly variable rainfall. Table 14: Mean Size of Landholdings (in timad) in the Study PAs by Sex of Household Head (HH).
PA All Sample HHs Males Females Anshebesso 2.9 2.9 2.6 Albazer-Zemoshadger 4.1 4.2 3.6 Dalocha-Talikessa 5.3 5.4 3.5 Study Area 4.1 4.2 3.1 Note: 1 timad is approximately one-quarter of a hectare When this is looked at, in the case of the other two PAs, in the light of the fact that most of the holdings are small patches with thin soil cover it becomes all the more clear that people live a very precarious life. In this regard, the condition of the households in Anshebesso, where landholdings are very patchy, is even worse. Here, the size of land is small and the quality very poor. The variation in landholding size among the PAs is quite conspicuous from field observations, as well as from the mean sizes of holdings (Table 14). In addition, there is a clear difference between households with male and female heads: in all the three PAs, households with female heads have less land.
30

Generally, there seems to be an increase in the size of landholding with the age of the head of household (Table 15). The fact that households were assigned land on the basis of the number of members in the household after the Land Reform Proclamation of 1975 has accounted for the pattern, as the households with the older heads tended to have larger numbers of members. However, as some households with relatively young heads may also have had larger numbers of members than some households with older heads, there cannot be a direct correlation between the two. Table 15: Mean Size of Landholdings (in timad) by Age of Household Heads (in years).
PA <35 35-44 45-54 ≥55 Anshebesso 2.2 2.5 2.8 3.5 Albazer-Zemoshadger 4.2 3.6 5.0 4.0 Dalocha-Talikessa 3.9 4.8 6.3 6.0 Study Area 3.8 3.7 4.7 4.2 As already stated, households were assigned land on the basis of household size following the Land Reform Proclamation in 1975. The land use pattern in most parts of the area was disrupted only during the villagization programme of the previous government. With the demise of the programme, mostly households returned to their original locations. Hence, it appears that the pattern of landholdings following the proclamation has been maintained in the study area for three decades. This is one of the areas where there have not been several periodic redistributions after the first distribution of land among peasant farmers. Table 16 shows how the size of holding invariably increases with the size of households for the three study PAs. This is not only a reflection of the initial criterion of distribution but also of the fact that younger household heads have been receiving small plots of land from the holdings of their parents, as the PAs do not have a land pool from which to give land to newly forming families. In fact, as will be seen later in this paper, there are many landless people and some incidences of conflict between children and parents, and/or among siblings. Table 16: Size of Landholding by Size of Household.
Household Size PA ≤5 6-8 >8
Anshebesso 2.1 2.8 3.6 Albazer-Zemoshadger 2.8 4.5 4.6 Dalocha-Talikessa 5.1 5.1 6.0 Study Area 3.0 4.3 4.6 Size of holding also varies with marital status and number of wives. The sample households included only married and widowed heads of households, and widowed heads of households are invariably women. As can be expected, widowed heads of households
31

have much fewer landholdings compared with married male heads of households (Table 17). The number of wives is another factor of variation in landholding among households. Men with two wives have more landholdings than those with one wife. This is primarily because those with two wives generally have larger numbers of members in their households. Table 17: Mean Size of Landholding by Marital Status and Number of Wives.
Marital Status No. of Wives PA Married Widowed One Two
Anshebesso 2.9 2.3 2.7 3.2 Albazer-Zemoshadger 4.2 2.0 4.0 5.4 Dalocha-Talikessa 5.4 4.0 5.3 5.6 Study Area 4.2 2.9 4.1 4.3 As a consequence of land not being redistributed among households following the redistribution after the Land Reform Proclamation, sons forming families have been receiving plots of land from their parents’ holdings, depending on the availability of land. In many cases, older sons have received small plots while the younger ones have received little or no land. The result of this has been relatively large numbers of either landless young people or families with tiny plots which are far from sufficient for meeting their survival needs. As can be expected, in many instances in almost all three study PAs insufficient land has resulted in conflicts between sons and parents, and among siblings, or intergenerational and intra-generational conflicts, as Teferi (1992) terms it. Fathers are often blamed for giving their older sons larger plots and the younger ones smaller plots, or giving the older ones some land and denying the younger ones. It was reported that some of the conflicts go to the extent of becoming court cases. However, the courts usually turn the cases over to the PA administrations, and the PA administrations in turn pass them to the community elders to resolve. Under the prevailing farmland scarcity there is no way that such issues can be resolved to the satisfaction of both sides. Cases have been reported where elders have given charge of cultivating the land and caring for elderly parents to the sons who complained about land. However, as a group discussion in Dalocha revealed, in most families siblings make an agreement between or among themselves as to who has to go to town or wherever there are opportunities for work and who has to stay behind. The ones who leave would help the family in paying tax and buying clothes, while the ones who remain behind would undertake the farming activities for the family.
32

4.1.3 Share Cropping and Other Contractual Arrangements Share cropping and other contractual agreements are quite common in most agricultural systems and areas. Such agreements become much more common in economic systems where the buying and selling of land is not permissible. In fact, their magnitude increases with the scarcity of farm land. Since the Land Reform Proclamation of 1975, this has been the case in Ethiopia and various sharecropping and contractual agreements are practised in the study area. These agreements are briefly discussed in the following. It was reported in the group discussions held in all the three PAs that sharecropping is common practice. The share of the product between the landholder and sharecropper depends on the contribution of the seeds and fertilizers. Most often, for an equal share of the product, the sharecropper contributes half of the seeds and ploughs the land with his oxen. He also does the weeding, harvesting and threshing. Sometimes, fertilizer is shared, seeds are provided by the sharecropper and the product is equally shared. At other times, an agreement is made to give a certain amount of the produce to the landholder and for the sharecropper to take the rest, whatever the amount. This was reported as being much less common. Contracting out land is also practised by some households, in a form locally known as woledagid. This form is mostly practised by households which are not able to meet the basic needs of their members for various reasons. It is a type of contract whereby the person contracting in the land gives the landholder a certain amount of money upon the return of which the land will be given back to the landholder. Most often, those who have contracted out the land fail to pay back the money and the land continues to be used by the person who contracted it in. It was reported that this also leads to serious disputes between the two parties, to the extent of becoming court cases. Frequently, the cases are turned back to PA Offices which in turn pass them over to community elders. The decisions are made mostly in favour of the persons who have contracted in the land. The root cause of this is that the agreement does not envisage a reduction of any amount from the initial payment for each season or year the land has been used by the person who contracted it in. We were told in Albazer-Zemoshadger PA that woledagid is no longer accepted as a legal arrangement by the PA Office because of its impact on the very poor. Under the existing land tenure law it is not possible to sell or buy land. However, there exists a disguised form of selling and buying, as has also been reported for various other areas. Under this system, land is contracted out for money for decades, for instance, for as many as 30 years. Most often, it is the elderly and female heads of households that are disfavoured by these types of agreements, while those with oxen and relatively large holdings have the advantage. In relatively rare cases, this could be one of the ways hard working landless or near landless young men from families with oxen partly earn their living. Able bodied persons with neither land nor oxen cultivate the holdings of people with oxen in return for a one-third share of the produce.
33

As indicated earlier in the discussion on landholding, the average size of holding for the three PAs together is 1.02 ha. In this area of continuing high population growth, where agricultural practices have not shown any significant change in the positive direction due to a number of intertwined problems (like most other parts of Ethiopia), population size is bound to double in a matter of 24 or 25 years. This means that average sizes of holding will fall to only 0.5 ha. It can also be assumed that a significant portion of the current cultivable land will be lost to agriculture due to soil loss. With this, the holding sizes will be considerably less that 0.5 ha. More disturbing than this is the likely deterioration in the quality of the already poor cultivable land. 4.1.4 Livestock Raising As in most rural economies of the Third World, livestock forms an important component of agriculture. People are dependent on various livestock types for milk and milk products, meat, draft power, transportation, and manure. However, the study area is an area of small livestock size because of the small size and poor quality of grazing land. The number of livestock for the sample households increases with the size of landholding in the study area. For reasons unknown, the situation in Dalocha-Talikessa does not conform to this pattern. The availability and size of grazing land also has an impact on the number of livestock. It can be seen from Table 18 that those with no grazing land have the smallest number of livestock and the number increases with the size of grazing land. Table 18: Average Number of Livestock with Size of Holding and Status of Grazing Land.
Holding Size Class (Timad)
Grazing Land Size Class (Timad)
Own Grazing Land
PA ≤2 2.1-4.0 4.1-8.0 No Grazing Land
Community Grazing Land ≤1 >1
Anshebesso 2.9 4.3 5.4 2.8 3.3 4.1 4.5 Albazer-Zemoshadger
5.0 5.2 7.0 4.9 5.4 5.9 6.4
Dalocha-Talikessa 4.0 2.8 6.1 4.2 5.0 5.0 5.1 Study Area 3.6 4.2 6.3 4.0 4.3 4.8 5.4 When average holding size per household is considered, Silte and Guraghe zones are not worse off compared with the neighbouring southern zones. From the Agricultural Sample Survey of 2004/2005 for Private Peasant Holdings for the Main Cropping (meher) Season, it is evident that a significantly greater portion of the holdings in these zones is under other uses. Personal observation of many areas of the two zones indicates that much of what is designated under other uses is either poor quality grazing land or land under conservation work. The differences between the total holding per household and
34

cropland per household shown in Table 19 for Ethiopia, SNNPR, Alaba (neighbouring special woredas), and Guraghe and Silte zones give some idea of the situation. Table 19: Comparison of Areas under Crops and Other Uses.
Administrative Unit Land Use Ethiopia SNNPR Alaba Guraghe Silte
Total Holding (ha)
1.25 0.76 1.21 0.88 1.10
Cropped Area (ha)
1.03 0.56 1.02 0.52 0.82
Difference (ha) 0.22 0.20 0.19 0.36 0.28 Source: CSA (2005b) (differences calculated by the author) Ethiopia, SNNPR and Alaba have significantly less numbers of holdings per household under other uses, while Guraghe and Silti, which are zones of the SNNPR, have greater numbers of holdings per household under other uses. This is not because these zones have greater sizes of holdings per household, nor is it because they have larger areas of grazing lands, forest lands or woodlands. Rather, it is primarily because relatively larger areas of landholdings cannot be used for crop cultivation. In fact, as indicated in previous research elsewhere, much of the cultivated areas are characterized by very thin soil cover. The mean number of livestock per household for the study area is only 4.8. As this includes all kinds of livestock except poultry, the area is poor in livestock. The average number of livestock is smallest for Anshebesso sample households and largest for Albazer-Zemoshadger. Table 20: Average Number of Livestock by Household Size Class.
Household Size PA Mean No. of livestock ≤5 6-8 >8
Anshebesso 3.7 2.9 3.3 4.9 Albazer-Zemoshadger 5.8 5.1 6.2 5.3 Dalocha-Talikessa 4.9 2.3 4.9 6.6 Study Area 4.8 3.5 5.0 5.5 Table 20 shows that the mean number of livestock is generally positively related with the size of households for the study area, with the exception of Albazer-Zemoshadger, where the average number of livestock per household is smaller for the largest household category.
35

4.1.5 A Brief Overview of Problems of Agriculture in the Study Area As already mentioned, most parts of the study area are among the most intensively degraded areas in South Central Ethiopia. Discussions with groups of elderly people in the study PAs revealed that there was substantial vegetation cover in the area as recently as the 1950s. Since then, almost all of it has been removed. There have not been consistent and continuous conservation efforts for a long period of time. Much of the earliest efforts at afforestation and conservation by the military government were either ignored or destroyed during the change of regime, and for a long time subsequently. There were no visible attempts at afforestation and conservation during our first visit to the study area in 2003. In fact, people told us about the disruption and destruction of the past attempts. We only saw significant attempts during our study visits of 2004 and early 2005 (Photos 5 and 6). Although it is not possible to establish with certainty, this may have some connection with the then forthcoming national and regional elections. It is said that the depth and fertility of soils have radically declined during recent decades. As a result, there has been a decline in yields of more than a half in the local’s lifetime, and holdings have become increasingly smaller. In group discussions and some informal conversations it was repeatedly stated that the produce from many holdings cannot sustain a family for more than six months in a year. In the earlier periods, when there was a large community land reserve and individual holdings were bigger, population increase led to the expansion of farmland which initiated land degradation because implements were backward, as in most parts of Ethiopia, and mechanisms for counteracting land degradation were not in place. Further, they are still not in place today.
36

Photos 5 and 6: Recent attempts at conservation.
37

As almost all the cultivable areas have come under the plough, in recent years the sizes of holdings have shrunk to the extent that they are uneconomical for most households. With such fragmentation of land, along with everyone trying to scratch out as much as possible from the land for survival, and without the necessary care for maintaining soil fertility, the process of soil erosion is accelerating, leading to further decline in the size of cultivable land and soil depth. It has been reported by some, that Agricultural Extension Service Workers or Development Agents are not making sufficient and regular visits to guide people on what is best for their plots of land under the prevailing environmental and input conditions. This happens partly because very few workers are assigned to serve large areas and communities. On the other hand, there are also reports that even when the workers are present they focus more on the collection of taxes, something which should not be part of their brief, or at least which should not be among their primary duties. Further, the duties of the Development Agent (DA) include afforestation, water harvesting and distribution of inputs, whether or not he/she is prepared to do these effectively. What appears to be a greater problem is that the workers change frequently and this leads to lack of continuity, sense of responsibility and accountability, for which the workers alone are not to blame. As soils have mostly lost their natural fertility, farmers have come to realize the importance of the application of fertilizers to increase yields. However, they feel that they are experiencing more problems with their usage than benefits from using them. One of the major problems mentioned by many, as in other areas, is that fertilizers are at times supplied after the due time, and yet farmers are obliged to take and pay for them. In addition, a person with a plot of land as small as 0.5 ha is obliged to take half a quintal of fertilizer, 0.25 quintal of urea and 0.25 quintal of DAP (Diammonium Phosphate), which is more than needed. The result of this has been a burden of debt for most farmers, with the effect that many are forced to sell their important livestock. Clearly, this makes the already difficult life situation of farming households even more precarious. In this regard, we were informed in the third week of June 2003, by the responsible staff in office that fertilizer use in the Zone has declined from a maximum of 20,000 quintals to only 4000 quintals over a relatively short period of time. To recapitulate, agricultural land in the area is in bad shape. Holdings are generally small and plots are extremely small. As soils in the areas being cultivated are very shallow and fertilizers are not provided timely and at affordable prices, yields are very low. In addition, there are a host of other problems affecting agriculture in this area as in most other areas of the country. For all these reasons, produce from agricultural land is far from sufficient to support most households all year round. To bridge this wide gap, people from many households are involved in a variety off-farm activities.
38

4.2 Some Off-Farm Activities In areas of farmland scarcity and very low agricultural productivity such as the study area, many families need to engage in other income earning off-farm or non-farm activities in order to survive. Nearly one-third of the sample households have one or more of their members engaged in some kind of off-farm activity. In most of these households only fathers are reported to be undertaking an off-farm activity, while only children do so in other households. Mothers are reported as being engaged in non-farm and non-domestic activities in a few households. However, the responses concerning the role of women seem to carry the traditional bias of underestimating the immense burden that women carry in the day-to-day life of a family. This issue will be briefly discussed further later in this paper. In one-third of the sample households in Albazer-Zemoshadger, all members of the households are involved in non-farm activities. This is mainly because there are many households who have lost their farmland due to the expansion of Worabe, the new capital of Silte Zone. Generally, the number of households with members engaged in non-farm activities in the sample households is quite large. Table 21: Number of People Engaged in Off-Farm Activities by PA.
Number of People Engaged in Non-Farm Activities
PA
Father only
Mother only
Children only
All
Total
Anshebesso 6 0 4 0 10 Albazer-Zemoshadger 16 3 5 11 35 Dalocha-Talikessa 6 3 2 0 11 Study Area 28 6 11 11 56 The figures presented in Table 21 show only part of the story concerning the role of non-farm activities in supporting rural households and the contribution of women to the welfare of the households. 4.2.1 Local Markets and Trading Activities First, the group discussions it was apparent that many more people are involved in short distance movements as labourers during dry seasons. Many towns within Silte Zone and Guraghe Zone, as well as the cities of Awassa, Addis Ababa and Nazareth (Adama), are frequently mentioned as possible destinations of people involved in these dry season movements. The other major contributor to the survival of most households in the area is the involvement of many people in petty trade, particularly in agricultural commodities, using a network of markets in the area. In addition to their very engaging domestic
39

chores, it is here that the role of women as the anchors of the household survival clearly emerges. Before proceeding further in the discussion it is helpful to give an indication of the approximate distances between the markets in the study PAs and some of the market places which are frequently visited. Some of the market places visited by people from Dalocha, such as Torra and Mito, are far away from Anshebesso and Albazer-Zemoshadger and are rarely visited by people from there. The transaction between Dalocha and the latter places primarily involves livestock. As such, the markets there do not have as much importance as the ones shown in Table 22 from the point of view of sustaining the lives of the people of the more poverty stricken areas such as Anshebesso and Albazer-Zemoshadger and their surrounding areas. Table 22: Approximate Round-Trip Distances (in Hours) Between the Study PAs and Major Market Places.
Approximate round-trip time (in hours) to From Qibet Alkesso Kutere Dalocha Qao-Qoto Worabe Wulbareg
Anshebesso 6 --------- 6 8 5 3 Albazer-Zemoshadger
10 4 6 4 -------- 8
Dalocha-Talikessa
10 -------- 4 6
There are market days in each of the market places at least once in a week. In some cases, there are two market days, one major and one minor. As things bought from one market place have to be sold at another market place it is natural for people to go to at least two or three market places in the course of a week. Table 22 shows that the time spent on travel to and from market places is long, and ranges between 3 and 10 hours. It can be assumed that people spend at least 2 to 3 more hours on business at the market place. This means that they will be out of their homes for anything between 5 and 13 hours. There is then the additional hardship of walking and driving loaded donkeys, most often carrying heavy loads. Witnessing people travelling on roads in the area on market days shows a troubling fact of life of the rural population. One can see large numbers of people with larger numbers of donkeys travelling to market places mostly before noon and returning home exhausted in the late afternoon. Most of the travellers are women, and it is not uncommon to see a woman driving two or three donkeys, and at times also carrying a load on her back. One of the donkeys, we were told, could belong to a neighbour as such co-operation is not uncommon. The items involved in this trade are mostly agricultural and the types depend mainly on the agro-climatic conditions of the areas where the market places are located. For instance, Kutere and Qao-Qoto are market places in Dega, which has a temperate –
40

moderately cool climate. Among crops and plants cultivated in the area are enset, cabbage, barley, and wheat. Dalocha area generally belongs to Woina-Dega, which is in a moderately warm climatic zone, and where crops such maize, sorghum, millet, and some beans are grown. Anshebesso also belongs to upper Woina-Dega area, and some enset, barley and wheat are grown there, as well as some beans and peas. However, it has little of any of these crops for market. From Anshebesso area (Alkesso), men take oxen, cows and donkeys and women take zenbaba (leaves of palm-like plants), bulla (one of the products of enset) and pottery products. The women bring back allado, tall round grass with which jiba – a traditional mat – is made, sugar cane, and bole, a salty soil which livestock are fed occasionally. Allado and bole are brought from areas further in the lowlands during dry seasons as the places are swampy during rainy seasons; they are brought by women coming from areas around Qibet. People from Alkesso do not take anything substantial to Qao-Qoto but they take home cabbage and sheep. They bring cabbage, qocho and bulla, both products of enset from Kutare. They take allado, bole and sugar cane which are brought from Qibet, to Kutere. They take jiba, cabbages and some livestock to Dalocha and take home maize, sorghum, beans, and wheat from there. In Albazer-Zemoshadger, people from around Worabe take maize, wheat, and teff to other markets. They also bring different types of cereals from Dalocha and sell them in Kutere, from where they take home cabbabe, qocho, and enset leaves. They also bring pepper, sorghum, maize, and coffee from Wulbareg and sell them in Worabe and Kutere markets. Dalocha has trade interaction with two markets, Torra and Alem Gebeya, which are far away from Anshebesso and Albazer-Zemoshadger. The items people take from here to Torra are various traditional mats (jiba), bamboo baskets and brooms. The major item brought back from Torra is barley. Their marketing interaction with Alem Gebeya involves livestock and hence does not seem to be based on differences in their respective agricultural products. They take various livestock, including goats, to Wulbareg and bring back bulla, qocho, some fruits, korerima (a kind of spice), and ropes. Only livestock are taken to Kutere, but various items, such as kosso (of the plant species Hagenia abyssinica), qebericho, tezma-mar (special kind of honey), and vegetables are brought. As indicated earlier, most of the market activities are undertaken by women. However, women also have other things to do before going to market and when they come home from market it is not to rest. Even during dry seasons when men have much less to do, women’s work continues to occupy all their waking hours. In our group discussions and personal conversations with Rural Development Office staff, we heard one striking statement about the role of women repeated three or more times: ‘A woman can live without a man; a man cannot without a woman’. In connection with this we heard that parents of girls generally ask the question ‘Does he have a mule and/or a donkey’, when a young man expresses his interest in marrying their daughter. This indicates the
41

importance of trade as one of the means of living in the area and the role of animals in the activity. It implies that if animals are available their daughter can work with them, at least to partly earn a living for the family. Shuttling between weekly markets is one of the very important ways by which many households meet part of their basic needs, and at times also their social commitments and government obligations. Generally, women are key in the activity in addition to their heavy daily domestic chores. Although mules are also used for transportation the animal with outstanding service in this area, as in many other highland rural areas, is the donkey. 4.2.2 Migratory Movements of Household Members Table 23 shows that 34 or c.19% of the sample households have one or more migrants. It can also be seen that the mean number of migrants per household for the three sample PAs is 0.4, which averages out at one migrant for every 2–3 households. Even if it can be said that every third household has a migrant, migration is an important phenomenon in the area. The largest numbers of migrants go to different places within the SNNP Region. The remaining go to various major cities, primarily to Addis Ababa and Nazareth (Adama). Responses given by household heads indicate that many of the migrants work in factories, and some in private businesses and government organizations. Perhaps many more work as shoe-shine boys or in shops to afford a few items of basic necessity for members of their families. Of the migrants within the region, some are women who migrate due to marriage. Table 23: Number of Migrants and Mean Number of Migrants from a Household by PA,
Number of Migrants PA none 1 2 ≥3
Mean
Anshebesso 49 3 7 1 0.4 Albazer-Zemoshager 50 4 5 1 0.3 Dalocha-Talikessa 47 6 4 3 0.5 Study Area 146 13 16 5 0.4 In addition to the permanent migrants, there is also a sizeable seasonally migrating population (Table 24). The number of households with seasonal migrants is also quite significant as it involves close to one in five households. The destinations of the seasonal migrants are not much different from those of permanent migrants. The responses to the question relating to former seasonal migrants (those who migrate no more now) revealed that there are 22 households with former seasonal migrants.
42

Table 24: Households with Seasonal Migrants by PA.
Seasonal Migrants PA Number Percentage
Anshebesso 8 13.3 Albazer-Zemoshadger 10 16.7 Dalocha-Talikessa 12 20.0 Study Area 30 16.7 Seasonal migrants put their incomes to various uses, including buying household utensils and farm implements, paying taxes, buying oxen, and covering holiday expenses. However, as incomes from seasonal migrations are small they cannot be put to more than one or two of these uses. Even then, the contribution of seasonal migration towards sustaining households cannot be considered marginal. 4.3 Other Support Systems Other than the various ways of earning their living, people have different ways of associating themselves in order to accomplish things that are not easy to do individually. Ekub, Mahiber and Ider are the most common of these. Ekub most often involves the collection of a certain amount of money among several friends in a period of 15 days or a month. Usually, each time money is collected, the person who takes the money is selected randomly by drawing lots. The process goes on until the last person receives the collection. If the group members agree, the cycle can be repeated several times. Wijo, where a group of women pool either milk or butter and take in turns, is also considered as Ikub. Wijo usually involves a few women living within a short distance from one another. Most often, they are members of an extended family. Mahiber is basically an association of extended family members, mostly men, both for socialization and self-help, unlike Ikub which mainly focuses on the collection of money, and which may not necessarily be among extended family members. Depending on the season of the year and the number of members, the members meet either monthly or twice a month on a regular basis. They eat food prepared for the occasion and make agreements on contributions. Part of the contributions is used to help those with urgent needs – such as one whose house has burnt down, or who has lost an ox or oxen though some kind of accident. Idir is a cooperation of people in a neighbourhood or community for coping with the worst moment in the lives of families – the loss of one of their loved ones. On such occasions, both males and females are equally involved but play somewhat different roles. Women prepare food, fetch water and boil coffee. Other essential tasks, such as preparing fuel wood and the burial place as well as constructing a shelter for relatives and
43

friends who come to attend the funeral, are undertaken by men. Depending on the financial strength of the member households, an agreed amount of financial contribution is made regularly to the grieving family. These are the three major ways people cooperate to overcome some of their financial and material problems, or to share the heavy burdens of families when they mourn the death of their loved ones. In a situation where and when none of them can overcome life’s difficulties alone based on the income from the various activities they are engaged in, by this means they can feel secure; the ways provide a kind of insurance. It should be noted that some of the problems, such as the death of a family member or a wedding ceremony, always requires the presence of neighbours, relatives and friends, even if not in an organized way. 4.4 Economic Status and People’s Perception of Wealth From the discussion so far, it is quite clear that landholdings are generally small, and to a great extent positively related to the size of households, reflecting the primary criterion in the initial distribution of land. If land per capita is calculated, it can be seen that the small differences between households with larger landholdings and those with small landholdings would diminish into almost insignificance. As such, landholdings are not considered to be among the factors that make differences among the farming households. From discussions with farmers, it appears that they make some distinctions among themselves in terms of ownership of livestock, which is related to the size of holding and household to some extent. This is not an attempt to stratify the sample households using all assets and incomes as has been the case in other studies of rural economics (Abebe 2001). Rather, it is an attempt to understand how the peasant farmers in the area stratify themselves (if they do) under their current situation. In group discussions held in the three study PAs, farmers were asked if they made distinctions among themselves as rich, self-sufficient or poor. They did not believe that there were rich people among them under the prevailing socio-economic conditions. According to their self-perception, a more realistic way would be to stratify them into self-sufficient, poor, and very poor, primarily on the basis of ownership of livestock. In the conceptual stratification of households, the most important are three livestock types: cows, oxen and donkeys. After donkeys, mules are also considered to be very important draught animals. The presence of cows and oxen in numbers greater than two puts a household in a self-sufficient category in most cases. The absence of cows, oxen and donkeys places a household into the category of very poor. The poor have at least one, or in some cases two, of these important animals. The only animals available to the very poor are a few sheep and/or goats and some chickens (Table 25).
44
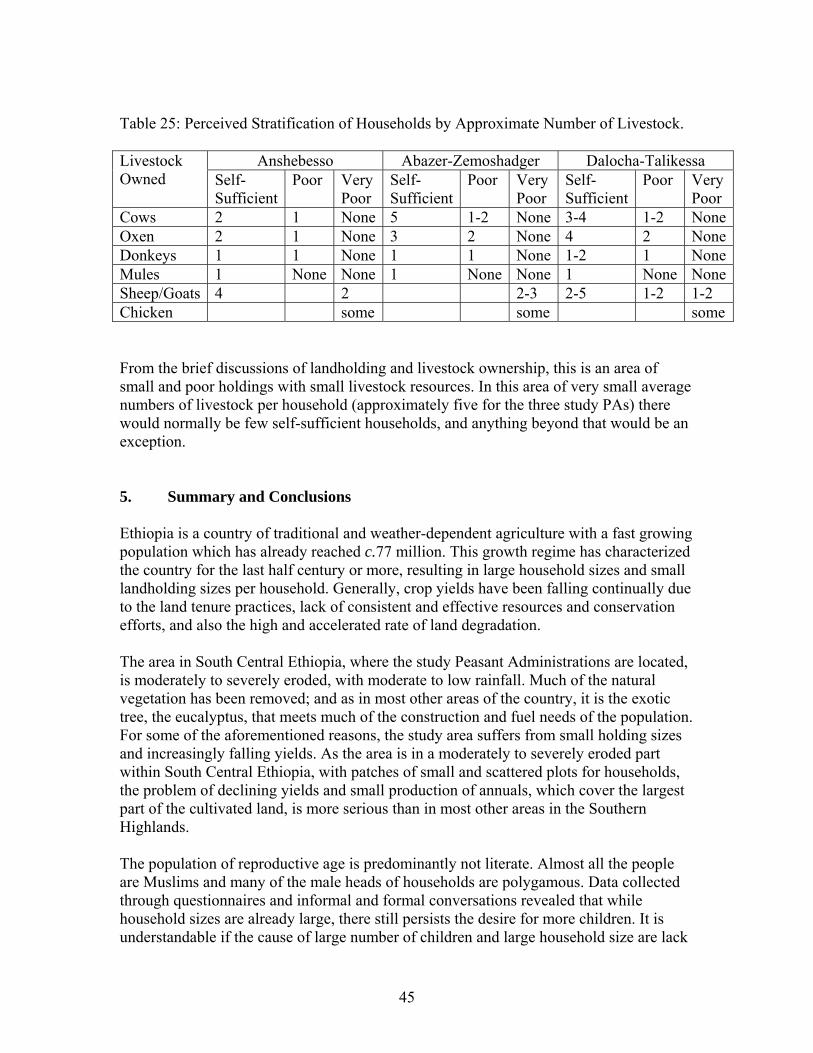
Table 25: Perceived Stratification of Households by Approximate Number of Livestock.
Anshebesso Abazer-Zemoshadger Dalocha-Talikessa Livestock Owned Self-
Sufficient Poor Very
Poor Self-Sufficient
Poor Very Poor
Self-Sufficient
Poor Very Poor
Cows 2 1 None 5 1-2 None 3-4 1-2 NoneOxen 2 1 None 3 2 None 4 2 NoneDonkeys 1 1 None 1 1 None 1-2 1 NoneMules 1 None None 1 None None 1 None NoneSheep/Goats 4 2 2-3 2-5 1-2 1-2 Chicken some some some From the brief discussions of landholding and livestock ownership, this is an area of small and poor holdings with small livestock resources. In this area of very small average numbers of livestock per household (approximately five for the three study PAs) there would normally be few self-sufficient households, and anything beyond that would be an exception. 5. Summary and Conclusions Ethiopia is a country of traditional and weather-dependent agriculture with a fast growing population which has already reached c.77 million. This growth regime has characterized the country for the last half century or more, resulting in large household sizes and small landholding sizes per household. Generally, crop yields have been falling continually due to the land tenure practices, lack of consistent and effective resources and conservation efforts, and also the high and accelerated rate of land degradation. The area in South Central Ethiopia, where the study Peasant Administrations are located, is moderately to severely eroded, with moderate to low rainfall. Much of the natural vegetation has been removed; and as in most other areas of the country, it is the exotic tree, the eucalyptus, that meets much of the construction and fuel needs of the population. For some of the aforementioned reasons, the study area suffers from small holding sizes and increasingly falling yields. As the area is in a moderately to severely eroded part within South Central Ethiopia, with patches of small and scattered plots for households, the problem of declining yields and small production of annuals, which cover the largest part of the cultivated land, is more serious than in most other areas in the Southern Highlands. The population of reproductive age is predominantly not literate. Almost all the people are Muslims and many of the male heads of households are polygamous. Data collected through questionnaires and informal and formal conversations revealed that while household sizes are already large, there still persists the desire for more children. It is understandable if the cause of large number of children and large household size are lack
45

of knowledge of modern family planning methods (which applies to most rural areas) or lack of access to the same (which applies to some), but it is paradoxical to see parents with large family sizes and little land to offer them, still wanting more children. Today, large numbers of young heads of households cultivate extremely small plots offered to them by their parents and there are many who do not have their own plots of land to cultivate. The increasing scarcity of land has, in many instances, resulted in conflicts between parents and sons and/or siblings. Generally, it is the older heads of households and those with more than one wife that have larger holdings. Widowed female heads of households have the smallest landholdings. Although having been to other parts of the country on field trips prior to undertaking this study, nowhere did I hear people in the countryside speaking in positive terms about resettlement after the 1984/85 ill-planned massive resettlement effort of the previous government, with the exception of the study area. In group and informal discussions many people were heard saying they would volunteer for resettlement if asked. There are other ways of accessing land for some of those with little or no land. The main one is sharecropping, the sharing of inputs and production in agreed proportions. Various kinds of sharecropping agreements are entered into in order to make a living. However, in some cases, these are also exploited more by those with more land and oxen. It is the female heads of households and the old who are taken advantage of in the sharecropping arrangements. Some contractual agreements, such as woledagid for an agreed period of time and for a certain sum of money, put the landholder at a more serious disadvantage. Most often, the person is not able to pay back the money or the case ends up in a local court, where a verdict favouring the landholder is unlikely. The small size and poor condition of landholding, together with little or no community grazing land, in some cases seem to have resulted in small size of herds and poor quality of livestock. The average number of livestock per household, excluding poultry, for the sample households is five. Sizes of livestock herds tend to be larger for households with larger household sizes. The lack or small size of livestock herds in rural areas implies deficiency in nutrition, draft power and soil fertility. This, in turn, impacts on both land and labour productivity. As stated, the study area is more or less severely affected by soil erosion and land degradation which primarily result from lack of sufficient and consistent conservation efforts for decades, if not for centuries. The change of government in 1991 brought about the end of some conservation efforts started during the military government’s period of office, and the very recent efforts by the government in power seem to be motivated by political gains, and hence are unlikely to succeed. Cultivated and cultivable areas are generally shrinking in size as a result of accelerated soil erosion which is making the productive soil layer increasingly thinner. To this is added the fragmentation of farmland due to unabated population growth. The problem of agriculture is compounded as fertilizers have become less accessible to farmers due to
46

high price, and untimely supply, quantity and quality. All these problems result in very low yields and small production. Such a poor state of agriculture seems to have long pushed members from many households to undertake various off-farm activities. Among the off-farm activities, the shuttling of women between weekly local markets trading mostly in agricultural products is quite conspicuous. In addition to having full responsibility for daily domestic chores, women constantly travel from markets in one agro-ecological zone to another, taking agricultural products from where they are available to where they are lacking or scarce. The most important aid in this tedious business of survival is the donkey. From both formal and informal conversations as well as observations, it was evident that the survival of households rests more on the women than on men. The often repeated saying in the area, ‘A woman can live without a man, but a man cannot without a woman’, seems to be an expression of this. Migration, both permanent and seasonal, also significantly contributes to the livelihood of the households. Nearly 17% of the households have seasonal migrants, while there is one permanent migrant for every 2–3 households. Most of these are labourers striving to meet some of the financial needs of the households. Other than the various ways of earning a living, people have important ways of overcoming major economic and social problems in groups of varying sizes. Ekub, or pooling a certain amount of money every month by members, and determining the one to take the sum for the month on the basis of randomly drawn lots, is a relatively common and important way of alleviating financial problems. Mahiber and Idir are also important associations. The former is an occasion of meeting of close relatives and/or friends to enjoy meals together and discuss issues like how a person needing help among them can be supported. The support could be in labour or financial. The meeting could be every month or at any agreed upon regular time interval. The latter, Ider, is primarily an association for helping a family that has lost a loved one. The information presented relating to how people in the study area perceive themselves on the basis of what they have and/or own have shown that they do not believe that there are rich people among them. They believe that there are some self-sufficient households and that the rest are either poor or very poor. Oxen, cows and donkeys are key in their conceptual classification. Generally, households with two or more cows, and oxen and one or two donkeys are considered self-sufficient. Those with one or two of each are poor, and the very poor do not even have even one of these major livestock types. To sum up, the study area and its surroundings are characterized by severe to moderate land degradation, little sustained attempts at conservation of natural resources and unabated population growth. As the quality of soils is continuously deteriorating and land fragmentation is increasing, with holdings becoming smaller, yields which are already low are declining further.
47

Under these conditions, it seems that there are no households which can be supported year round by their agricultural production (whether crops or livestock). Over the years, many households have adopted various mechanisms for making up for what agricultural production has failed to meet. These include seasonal and permanent migration and petty trade, mostly in agricultural products. If the current land tenure, population growth, and natural resources and conservation conditions are to continue for a significantly long time in the future, the currently practiced coping mechanisms are unlikely to meet people’s needs.
48
References Abebe H/Gebriel (2001) Peasant endowments and the redistributive functions of informal
rural land markets: The case of cereal producing landed peasants, Ethiopian Journal of Development Research, 2(2), 1–34.
Alemayehu Lirenso (1986) Food Aid and Its Impact on the Ethiopian Agriculture,
Institute of Development Research (IDR), Addis Ababa University. Aklilu Kidanu & Tadesse Alemu (1994) Rapid population growth and access to
Farmland. In: Land Tenure and Land Policy in Ethiopa: After the Derg. Dessalegn Rahmato (ed.), Center for Environment and Development, University of Trondheim.
Beyene Doilicho (1998) Peasant Farmers’ Response to Population Pressure and Land
Shortage in South-Central Ethiopia, PhD Thesis, University of Trieste, Trieste. CSO (1984) Population and Housing Census Preliminary Report. CSA (1988) Population Situation in Ethiopia – Past, Present and Future, Population
Studies Series. CSA (1995) The 1994 Population and Housing Census of Ethiopia, Results for Southern
Nations, Nationalities and Peoples’ Region, Summary Report. CSA (2002) Statistical Abstract. CSA (2004) Welfare Monitoring Survey 2004: Analytical Report. CSA (2005a) Statistical Abstract. CSA (2005b) Agricultural Sample Survey, 2004/2005: Report on Land Utilization
(Private Peasant Holdings, Meher Season), Volume IV, July 2005. Dessalegn Rahmato (1984) Agrarian Reform in Ethiopia, Scandinavian Institute of
African Studies, Uppsala. Hoben, Alan (2001) Ethiopian land tenure revisited: Continuity, change and
contradictions. In: Current Issues on Land Tenure in Ethiopia: Access, Food Production and Natural Resources Management, Workneh Nigatu, Yared Amare & Yigremew Adal (eds.), Institute of Development Research, Addis Ababa University, Addis Ababa.
49

Pausewang S. (1990) The peasant perspective. In: Ethiopia: Rural Development Options, Siefgried Pausewang, Fantu Cheru, Stefan Brune & Eshetu Chole (eds.), Zed Books, London.
Quisumbing, Agnes R. (2003) Food Aid and Child Nutrition in Ethiopia, International
Food Policy and Research Institute, xxx. Sonneveld, B.G. & Johannes, Seth (2002) Land Under Pressure: The Impact of Water
Erosion on Food Production in Ethiopia, Shaker Publishing, Maastricht. Teferi Abate (1995) Land redistribution and inter-household relations: The case of two
communities in Northern Ethiopia, Ethiopian Journal of Development Research, 17(1), 23–42.
Yared Amare (2002) Land redistribution and household agricultural production: A case
study in Wogda, Northern Shewa. In: Current Issues on Land Tenure in Ethiopia: Access, Food Production and Natural Resources Management, Workneh Nigatu, Yared Amare & Yigremew Adal (eds.), Institute of Development Research, Addis Ababa University, Addis Ababa.
Yibeltal Gebeyehu (1995) Population pressure, agricultural land fragmentation and land
use: A case study of Dale and Shashemenne woredas, Southern Ethiopia. In: Ethiopian Agriculture: Problems of Transformation, Proceedings of the Fourth Annual Conference on the Ethiopian Economy, Dejene Aredo & Mulat Demeke (eds.), Addis Ababa University, Addis Ababa.
Yigremew Adal (2002) Land redistribution and its impacts: A case study in two rural
communities in West Gojjam, Ethiopia. In: Current Issues on Land Tenure in Ethiopia: Access, Food Production and Natural Resources Management, Workneh Nigatu, Yared Amare & Yigremew Adal (eds.), Institute of Development Research, Addis Ababa University, Addis Ababa.
50

Table of Contents 1. Introduction
1.1 Problems 1.2 Objectives 1.3 The Study PAs 1.4 Methodology 1.5 Limitations
2. The Study Area
2.1 Location and Topography 2.2 Climate and Vegetation 2.3 Observable Soil Erosion and Land Degradation
2.4 Settlement and Housing
2.4.1 Settlement Patterns 2.4.2 Construction Materials and House Types 2.4.3 Construction Materials and Conservation Efforts
3. Aspects of population and Socio-Economic Conditions of the Study PAs
3.1 Population Distribution 3.2 Population Characteristics
3.2.1 Size of Household 3.2.2 Population Increase and Movement 3.2.3 Some Indicators of Unabated Population Growth 3.2.4 Division of Labor 3.2.5 Enrollment and Desire for Child Education
3 Livelihoods
3.2 Land Use, Size of Holding and Problems of Agriculture
3.2.1 Land Use and Major Crops 3.2.2 Size of Holding and Land Tenure 3.2.3 Share Cropping and Contractual Arrangements 3.2.4 Livestock Raising. 3.2.5 A Brief Overview of Problems of Agriculture
51

3.3 Off-Farm Activities
3.3.1 Local Markets and Trading Activities 3.3.2 Migratory Movements of members of Households 3.3.3 Other Support Systems 4.2.4 People’s Perception of Wealth/Economic Status
5. Summary and Conclusion
52

Department of Geography and Environmental StudiesAddis Ababa UniversityEthiopia
Rap
port
/ R
epor
t
NTN
UN
orge
s te
knis
k-na
turv
itens
kape
lige
univ
ersi
tet
Faku
ltet
for
sam
funn
svite
nska
p og
te
knol
ogile
dels
e G
eogr
afisk
inst
itutt
Beyene Doilicho Population and Major Livelihoods in Silte and Dalocha Woredas of Silte Zone
Working papers on population and land use change in central Ethiopia, nr. 11
Acta Geographica-Trondheim
Serie A, Nr. 19 Series A, No. 19
Avhandlinger og rapporter/Theses and reports
October 2007
I n n o v a t i o n a n d C r e a t i v i t yI n n o v a t i o n a n d C r e a t i v i t y
Addis Ababa University
Addis Ababa University
Acta Geographica-Trondheim is the continuation of Papers from the Department of Geography, University of Trondheim, which came out 1978-2001.
http://www.ntnu.no/geografiISSN 1502-2390
www.ntnu.no/geografi