popsis pricing of psi study 15th psi group...
TRANSCRIPT

POPSISPricing of PSI Study
15th PSI Group Meeting
Patrick [email protected] [email protected] De [email protected]
Luxembourg, 13th September 2011
© 2011 Deloitte
Agenda
Study purpose and context 3
Study approach and methodology 5
Case studies overview 9
Main findings from case study analysis 11
Conclusions 22
Q&A
Annexes
• Cost recovery ratios
• PSI policy changes and effects
• Transition financing measures of selected PSBs
2

© 2011 Deloitte3
Study purposeand context
© 2011 Deloitte
Study purpose and context
Study purpose• Assessment of different models of supply and charging for PSI and their effects• Based on 21 in-depth public sector body case studies across Europe
Study context• Forthcoming review of PSI Directive 2003/98/EC• 2010 EC public consultation on PSI Directive 2003/98/EC• Open Data movement getting momentum• Increasing PSI re-use activities• Growing political interest in PSI re-use and pricing• Growing body of academic literature on PSI pricing
→ POPSIS supports the debate through the provision of evidence
4
© 2011 Deloitte5
Study approach and methodology

© 2011 Deloitte
Upstream and downstream effects of PSI charging models
6
Which PSI charging model works best?
© 2011 Deloitte
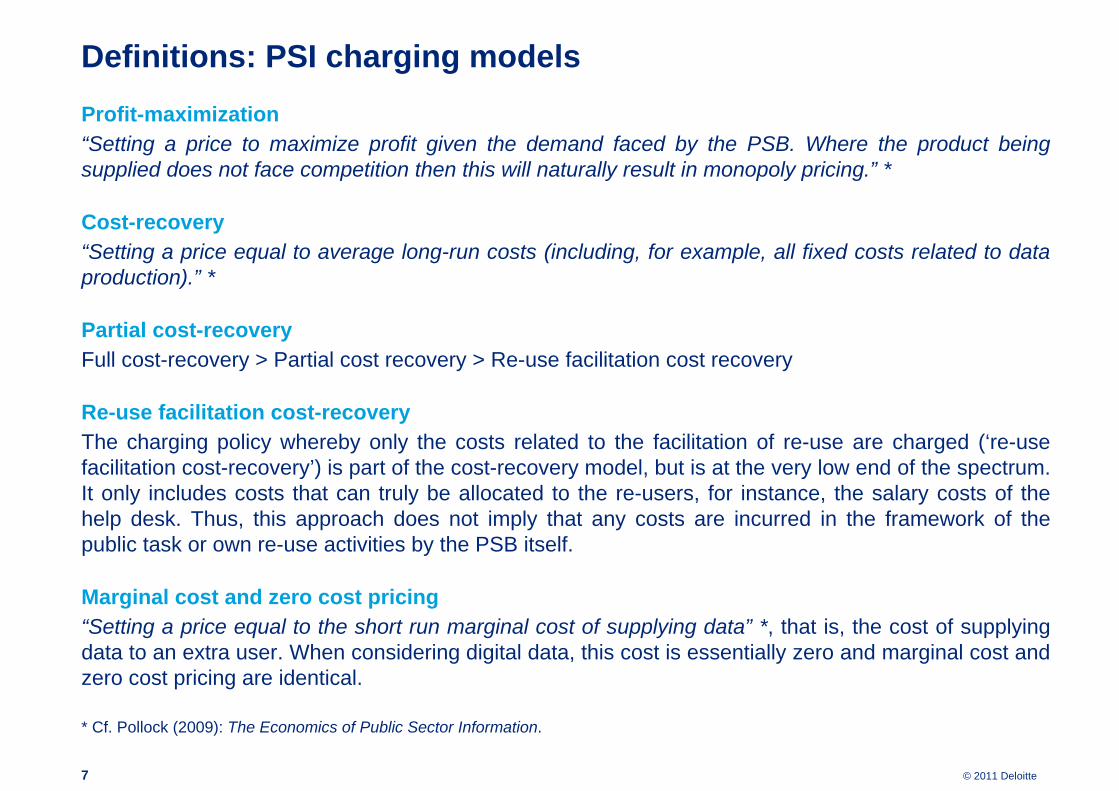
Definitions: PSI charging modelsProfit-maximization“Setting a price to maximize profit given the demand faced by the PSB. Where the product being supplied does not face competition then this will naturally result in monopoly pricing.” *
Cost-recovery“Setting a price equal to average long-run costs (including, for example, all fixed costs related to data production).” *
Partial cost-recoveryFull cost-recovery > Partial cost recovery > Re-use facilitation cost recovery
Re-use facilitation cost-recoveryThe charging policy whereby only the costs related to the facilitation of re-use are charged (‘re-use facilitation cost-recovery’) is part of the cost-recovery model, but is at the very low end of the spectrum. It only includes costs that can truly be allocated to the re-users, for instance, the salary costs of the help desk. Thus, this approach does not imply that any costs are incurred in the framework of the public task or own re-use activities by the PSB itself.
Marginal cost and zero cost pricing“Setting a price equal to the short run marginal cost of supplying data” *, that is, the cost of supplying data to an extra user. When considering digital data, this cost is essentially zero and marginal cost and zero cost pricing are identical.
* Cf. Pollock (2009): The Economics of Public Sector Information.
7

© 2011 Deloitte
Study approach and methodology
• Input from sectoral experts and European Commission for case study selection• About 20 preparatory interviews
• Participation in key PSI stakeholder events• POPSIS case study protocol
• Guidance for desk research and field work• Interview guides• Case study reporting template
• Expert validation meeting• Robbin ten Velde• Raimundo Iemma• Graham Vickery
8
© 2011 Deloitte9
Case studies overview
© 2011 Deloitte
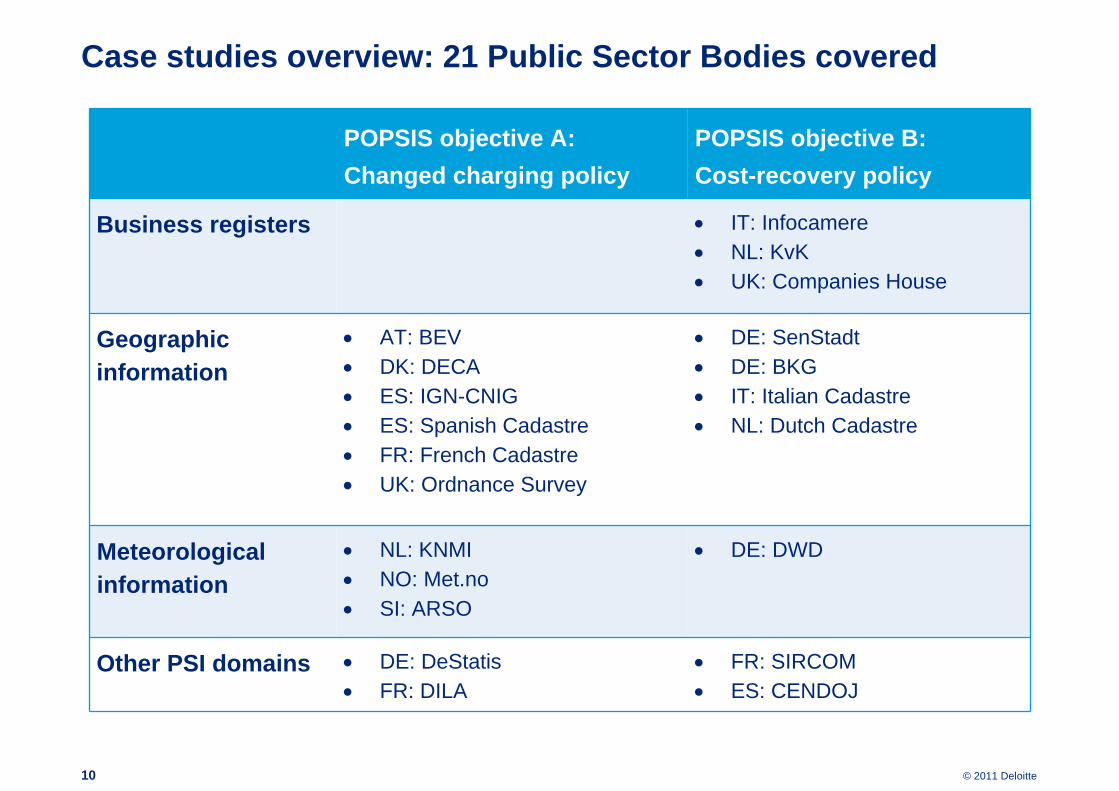
Case studies overview: 21 Public Sector Bodies covered
10
POPSIS objective A:Changed charging policy
POPSIS objective B:Cost-recovery policy
Business registers • IT: Infocamere• NL: KvK• UK: Companies House
Geographic information
• AT: BEV• DK: DECA• ES: IGN-CNIG• ES: Spanish Cadastre• FR: French Cadastre• UK: Ordnance Survey
• DE: SenStadt• DE: BKG• IT: Italian Cadastre• NL: Dutch Cadastre
Meteorological information
• NL: KNMI• NO: Met.no• SI: ARSO
• DE: DWD
Other PSI domains • DE: DeStatis• FR: DILA
• FR: SIRCOM• ES: CENDOJ

© 2011 Deloitte11
Main findings from case study analysis

© 2011 Deloitte12
Main findingsfrom the case studies
© 2011 Deloitte
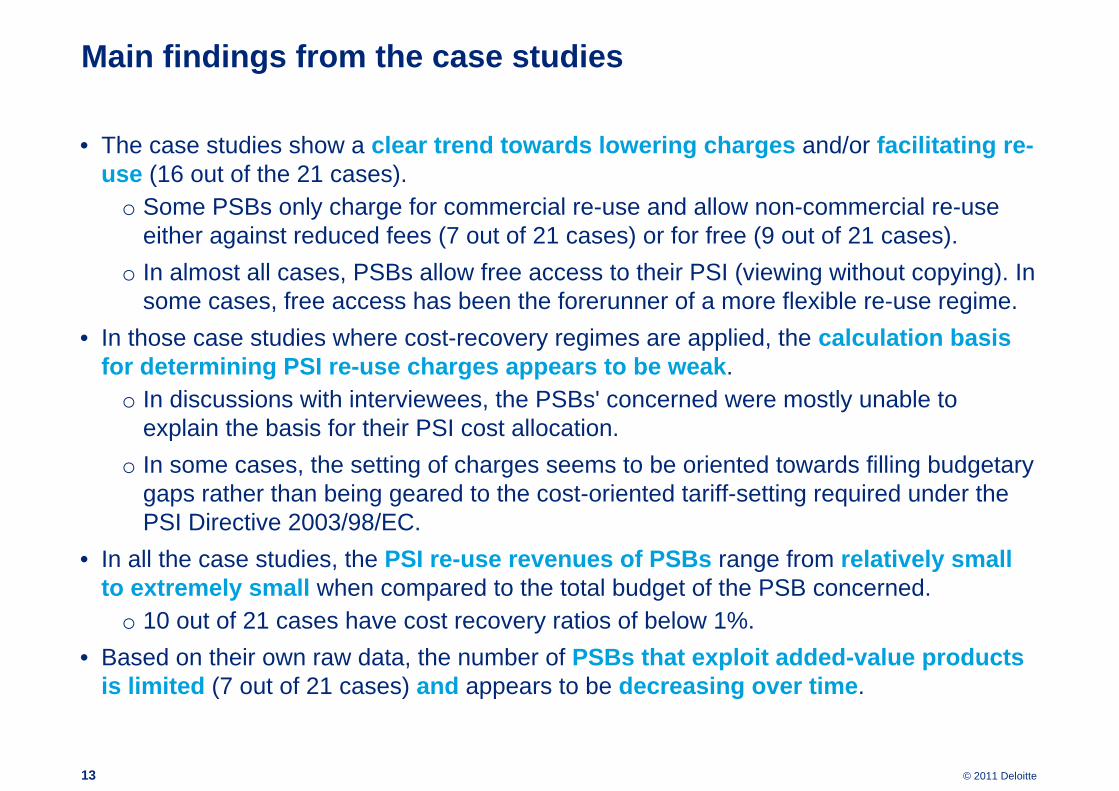
Main findings from the case studies
• The case studies show a clear trend towards lowering charges and/or facilitating re-use (16 out of the 21 cases).
o Some PSBs only charge for commercial re-use and allow non-commercial re-use either against reduced fees (7 out of 21 cases) or for free (9 out of 21 cases).
o In almost all cases, PSBs allow free access to their PSI (viewing without copying). In some cases, free access has been the forerunner of a more flexible re-use regime.
• In those case studies where cost-recovery regimes are applied, the calculation basis for determining PSI re-use charges appears to be weak.
o In discussions with interviewees, the PSBs' concerned were mostly unable to explain the basis for their PSI cost allocation.
o In some cases, the setting of charges seems to be oriented towards filling budgetary gaps rather than being geared to the cost-oriented tariff-setting required under the PSI Directive 2003/98/EC.
• In all the case studies, the PSI re-use revenues of PSBs range from relatively small to extremely small when compared to the total budget of the PSB concerned.
o 10 out of 21 cases have cost recovery ratios of below 1%.• Based on their own raw data, the number of PSBs that exploit added-value products
is limited (7 out of 21 cases) and appears to be decreasing over time.
13

© 2011 Deloitte14
Downstream effectsof lowered charges
© 2011 Deloitte
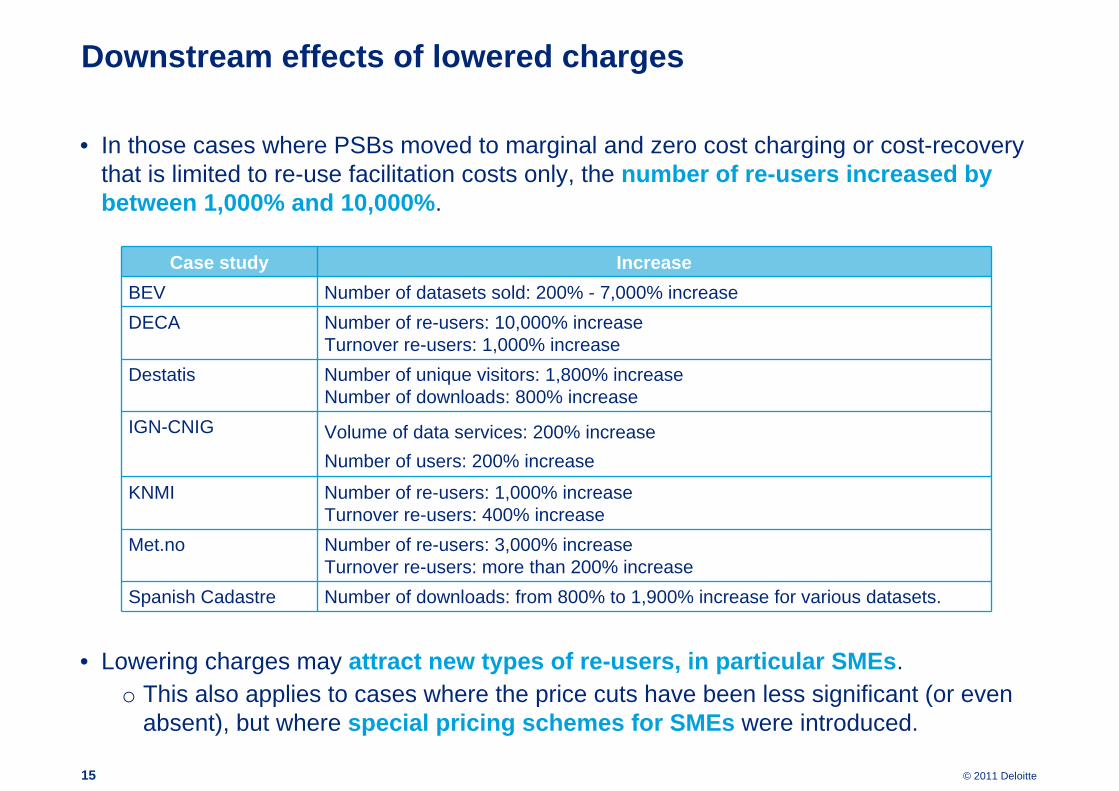
Downstream effects of lowered charges
• In those cases where PSBs moved to marginal and zero cost charging or cost-recovery that is limited to re-use facilitation costs only, the number of re-users increased by between 1,000% and 10,000%.
• Lowering charges may attract new types of re-users, in particular SMEs.o This also applies to cases where the price cuts have been less significant (or even
absent), but where special pricing schemes for SMEs were introduced.
15
Case study IncreaseBEV Number of datasets sold: 200% - 7,000% increaseDECA Number of re-users: 10,000% increase
Turnover re-users: 1,000% increaseDestatis Number of unique visitors: 1,800% increase
Number of downloads: 800% increaseIGN-CNIG Volume of data services: 200% increase
Number of users: 200% increase
KNMI Number of re-users: 1,000% increaseTurnover re-users: 400% increase
Met.no Number of re-users: 3,000% increaseTurnover re-users: more than 200% increase
Spanish Cadastre Number of downloads: from 800% to 1,900% increase for various datasets.

© 2011 Deloitte16
Upstream effectsof lowered charges

© 2011 Deloitte
Upstream effects of lowered charges
• All case studies where PSBs have lowered their prices demonstrate that demand volumes expand strongly (there have been increases of up to 7,000%).
o In some cases, PSI sales revenues can remain stable or even increase after drastic price cuts due to the growing demand.
o Of course, once charges are zero, revenues are also zero.
• Costs appear to increase very little: in fact, they may eventually decrease if the volumes of re-use grow significantly. Once re-use facilitation processes are properly organized, they become sub-routines within the PSB. To a large extent, they become embedded in the PSB's public task-funded activities at no extra cost.
• Zero cost pricing has the additional advantage that transaction costs decreasesignificantly. This decrease applies not only to administrative costs, such as invoicing, but also to costs related to the monitoring of compliance with license arrangements.
• Several PSBs have reported that intensified ties with re-users may lead to improved data quality and process efficiency since any deficiencies in the data are promptly flagged up and reported back to the PSB.
o When the interest in data quality is shared, quality control is partly outsourced.
17
© 2011 Deloitte18
Obstacles to change
© 2011 Deloitte
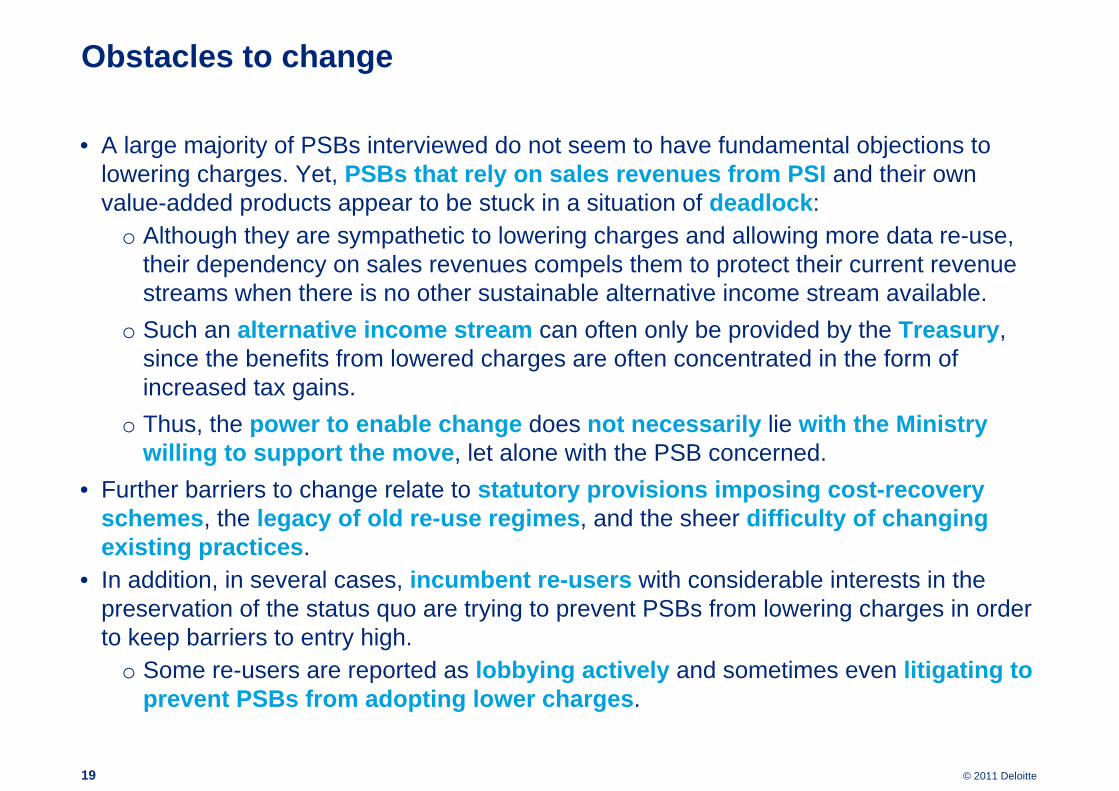
Obstacles to change
• A large majority of PSBs interviewed do not seem to have fundamental objections to lowering charges. Yet, PSBs that rely on sales revenues from PSI and their own value-added products appear to be stuck in a situation of deadlock:
o Although they are sympathetic to lowering charges and allowing more data re-use, their dependency on sales revenues compels them to protect their current revenue streams when there is no other sustainable alternative income stream available.
o Such an alternative income stream can often only be provided by the Treasury, since the benefits from lowered charges are often concentrated in the form of increased tax gains.
o Thus, the power to enable change does not necessarily lie with the Ministry willing to support the move, let alone with the PSB concerned.
• Further barriers to change relate to statutory provisions imposing cost-recovery schemes, the legacy of old re-use regimes, and the sheer difficulty of changing existing practices.
• In addition, in several cases, incumbent re-users with considerable interests in the preservation of the status quo are trying to prevent PSBs from lowering charges in order to keep barriers to entry high.
o Some re-users are reported as lobbying actively and sometimes even litigating to prevent PSBs from adopting lower charges.
19

© 2011 Deloitte20
Enablers of change
© 2011 Deloitte
Enablers of change
• Change appears to be brought about both bottom-up and top-down.• In the cases of bottom-up change, PSBs that moved towards lower charges were often
driven by the notion that making data available and serving re-users is part of their core public task.
o In many cases, the momentum was driven by inspired leaders in the PSBs who took action within the limitations of the existing framework.
o In most of these cases, the business case was made upfront to justify the reason for change. The costs, the benefits and the financing of the transition process had to be shown clearly.
o Quite often, interviewees acknowledged that, ultimately, there was often a significant ‘leap of faith’. However, the rationale for making such a leap was often harnessed after two aspects of potential efficiency and effectiveness were made clear: the fractional contribution of the re-use revenues and the gains to be achieved.
• In other cases, the need for change was imposed top-down either through a clear political decision or occasionally by a policy move made by another PSB that possessed the same data.
o In these cases, the PSB’s negotiating position was somewhat different. Often, the PSB managed to obtain a form of compensation for its drop in income: this was particularly the case where the revenues from its own exploitation were of some significance and entailed a reorganization process.
21
© 2011 Deloitte22
Conclusions

© 2011 Deloitte
Conclusions
The case study analysis indicates that:
• The potential benefits of lowered charges for PSI re-use can be high.o Lowered charges can lead to more economic activity, market dynamism, innovation
and employment.o They may also entail efficiency gains for the PSBs.
• The potential costs of lowering PSI charges appear to be low.• Unless zero cost pricing is applied, the price mechanism may actually increase the
revenues rather than lowering them.• The costs of a transition to lower PSI charges appear to be relatively low. This is
because, to a large extent, the knowledge and infrastructure needed by the PSBs already exist.
• The main effort lies in an adjustment of processes and mindsets to serve PSI re-users most effectively.
23

© 2011 Deloitte24
Questions & Answers
© 2011 Deloitte25
Annexes

© 2011 Deloitte26
Cost recovery ratios
© 2011 Deloitte
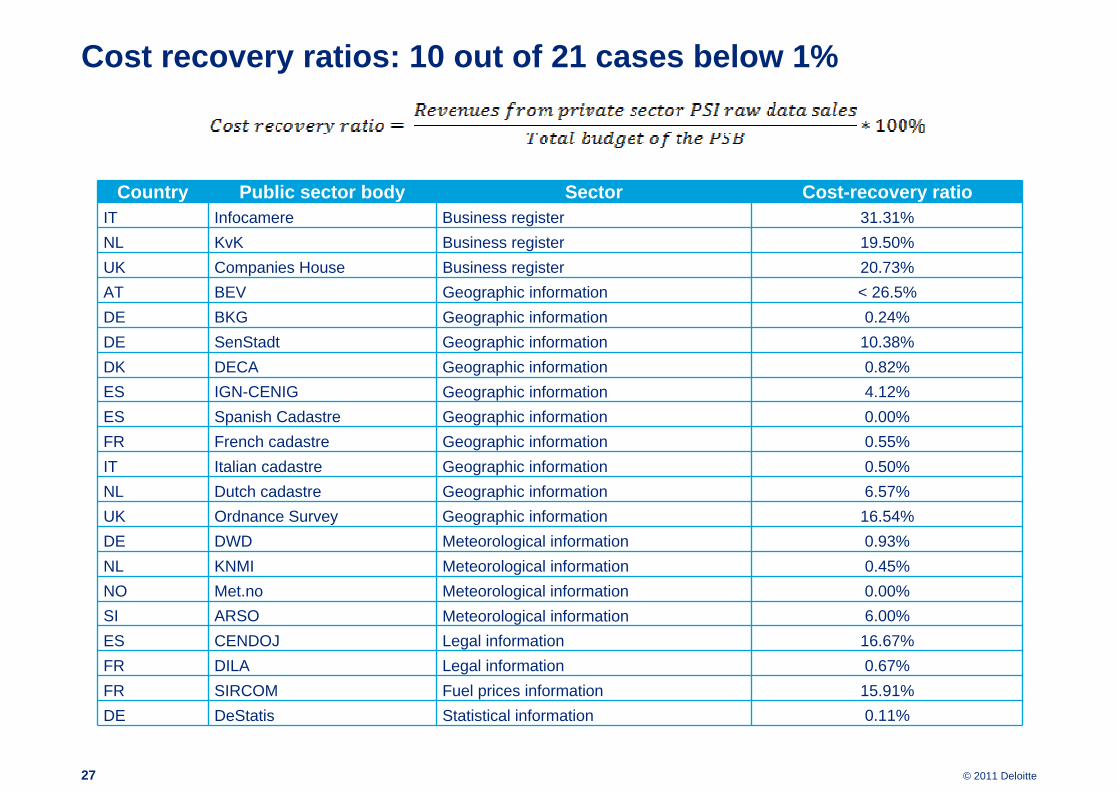
Cost recovery ratios: 10 out of 21 cases below 1%
27
Country Public sector body Sector Cost-recovery ratioIT Infocamere Business register 31.31%NL KvK Business register 19.50%UK Companies House Business register 20.73%AT BEV Geographic information < 26.5%DE BKG Geographic information 0.24%DE SenStadt Geographic information 10.38%DK DECA Geographic information 0.82%ES IGN-CENIG Geographic information 4.12%ES Spanish Cadastre Geographic information 0.00%FR French cadastre Geographic information 0.55%IT Italian cadastre Geographic information 0.50%NL Dutch cadastre Geographic information 6.57%UK Ordnance Survey Geographic information 16.54%DE DWD Meteorological information 0.93%NL KNMI Meteorological information 0.45%NO Met.no Meteorological information 0.00%SI ARSO Meteorological information 6.00%ES CENDOJ Legal information 16.67%FR DILA Legal information 0.67%FR SIRCOM Fuel prices information 15.91%DE DeStatis Statistical information 0.11%

© 2011 Deloitte28
PSI policy changesand effects

© 2011 Deloitte
PSI policy changes and effects (1/3)
29
Case study Policy change Effects
KNMI 1999•Switch from full cost-recovery charging to recovery of the re-use facilitation costs only.•Leading to an 80% decrease in price for the full KNMI national meteorological dataset.•Abstinence from its own commercial activities.•Selling off the commercial arm.
2010 (cumulative)•Private sector grew turnover by 400%.•Boosted re-user employment by 300%.•Stimulated innovation.•Gave rise to new business models.•Extra tax gains amount to total of 35 M EUR.•Internal efficiency gains of 3.5 M EUR.•Re-use department now run by 1.5 FTE.•Data quality and service delivery enhanced.•Level of professionalism increased.
DECA 2002•Under a ‘free of charge' agreement a central database of all Danish addresses was created, driven by public task ambitions.•Local PSBs were compensated for losses and rewarded by free re-use.•By distinguishing between the public sector investment and subsequent exploitation of the facility created, allocating the costs to those that benefit, there was no need to rely on cost-recovery above the re-use facilitation cost level.•An open network of distributors was established, acquiring PSI against re-use facilitation costs only.•No re-use limitations.
2010 (cumulative)•Increased turnover of re-use market by 1,000%.•Number of re-users went up by 10,000%.•Boosted FTEs employed by re-users by 800% - 1,000%.•Tax gains exceed PSB investment by 400%.•Almost 100% decrease on variable charges and relatively small fixed costs (0.01 M EUR).•Self-propelling and financing re-use system maximizing the multiplier effects in downstream markets.
Met.no 2007•Moved to a liberal re-use policy, driven by internal commitment.•All weather data, including most data from ECMWF partners, was opened up for free and anonymous re-use.•Stepped forward in the value chain, providing full service forecasts to all citizens, forcing re-users to further innovate.•Actively promoted its re-use philosophy in international fora.
2011 (cumulative)•Downstream effects are significant where the number of unique weekly re-users increased massively from around 100 to almost 3,000.•Met.no serves a need felt throughout Europe (and beyond) since over 40% of re-users are from outside Norway.•Re-users appear to be SMEs integrating data in their own content services for large groups of users (rather than adding high-resolution value) and App builders.•Establishing a direct link with citizens assures the quality of the data (through feedback) and embeds the public business case (and the public funding) protecting it against reverse currents.
© 2011 Deloitte
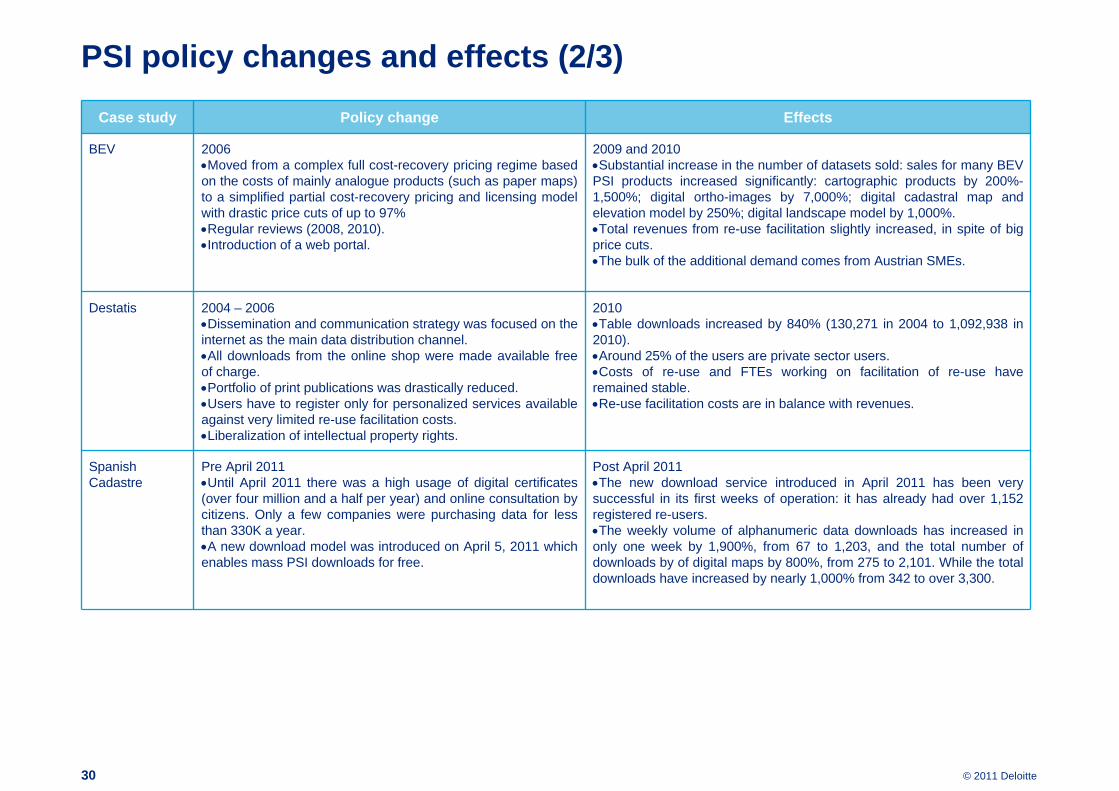
PSI policy changes and effects (2/3)
30
Case study Policy change Effects
BEV 2006•Moved from a complex full cost-recovery pricing regime based on the costs of mainly analogue products (such as paper maps) to a simplified partial cost-recovery pricing and licensing model with drastic price cuts of up to 97% •Regular reviews (2008, 2010).•Introduction of a web portal.
2009 and 2010•Substantial increase in the number of datasets sold: sales for many BEV PSI products increased significantly: cartographic products by 200%-1,500%; digital ortho-images by 7,000%; digital cadastral map and elevation model by 250%; digital landscape model by 1,000%.•Total revenues from re-use facilitation slightly increased, in spite of big price cuts.•The bulk of the additional demand comes from Austrian SMEs.
Destatis 2004 – 2006•Dissemination and communication strategy was focused on the internet as the main data distribution channel.•All downloads from the online shop were made available free of charge.•Portfolio of print publications was drastically reduced. •Users have to register only for personalized services available against very limited re-use facilitation costs.•Liberalization of intellectual property rights.
2010•Table downloads increased by 840% (130,271 in 2004 to 1,092,938 in 2010).•Around 25% of the users are private sector users.•Costs of re-use and FTEs working on facilitation of re-use have remained stable.•Re-use facilitation costs are in balance with revenues.
Spanish Cadastre
Pre April 2011•Until April 2011 there was a high usage of digital certificates (over four million and a half per year) and online consultation by citizens. Only a few companies were purchasing data for less than 330K a year.•A new download model was introduced on April 5, 2011 which enables mass PSI downloads for free.
Post April 2011•The new download service introduced in April 2011 has been very successful in its first weeks of operation: it has already had over 1,152 registered re-users.•The weekly volume of alphanumeric data downloads has increased in only one week by 1,900%, from 67 to 1,203, and the total number of downloads by of digital maps by 800%, from 275 to 2,101. While the total downloads have increased by nearly 1,000% from 342 to over 3,300.

© 2011 Deloitte
PSI policy changes and effects (3/3)
31
Case study Policy change Effects
IGN-CNIG Pre-2008•Prior to 2008, all the PSI was for sale.•Prior to 2008, there were only ten re-users (including both commercial and non-commercial re-users). Hence the increase has been remarkable.
Post 2008•Today means over 40 re-users (the majority of them are SMEs) are purchasing the information for commercial purposes.•Since October 2010, the volume of data services and users has doubled.•Between 2008 and February 2010, there have been about 165,257 requests from 37,417 non-commercial re-users.
Ordnance Survey
April 2010 •Introduction of tiered ‘freemium model’ of data provision.•The lowest tier of the model provides access to information in four product categories (topographic mapping, address location, route networks and consumer mapping) for free at the point of use.
2011 •The full impact of changes is yet to be tested empirically.•Re-users suggest wider availability of free data has led more people to use this resource.•Re-users suggest that greater use has led to an increase in the assistance they provide to help the new users to use the free data effectively.

© 2011 Deloitte32
Transition financing measures of selected PSBs

© 2011 Deloitte
Transition financing measures of selected PSBs (1/2)
33
Case study name Charging regime move Financing measures
DECA Nonexistent re-use facilitation cost recovery.
- Compensation towards municipalities through:• One-off payment;• Future free use of database. - 3 M EUR budget to cover the investments to be made.- Clear self-financing exploitation plan for future re-users.
KNMI Cost-recovery + own added value products re-use facilitation cost recovery.
- Public funding of reorganisation for privatising the commercial arm.
- 0.2 M EUR funding for investments.- Clear self-financing exploitation plan for future re-users.
Met.no Cost-recovery zero cost pricing (+ re-use facilitation cost recovery for ‘guaranteed delivery’).
- Compensation of 125,000 EUR from the Ministry.- Other transition costs (a small amount) were covered by
own resources.
UK Ordnance Survey Cost-recovery zero costing at the point of use for some less granular products. Higher quality products still attract a fee.
- Introduction of tiered ‘freemium model’ of data provision in April 2010, state funding was facilitated to enable ‘free distribution’ of lower quality data.
- Full impact yet to be assessed.
IGN-CNIG Cost-recovery zero costing/marginal cost for non-commercial re-users.
- Marginal costs request and commercial re-users sales have allowed the maintenance of a similar level of income to before 2008 (many small transactions as opposed to only a few large ones).
© 2011 Deloitte
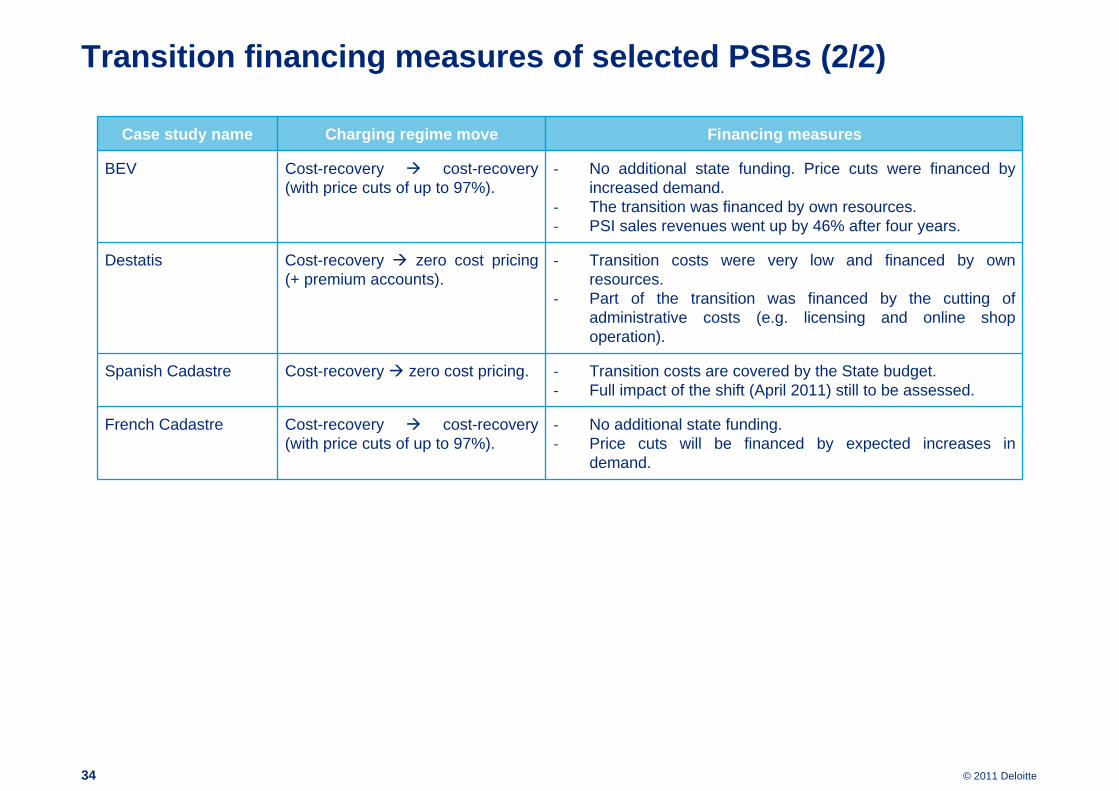
Transition financing measures of selected PSBs (2/2)
34
Case study name Charging regime move Financing measures
BEV Cost-recovery cost-recovery (with price cuts of up to 97%).
- No additional state funding. Price cuts were financed by increased demand.
- The transition was financed by own resources.- PSI sales revenues went up by 46% after four years.
Destatis Cost-recovery zero cost pricing (+ premium accounts).
- Transition costs were very low and financed by own resources.
- Part of the transition was financed by the cutting of administrative costs (e.g. licensing and online shop operation).
Spanish Cadastre Cost-recovery zero cost pricing. - Transition costs are covered by the State budget.- Full impact of the shift (April 2011) still to be assessed.
French Cadastre Cost-recovery cost-recovery (with price cuts of up to 97%).
- No additional state funding.- Price cuts will be financed by expected increases in
demand.

© 2011 Deloitte
Deloitte refers to one or more of Deloitte Touche Tohmatsu Limited, a UK private company limited by guarantee, and its network of member firms, each of which is a legally separate and independent entity. Please see www.deloitte.com/about for a detailed description of the legal structure of Deloitte Touche Tohmatsu Limited and its member firms.
Deloitte provides audit, tax, consulting, and financial advisory services to public and private clients spanning multiple industries. With a globally connected network of member firms in more than 140 countries, Deloitte brings world-class capabilities and deep local expertise to help clients succeed wherever they operate. Deloitte's approximately 170,000 professionals are committed to becoming the standard of excellence.
This publication contains general information only, and none of Deloitte Touche Tohmatsu Limited, Deloitte Global Services Limited, Deloitte Global Services Holdings Limited, the Deloitte Touche Tohmatsu Verein, any of their member firms, or any of the foregoing’s affiliates (collectively the “Deloitte Network”) are, by means of this publication, rendering accounting, business, financial, investment, legal, tax, or other professional advice or services. This publication is not a substitute for such professional advice or services, nor should it be used as a basis for any decision or action that may affect your finances or your business. Before making any decision or taking any action that may affect your finances or your business, you should consult a qualified professional adviser. No entity in the Deloitte Network shall be responsible for any loss whatsoever sustained by any person who relies on this publication.