pong device hjr environmental heather nelson jeannette harduby rudi schuech hjr
Post on 22-Dec-2015
218 views
TRANSCRIPT

Pong Device
HJR EnvironmentalHeather Nelson
Jeannette Harduby
Rudi Schuech
HJR

Project Goals
• To design a constant flow control device capable of handling turbid water– Easy to operate and maintain– Not prone to clogging– Inexpensive to build
• Build and test preliminary model
• Analyze data and make recommendations for further research

Flexible tubing
Removable adapters w/ internal mesh screens
Sand pipe
Sealing pipe
Pong pipe
Tubing-pipe adapter
Tubing-pipe adapter
Dramatization. Actual droplets may be smaller.
Head that ping pong ball must retain
Driving head for sand column
Height of sand
Initial water height
Perforated Baffle
Pour water in here
What happens when user stops adding water?

Sand colum
nHJR
Holding container (bucket or glass column)
Pong pipe
Sealing pipe
Driving pressure for sand column
Upflow prevents trapped air
(keyword: “prevent”)!

Force Balance
WPB
DB
sDssP
FFFF
VF
RHVLRF
0
])[(
1
202
2
θ2
θ1
Rs
Rp
Rp
Rp
Ls
sealing pipe (not to scale!)
Static pressure force = γH0
L2
L1
Rp - L1
Rp - L2
Vd1
Vd2
Vc2
Vc1
Volumes of top and bottom spherical sections are Vp2, Vp1
H0
Total pressure head ≈ 25 cm
→ Sealing pipe diameter = 7 mm!
Does it leak?
Not really – leaks about 7 mL/day (.04% of 20 L/day target!)
Ice cream = Ice cream cone – cone !

poreL 2
w pore
32 LVh
gD
Sand colum
n
1
2
0 poreV V
1/3
pore sandgrainD D1
L
Assuming # pores = # sand grains, and
Porosity = θ = Vpores/Vtotal = Apores / Atotal……
z1-z2
2 21 1 2 2
1 22 2 L
p V p Vz z h
g g
= hL!
1 2 0 (z z ) V Q Flow Rate Through Sand Column
0
10
20
30
40
50
60
70
0 1 2 3 4 5 6
Driving Pressure Head (cm)
Flo
w R
ate
(L
/day)
10 cm hL → 20 L/day
expected 1.5 cm → sand diameter < 0.4 mm


The Ithaca Effect(air bubbles)
10
12
14
16
18
20
22
24
0 5 10 15 20
Elapsed Time (hrs)
Flo
w R
ate
(L
/da
y)
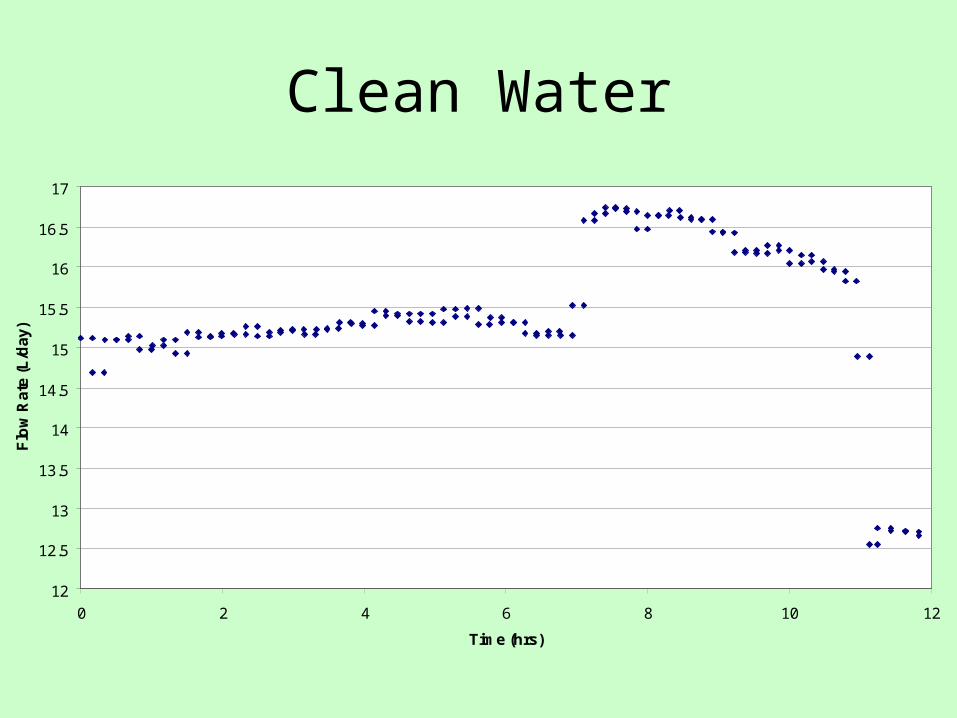
Clean Water
12
12.5
13
13.5
14
14.5
15
15.5
16
16.5
17
0 2 4 6 8 10 12
Time (hrs)
Flo
w R
ate
(L
/da
y)

Dirty Water (150 NTU)
10
12
14
16
18
20
22
24
0 2 4 6 8 10 12
Elapsed Time (hrs)
Flo
w R
ate
(L/d
ay)

Testing Conclusions
• Pong Device very sensitive to movement, needs to be designed more rigidly
• Flow rate fluctuates over time
• Possible cause: air bubbles forming in tubing – sand column needs to be shaken approximately every 6 hours
• With dirty water flow rate decreases steadily over time

Further Reflections
• Bubbles won’t be a problem when water is at equilibrium with outside temperature

Recommendations
• Develop rigid Pong Device design
• Test in field conditions
• Contact NGO’s and other organizations working on similar research projects to fill gap in primary sources

Questions?