polytechnic university, brooklyn, ny 11201 midterm review
TRANSCRIPT

Midterm Review
Yao WangPolytechnic University, Brooklyn, NY 11201
Based on J. L. Prince and J. M. Links, Medical Imaging Signals and Systems, and lecture notes by Prince. Figures are from the textbook.

EL582 Radiation Physics Yao Wang, Polytechnic U., Brooklyn 2
Topics to be Covered• Image Quality (Chap3)• Radiation Physics (Chap4)• Projection Radiography (Chap5)• Computed Tomography (Chap6)

EL582 Radiation Physics Yao Wang, Polytechnic U., Brooklyn 3
Image Quality (Chap3, Lect.1)• Contrast and modulation transfer function• Resolution• Noise: signal to noise ratio• Diagnostic accuracy
EL582 Radiation Physics Yao Wang, Polytechnic U., Brooklyn 4
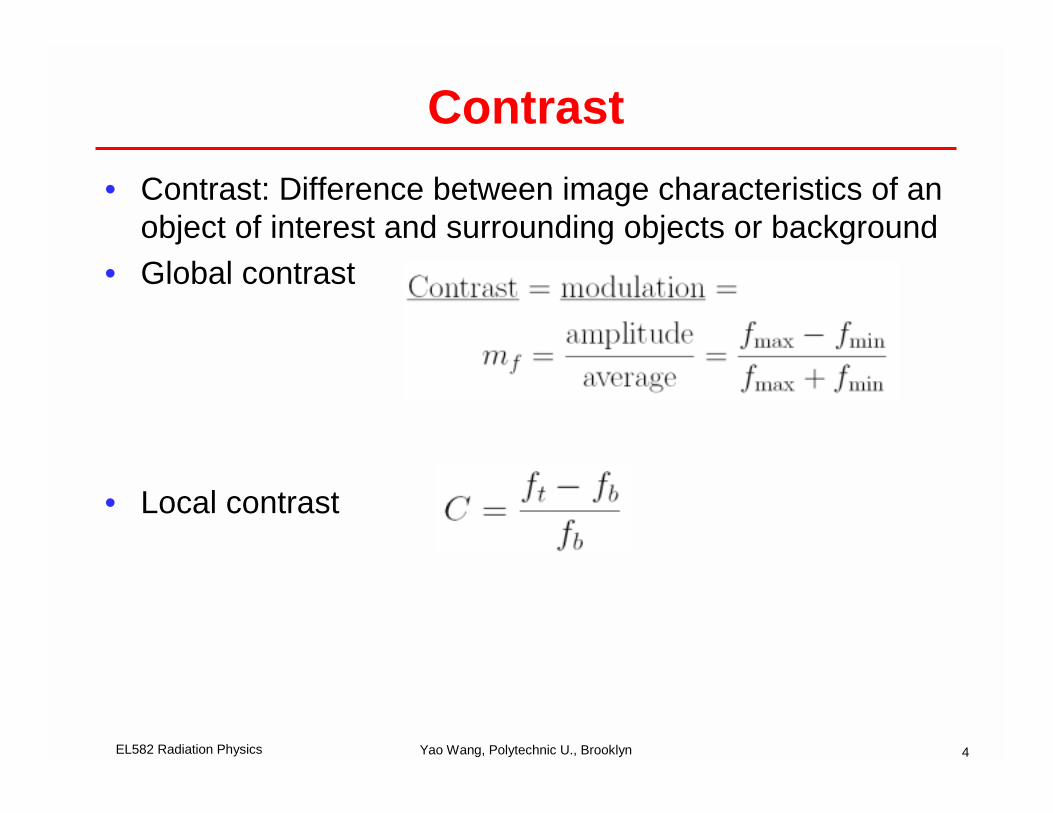
Contrast• Contrast: Difference between image characteristics of an
object of interest and surrounding objects or background• Global contrast
• Local contrast

EL582 Radiation Physics Yao Wang, Polytechnic U., Brooklyn 5
Modulation Transfer Function• The actual signal being imaged can be decomposed into many
sinusoidal signals with different frequencies
• Suppose the imaging system can be considered as a LSI system with frequency response H(u,v)
• Imaged signal is
• The MTF refers to the ratio of the contrast (or modulation) of the imaged signal to the contrast of the original signal at different frequencies
AHBvuH
myvxuBvuHAHyxg kkkkgkk
kkkk )0,0(
),();22sin(),()0,0(),( , =++= ∑ ππ
ABmyvxuBAyxf k
kfkkk
k =++= ∑ ,);22sin(),( ππ
)0,0(),(
),(,,
,,
HvuH
mm
vuMTFvuf
vug ==

EL582 Radiation Physics Yao Wang, Polytechnic U., Brooklyn 6
MTF vs. Frequency Response• MTF characterizes how the contrast (or modulation) of a signal
component at a particular frequency changes after imaging• MTF = magnitude of the frequency response of the imaging
system (normalized by H(0,0))• Typically 1)0,0(),(0 =≤≤ MTFvuMTF
Decreasing MTF at higher frequencies causes the blurring of high frequency features in an image

EL582 Radiation Physics Yao Wang, Polytechnic U., Brooklyn 7
Resolution defined by FWHM• Resolution refers to the
ability of a system to depict spatial details.
• Resolution of a system can be characterized by its line spread function– How wide a very thin line
becomes after imaging– Full width at half maximum
(FWHM) determines the distance between two lines which can be separated after imaging
– The smaller is FWHM, the higher is the resolution
Line spread function (impulse response)

EL582 Radiation Physics Yao Wang, Polytechnic U., Brooklyn 8
Distance > FWHM
Distance > FWHM
Distance = FWHM(barely separate)
Distance < FWHM(cannot separate)

EL582 Radiation Physics Yao Wang, Polytechnic U., Brooklyn 9
Resolution Defined by Bar Phantom • The resolution of an
imaging system can be evaluated by imaging a bar phantom.
• The resolution is the frequency (in lp/mm) of the finest line group that can be resolved after imaging.– Gamma camera: 2-3
lp/cm– CT: 2 lp/mm– chest x-ray: 6-8 lp/mm
•

EL582 Radiation Physics Yao Wang, Polytechnic U., Brooklyn 10
Resolution and MTF (or frequency response)
• A pure vertical sinusoidal pattern can be thought of as blurred image of uniformly spaced vertical lines
• The distance between lines is equal to distance between maxima• If the frequency = u0, the distance = 1/ u0
• If the maximum frequency at which MTF(u) (or H(u)) is non-zero is uc , the minimum distance between distinguishable lines (i.e. FWHM) = 1/ uc (uc is called the cut-off frequency of the system)
• The higher is the cut-off frequency, the higher is the system resolution
)2sin()0,0()0,()0,0()2sin()0,()0,0(),(
)2sin(),(
00
00
0
xuHuMTFAHxuuHAHyxg
xuBAyxf
ππ
π
+=+=
+=

EL582 Radiation Physics Yao Wang, Polytechnic U., Brooklyn 11
Example• Which system below has better contrast and resolution?

EL582 Radiation Physics Yao Wang, Polytechnic U., Brooklyn 12
Noise• Noise refers to random fluctuation of signals in an image• In x-ray imaging (projection or tomography), one source of noise is
the random fluctuation in the number of photons generated and detected by the x-ray generator (N)– N is modeled by Poisson distribution:
• Noise in the reconstructed image is a function of N, depending on the relation between the pixel value, the absorption properties of the imaged object, and N– Differing in projection radiography and CT
akNVarakNE
kekakN
ij
ij
ak
ij
==
==
=== −
}{
}{
,...1,0;!
}Pr{

EL582 Radiation Physics Yao Wang, Polytechnic U., Brooklyn 13
Signal to Noise Ratio• Amplitude SNR vs. Power SNR
• SNR in dB– SNR (dB) = 20 log 10 SNRa
– = 10 log 10 SNRp

EL582 Radiation Physics Yao Wang, Polytechnic U., Brooklyn 14
Diagnostic Accuracy• Contingency Table

EL582 Radiation Physics Yao Wang, Polytechnic U., Brooklyn 15
• If the diagnosis is based on a single value of a test result and the decision is based on a chosen threshold, the sensitivity and specificity can be visualized as follows
Should be able to determine a,b,c,d given the two distributions

EL582 Radiation Physics Yao Wang, Polytechnic U., Brooklyn 16
Physics of Radiography (Chap4, Lect 2)
• Ionizing radiation and generation of x-ray• Absorption and scattering of x-ray• Radiation measurement

EL582 Radiation Physics Yao Wang, Polytechnic U., Brooklyn 17
Radiation Physics • Ionization: ejection of an orbiting electron from an atom, the affected
atom produces radiation in the process of returning to ground state• Two types of ionizing radiation
– Particulate (used to generate x-ray)– EM (used for x-ray imaging)
• Particulate radiation transfers energy via – Collisional transfer: resulting in heat– Radioactive transfer: resulting in characteristic x-ray and
Bremsstrahlung x-ray– X-ray is produced by energetic electrons accelerated in a x-ray tube,
consisting primarily Bremsstrahlung x-ray• EM radiation transfers energy via
– Photoelectric effect: incident photons completely absorbed (good effect)– Compton scattering: incident photons are deflected (bad effect)

EL582 Radiation Physics Yao Wang, Polytechnic U., Brooklyn 18
Attenuation of EM Radiation• Linear attenuation coefficient is the fraction of photons
that are lost per unit length– Depends on material property and the incident photon energy– Bone, soft tissue, blood, etc. have very different attenuation
property --- basis of x-ray imaging
• Fundamental photon attenuation law– Homogeneous slab– Heterogeneous slab
Measured signal
Reconstructed property

EL582 Radiation Physics Yao Wang, Polytechnic U., Brooklyn 19
Measure of Radiation Effect• Exposure: number of ions produced in a unit volume
(Roentgen or R)• Dose: absorbed energy per unit volume (rad)
– Exposure vs. dose: D=fX– In soft tissue, f~1: 1 Roenden exposure in soft tissue produces
1 rad exposure (f=1)
• Equivalent dose: H=DQ• Q = 1 for x-ray, gamma ray, electron, beta particle • Q = 10 for neutrons and protons• Q = 20 for alpha particles
• Effective dose:
jw
HwD
j
organsjjeffective
organ for factor weighting:
∑=

EL582 Radiation Physics Yao Wang, Polytechnic U., Brooklyn 20
Projection Radiography (Chap5, Lec3)
• Instrumentation– X-ray tube configuration – Filtration and restriction of x-ray photons– Compensation and Scatter control– Film screen detector
• Image formation– Basic imaging equation– Geometric effect– Extended source– Detector/film response
• Image quality– Contrast and SNR– Effect of noise and Compton scattering

EL582 Radiation Physics Yao Wang, Polytechnic U., Brooklyn 21
Radiographic System

EL582 Radiation Physics Yao Wang, Polytechnic U., Brooklyn 22
X-ray Tube

EL582 Radiation Physics Yao Wang, Polytechnic U., Brooklyn 23
X-Ray Spectra

EL582 Radiation Physics Yao Wang, Polytechnic U., Brooklyn 24
Filtration, Restriction and Scatter Control and Contrast Agents
• Filtration: remove low energy photons (cannot differentiate among different tissues)
• Restriction and Scatter control: keeping only photons in straight line path
• Contrast agents: to change the attenuation coefficients of a body organ so that it can be imaged more clearly
• Dual energy X-ray imaging

EL582 Radiation Physics Yao Wang, Polytechnic U., Brooklyn 25
Basic Imaging Equations

EL582 Radiation Physics Yao Wang, Polytechnic U., Brooklyn 26
Example
Soft tissue µ=0.4
Blood vessel µ=0.2
w/contrast µ=20
1) What is the local contrast of the blood vessel?
2) What is the local contrast of the blood vessel when contrast agent is injected?
minmax
minmax
ol
)5.0*2.05.1*4.0(0max
)0.2*4.0(0min
C :contrast Global
;C :contrast Local
;:contrastw/o
IIII
III
eIIIeIII
b
b
o
b
+−=
−=
==
==+−
−

EL582 Radiation Physics Yao Wang, Polytechnic U., Brooklyn 27
Imaging of a Uniform Slab

EL582 Radiation Physics Yao Wang, Polytechnic U., Brooklyn 28

EL582 Radiation Physics Yao Wang, Polytechnic U., Brooklyn 29
Imaging of a non-homogeneous thin slice and with extended source
M=d/zm=1-M=-(d-z)/zx: detector positionx/m: source positionx/M: object position

EL582 Radiation Physics Yao Wang, Polytechnic U., Brooklyn 30
Overall Imaging Equation• Including all effects (geometric, extended source, film-screen
blurring), the image corresponding to a slab at z with transmittivityfunction tz(x,y) is
• The measured signal can be considered the input signal (t(x,y)) convolved with a combined impulse response depending on s(x,) and h(x,y) (source distribution and film response)
Film blurring function
source distribution
Oblique and inverse square law
tz(x,y)=exp{-µ(x,y) ∆z}

EL582 Radiation Physics Yao Wang, Polytechnic U., Brooklyn 31
SNR in Projection Radiography
Assuming incoming photon follows the poisson distribution with mean sqrt(Nb)
C is the contrast in terms of absorption coefficient

EL582 Radiation Physics Yao Wang, Polytechnic U., Brooklyn 32
Effect of Compton Scattering• Compton scattering causes the incident photons to be deflected
from their straight line path– Add a constant intensity Is in both target and background intensity
(“fog”)– Decrease in image contrast– Decrease in SNR
bb
b
b
bt
b
t
NCIC
IIIC
II
==
−=
σSNR
contrast
:intensity background :intensitytarget
:scattering W/o
bsbs
b
sb
b
b
b
b
ssb
b
sb
bt
sb
st
IINNN
CNN
NCIC
IICC
III
IIIIC
IIII
/11SNR
/1SNR'
1'contrast
:intensity background :intensitytarget
:scatteringW/
' +=
+=
+==
+=
+=
+−=
++
σ

EL582 Radiation Physics Yao Wang, Polytechnic U., Brooklyn 33
Summary• Projection radiography system consists of an x-ray tube, devices for
beam filtration and restriction, compensation filters, grids, and a film-screen detector (or digital detector, filmless)
• The detector reading (or image gray level) is proportional to the number of unabsorbed x-ray photons arriving at the detector, which depends on the overall attenuation in the path from the source to the detector
• The above relation must be modified to take into account of inverse square law, obliquity, anode heel effect, extended source and detector impulse response
• The degree of film darkening is nonlinearly related to the film exposure (detected x-ray) by the H&D curve
• Both detector noise and Compton scattering reduce contrast and SNR of the formed image

EL582 Radiation Physics Yao Wang, Polytechnic U., Brooklyn 34
Computed Tomography (Chap6, Lec.4,5)
• Tomography vs. Projection• Parallel vs. Fan Beam Projection• Reconstruction from parallel projection• Reconstruction from fanbeam projection• Blur due to non-ideal detector and windowing • Noise and SNR

EL582 Radiation Physics Yao Wang, Polytechnic U., Brooklyn 35
Projection vs. Tomography• Projection:
– A single image is created for a 3D body, which is a “shadow” of the body in a particular direction (integration through the body)

EL582 Radiation Physics Yao Wang, Polytechnic U., Brooklyn 36
Projection vs. Tomography• Tomography
– A series of images are generated, one from each slice of a 3D object in a particular direction (axial, coronal, sagittal)
– To form image of each slice, projections along different directions are first obtained, images are then reconstructed from projections (back-projection, Radon transform)

EL582 Radiation Physics Yao Wang, Polytechnic U., Brooklyn 37
1st Generation CT: Parallel Projections

EL582 Radiation Physics Yao Wang, Polytechnic U., Brooklyn 38
3G: Fan Beam

EL582 Radiation Physics Yao Wang, Polytechnic U., Brooklyn 39
CT Measurement Model

EL582 Radiation Physics Yao Wang, Polytechnic U., Brooklyn 40

EL582 Radiation Physics Yao Wang, Polytechnic U., Brooklyn 41
CT Number
Reconstructed image pixel value is CT number (12 bits)

EL582 Radiation Physics Yao Wang, Polytechnic U., Brooklyn 42
Projection Slice Theorem• Projection Slice theorem
– The Fourier Transform of a projection at angle θ is a line in the Fourier transform of the image at the same angle.

EL582 Radiation Physics Yao Wang, Polytechnic U., Brooklyn 43
Reconstruction Algorithm for Parallel Projections
• Backprojection:– Backprojection of each projection– Sum
• Filtered backprojection:– FT of each projection– Filtering each projection in frequency domain– Inverse FT– Backprojection– Sum
• Convolution backprojection– Convolve each projection with the ramp filter– Backprojection– Sum

EL582 Radiation Physics Yao Wang, Polytechnic U., Brooklyn 44
Practical Implementation• Projections g(l, θ) are only measured at finite intervals
– l=nτ; – τ chosen based on maximum frequency in G(ρ,θ), W
• 1/∆>=2W or ∆<=1/2W (Nyquist Sampling Theorem)• W can be estimated by the number of cycles/cm in the projection direction in the
most detailed area in the slice to be scanned• For filtered backprojection:
– Fourier transform G(ρ,θ) is obtained via FFT using samples g(nτ, θ)– If N sample are taken, 2N point FFT is taken by zero padding g(nτ, θ)
• For convolution backprojection– The ramp-filter is sampled at l=nτ– Sampled Ram-Lak Filter
( )
==−
==
evennoddnn
nnc
;0;/1
0;4/1)( 2
2
πττ
EL582 Radiation Physics Yao Wang, Polytechnic U., Brooklyn 45
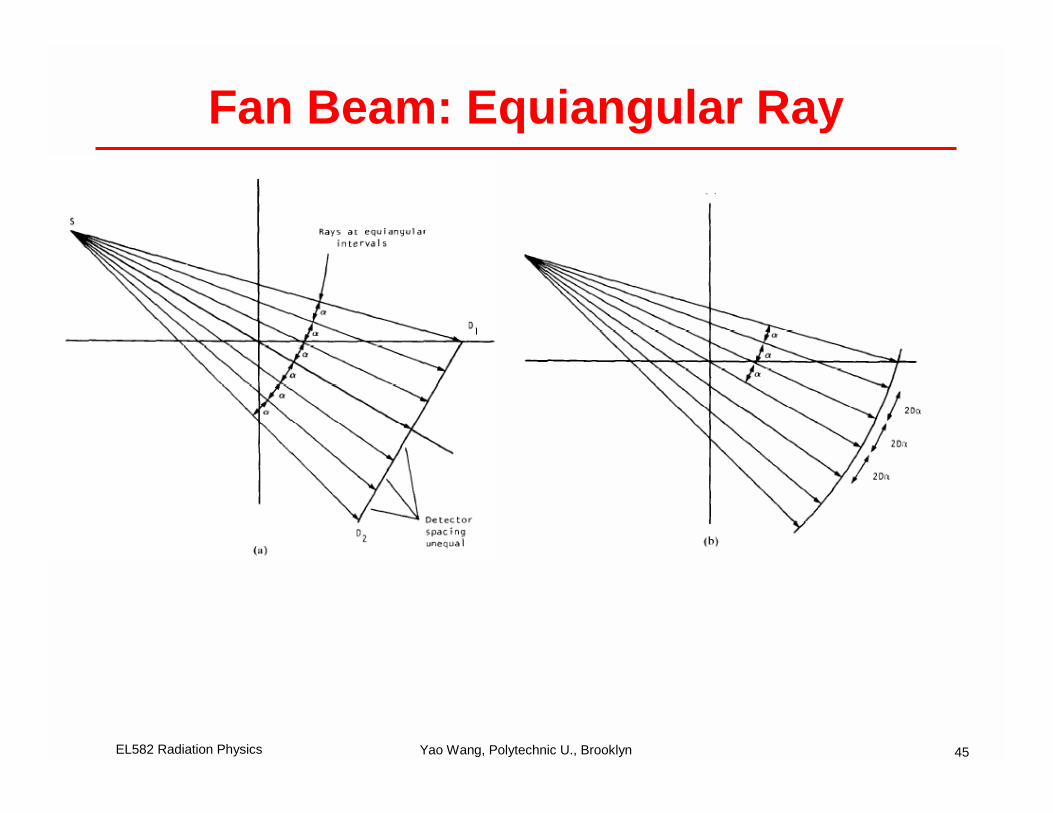
Fan Beam: Equiangular Ray

EL582 Radiation Physics Yao Wang, Polytechnic U., Brooklyn 46
Equiangular Ray Reconstruction
D’
rφ
( ) ( )( )
( )
( )
.projection parallelin usedfilter ramp theis )(
)(sin2
1)(
)cos(),(),(')(*),('),(
),'('
1),(
:formularon constructiRe)sin(
)cos(),('tan
)cos()sin(),('
:)','(by specified is ),(at source theto),(at pixel a ofposition relative The
).,( using coordinatepolar in thedrepresente is image tedReconstruc
2
2
02
222
γ
γγ
γγ
γβγβγγβγβγ
ββγφ
φβφβφγ
φβφβφγβ
φφ
π
c
cc
Dppcpq
dqD
rf
rDrr
rrDrD
DDr
r
f
f
=
=
=
=
−+−=
−+−+=
∫
γ’
Derivation not required for this class. Detail can be found at [Kak&Slaney].Note typos in [Prince&Links]. NOT required in exam.
β−φ
Weighted backprojection

EL582 Radiation Physics Yao Wang, Polytechnic U., Brooklyn 47
Blur due to Non-ideal Detector and Ramp Filter
• Area detector: can be characterized by an indicator function s(l) (aks impulse response)
• Recall that the ideal filter c(ρ) is typically modified by a window function W(ρ)
• Overall effect on projection: – g(l)’=g(l)*s(l)*w(l)
• Overall effect on reconstructed image: – f’(x,y)=f(x,y)*h(x,y)– h(x,y)=R^-1{s(l)*w(l)} = H^-1{ S(q)W(q)}
• Should know how to derive the blurring function based on given Hankel transform pair or from 2D Fourier transform directly

EL582 Radiation Physics Yao Wang, Polytechnic U., Brooklyn 48
SNR of reconstructed image• Noise is in detected number of photons for one source/detector pair,
N_ij, which follows Poisson distribution, with mean =variance=\bar N_ij
• Projection data g_ij is a function of N_ij, with mean and variance each a function of \bar N_ij
• Reconstructed image is a function of g_ij for all i,j, filter cutoff (ρ0), and detector width (T). – With various assumptions and \bar N_ij=\bar N, we get
– With ρ0=1/T
– For fan-beam: N_f photon/fan, D detector/fan, L length of detector array

EL582 Radiation Physics Yao Wang, Polytechnic U., Brooklyn 49
Midterm Exam• 10/30/06, 3:35-5:50, RH503 • Closed book, 1 sheet of notes allowed (double-sided)• Covers chap3,4,5,6• Not covered:
– Matlab implementation – Projection radiography: effects considering extended source and
film impulse response will not be covered– Fanbeam reconstruction algorithms
• Fourier transform pair and Hankel transform pair will be given if needed
• Office hours– Thursday (10/26) 4-5, Monday ?