polun chang, phd, ming chuan kuo, rn institute of biomedical informatics, national yang-ming...
TRANSCRIPT

Polun Chang, PhD, Ming Chuan Kuo, RNInstitute of BioMedical Informatics, National Yang-Ming University, Taipei, Taiwan/ROC
Nursing Department, Cathay General Hospital, Taipei, Taiwan/ROC
It has been known that visualization is a user-preferred and more meaningful interface of information systems. Since the large-screen LCD display and multi-display graphics card have become very affordable, it will be interesting to explore its potentials using simple and affordable solutions. We used the Microsoft Visio 2003 and Excel 2003 with the VBA automation tool, data imported from HIS, to design process flow, floor direction guide and care guide diagrams for Car-diac Catheterization. The learning curve for Visio VBA is not short but the preliminary results showed the technical and economic feasibility of simple visualization solutions in healthcare.
Data visualization has been proved to be a useful tool for business advantages [1]. However, most of the current EMR data collection, display and analysis are still represented in traditional numerical and textual formats, and on one dispaly. This might constrain the advanced use of EHR in improving caring process flow for healthcare professionals and in supporting patients. The objective of this study was to examine the technical and economic feasibility of designing visualization application in clinical settings, using affordable tools. These tools should also be easily learned by informatics healthcare professionals, such as nurses.
Abstract
Introduction
Materials and Methods The caring process flow of cardiac catheterization (CC) in a 776-bed medical center in Taipei, which averagely served 100 CC patients per month, was used to develop a demonstrative pilot Service and Care Monitoring Center (SCMC) system with visual interfaces. One nurse supervisor and one cardiology attending physician were invited to
determine the caring flow. One informatics nurse and one experienced Excel VBA programmer were teamed up for this pilot project starting in Feburary 2008. A networked Pentium-4, 3.2-GHz-CPU PC workstation, which was installed with a entry-level quad-display graphics card with G200 graphic chip, equipped with three 19” LCD displays and one 42” LCD TV was used as the hardware platform. Simultaed patient data is obtained from an independent ftp test site which was managed by the IT department and not directly connected to the HIS.
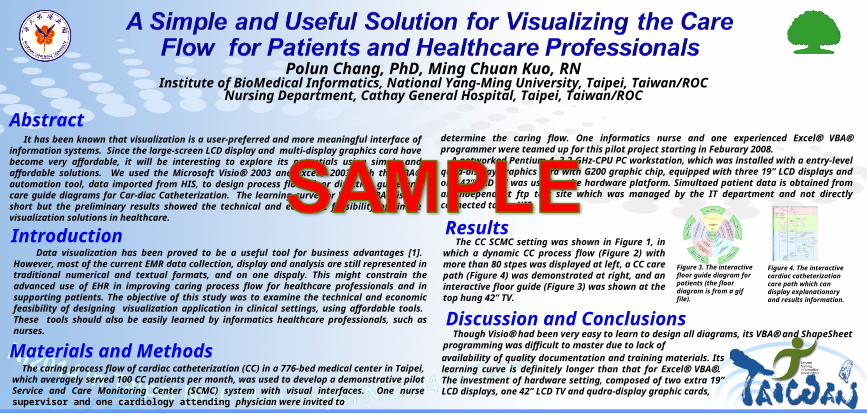
Results The CC SCMC setting was shown in Figure 1, in which a dynamic CC process flow (Figure 2) with more than 80 stpes was displayed at left, a CC care path (Figure 4) was demonstrated at right, and an interactive floor guide (Figure 3) was shown at the top hung 42” TV.
Discussion and Conclusions
Figure 3. The interactive floor guide diagram for patients (the floor diagram is from a gif file).
Figure 4. The interactive cardiac catheterization care path which can display explanationary and results information.
Though Visio had been very easy to learn to design all diagrams, its VBA and ShapeSheet programming was difficult to master due to lack ofavailability of quality documentation and training materials. Its learning curve is definitely longer than that for Excel VBA. The investment of hardware setting, composed of two extra 19” LCD displays, one 42” LCD TV and qudra-display graphic cards,