pollution prevention and waste management - us epa · tri national analysis 2013: pollution...
TRANSCRIPT
TRI National Analysis 2013: Pollution Prevention and Waste Management www2.epa.gov/toxics-release-inventory-tri-program/2013-tri-national-analysis
Updated January 2015
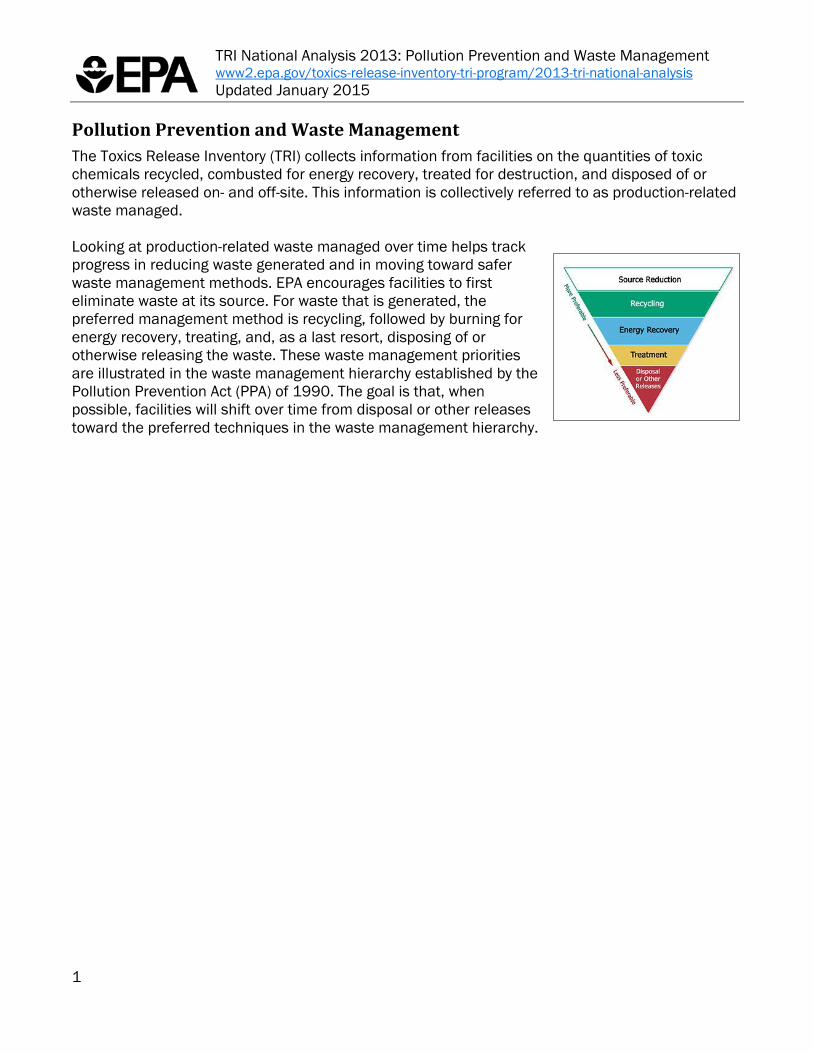
Pollution Prevention and Waste Management The Toxics Release Inventory (TRI) collects information from facilities on the quantities of toxic chemicals recycled, combusted for energy recovery, treated for destruction, and disposed of or otherwise released on- and off-site. This information is collectively referred to as production-related waste managed. Looking at production-related waste managed over time helps track progress in reducing waste generated and in moving toward safer waste management methods. EPA encourages facilities to first eliminate waste at its source. For waste that is generated, the preferred management method is recycling, followed by burning for energy recovery, treating, and, as a last resort, disposing of or otherwise releasing the waste. These waste management priorities are illustrated in the waste management hierarchy established by the Pollution Prevention Act (PPA) of 1990. The goal is that, when possible, facilities will shift over time from disposal or other releases toward the preferred techniques in the waste management hierarchy.
1
TRI National Analysis 2013: Pollution Prevention and Waste Management www2.epa.gov/toxics-release-inventory-tri-program/2013-tri-national-analysis
Updated January 2015
Waste Management Trends
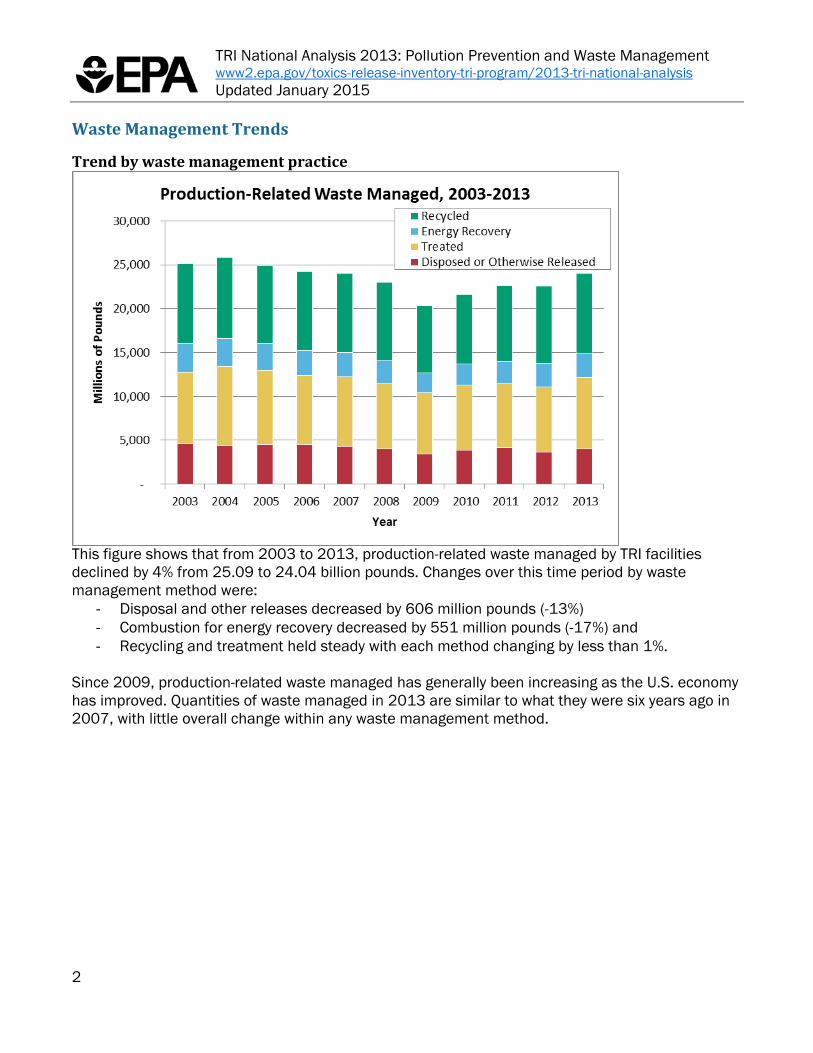
Trend by waste management practice
This figure shows that from 2003 to 2013, production-related waste managed by TRI facilities declined by 4% from 25.09 to 24.04 billion pounds. Changes over this time period by waste management method were:
- Disposal and other releases decreased by 606 million pounds (-13%) - Combustion for energy recovery decreased by 551 million pounds (-17%) and - Recycling and treatment held steady with each method changing by less than 1%.
Since 2009, production-related waste managed has generally been increasing as the U.S. economy has improved. Quantities of waste managed in 2013 are similar to what they were six years ago in 2007, with little overall change within any waste management method.
2

TRI National Analysis 2013: Pollution Prevention and Waste Management www2.epa.gov/toxics-release-inventory-tri-program/2013-tri-national-analysis
Updated January 2015
Waste Management by Industry Sector
Trend in waste managed by industry sector
This figure shows the seven industry sectors with the most reported waste managed in 2013. The contribution of each of the top sectors to production-related waste managed has not changed considerably between 2003 and 2013. For example, the top two sectors by total waste managed in 2013 (chemicals and primary metals) reported over half of waste managed in both 2003 and 2013. Most industry sectors reported a decline in production-related waste managed from 2003 to 2013 resulting in an overall decrease of 4%. Of the seven sectors shown in the figure, only two increased their quantity of waste managed since 2003 (metal mining and food/beverages/tobacco). In the past year, however, four of the seven sectors shown in the figure have increased their waste managed. Sectors with the greatest increases in wastes from 2012 to 2013 were:
- Chemical manufacturing, which increased by 856 million pounds (+9% from 2012) - Metal mining, which increased by 332 million pounds (+22%) - Electric utilities, which increased 109 million pounds (+7%) and - Food/beverages/tobacco, which increased by 98 million pounds (+7%).
Generated waste in some industries fluctuates considerably from year to year, due to changes in production or other factors (e.g., reporting in the mining sector can change significantly based on changes in the composition of waste rock).
3

TRI National Analysis 2013: Pollution Prevention and Waste Management www2.epa.gov/toxics-release-inventory-tri-program/2013-tri-national-analysis
Updated January 2015
Economic trend in production-related waste for the manufacturing sector
It is also important to consider the influence that production and the economy have on chemical waste generation. The figure above illustrates how changes in production levels at TRI facilities may influence production-related waste. It presents the trend in production-related waste managed by the manufacturing sector and the trend in the manufacturing sector’s value added (as shown by the solid line). “Value added” from the Bureau of Economic Analysis is used as a proxy for production levels for the manufacturing sector. Value added measures the contribution of manufacturing to the nation's Gross Domestic Product (GDP), which represents the total value of goods and services produced annually in the United States. While not all of the facilities that report to TRI are in the manufacturing sector, most are (89% in 2013). The manufacturing sector includes sectors such as chemical manufacturing, metals processing, and pulp and paper manufacturing, but excludes mining, electric utilities, and waste management facilities. In 2013, TRI manufacturing facilities accounted for 80% of the production-related waste managed. The solid line in the figure shows that value added by the manufacturing sector (adjusted for inflation) decreased by 4% from 2003 to 2013, while production-related waste managed by the manufacturing sector decreased by 8%. This graph demonstrates that, because waste is decreasing faster than production, factors other than production were also contributing to the reductions in releases. Other factors such as source reduction and pollution prevention (P2) practices are discussed in the Source Reduction/Pollution Prevention section. More information on production trends for individual sectors, including the electric utility and metal mining sectors, which are not included in the manufacturing sector, can be found in the industry sector profiles.
4

TRI National Analysis 2013: Pollution Prevention and Waste Management www2.epa.gov/toxics-release-inventory-tri-program/2013-tri-national-analysis
Updated January 2015
Source Reduction/Pollution Prevention (P2) Types of newly implemented source reduction
Note: Facilities report their source reduction activities by selecting from activities that fall into one of the eight categories listed in the graph legend. “Good operating practices” are defined by four codes in the Reporting Forms and Instructions, which facilities select when submitting their forms.
This figure shows the types of source reduction activities reported as implemented during 2013. In 2013, a total of 3,362 facilities (16% of all TRI facilities) reported initiating 10,623 source reduction activities. Of the source reduction activities implemented, good operating practices is reported the most at 37%. To learn more about source reduction and pollution prevention, see the TRI Pollution Prevention webpage. Facilities may have ongoing source reduction activities initiated in previous years that are not captured in the figure. You can find data on previously implemented source reduction activities by using the TRI P2 Search Tool.
5
TRI National Analysis 2013: Pollution Prevention and Waste Management www2.epa.gov/toxics-release-inventory-tri-program/2013-tri-national-analysis
Updated January 2015
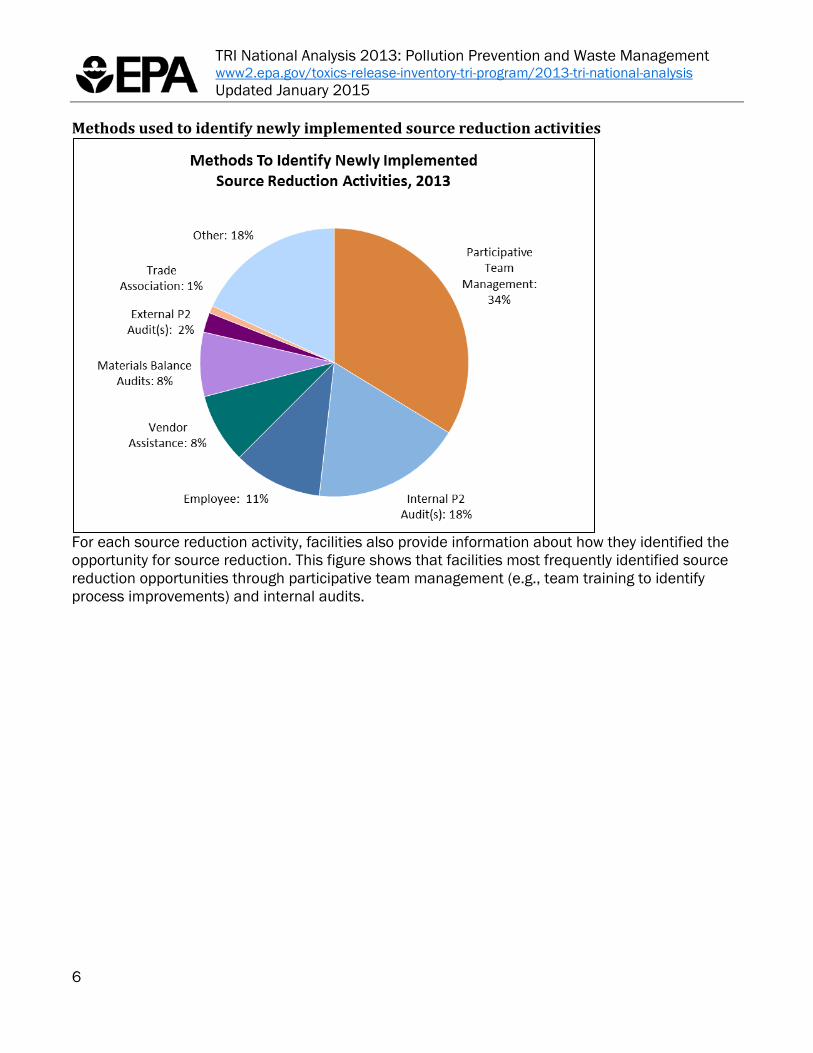
Methods used to identify newly implemented source reduction activities
For each source reduction activity, facilities also provide information about how they identified the opportunity for source reduction. This figure shows that facilities most frequently identified source reduction opportunities through participative team management (e.g., team training to identify process improvements) and internal audits.
6

TRI National Analysis 2013: Pollution Prevention and Waste Management www2.epa.gov/toxics-release-inventory-tri-program/2013-tri-national-analysis
Updated January 2015
Chemicals with largest percentage decrease in waste managed
Note: Limited to chemicals with at least 25 forms reporting source reduction and 100 total Form Rs in 2013. This figure shows the five chemicals with the greatest percentage decrease in waste quantities in recent years (from 2010 to 2013). Decreases in waste management quantities can be caused by many factors, including changes in production levels or estimation methods. Source reduction activities implemented by facilities have also played a significant role in reducing waste generation. The relationship between source reduction, changes in total waste generation, and chemical releases varies from chemical to chemical.
- In many cases, reducing the generation of total waste through source reduction also decreases the amount of chemical ultimately released to the environment. For example, releases of trichloroethylene (a carcinogen that is released primarily to air) declined by 19% over the same period that total waste managed declined by 16%.
- In cases where pollution is already being effectively controlled through management methods such as treatment and recycling, source reduction may reduce the amount of total chemical waste but does not significantly decrease chemical releases. For example, cobalt (another carcinogen) is managed almost exclusively through recycling at TRI facilities. While the total quantity of cobalt waste decreased by 19%, releases declined by only 2%.
- Finally, the quantity of releases can decrease at a greater rate than the quantity of total waste generated. For example, production-related waste of hydrochloric acid decreased by about 10% while releases decreased by 38%, as facilities switched from releasing hydrochloric acid to preferred management methods, such as treatment, and also undertook source reduction activities.
Source reduction activities reported for the five chemicals in this figure are shown in the next figure.
7

TRI National Analysis 2013: Pollution Prevention and Waste Management www2.epa.gov/toxics-release-inventory-tri-program/2013-tri-national-analysis
Updated January 2015
Types of source reduction activities for chemicals with largest decreases in waste managed
Notes: 1) Limited to chemicals with at least 25 forms reporting source reduction and 100 total forms in 2013. 2) Facilities report their source reduction activities by selecting from activities that fall into one of the eight categories listed in the graph legend. “Good operating practices” are defined by four codes in the Reporting Forms and Instructions, which facilities select when submitting their forms.
This figure shows the types of source reduction activities reported from 2010 to 2013 for the chemicals with the greatest percentage decrease in production-related waste managed over this time period. The type of source reduction activity implemented varies depending on the chemical’s use in industrial operations and the chemical’s characteristics. For example, some types of source reduction activities relate to:
- Cleaning and degreasing. Changing to aqueous cleaners is more commonly implemented for trichloroethylene, a common industrial solvent, than for the other chemicals shown.
- Spill and leak prevention. This activity is more commonly used to reduce waste of benzo(g,h,i)perylene, a persistent, bioaccumulative and toxic (PBT) chemical constituent in petroleum products. Common spill and leak prevention activities for this chemical include improving procedures for loading, unloading, and transfer operations at petroleum bulk terminals, and installing overflow alarms or automatic shutoff valves at asphalt product manufacturing facilities.
Facilities may also report additional details to TRI about their source reduction, recycling, or pollution control activities. For the chemicals profiled in the above figure, examples of additional
8

TRI National Analysis 2013: Pollution Prevention and Waste Management www2.epa.gov/toxics-release-inventory-tri-program/2013-tri-national-analysis
Updated January 2015
pollution prevention-related information reported are shown below with a link to each facility’s pollution prevention report in Envirofacts.
- Benzo(g,h,i)perylene: A rubber product manufacturer installed three natural gas boilers and decommissioned two #6 fuel oil boilers in an effort to reduce emissions. The change was made in September 2013 and resulted in a 36% reduction in benzo(g,h,i)perylene emissions from the previous year. The facility expects they will not have any benzo(g,h,i)perylene emissions in 2014. [facility details]
- Cobalt and Cobalt Compounds: By installing air pollution controls on its anode furnace, a copper smelter decreased emissions of hazardous air pollutants, including cobalt compounds. The project also resulted in approximately 12% savings in natural gas consumption. [facility details]
- Trichloroethylene: With the help of a vendor, a pipe and tube manufacturer improved the air blanket zone on its refrigeration lines and reduced releases of trichloroethylene. [facility details]
- Barium and Barium Compounds: A printing plate and ink manufacturing facility significantly reduced the use of barium compounds by reformulating its products. [facility details]
- Hydrochloric Acid: By changing to an immersion acid process instead of using spray acid equipment, a semiconductor manufacturer is reducing emissions of aerosolized hydrochloric acid. [facility details]
You can view all reported pollution prevention activities and compare facilities’ waste management methods and trends for any TRI chemical by using the TRI P2 Search Tool.
Industry sectors with the largest percentage decrease in releases
This figure shows the sectors with the greatest percentage decrease in releases from 2010 to 2013. For many sectors, source reduction activities, which reduce or eliminate waste generation at its source, have contributed to substantial decreases in both the amount of waste generated and
9
TRI National Analysis 2013: Pollution Prevention and Waste Management www2.epa.gov/toxics-release-inventory-tri-program/2013-tri-national-analysis
Updated January 2015
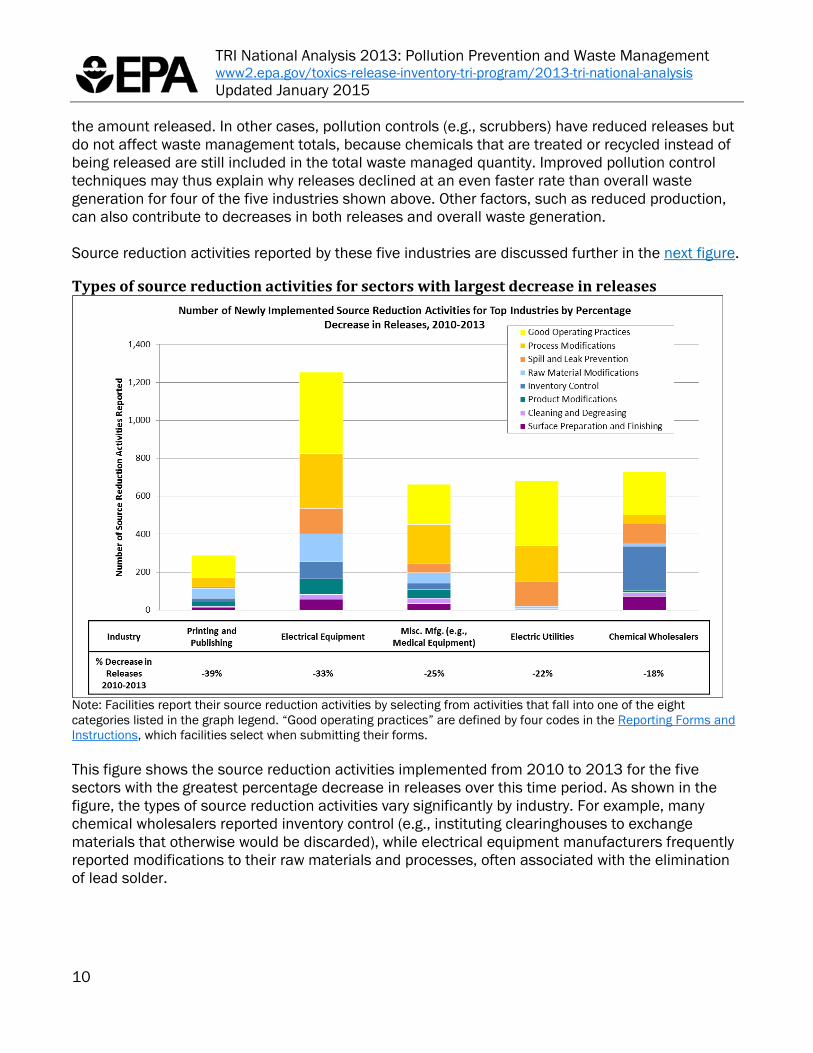
the amount released. In other cases, pollution controls (e.g., scrubbers) have reduced releases but do not affect waste management totals, because chemicals that are treated or recycled instead of being released are still included in the total waste managed quantity. Improved pollution control techniques may thus explain why releases declined at an even faster rate than overall waste generation for four of the five industries shown above. Other factors, such as reduced production, can also contribute to decreases in both releases and overall waste generation. Source reduction activities reported by these five industries are discussed further in the next figure.
Types of source reduction activities for sectors with largest decrease in releases
Note: Facilities report their source reduction activities by selecting from activities that fall into one of the eight categories listed in the graph legend. “Good operating practices” are defined by four codes in the Reporting Forms and Instructions, which facilities select when submitting their forms. This figure shows the source reduction activities implemented from 2010 to 2013 for the five sectors with the greatest percentage decrease in releases over this time period. As shown in the figure, the types of source reduction activities vary significantly by industry. For example, many chemical wholesalers reported inventory control (e.g., instituting clearinghouses to exchange materials that otherwise would be discarded), while electrical equipment manufacturers frequently reported modifications to their raw materials and processes, often associated with the elimination of lead solder.
10
TRI National Analysis 2013: Pollution Prevention and Waste Management www2.epa.gov/toxics-release-inventory-tri-program/2013-tri-national-analysis
Updated January 2015
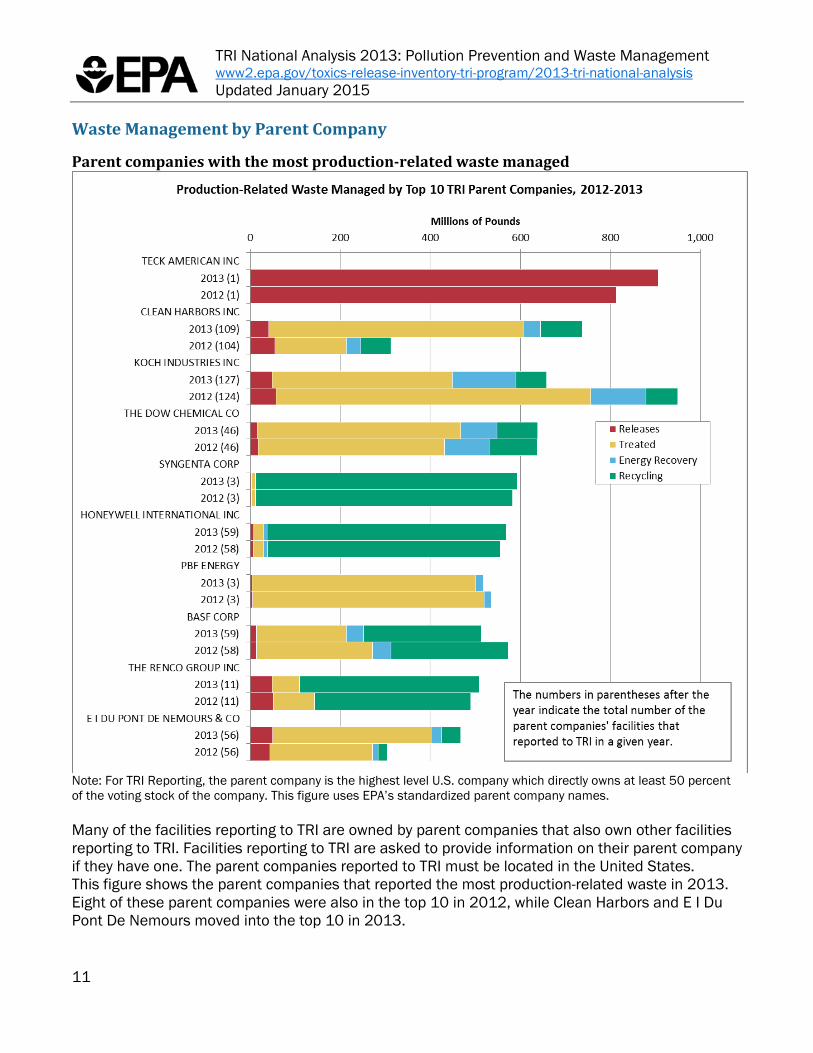
Waste Management by Parent Company
Parent companies with the most production-related waste managed
Note: For TRI Reporting, the parent company is the highest level U.S. company which directly owns at least 50 percent of the voting stock of the company. This figure uses EPA’s standardized parent company names. Many of the facilities reporting to TRI are owned by parent companies that also own other facilities reporting to TRI. Facilities reporting to TRI are asked to provide information on their parent company if they have one. The parent companies reported to TRI must be located in the United States. This figure shows the parent companies that reported the most production-related waste in 2013. Eight of these parent companies were also in the top 10 in 2012, while Clean Harbors and E I Du Pont De Nemours moved into the top 10 in 2013.
11

TRI National Analysis 2013: Pollution Prevention and Waste Management www2.epa.gov/toxics-release-inventory-tri-program/2013-tri-national-analysis
Updated January 2015
These parent companies vary in size and in the sectors in which they operate. The number of TRI reporting facilities owned by these companies ranges from 1 to 127. The parent companies’ TRI facilities operate in the following sectors:
- Metal mining: Teck American - Hazardous waste and solvent recovery: Clean Harbors - Multiple sectors, e.g., pulp and paper, petroleum refining, and chemicals: Koch Industries - Chemical manufacturing: Dow Chemical, Syngenta, Honeywell International, BASF, and E I
Du Pont De Nemours - Petroleum Refining: PBF Energy - Metal smelting: The Renco Group
Nine of these top parent companies reported implementing one or more new source reduction activities in 2013. Some companies also reported additional (optional) information to TRI about their pollution prevention or waste management activities. Among the top 10 parent companies, additional information reported included:
- A Honeywell facility worked with vendor and internal department resources to develop a new formulation for its coating line. This raw material substitution resulted in a 99% reduction in the use of methanol at the facility. (Raw Material Modification) [facility details]
- Through an internal pollution prevention audit and an employee recommendation, a Syngenta facility reduced ammonia emissions by improving ammonia recovery through stripping and optimizing the conditions of reactions that involve ammonia. (Process Modification) [facility details]
- A BASF organic chemical manufacturing plant implemented a site-wide spill prevention plan, focused specifically on over-fill protections and safer chemical transfer. (Spill and Leak Prevention) [facility details]
To conduct a similar type of parent company comparison for a given sector, chemical, or geographic location, use the TRI P2 Search Tool.
12

TRI National Analysis 2013: Pollution Prevention and Waste Management www2.epa.gov/toxics-release-inventory-tri-program/2013-tri-national-analysis
Updated January 2015
Parent companies with the greatest number of new source reduction activities
Notes: 1) For TRI Reporting, the parent company is the highest level U.S. company that directly owns at least 50% of the voting stock of the company. This figure uses EPA’s standardized parent company names. 2) Facilities report their source reduction activities by selecting from activities that fall into one of the eight categories listed in the graph legend. “Good operating practices” are defined by four codes in the Reporting Forms and Instructions, which facilities select when submitting their forms.
This figure presents the parent companies that reported the most newly implemented source reduction activities in 2013. The parent companies’ TRI facilities primarily operate in the following industries:
- Pulp and paper, petroleum refining, and chemicals: Koch Industries - Chemical manufacturing sector: Valspar, 3M and BASF
13

TRI National Analysis 2013: Pollution Prevention and Waste Management www2.epa.gov/toxics-release-inventory-tri-program/2013-tri-national-analysis
Updated January 2015
- Petroleum refining and chemicals: Shell Oil - Bulk petroleum industry (store and distribute crude petroleum and petroleum products):
Global Partners - Metal containers: Silgan Holdings - Steel manufacturing: Nucor - Chemicals, fabricated metals, and industrial equipment: Illinois Tool Works - Electric utility: Salt River Project
Good operating practices, such as improving maintenance scheduling and installation of quality monitoring systems, are the most commonly reported source reduction activities for these top parent companies. Spill and leak prevention and process modifications are also commonly reported. Some of these parent companies submitted additional text to EPA with their TRI reports describing their pollution prevention activities. Examples include:
- An automotive products manufacturing facility, owned by Illinois Tool Works, reduced the need to flush pipe lines when changing product lines by adding designated pipe lines for specific chemical products. (Process Modification) [facility details]
- By switching from a batch manufacturing process to a continuous process, one 3M Co chemical facility reduced total waste of certain glycol ethers. (Process Modification) [facility details]
- A BASF organic chemical manufacturer reduced its use of nitric acid by implementing more precise delivery methods and improved metering. [facility details]
You can find P2 activities reported by a specific parent company and compare facilities’ waste management methods and trends for any TRI chemical by using the TRI P2 Search Tool.
14