pollution and health problems in horticultural production ... · pollution and health problems in...
TRANSCRIPT

Pollution and Health Problems in Horticultural Production in Harare:
A Literature Review 1Baggs E.M., 1Poulton C., 1Poole N. & 2Mapanda F. 1Imperial College at Wye, Department of Agricultural Sciences, Wye, Ashford, Kent TN25 5AH. UK. 2Department of Soil Science & Agricultural Engineering, University of Zimbabwe, Box MP167, Mount Pleasant, Harare, Zimbabwe.
Project R7519
December 2001
i

This publication is an output from a research project funded by the United Kingdom Department for International Development (DFID) for the benefit of developing countries. The Crop Post-Harvest Research Programme operates in Zimbabwe under a Memorandum of Understanding with the Department of Research and Specialist Services (DR&SS). The views expressed are not necessarily those of DFID nor of DR&SS.
ii
Table of Contents
1. Introduction ............................................................................................................... 1
2. Smallholder Horticultural Production and Markets in and around Harare ............... 1
2.1. Introduction...................................................................................................... 1
2.2. Markets for Horticultural Produce in Harare...................................................... 2 2.2.1. Wholesale Markets ................................................................................................................ 2
2.2.1.1 Mbare Musika .................................................................................................................. 4 2.2.1.2 Chikwanha Market........................................................................................................... 8 2.2.1.3 Independent Wholesalers ................................................................................................. 9
2.2.2. Retail Activities.............................................................................................................. 10 2.3. Smallholder Horticultural Production in Mashonaland East ............................ 12
2.3.1 Marketing Issues ................................................................................................................... 15
3. Soil and water borne pollution ................................................................................ 18
3.1 Introduction........................................................................................................ 18
3.2 Wastewater use in Zimbabwe ............................................................................ 18 3.2.1 Heavy metal contamination along Mukuvisi River and Lake Chivero ................................. 21 3.2.2 Heavy metal contamination resulting from disposal of sewage sludge ................................ 23
3.2.2.1 Case study: Crowborough Sewage Treatment Works and Farm ................................... 24 3.3 Plant uptake of heavy metals from soils ............................................................ 27
3.4 Health effects of heavy metals........................................................................... 30 3.4.1 Lead ...................................................................................................................................... 30 3.4.2 Other metals .......................................................................................................................... 31
3.5 Pathogenic bacterial contamination ................................................................... 32
3.6 Pesticide residue contamination......................................................................... 33 3.6.1 Types of pesticides and their categorisation ......................................................................... 34 3.6.2 Health effects of pesticides ................................................................................................... 36 3.6.3 Environmental implications of pesticides ............................................................................. 37
3.6.3.1 Case study: Ho Chin Minh City, Vietnam ..................................................................... 37
4. Food safety: an international perspective................................................................ 39
4.1 Safety and quality assurance in the food chain.................................................. 39
4.2 Demand for food safety ..................................................................................... 41
4.3 Food safety: science, economics and institutional development ....................... 41 4.3.1 Science and institutions ........................................................................................................ 41 4.3.2 Market organisation .............................................................................................................. 42
4.4 The challenge in developing countries ………………………………………..42 4.4.1 The potential for regulation in developing countries ............................................................ 43 4.4.2 Lessons for food safety ......................................................................................................... 44
4.5 Approaches to regulation in developing countries ............................................ 45 4.5.1 Incentive problems: the costs and benefits of food safety in developing countries.............. 46 4.5.2 Risk assessment in developing countries .............................................................................. 47 4.5.3 International standards and developing countries................................................................. 49
iii
4.6 HACCP (Hazard Analysis Critical Control Point) ............................................ 50
4.7 Food safety management and ISO ..................................................................... 52 4.7.1 What is ISO 9000?................................................................................................................ 53 4.7.2 What is ISO 14000?.............................................................................................................. 54
4.8 Quality assurance, food systems and contractual relationships: a food systems approach................................................................................................................... 54
4.8.1 Information problems: the NIE contribution ........................................................................ 55 4.8.2 Identification of hazards ....................................................................................................... 56 4.8.3 Critical point determination .................................................................................................. 56 4.8.4 Incentive and constraint mechanisms ................................................................................... 57
5. References ............................................................................................................... 59
Appendix 1............................................................................................................... 68
iv

Pollution and Health Problems in Horticultural Production in Harare: A Literature Review 1. Introduction The contribution of peri-urban and urban production to urban food demand throughout the world, particularly of perishables, can vary from 25-100%, and peri-urban/urban production may involve a high percentage of families (Birley and Lock, 1999). There is currently little information on the integrity of the supply chain for horticultural produce in developing countries, although subclinical morbidity due to pre- and post-harvest contamination is likely to be widespread. Levels of morbidity and economic losses with considerable adverse effects on livelihoods of poor people are likely to be considerable, but difficult to estimate. Levels of contamination are not monitored and controlled, and are likely to increase with intensification of production systems, population growth and urbanisation. Data on sources and levels of food system contamination are scarce; and knowledge of best practice in food production and handling and of the availability of appropriate technologies are thin and unevenly spread. Moreover, the regulatory regime in respect of air-, soil-, water-borne pollutants, and hazardous technology and production practices is likely to be inferior. Thus, scientists, producers and marketers, consumers and policy makers are much less informed. 2. Smallholder Horticultural Production and Markets in and around Harare 2.1. Introduction Horticulture has been one of the main growth areas within Zimbabwean agriculture since Independence in 1980, with growth occurring within both the large-scale commercial (LSC) farming sector and the smallholder sector (Jackson et al. 1997). Factors encouraging increased horticultural production for the domestic market have included: • positively, rising demand in urban markets as a result of growing populations,
rising urban incomes and changes in consumer tastes; • negatively, declining profitability of maize production as a result of rising
input prices and government policies restraining the maize producer price. This has encouraged both LSC producers and some smallholders on irrigation schemes1 to diversify their production activities, (Gordon 1997);
• it is also possible that increased land pressure may be pushing some smallholders into production of higher value commodities, such as horticulture.
The existence of “push”, as well as “pull”, factors is important. Increases in supply have at least kept pace with growing domestic demand. In Harare markets, this has the following consequences (amongst others): 1 Most smallholders in communal areas who grow crops under rainfed conditions grow their maize in the “summer”, i.e. November to April, and only concentrate on horticultural production once the main harvest period is completed, i.e. May-June onwards. In their case, therefore, maize and horticultural products are not substitutes.
1

• smallholder suppliers have to compete with large quantities of high quality
produce from LSC farmers; • although they fluctuate considerably within seasons, real wholesale prices of
major horticultural produce have remained fairly constant over time (see, for example Mabaya (1998) for tomatoes over the period 1988-1994).
2.2. Markets for Horticultural Produce in Harare Harare horticultural markets have attracted considerable interest from researchers. Van Santen (1996), Bockett et al. (1997), Mabaya (1998) and Gordon (1997) all describe the various marketing channels operating within Harare. Figure 1, taken from Mabaya (1998), maps out the different channels from the perspective of the smallholder farmer. This section describes the flows of produce through the various channels and draws together available quantitative information on these flows. In fact, although market channels can be described with some certainty, there is only the sketchiest of evidence on the total size of the market and the volume of flows through the various channels. 2.2.1. Wholesale Markets As will be explained below, the term “wholesale” has to be used with some care in the context of Harare horticultural markets. However, under this heading are commonly included: • Mbare Musika market, the largest horticultural market in Harare and the main
“entry point” for smallholder production sent to the city • Chikwanha market in Chitungwiza (also known as Guzha) • a number of large, up-market independent wholesalers. These are considered in turn.
2

Exports
Supermarkets & greengrocers
Commercial farmers High income consumers
Smallholders
Middlemen
Mbare musika
Wholesale companies
Vendors
Low/middle income consumers
Hawkers
Rural assembly markets Rural consumers
Figure 1. Market structure Adapted from Mabaya by Chaonwa, Coote and Poole
3

2.2.1.1 Mbare Musika The central horticultural market in Harare, Mbare Musika in fact comprises a producers’, a wholesale and a retail market. The producers’ market occurs within a walled enclosure, open to the elements (and increasingly also on waste ground outside the official market area), whilst the wholesale and retail markets occupy covered “sheds” adjacent to the producers’ enclosure. There is free flow of produce and people between producers’ market, wholesale and retail areas. As will be shown in section 2.3, a significant proportion of smallholder horticultural production in Mashonaland East province is sent to Harare and the majority of this arrives at Mbare producers’ market. This market operates early each morning. Traditionally, producers wishing to sell produce at the market have had to book an area of ground space the previous day (between 12.00 and 8.00 p.m.). Whilst some may have relatives or friends in Harare who can do this, many have to do it themselves2. Those living in reasonable proximity to Harare (e.g. Seke) can make a booking, then return home and come back with their produce in time for market opening. Those from outlying districts tend to arrive in Harare (on a truck or bus) with their produce the evening before the market, book their spaces, then spend the night at the market keeping watch over their produce. There are no storage facilities at the producers’ market. The market opens around 06.00 and trading activities within the walled enclosure are supposed to cease by 10.00. The large numbers of buyers at the market means that most produce does get bought by this time, but prices of remaining produce fall sharply as this deadline approaches, as producers are reluctant either to transport produce back home or to throw it away. It should be noted that the growth of the overspill area outside of the official producers’ market enclosure has the potential to modify the intra-day price dynamics of the producers’ market as a whole. Whereas once upon a time sellers were driven away from the waste area in question, latecomers to the producers’ market are now directed there by market officials - and charged the same ground rent fee as those inside (i.e. Z$33 for 3x3m in early 2001). Unlike within the walled enclosure, it is not uncommon for people to bring new produce (e.g. huge wraps of leafy vegetables) to the overspill area as late as 09.00. Moreover, in the overspill area, the ground rent fee entitles the seller to be there until 12.00. (We have yet to determine whether or not this deadline is enforced). Even if this deadline is enforced, however, the more continuous supply of produce and the longer trading hours should reduce the intensity of price decline experienced within the producer market on a given day. As well as fluctuating within a given day prices can fluctuate considerably both from day to day, according to the quantity of produce supplied:
2 There is obviously some scope for cooperative action here, with one producer making bookings on behalf of a group of producers who all wish to sell their produce. This, however, is only of limited benefit for producers from outlying districts, who may still have to travel to Harare the night before the market due to transport constraints. The more general issue of producer cooperation in marketing is discussed later.
4

• Survey evidence suggests that the main determinant of smallholders’ decision to send perishable horticultural produce to market is when it is ripe (Van Santen 1997) (Mabaya 1998)3. It is impossible to predict how many other producers will be ready to bring produce to market on any given day.
• When an LSC farmer unexpectedly sends produce to the market, this can significantly depress prices obtaining for the product in question on that particular day4.
(Chollet 1997) notes that “... in Mbare prices change from one day to the next and, often, from one hour to another” (p10). On a day in 1998, when one of the current authors visited Mbare producers’ market, the price of a box of tomatoes had opened at Z$60, soon fallen to Z$50 and by 09.00 hrs was already down to Z$30. When sellers were asked whether or not this was a good day, they replied that it was. The opening prices were much in excess of those that had prevailed the previous week, when, with much greater quantities of tomatoes being sent to market, most boxes were sold for around Z$20. Thus, whilst there are also clear seasonal trends in prices5, which producers would do well to take into account in their planting decisions for horticultural produce6, the actual price that a producer will receive for his/her produce on any given day is something of a lottery. Similarly, the quantity of produce supplied to the market on a given day affects the mark-up that is received for produce of above-average quality. Higher quality produce tends to be bought first and, where produce is plentiful, it is the lower quality produce that has to be sold at knock-down prices before 10.00 a.m. However, when supply is weak relative to demand, all produce tends to get snapped up with little premium for quality (VeCoZimbabwe 1999). Customers at the producers’ market include retailers from the adjacent sheds, hawkers and other retailers around Harare, individual consumers and - (occasionally) if other supplies are short - wholesalers from the adjacent wholesale market7. The market thus combines a wholesale and a retail function. However, it should be noted that transactions for tomatoes are generally for bulk quantities (e.g. boxes, rather than 3 Where there was some flexibility in timing of sale, such as in the case of sweet potatoes, the principal determinant of the decision when to market was the farmer’s need for cash (van Santen 1996). 4 In addition to ad hoc sales by LSC producers at the producers market, two LSC producers have in recent years established an almost permanent presence within the walled enclosure. These sell tomatoes during the “summer” season (i.e. October onwards) and cabbages during the “winter”. They occupy a fenced-off portion of the walled enclosure (perhaps 20%) and carefully control the flow of buyers within this area. Their own workers sell produce to buyers, who have to queue to get it, have no choice over which box they are given (other than specifying size and grade) and have to pay a fixed price that the sellers have determined for the day. Produce unsold at the end of one day is guarded until the next day (although basically stored in the open). 5 For example, (Mabaya 1998) found that, during the period 1988-94 tomato prices were regularly lowest in January, increased to a peak around April-May, fell to a second annual low in July, rose again to a second peak in October, then fell again until January. It is, however, possible that variability in rainfall patterns in recent years has upset this predictable trend. 6 This issue was a key focus of previous CPHP-funded work (see (Poulton, Mukwereza et al. 1999)). 7 One of the two LSC sellers within the producers’ enclosure claimed not only that the major independent wholesalers regularly bought from him, but also that top hotels were regular clients!
5

individual piles)8. Individual consumers tend to buy produce at this market when they have sufficient spare cash to buy in bulk (e.g. at the end of the month) and/or when prices are felt to be particularly attractive. The Mbare wholesale market comprises traders who rent stalls from the City Council on a permanent basis, although many are only present at the market on particular days of each week. Of the 156 “sheds” in the wholesale and retail area, perhaps half are predominantly wholesale. Sheds may (unofficially) be shared by two or more traders. van Santen (1996) surveyed forty such traders, who were found to deal in 1-6 crops each. More recently, VeCoZimbabwe (1999) monitored the business transactions of 8 of these traders over a 7-9 month period. Again, traders were found to deal in a limited range of crops, with the relative importance of these crops varying through the year. VeCo also observed that larger traders tended to specialise in one or two crops. The wholesale market operates until 5.00 p.m. each evening, with relatively little business done whilst the producers’ market is still open. Wholesalers based at Mbare sell to retailers based around Harare, to institutional customers and also to individual consumers. In addition some traders buy in this market to supply provincial markets such as Bulawayo and Gweru9. Depending on the crop (and, therefore, also on the particular traders concerned), the eight traders surveyed by (VeCoZimbabwe 1999) estimated that they sold 64-87% of their produce to other traders of one form or another, with the bulk of the remainder of their sales being to individual consumers. The wholesalers based at Mbare obtain the majority of their supplies from LSC farmers, who agree to supply them on a regular basis. The eight traders surveyed by VeCoZimbabwe (1999) estimated that they obtained 87-100% of their cabbages, potatoes, onions and oranges from LSC farmers. Tomatoes were the only crop10 where a considerable proportion (66%) of supplies were said to come from small-scale producers, although it was not clear what proportion of this was accounted for by growers from communal areas, as opposed to small-scale commercial (SSC) and resettlement farmers. Informal discussions that the current author had with one or two wholesalers in 1998 also suggested that they bought some produce from middlemen who assemble produce in the main production areas for transportation to Harare. Prices within the wholesale market do not generally exhibit the dramatic changes within the course of a trading day that are witnessed at the producers’ market. Furthermore, price changes from day to day are less dramatic than those in smaller markets within Mashonaland East (VeCoZimbabwe 1999). Wholesalers negotiate prices with both suppliers and regular buyers on the basis of broader supply and demand trends within the market and in the context of ongoing relationships that will only be sustained if both parties are reasonably happy with the share of benefits. 8 Leafy vegetables are sold in bundles of 1-2kg. 9 Inter-regional arbitrage is mentioned by (Bockett, Boyd et al. 1997) and (van Santen 1996), amongst others. Nevertheless, markets around the country are not well integrated with each other. Low levels of market integration are found by Guvheya (reported in CIIFAD Annual Report 1996/7). (Bockett, Boyd et al. 1997) suggest that the mark-up on inter-regional arbitrage may be as high as 50%. During discussions with the current author in 1998, wholesalers at Sakubva market in Mutare suggested that shortages of capital and imperfect information are important constraints to market integration. 10 None of the eight traders dealt in leafy vegetables.
6

Given the number of wholesalers in the market and the potential for competition from both the adjacent producers’ and retail markets, Bockett et al. (1997) argue that the Mbare wholesale market is essentially quite competitive. However, Mabaya's (1998) analysis of prices suggests that wholesalers still retain some market power, being much quicker to pass falling than rising prices onto suppliers, for example. Given the personalised nature of both the supply and client relationships within the wholesale market, this is indeed plausible. Suppliers are likely to be less well informed about market trends than wholesalers, whilst buyers would incur some cost (primarily in terms of less predictable quality of produce) if they chose to switch their custom to another seller because their regular wholesaler was felt to be charging them too much. That said, developing supply relationships with Mbare-based wholesalers is a strategy that smallholder horticultural producers would do well to consider (VeCoZimbabwe 1999). They will never be able to exert any significant control over the prices that they receive for their produce (beyond targetting production for the seasons when prices are generally most attractive). However, supplying a wholesaler offers some assurance that all their produce of an acceptable grade will be bought for a reasonable price (one that is, at least, subject to some negotiation). It is a strategy that is pursued by some LSC farms. The scope for developing such relationships is considered below. Meanwhile, the total volume of horticultural produce handled by Mbare producers’ and wholesale market is something of an unknown quantity. (Gordon 1997) quotes a “ballpark” figure of between 280,000 and 350,000 tons of produce per year from both LSC farmers and smallholders, with smallholders supplying perhaps 40% of this11. Based on surveys carried out amongst smallholder (communal, resettlement, SSC) producers in different parts of Mashonaland East, a figure of 120,000 tons of produce marketed at Mbare seems a fair (if “upper bound”) estimate (see below). Van Santen's (1996) survey of 40 vendors at Mbare wholesale market suggested that together they handled around 1550 tons of vegetables and 115 tons of fruit per week, with two thirds of the figure for vegetables accounted for by potatoes and onions and a further 20% by tomatoes and cabbage (although the composition of trade presumably varies from season to season). This corresponds to a turnover of somewhere in the region of 85,000 tons of fresh produce per year for these 40 traders. Total turnover in the wholesale market could thus plausibly be double this. Finally, the retail market consists of vendors with lower stocks of working capital, who buy produce primarily from the producers’ market first thing in a morning, then sell it in small quantities to individual consumers through the day. Few have their own independent sources of produce supply (other than perhaps some own production at certain times of the year?).
11 This figure originates from a 1990 survey by ADRA, which the authors have not yet been able to obtain.
7

2.2.1.2 Chikwanha Market This is located on the outskirts of Chitungwiza. As at Mbare (albeit on a much smaller scale), a producers’ market occurs there first thing in a morning, finishing by 10.00. For the remainder of the day, market activity is focused on permanent, rented stalls and a few retailers of leafy vegetables sitting on crates in what had earlier been the producers’ market area. Vendors at the rented stalls perform both a wholesale and retail function, with peak retail activity occurring in the last hour of the day (between 5.00 and 6.00 p.m.) as consumers pass by the market on their way home from work. Vendors at Chikwanha acquire their produce from a variety of sources. The retailers of leafy vegetables purchase these during the producers’ market in the morning. Some of the stallholders go to Mbare on a regular (sometimes daily) basis. Others have their own direct source of supply. The following informal conversations, during a visit on 16/2/2001, illustrate two different supply relationships: • G, a small retailer / wholesaler at Chikwanha, was given working capital by
his uncle to begin trading in tomatoes. He visits Mbare wholesale market every morning and buys tomatoes, which arrive at Chikwanha by bus early in the afternoon. He always buys from the same wholesaler, to whom he was introduced by his uncle. The wholesaler only gives him grade A or B produce (according to what G can afford) and, because of their relationship of trust, he is fully assured of the quality of what he is getting. If G sees that other wholesalers are offering lower prices than his supplier, he prefers to bargain with his supplier, rather than take his custom elsewhere.
• Mr.M, the largest tomato wholesaler at Chikwanha, used to source all his produce from Mbare. However, he found that he could not always secure suitable quantities / quality, particularly during the summer months. One day at the market he met a commercial farmer delivering tomatoes to Mbare and Mr.M negotiated to source tomatoes direct from his farm. Initially this meant Mr.M using his own transport to collect tomatoes from the farm (some 50km from Chikwanha), but now the farmer delivers as requested. On average Mr.M orders two consignments of 400-500 12kg boxes per week. Again, he only takes grade A or B produce and has never had any complaints about the quality12. The supplier suggests a price for the produce over the phone. If the suggested price allows Mr.M to make a reasonable margin, given prevailing and expected prices at Chikwanha, he agrees; if not, he negotiates. Mr.M and/or his wife still visit Mbare regularly, as it provides them with a benchmark for their pricing. Mr.M claims that he has to keep his prices slightly below that charged by Mbare wholesalers or else clients will source from Mbare, rather than from him. (However, it is not clear how this squares with the evidence provided by G and it is not immediately obvious that retailers operating within Chitungwiza would prefer to source from Mbare rather than Chikwanha). He has many regular customers, such that he can say on a given day who hasn’t visited him (whom he would, therefore, expect to see the following day). When asked why his clients come to him for business,
12 Inevitably there are a few rotten / squashed specimens in any consignment. These Mr.M puts aside for certain regular, but very poor, customers, who come to him specially to buy tomatoes in this condition.
8

he cites “personal relations and customer care”, which includes (but is not restricted to) produce quality.
Both G and Mr.M deal exclusively in tomatoes. The range of products sold by vendors at Chikwanha is more restrictive than that sold by wholesalers at Mbare. 2.2.1.3 Independent Wholesalers In addition to the Mbare-based wholesalers, there are 20 or so independent wholesalers located elsewhere in Harare. Van Santen (1996) surveyed 14 of these, of which Eskbank, Wholesale Fruiterers and Honey Dew were the largest13. With one exception, the independent wholesalers surveyed by van Santen traded in a much wider range of crops than the Mbare-based wholesalers. These independent wholesalers serve the “upper end” of the market, for example supermarket chains such as OK and TM, plus hotels, fast food outlets, boarding schools etc. Some of these wholesalers have regular contracts with their main customers (for example, Wholesale Fruiterers with TM and FAVCO with OK)14, so also look to develop supply relationships with producers who can meet their demanding quantity and quality requirements. Companies such as Wholesale Fruiterers and FAVCO set their purchasing prices on a weekly basis, with Mbare Musika wholesale market as the main reference point. (In turn, their provincial purchasing managers, looking to supply provincial buyers but also to send some crops up to Harare, set their prices around this). Prices are generally set higher than Mbare prices (reflecting the demanding quality requirements), with the premium greatest when supplies are scarce. Equally importantly, as a result of the weekly price setting, they are also more stable, at least in the short term, than either producer or wholesale prices at Mbare. However, for strategic reasons, current purchasing prices are only made available to actual or potential suppliers. Wholesale Fruiterers and FAVCO are, in principle, ready to buy produce from smallholder producers and have, indeed, hosted several “study visits” by selected smallholders to explain the terms on which they do business15. However, there are at least four major constraints to the expansion of smallholder supply to these companies: • First and foremost, their quality requirements. These are both demanding in
themselves and at times different from those prevailing in informal markets, which can cause confusion for smallholders. Thus, Jaure (1997), quoted in (Mabaya 1998), notes that grade A tomatoes in informal markets are large and red but firm, whereas grade A tomatoes in formal markets are medium-large, green to orange with no blemishes. The companies do not provide extension advice and are not willing to offer contracts to smallholder producers to supply them with produce, because they know that many will not be able to supply
13 It is understood that the relative size of these firms has changed since then, with Wholesale Fruiterers now the largest. 14 In addition, OK now stocks fresh produce packed and branded by individual LSC farms. 15 see, for example, (Poulton, Mukwereza et al. 1999) and (VeCoZimbabwe 1999).
9

the quality of produce that they need. • Transactions with smallholders are, therefore, restricted to spot purchases of
produce of the desired quality at times when the companies are facing a shortfall from their regular (LSC) suppliers. To anticipate these shortfalls, smallholders need reliable information from the companies to inform their planting decisions. Whilst efforts have been made to provide this information to a limited number of producers on a pilot basis (Poulton et al. 1999), virtually no smallholder producers yet have regular access to it.
• Transportation is also a problem. Rural buses only go to Mbare (the site of the main terminus). Meanwhile, truck operators are reluctant to make a diversion to the companies’ premises, where they have to unload the relevant produce, wait while it is inspected, then reload that which is rejected as being of unsuitable quality, before finally proceeding to Mbare. (This, of course, might change if more of their clients demand the additional service).
• Finally, the companies do not make immediate payments. One settles its accounts at the end of each week; another pays by cheque (for a commission) or directly into a bank account after 7-30 days. In addition to the delay, these arrangements can cause problems for poor producers who have to make an extra visit to Harare just to collect their money.
The combined effect of these constraints is that the share of supplies to the independent wholesalers accounted for by smallholder producers probably remains a fraction of one per cent. Whilst efforts to increase this should continue, the independent wholesalers are unlikely to become an important market for the vast majority of smallholder horticultural producers for the foreseeable future. 2.2.2. Retail Activities This section focuses on informal retail activities. Formal retail channels, such as the supermarkets and independent greengrocers, tend to receive their supplies either from the independent wholesalers (just discussed) or through formal contracts with designated LSC farms or from vertically integrated own production operations. Supermarkets cater for both upper and middle income households; independent greengrocers largely for upper income households. By contrast, poor households acquire their fruit and vegetables predominantly through informal channels. As noted above, the major markets of Mbare and Chikwanha perform both wholesale and retail functions. Other informal retail outlets for fruit and vegetables include: • small stores or “tuck shops” • various forms of “hawker”, including owners of street stalls, pavement sellers
(without stalls) and mobile hawkers. Drakakis-Smith and Tevera (1993) report on a survey of 487 informal food retailers in three areas of Harare: Mabelreign (a middle-income suburb), Glen View (a low-income suburb of aided self-help housing) and Epworth (a squatter settlement outside the city boundary, partially legalised in 1983)16. The 487 respondents to the survey 16 [Horn, 1997 #431] estimated that, in 1985-86, there were at least 3426 informal (table and stall)
10

represented the majority of all informal retailers in these areas. Of these, 310 were hawkers (although there were only 29 mobile hawkers in the sample)17. The only group to generally have licences was the stall hawkers, who often locate themselves close to formal shopping centres. As with informal food retailers in many developing countries, periodic harrassment by city authorities was a problem for many. Therefore, around 1/3 of those interviewed (mostly hawkers) belonged to one of a number of loose retailers' associations, which provided a general (not financial) support function. Whilst only 30% of tuck shops sold fresh fruit and vegetables, these were the main items sold by the majority of hawkers18, with over 90% of hawkers obtaining their fruit and vegetables from Mbare. Drakakis-Smith and Tevera (1993) noted with surprise that less than 1/3 of these respondents obtained their produce from the wholesale market. However, as no distinction was made between producers' and retail market, it was not clear where the rest was sourced from. Meanwhile, some tuckshops (especially in Epworth) received direct supplies - from producers? However, in general, respondents suggested that the transport cost entailed in sourcing direct from producers would be prohibitive, given the volumes that they sold. Overall, only 30% of respondents used a regular supplier of any sort. Over 90% of hawkers were women - generally single, divorced or widowed - who were hawking out of economic necessity. Many had been in business for 4 years or less and had a turnover of less than Z$100 per week (at a time when £1=Z$10). Their profit was, therefore, unlikely to exceed Z$50 and was probably less. Their answers to one question suggested that acquiring and retaining customers was the key to making a living out of the business. Drakakis-Smith and Tevera (1993) comment that: "The overall impression of the petty commodity sector in Harare is one of slow growth, largely in response to the cost and locational inconvenience of more formal outlets [particularly as the city expands]." (p27) Additional and more up-to-date information on informal retailers of horticultural produce is required. It can be hypothesised that Mbare remains an important source of produce, but that its importance varies around the city, with, for example, Chikwanha also important within Chitungwiza and direct supply from producers now featuring more in outlying areas (including Epworth and Crowborough), at least on a seasonal basis.
vendors around Harare, the vast majority in high-density suburbs. Of these, 265 were in Glen View. This number has undoubtedly risen since. 17 No tuckshops were found in Mabelreign - possibly because tuck shops are generally not licensed and monitoring of such matters is tighter in a middle income suburb, possibly because middle income consumers would generally prefer to shop in a supermarket than at a tuck shop? 18 In addition, meat, milk, sugar and salt were each sold by 100 or so hawkers.
11

2.3. Smallholder Horticultural Production in Mashonaland East Smallholder horticultural production19 in Mashonaland East received important technical and research support in the 1990s from, amongst others, the EU-funded Mashonaland East Fruit and Vegetable Project (MEFVP), CIIFAD and French technical assistance within Agritex. Production of certain vegetables for market has been a feature of smallholder production systems in areas such as Seke and Mutoko since prior to Independence. However, in recent years, smallholder horticultural production has developed and expanded in Seke, Chihota, Chikomba, Goromonzi, Murewa, Mutoko, Uzumba (UMP) and Mudzi20. This section summarises some of the available information on smallholder production for market in these areas and on constraints to production and marketing. Nearly all communal households have a dryland vegetable garden or dambo in which, during the cooler, dry season from May to September, small quantities of vegetables are grown to supply part of the household’s own consumption requirements (Gordon 1997). Crops grown for own consumption include: tomatoes, leafy vegetables (e.g. viscose, rape, tsunga, covo), cabbage, onions, sweet potatoes, various squashes and pumpkins. As these crops are generally grown during the dry season (with available household resources dedicated to production of grains and other “dryland” crops during the summer), water supply is a major constraint. In most areas of rainfed agriculture, therefore, it is only households with better-than-average access to water21 that are able to produce a surplus for market. However, in a few of these areas and on some irrigation schemes, smallholder horticultural production and marketing have developed to such an extent that they have now become year-round activities, representing one of the main sources of cash income for participating households. Van Santen (1997) reports on a survey of 418 smallholder horticultural producers conducted between August 1996 and February 1997 in Mutoko, Uzumba, Murewa, Chinamora, Seke and Chihota. The definition of a horticultural producer that was used to establish the sample frame for this survey ensured that only those producers with capacity to produce for market were included:
19 The focus here is on the production of “exotic” crops, rather than the harvesting and utilisation of indigenous ones. For many households in communal areas, traditional fruits and vegetables provide “a source of cheap, essential nutrients and income, as well as a source of reserve food during periods of staple food scarcity” (CIIFAD Annual Report 1996/7). They include the fruits of certain tree species found in miombo woodland and semi-cultivated vegetables such as Cleome gynandra and Corchorus tridens (wild okra), which spring up with the first rains after the dry season (around December). The plants normally spread through self-seeding. They are deliberately not weeded out of cultivated fields, and are picked from homesteads and fallow fields, to be prepared as relish with sadza. As well as being eaten fresh during the rainy season at the start of the year, such plants are dried by many households and stored for consumption during the final months of the year - the so-called “relish gap” period. Small quantities of these dried products are also sold in both local and urban markets. 20 With the exception of Mudzi and Uzumba, these areas fall mainly within the agro-ecological Natural Regions II and III. 21 These would include households with their own well, those with fields next to a perennial river and households with sizeable “vlei” land (characterised by good soil and high water table).
12
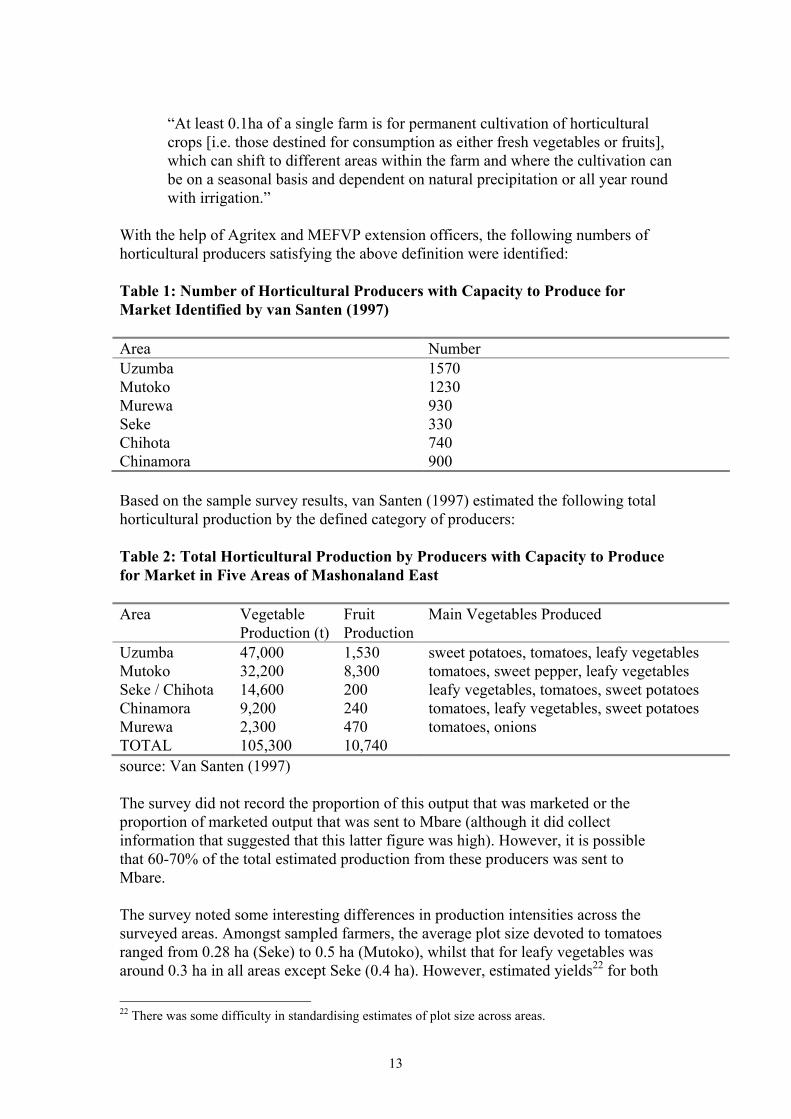
“At least 0.1ha of a single farm is for permanent cultivation of horticultural crops [i.e. those destined for consumption as either fresh vegetables or fruits], which can shift to different areas within the farm and where the cultivation can be on a seasonal basis and dependent on natural precipitation or all year round with irrigation.”
With the help of Agritex and MEFVP extension officers, the following numbers of horticultural producers satisfying the above definition were identified: Table 1: Number of Horticultural Producers with Capacity to Produce for Market Identified by van Santen (1997) Area Number Uzumba 1570 Mutoko 1230 Murewa 930 Seke 330 Chihota 740 Chinamora 900 Based on the sample survey results, van Santen (1997) estimated the following total horticultural production by the defined category of producers: Table 2: Total Horticultural Production by Producers with Capacity to Produce for Market in Five Areas of Mashonaland East Area Vegetable
Production (t) Fruit Production
Main Vegetables Produced
Uzumba 47,000 1,530 sweet potatoes, tomatoes, leafy vegetables Mutoko 32,200 8,300 tomatoes, sweet pepper, leafy vegetables Seke / Chihota 14,600 200 leafy vegetables, tomatoes, sweet potatoes Chinamora 9,200 240 tomatoes, leafy vegetables, sweet potatoes Murewa 2,300 470 tomatoes, onions TOTAL 105,300 10,740 source: Van Santen (1997) The survey did not record the proportion of this output that was marketed or the proportion of marketed output that was sent to Mbare (although it did collect information that suggested that this latter figure was high). However, it is possible that 60-70% of the total estimated production from these producers was sent to Mbare. The survey noted some interesting differences in production intensities across the surveyed areas. Amongst sampled farmers, the average plot size devoted to tomatoes ranged from 0.28 ha (Seke) to 0.5 ha (Mutoko), whilst that for leafy vegetables was around 0.3 ha in all areas except Seke (0.4 ha). However, estimated yields22 for both
22 There was some difficulty in standardising estimates of plot size across areas.
13

crops were considerably higher in Mutoko, Seke and Chinamora (around 20 t / ha) than in Chihota or Murewa (half that), with Uzumba intermediate. The study did not investigate input use, but it is reasonable to expect that higher yields are correlated with higher usage of chemical fertilisers and crop protection chemicals. The study also noted the following peak harvest times for tomatoes and leafy vegetables: Table 3: Peak Harvest Months for Tomatoes and Leafy Vegetables in Selected Areas of Mashonaland East Area Tomatoes Leafy Vegetables Mutoko June-August, April June-July Seke July-August, March, December, October April, August (pronounced peaks!) Chihota December, February, June November-January, May-June Chinamora August-September; September-Nov.23 August-October (but year round) Uzumba June-November June (50%!) Murewa April, June-September April-July source: Van Santen (1997) As regards marketing, producers were asked to specify their preferred market destinations. Mbare was the overwhelming first choice for producers in Chinamora and Murewa and the first choice of two thirds of respondents in Seke, Uzumba and Mutoko. In Seke, many of the remainder selected Chikwanha as their preferred outlet24. In Uzumba and Mutoko, parts of which are quite remote from Harare, local markets were preferred. Only in Chihota was Mbare not the main first choice. Here, Chikwanha was cited as first choice by 89% of respondents. In all areas except Mutoko (38%), the vast majority of farmers claimed to carry out some grading of their produce before sending it to market. Turner and Chivinge (1999) report on another 1996 survey of smallholder horticultural production in Mashonaland East, this time in Goromonzi, Murewa and Uzumba districts. Unlike the van Santen survey, this did not select for households with particular capacity to grow horticultural products. Rather, it surveyed a stratified25 random sample of 615 households. Nevertheless, it appears that all surveyed households grew some horticultural crops (albeit only 12% of households on a year-round basis) and that the smallest garden encountered was 0.1ha. (The largest was 2.8ha). The survey results showed that 50% of households cultivated less than 50m2 of rape,
23 There appear to be two distinct patterns in different parts of Chinamora. 24 A significant grower of viscose reported that he and his neighbours take produce to Chikwanha if they only have a modest volume to sell. However, if they have a large quantity, they go instead to Mbare where they can be sure of a large number of buyers (informal discussion, 16/2/2001). 25 The stratification was dsigned to ensure the inclusion of some SSC and resettlement farmers as well as communal households. Unfortunately, few of the results are disaggregated according to these categories, making inferences about production specifically in the communal areas difficult.
14

whilst 50% cultivated less than 100m2 of tomatoes. On the other hand, 25-30% cultivated more than 1000m2 of rape, whilst 35-40% cultivated more than 1000m2 of tomatoes. According to 1992 figures from the Central Statistics Office, the three districts in question contained a total of 57,743 hhs. Thus, even excluding SSC farmers, the survey results suggest a much larger number of horticultural producers with capacity to produce for market than van Santen's study. Thus, whilst van Santen's study suggests that the “ballpark” figure mentioned earlier of 120,000 tonnes per annum of horticultural produce sent to Mbare by smallholders was on the high side, this survey suggests that it might be a reasonable (if still upper bound?) estimate. According to Turner and Chivinge (1999), use of chemical fertilisers is common and use of crop protection chemicals is standard practice amongst smallholder horticultural producers in Mashonaland East. A total of 38 chemicals (including washing powder) were reported as being used to control crop pests. Of these, five were in common usage: Table 4: Usage of Major Pesticides by Smallholder Horticultural Producers Farmers Reporting Use (n=615) Pesticide Number % Average Expenditure (Z$)26 Rogor 615 100 20.14 Dithane M45 145 24 34.12 Karate 69 12 74.74 Carbaryl 64 11 67.84 Diazinon 53 8 15.86 source: Turner and Chivinge (1999) Rogor was the most popular, because it was readily available, cheap and versatile. Karate was recognised as being the most effective in controlling red spider mite (a major tomato pest), but its high cost prevented many producers from using it. Overall, the major constraints facing smallholder horticultural producers were identified as: dry season water availability; pest control; access to, and ability to purchase, inputs more generally; transportation and marketing. 2.3.1 Marketing Issues Assembly activity by middlemen linking rural producers and urban markets is a characteristic feature of most developing country market systems. However, assembly activity by middlemen supplying the Mbare Musika market is surprisingly uncommon. Bockett et al. (1997) attribute this to lack of reliable surpluses and lack of trust and confidence, both between producers and traders and amongst producers. As a result, most farmers selling to urban markets have to organise their own transport, 26 At the time of this survey, US$1 = Z$10.20, so £1 = cZ$15. It is not clear whether the denominator in this final column is the number of farmers who applied the pesticide in question or the total number of farmers in the sample.
15

whilst those middlemen who do operate in rural areas are felt by farmers to offer unjustifiably low prices (van Santen 1996). Some attempts have been made to develop rural assembly markets. MEFVP tried to establish “horticultural produce centres” (HPCs) where farmers could bring their produce, in the hope that the assembled volume of produce would be enough to attract traders from Harare, who would then compete on price for supplies. The venture was unsuccessful because the main Harare-based traders could generally satisfy their requirements without venturing outside the capital. As a result, prices for higher quality produce sent to the HPCs were no higher than those obtainable at Mbare Musika, whilst farmers had to pay handling and packaging charges at the HPCs that they did not incur at Mbare. Farmers, therefore, only sent their lower quality produce to the HPCs, which further discouraged traders from making the journey (van Santen 1996). An attempt to establish a system of rural markets at Rusape in Manicaland was similarly unsuccessful (Sanyatwe, pers.comm.). On the other hand, some farmers living in areas closer to main trunk routes do manage to sell their produce to passing motorists, as well as to fellow rural dwellers. In some villages in Murewa in Mashonaland East, producers can make Z$200-300 a day from selling their produce by the roadside (Chivinge, pers.comm.). These farmers tend to sell their lower quality produce there, where they incur minimal transport costs. They send their higher quality goods to Mbare Musika. Nevertheless, having a choice of marketing outlets does not completely overcome the problem of periodic gluts of crops such as tomatoes and rape. As well as commenting on the relative lack of rural assembly activity, Bockett, et al. (1997) comment on smallholders’ preference for sending produce to target urban markets individually, rather than collectively. They note that there are hidden costs to collective marketing activity, including monitoring the actions of the representative chosen to take the produce to market, who may not report prices received correctly27. At the same time, there are benefits to an individual from going to the urban market, including being able to observe prices for a range of goods and gaining the opportunity to do other business, such as purchasing inputs or consumption goods or meeting relatives. Lack of trust amongst smallholders (even neighbours and relatives!) appears to stand in the way of smallholders developing ongoing supply relationships with particular traders at Mbare wholesale market. Traders are always on the look out for reliable sources of produce supply. However, when they can access produce from LSC producers, they have little incentive to develop relationships with smallholders, unless the latter can supply reasonable quantities of good quality produce on a regular basis. Individual smallholders cannot manage this, so such relationships depend on the ability of smallholders to function in groups.
27 A key issue is that, if different producers have produce of different qualities, the individual consignments will attract different unit prices. The representative sent might have low grade produce, but might keep for himself the revenue that someone else’s produce fetched, whilst giving that other person the revenue that was actually generated by his own produce (informal discussion in Seke, 16/2/2001).
16
In addition to marketing fresh produce, smallholders are able to dry some crops as a means of improving their shelf life. Commercial opportunities for the drying of vegetable and fruit products have been thoroughly investigated by Murphy (1996). She identifies a number of different markets for different dried vegetable and fruit products, including: • rural informal markets and general stores and urban informal markets, used by
a variety of low income consumer groups; • urban supermarkets, used by residents of various income groups, according to
their location within the urban area (centre, high and low density suburbs); • food and craft boutiques and health food stores, catering for high income
urban consumers. (In addition, food and craft boutiques and city centre supermarkets may also be visited by tourists);
• processors using certain dried vegetables in soups, who are largely supplied by smallholders;
• institutions and mines, which are generally supplied by commercial farmers and wholesalers.
Horticultural products that are sun-dried and sold by smallholders include: cabbage, spinach, rape, pumpkin and cowpea leaves, choumoellier, okra, tomatoes, chillies, paprika28 and ginger. However, Murphy observes that market demand for dried products is universally slow. Except for a limited number of niche, luxury products, such as exotic dried fruit and dried fruit confectionary, which are not produced by smallholders, dried products tend to carry a “poor man’s stigma”. Gordon (1997) discusses the opportunities for selling horticultural crops to processing industries. She notes that large-scale food processing in Zimbabwe is largely supplied by smallholders, but is also largely restricted to tomatoes and peas (and in Mutare rather than Mashonaland East). In the case of tomatoes, canners require only plum tomatoes, which, whilst they are grown for sale in fresh produce markets, have less taste than other types, so fetch a lower price29. Canners prefer to develop contractual arrangements with suppliers30, which generally include the supply of seed, and are not able to absorb periodic gluts of other tomatoes from fresh produce markets. Moreover, local industries are struggling under strong competitive pressure from imports, particularly from South Africa.
28 All paprika grown by smallholders is dried before sale. 29 This is partially compensated for by a shorter growing season and slightly better storage characteristics, according to a seller at Mbare Musika producers’ market. 30 These are not without their problems, most notably output diversion and failure to meet exacting quality requirements by producers, and failure by processors to buy all the produce that smallholders expect once they have produced it.
17

3. Soil and water borne pollution 3.1 Introduction The nature and extent of heavy metal and pathogenic bacterial contamination in vegetable production in Zimbabwe has not been examined. There is an urgent need to research this issue, comparing measured levels of these pollutants with recognised health standards from elsewhere in the world. Recommendations made in a recent study of health impacts of peri-urban natural resource development (Birley and Lock, 1999) highlighted further work to be undertaken on: • the post-harvest decontamination of food crops; • studies of the safety of similar foods along the rural-urban continuum; • intersectoral action with a multidisciplinary focus; • further studies to clarify the severity and extent of pollutant uptake by food plants. 3.2 Wastewater use in Zimbabwe If properly managed and monitored wastewater can be a valuable source of irrigation water and liquid fertiliser. Indirect use of wastewater in Zimbabwe occurs when treated, partially treated, or untreated wastewater is discharged into rivers or reservoirs used to supply water for agriculture, such as along contaminated urban rivers. Wastewater is used directly on Municipal sewage farms in Zimbabwe, where raw sewage is applied to agricultural land and effluent is used for irrigation. This reliance on wastewater is due to unreliable rainfall, coupled with the fact that there is no proper water storage system for urban areas in the dry season. As early as 1968, the Rhodesian Government and Local Authority proposed guidelines for use of wastewater in agriculture. It was recommended that the use of effluent from sewage treatment works not be permitted for irrigation of salad crops to be eaten raw, vegetable crops or berry fruits. But provided the effluent had a BOD <70 mg L-1 it could be used for surface irrigation of grain crops, crops grown for industrial processing such as oil seeds or fibre, crops grown entirely for seed, pastures for slaughter stock provided that grazing does not occur within 24 hours of application, and fodder crops for harvesting and deciduous and citrus orchards. Provided the effluent had a BOD<10 mg L-1 and E. coli < 10 100ml-1 the use of effluent was permitted for irrigation of any of the former crops, and pastures. No raw sewage was to be used for agricultural practices, and no digested sludge was to be applied to agricultural soils without at least a 50% reduction in volatile matter. Wastewater was permitted for grain crops but not vegetable crops because of the risk of microbial contamination. In addition, heavy metals are not mobile in the phloem, and thus there is less risk from eating grain crops, as most accumulation will be in the leaves and not the storage organs. Initial guidelines put forward by the USA restricted the use of partially treated sewage to crops that are generally cooked before consumption, and to allow only water that has gone through advanced wastewater treatment and microbial disinfection to be applied to crops normally eaten raw. Strict microbial standards were proposed that were unattainable in most wastewater treatment systems, therefore many poorer or
18

developing countries abandoned plans for wastewater use (Shuval et al., 1986). This resulted in some countries shifting wastewater use to unrestricted areas or to restricted crops. Consequently, untreated or partially treated wastewater continues to be used directly for unrestricted irrigation, or is discharged to surface water channels, and is used for irrigation. The health hazards associated with direct and indirect wastewater use are of two kinds: the rural health and safety problem for those working on the land where the water is being used, and the risk that contaminated products from the wastewater use may subsequently infect humans or animals through consumption or handling of the foodstuff or through secondary human contamination by consuming foodstuffs from animals that used the area (WHO, 1989). The type and extent of pretreatment of industrial and domestic wastewater depends on the subsequent treatment and disposal method. Pretreatment for some industrial effluent prior to land application may simply involve screening or removal of solids, although some pretreatment facilities prior to discharge to a municipal sewage treatment works might consist of a complete physical, chemical or biological treatment plant (Staneva, 1997). The City of Harare, Department of Works, imposes quality limits of industrial effluent prior to discharge to the municipal sewage system (Table 5). In these controlled trade effluent regulations parameters such as DOD5 and chemical oxygen demand (COD) are not listed and the limitation applied for heavy metals is high (<50 mg l-1). Table 5. Limits on effluent which is discharged in municipal sewage system, City of Harare, Department of Works, Trade Effluent Control _____________________________________________________________________
Parameter Concentration (mg l-1) _____________________________________________________________________
pH 6.8-9.0 settleable solids (cm3 l-1) <10
Fats (mg l-1) <400 mineral oils nil
organic solvents nil Heavy metals (mg l-1) <50
Calcium carbide nil Bitumen nil Cyanides nil
Temperature (oC) <60 _____________________________________________________________________
Source: Staneva (1997).
19

Table 6. Maximum permissable concentration of certain chemical constituents discharged or disposed of in Zone I or Zone II Catchment Area. Zimbabwe Water (Effluent and Waste Water Standards) Regulations, 1977. _____________________________________________________________________ Maximum Concentration (mg l-1)
Constituent Zone I Zone II _____________________________________________________________________ Ammonia free and saline (as N) 0.5 0.5 Arsenic (as As) .050.05 0.05 Barium (as Ba) 0.1 0.5 Boron (as B) 0.5 0.5 Cadmium (as Cd) 0.01 0.01 Chlorides (as Cl) 50 100 Chlorine residual (as free chlorine) nil 0.1 Chromium (as Cr) 0.05 0.05 Copper (as Cu) 0.02 0.5 Cyanides and related compounds (as Cn) 0.2 0.2 Detergents (as manoxol -OT) 0.2 1.0 Fluoride (as F) 1.0 1.0 Iron (as Fe) 0.3 0.3 Lead (as Pb) 0.05 0.05 Manganese (as Mn) 0.1 0.1 Mercury (as Hg) 0.5 0.5 Nickel (as Ni) 0.3 0.3 Nitrogen total (as N) 10 10 Phenolic compounds (as phenol) 0.01 0.1 Phosphates total (as P) 1.0 1.0 Sulphate (as SO4) 50 200 Sulphides (as S) 0.05 0.2 Zinc (as Zn) 0.3 1.0 Total Heavy Metals 4.0 2.0 _____________________________________________________________________
Source: Staneva, 1997).
20

3.2.1 Heavy metal contamination along Mukuvisi River and Lake Chivero Since the early 1980s maize, leafy vegetables, groundnuts, peas and onions have been grown along the banks of the Mukuvisi using river water for irrigation. However, this water has been found to be heavily contaminated with heavy metals (Zaranyika et al 1983). Sources of pollution include industrial discharges from the Msasa, Graniteside and Southerton industrial areas, leachate from landfilled areas along the banks of the Mukuvisi, runoff in the city centre area, and treated sewage effluent from Firle sewage works. The Mukuvisi is one of three rivers (Manyame, Mukuvisi and Marimba) feeding Lake Chivero from which Harare draws its water. The city of Harare extends over much of the Mukuvisi and Marimba catchments. Pollution of the lake has been blamed on the fact that its reservoir lies in the same catchment as the City of Harare, with pollution from urban run-off, sediments and industrial effluents (Thornton & Nduku, 1982). In its upper reaches the Mukuvisi receives effluent from a phosphate fertiliser manufacturing plant and several other ‘sundry’ industries in the expanding Msasa Industrial Area. Between Houghton Park and Highfields residential areas it receives effluent from the Southerton industrial area. After Glen Norah it receives effluent from Firle Sewage Works, the major sewage plant for the city serving the eastern, southern and south western suburbs, the city centre and industrial areas. This secondary treatment plant uses a modified activated sludge process and biological treatment of the waste water. The plant was designed to treat 72000 m3 of wastewater per day, but currently receives 100 000 m3 of waste water per day (Mathuthu et al. 1995; Zaranyika, 1997). 36000 000 litres of treated sewage effluent are discharged daily into Mukuvisi river and onward to Lake Chivero where it is eventually recycled for water consumption in Harare. Mathuthu et al (1993) determined heavy metals in both water and sediment phases downstream from the Msasa Industrial Area (Table 7). Base levels for Cu, Zn, Pb, Co, Fe & Ni fell within acceptable limits of WHO water quality guidelines for drinking water (WHO, 1989b) as well as the water (effluent and waste water standards) regulations, 1985 (Zimbabwe Government, 1985). However levels of Pb, Co, Fe & Cr(III) in the river rose immediately after the effluent canal from the fertiliser plant, and were significantly higher than the WHO water quality guidelines (WHO, 1989b), with Pb levels exceeding the recommended upper limit by a factor of 79. The source of these elements was probably the raw materials used by the fertiliser plant, especially phosphate rock concentrate (Zaranyika, 1997). This contamination is of concern as at various points along the river poor people without easy access to piped clean water use the untreated river water for washing, irrigation of vegetable gardens and for drinking (Mathuthu et al., 1993). However, there were indications of natural recovery within a stretch of only 3 km downstream from the fertiliser factory (Mathuthu et al 1993).
21

Table 7. Concentrations of heavy metals (mg l-1) and pH in the water phase of Mukuvisi River, September 1990. Source: Mathuthu et al (1993) _____________________________________________________________________ Reference point:
1 km upstream Just downstream from fertiliser plant
Mutare road bridge
_____________________________________________________________________ pH 7.43 5.65 6.46 Pb 0.02 3.67 0.528 Cr (III) 0.056 0.2 0.260 Cr (VI) 0.007 0.008 ND Cu 0.0475 0.062 0.045 Zn 0.0623 0.768 0.635 Ni 0.0337 0.046 0.0725 Co 0.0305 0.183 0.175 Fe 0.0405 0.140 0.538 _____________________________________________________________________ ND: not detected Mathuthu et al (1995) found that the treated sewage effluent from Firle sewage works significantly contributed to the pollution of Mukuvisi River, especially by nitrates, phosphates, potassium, calcium and Co, Ni and Pb. Levels of Co, Ni and Pb in the treated effluent exceeded WHO recommended upper limits by factors of 12, 2, and 6, respectively. Concentrations of heavy metals in the Marimba river increased after the industrial zone and after the sewage discharge point. Mn was particularly high, even at the entrance to the lake (116 µg L-1). There was very little change in Pb and Cu levels at all sampling points along the river, as both are strongly complexing metals and quickly settle down to the bottom sediments of the river. The study concluded that overall levels of most parameters were within acceptable limits according to WHO standards for drinking water and Zimbabwe waste effluent standards (Table 8). Table 8. Acceptable limits for water quality standards (µg l-1). _____________________________________________________________________
Pb Mn Cu Ni Cr Cd Zn Fe _____________________________________________________________________
WHO (drinking
water)
50 100 1000 200 50 5 5000 300
Zimbabwe (waste water)
50 100 50 300 50 10 1000 300
_____________________________________________________________________ Source: Mathuthu et al. (1997). Lake Chivero has experienced problems of eutrophication exhibited in the overgrowth of water hyacinth (Eichhornia crassipes) and algae. This is thought to be a result of nutrients introduced in treated sewage effluent discharged into the Mukuvisi, Marimba and Manyame rivers feeding the lake (Mathuthu et al, 1997). Sewage
22

effluent from Firle Sewage Works has been shown to change the biology of the Mukuvisi River (Moyo and Worster, 1997). 3.2.2 Heavy metal contamination resulting from disposal of sewage sludge In developing countries increased urbanisation and industrialisation require municipal authorities to handle increasing volumes of sewage sludge, often with limited resources. In recent years there has been increased interest in disposal of sewage sludge to agricultural land. Although the high organic content of this sewage sludge may increase crop production (Hernandez et al., 1991) it often contains dangerously high levels of heavy metals. The spreading of sewage sludge on agricultural land in Zimbabwe is mainly limited to municipality owned farms on the periphery of urban centres. Both livestock and crops are produced to offset the costs of sewage treatment and disposal. The waste is either utilised for its value as a fertiliser and soil amendment or used as a landfill. In Harare sewage is applied to agricultural lands and effluent is used for irrigation purposes. In Harare most of the effluent is used for pasture irrigation, while the sludge is used to a limited scale for maize and wheat production. Municipal farmlands receive heavy applications of sludge and effluent annually in order to keep up with the deposition of sludge from the works. Application of the sludge is ‘uncontrolled’ with no data available on application rates, the emphasis being placed on sewage disposal rather than crop fertiliser requirements. The production capacity of these sludge and effluent treated farms can be very high (Oloya and Tagwira, 1996b). Oloya and Tagwira (1996b) found that application of 10 t ha-1 sewage sludge increased wheat yields by 183 and 576 % in Harare and Bulawayo virgin soils, respectively, but also significantly increased the Zn content of the wheat grain by 253%. A major impact of heavy metals on municipal sewage treatment works is in decreasing the activity of the biological systems (activated sludge basins or anaerobic digesters) caused by the increased concentration of toxic metals, primarily in the dissolved state (Staneva, 1997). This means that low concentrations of metals in the influent may be converted to significantly higher concentrations, sometimes up to 30 times greater, in the sludge produced. Oloya and Tagwira (1996a) determined the nutrient and heavy metal composition of sludge and effluent applied to Cripps and Crowborough municipal farms in Harare. The sewage sludge contained high levels of most nutrients required for crop growth (Table 9). Sludge from Cripps had the highest levels of most elements. The high levels of Zn, Cu, Na and Pb in the sludges were thought to be derived from industrial and domestic waste and also from the pipes used to carry the effluent. The concentrations of heavy metals in the sludge are similar to those found in sludges in more industrialised countries. For example, Kirkham (1983) found concentrations of Cd, Cu, Pb, and Zn of 29, 375, 124 and 1890 ppm, respectively in sewage from Manhattan, Kansas.
23

Table 9. Total elemental contents of sewage sludge and sewage effluent from Cripps and Crowborough treatment works, Harare. After Oloya and Tagwira (1996a). ___________________________________________________________________________________ Sewage sludge Sewage effluent __________________________ __________________________ Cripps Crowborough Cripps Crowborough _______________________________________ _____________________________________ pH 6.6 6.4 pH 6.5 6.5 N % 0.95 1.06 P2O5 % 0.083 0.066 P2O5 ppm 155 92 K % 0.12 0.08 K ppm 26 52 Ca % 0.76 0.7 Ca ppm 127 148 Mg % 0.13 0.1 Mg ppm 36 45 Al ppm 2.23 3.15 Al ppm 95 85 Fe ppm 1.63 2.67 Fe ppm 1.2 0.4 Mn ppm 420 319 Mn ppm 4 3 Zn ppm 3642 1779 Zn ppm 0.04 0.04 Cu ppm 1075 353 Cu ppm <0.01 <0.01 Na % 0.18 0.22 Na ppm 84 174 Ni ppm 550 55 Ni ppm 0.06 0.09 Cr ppm 0.2 0.05 Cr ppm <0.01 <0.01 Co ppm 25 10 Co ppm <0.01 <0.01 Pb ppm 515 335 Pb ppm <0.01 <0.01 Cd ppm 15 5 Cd ppm <0.01 <0.01 Mo ppm 4 3 Mo ppm <0.15 <0.15 ______________________________________________________________________________ 3.2.2.1 Case study: Crowborough Sewage Treatment Works and Farm Crowborough sewage works handles 40% of Harare’s industrial and domestic effluent (Mangwayana, 1995) with a sewage sludge output from the works of about 500m3 d-1 (4% solids), or 5840 mg yr-1 (dry solids). Several companies, including electroplating and food processing companies, in the western industrial sites of Harare have their waste waters treated at the plant. Wastewater is enriched in heavy metals, oils, detergents, and other inorganic species. This results in high levels of trace metals in sewage. The resulting sewage contains high levels of heavy metals, phosphates, potassium and nitrates from detergents and industrial wastes. Most of the sewage is comprised of organic wastes, dissolved or otherwise, from industrial and domestic sources. At present the sewage sludge is processed using the Modified Activated System (MAS), although previously biological trickle filters were used. Crowborough farm is 1354 ha in size and is owned by the City of Harare. Only 264 ha is irrigated with sludge and/or effluent (City of Harare, 1992). Pastures holding approximately 1000 cattle are flood irrigated either just with effluent from ponds, just with mixed sludge, or with a mixture of sludge and effluent. Due to transportation costs sewage sludge (alone) application is limited to the area around the sewage processing works (approx 132 ha, or 50% of irrigated area). Application to agricultural land at Crowborough farm started in 1972, the main purpose being to recycle nutrients so that the resultant water could be safely channelled into the nearby Marimba river, draining into Lake Chivero, the city’s main water source (Fig. 2). This
24

nutrient cycling was prompted by increasing problems of eutrophication in Lake Chivero which were blamed on effluent from the sewage works (City of Harare, 1992). Nyamangara and Mzezewa (1999) measured concentrations of Zn, Cu, Ni and Pb in sewage sludge from Crowborough sewage works that were low compared to typical concentrations of sludge originating from industrialised European cities (Table 10). Low concentrations may have been due to seasonal variability in concentration, weather conditions, industrial and domestic loading or variable application rates. Zn, Cu, Ni and Pb were accumulated in the surface soil (0-15 cm), which may have been due to the high affinity of metals to organic matter (McGrath and Lane, 1989).
Greater Harare
Firle Sewage works
Crowborough Sewage Works Lake
Chivero
Harare Water Works
Donnybrook sewage Works Irrigation project
potable water
Sewage Effluent Mukuvisi River
raw water
waste water
Marimba River Figure 2. Recycling of treated sewage and urban waste water in Greater Harare. Source: Gopo and Chingobe (1995)
25

Table 10. Average (range) Zn, Cu, Ni and Pb concentration in sewage sludge and loading rates at Crowborough Sewage Works, Harare. _____________________________________________________________________ Element Concentration
(mg kg-1) Average annual
loading rate (kg ha-1 yr-1)
Total loading over 19 years
(kg ha-1)
Upper limit loading rate (kg ha-1 yr-1)
_____________________________________________________________________ Zn 46 (6-50) 2.0 38.0 15 Cu 8 (6-133) 0.4 7.6 7.5 Ni 2 (1-3) 0.1 1.9 3 Pb 10 (4-15) 0.4 7.6 15
_____________________________________________________________________ Source: Nyamangara and Mzezewa (1999). Mathuthu et al (1998) showed that heavy metals were removed from the effluent water as it passed through the pastures, with average renovation effectiveness of 82.9 % for Cu, 40% for Cd, 60.8 % for Pb, 72.4 % for Cr, 55.1 % for Ni and 82.5 % for Zn. The concentrations of these heavy metals subsequently being discharged into the Marimba river were within the acceptable limits set by the Zimbabwe Effluent and Wastewater Standards (1977), but levels of BOD5, TKN, phosphorus, chloride and TDS in the Marimba river were above acceptable limits. The biological treatment plant needs to be upgraded to reduce BOD5 levels before the effluent is discharged into the pastures (Mathuthu et al 1998). The efficiency of removal of pathogenic organisms still needs to be investigated. Mangwayana (1995) found that plots treated with sludge and a mixture of sludge and effluent at Crowborough farm contained high concentrations of Cd, Pb and Ni at 0-10 cm depth, upto 10 times higher than ‘normal’ levels (Table 11). Pb concentrations of up to 153 ppm and Ni concentrations of up to 38 ppm were measured in soil. The lowest concentrations were found in plots treated with effluent only, but these concentrations were still slightly higher than ‘normal’ levels. Cd levels (up to 28 ppm) in the soil were significantly higher than the maximum concentration permitted by the EC (3ppm), except in effluent irrigated pastures. This means that uptake in livestock and humans may exceed weekly tolerated intakes established by FAO/WHO (Kabata-Pendias and Pendias, 1984). Ni concentrations in plots irrigated with sludge and with sludge/effluent mixture were about 15 times higher than ‘normal’ levels. However, irrigation of pastures with effluent only resulted in heavy metal concentrations significantly below critical levels. Concentrations in Kikuyu grass were significantly lower than concentrations in soil (Table 12), but were highest where sludge only had been applied.
26

Table 11. Mean heavy metal concentrations in soil at Crowborough farm. ____________________________________________________________________
Depth (cm)
Sludge Mixture I Effluent Mixture II Control
______________________________________________________________________ Pb 0-5 87.9 90.1 12.9 89.1 8.4
5-10 130.4 79.6 10.3 153.1 10.7 50-60 10.6 4.6 8.0 5.7 N/S
Cd 0-5 18.2 12.9 0.5 14.6 1.8 5-10 28.1 9.5 1.6 19.3 1.8 50-60 1.8 1.4 1.8 1.6 N/S
Ni 0-5 35.7 12.9 5.0 32.9 Trace 5-10 32.0 9.5 1.6 38.2 Trace 50-60 1.3 1.4 1.8 Trace N/S
______________________________________________________________________ Source: Mangwayana (1995). Table 12. Mean heavy metal concentrations (ppm) in Kikuyu grass. Source: Mangwayana (1995). ______________________________________________________________________
Sludge Mixture Effluent Mixture ______________________________________________________________________
Pb 49 23.1 23.1 23.1 Cd 7.2 7.2 5.0 5.0 Ni 6.5 3.0 3.0 3.0
______________________________________________________________________
3.3 Plant uptake of heavy metals from soils The behaviour and bioavailability of metals in soils are greatly affected by the adsorption of metals from the liquid to the solid phase (Alloway, 1995). These control the concentrations of metal ions and complexes in the soil solution, and exert a major influence on their uptake by plant roots. The mechanisms involved include cation exchange, specific adsorption, co-precipitation and organic complexation. It is often difficult to precisely determine which particular process is responsible for retention of metals in any particular soil. The amounts of metals absorbed by plants are determined by concentrations and speciation of the metal in the soil solution, the movement of the metal from the bulk soil to the root surface, the transport of the metal from the root surface into the root and its translocation from the root to the shoot. Absorption of metals by plant roots can be both passive and active. Passive uptake involves diffusion of ions in the soil solution into the root endodermis. Active uptake
27

occurs against a concentration gradient, requiring energy. The mechanisms differ between metals eg Pb uptake is generally considered to be passive, but Cu, Mo and Zn uptake is either active, or a combination of both active and passive uptake. Ions which are absorbed into the root by the same mechanism are likely to compete with each other. Transfer coefficients, or the metal concentration in the plant tissue above ground divided by the total metal concentration in the soil are presented in Table 13. Of these, Cd, Tl and Zn have the highest transfer coefficients and are the most readily taken up and translocated of all the metals considered. Table 13. Soil-plant transfer coefficients of heavy metals. _____________________________________________________________________
Element Transfer coefficient _____________________________________________________________________
Cd 1-10 Co 0.01-0.1 Cr 0.01-0.1 Cu 0.1-10 Hg 0.01-0.1 Ni 0.1-1.0 Pb 0.01-0.1 Tl 1-10 Zn 1-10 As 0.01-0.1 Be 0.01-0.1 Se 0.1-10 Sn 0.01-0.1
_____________________________________________________________________
Source: Alloway (1995) The rate and extent of movement within the plant depends on the metal, the plant organ and the age of the plant. Mn, Zn, Cd, B, Mo and Se are readily translocated to the plant tops, Ni, Co and Cu are intermediate, and Cr, Pb and Hg are translocated the least. Plant species and varieties differ greatly in their sensitivity to deficiencies and toxicities of metals. Food plants which tolerate relatively high concentrations of metals are likely to create a greater health risk than those which are more sensitive and show signs of toxicity. High concentrations of heavy metals in soils have also been found to inhibit microbial activity. Pb has low mobility due to adsorption onto surfaces of Fe and Mn oxides and clay aluminosilicates. Pb also reacts with organic matter to form Pb-organic complexes of low solubility which can not easily be taken up by plants. This means that Pb tends to accumulate near the soil surface, where it reduces the enzymatic activity of soil microorganisms. For certain species the Pb critical toxic level is high, and so plants may not exhibit symptoms of toxicity. Plant uptake of Pb is passive, rate of uptake increasing with increased concentrations in solution. Usually only 3% of Pb in the root is translocated to the shoot.
28

In an acid environment Cd has a greater mobility than Zn, and is predominantly taken up as Cd2+. It is most mobile at pH 4.5-5.5, and immobile in alkaline soils. Sewage sludge is a main source of Cd, particularly if the sludge consists of industrial waste, as Cd is widely used in the electroplating industry. Although Cd is nonessential for plants, it is effectively absorbed by both root and leaf systems. Elevated concentrations in plants result in growth retardation and root damage, chlorosis of leaves, and red-brown coloration of leaf margins and veins. Cd can accumulate in the eadible portions of crop plants to concentrations of hazard to humans if consumed in large quantities over long periods of time, whilst having no apparent detrimental effects on crops themselves (Smith 1996). Dietary intake of Zn is not a concern for human health as the phytotoxic threshold of Zn in plant tissues is below that which could be potentially toxic to humans, and the overall contribution of Zn to the diet from sludge is likely to be small (Smith, 1994). Tagwira et al (1993) found that an increase in 1 pH unit decreased Zn availability by about 50% in a sandy soil and by 35% in a clay soil. Most Pb taken up by plants is retained in the roots, but the greatest hazard is Pb deposited on leafy vegetables in urban gardens, as washing only removes about a half of the deposired Pb (Wild, 1993). The Pb content per unit dry matter generally decreases in the order: leaves>storage roots>tubers>fresh fruits>seeds (Bieleski and Lauchli, 1983). Table 14. Quantities of heavy metals in soils and plants showing typical trace metal concentrations in uncontaminated and contaminated soils and plants. ________________________________________________________________________________
Soils Plants __________________________________________________________________
Element Normal range in soil (mg kg dry
weight-1)
Concentration in soil considered toxic (mg
kg-1)
Normal range in plant
material (mg kg-1)
Concentration in contaminated
plants (mg kg-1)
________________________________________________________________________________ Cr 5-1000 75-100 0.03-15 5-30 Mn 200-2000 1500-3000 15-1000 300-500 Co 1-70 25-50 0.05-0.5 15-50 Ni 10-1000 100 0.02-5 10-100 Cu 2-100 60-125 4-15 20-100 Zn 10-300 70-400 8-400 100-400 Cd 0.01-7 3-8 0.2-0.8 5-30 Sn <5 50 0.2-6.8 60 Hg 0.02-0.2 0.3-5 0.005-0.5 1-3 Pb 2-200 100-400 0.1-10 30-300
________________________________________________________________________________ Adapted from Ross, 1994.
29

Table 15. Typical concentrations of potentially toxic elements in plant leaves (mg kg dry matter-1), under UK regulations. _______________________________________________________________________
Element Deficiency Sufficient Toxic Tolerable in agricultural crops
_______________________________________________________________________Zn 10-20 27-150 100-400 300 Cu 2-5 5-30 20-100 50 Ni non 0.1-5 10-100 50 Cd non 0.05-0.2 5-30 3 Pb non 5-10 30-300 10 Hg non non 1-3 non Cr non 0.1-0.5 5-30 2
______________________________________________________________________ Adapted from Ross and Kaye, 1994. 3.4 Health effects of heavy metals The health effects of contaminants such as heavy metals are much researched. Exposure to heavy metals has been linked with developmental retardation and reduced IQ among children, various cancers, kidney damage and the development of autoimmunity. Children appear to be especially vulnerable (United Nations Environment Programme, 1999):
'There is particular and growing concern about the threats that chemicals pose to children's health. The main problems include both acute exposure leading to poisoning, and chronic, low level exposure causing functional and organic damage during periods of special vulnerability, when neurological, enzymatic, metabolic and other systems are still developing. Exposure of unborn children to toxic chemicals may produce irreversible effects. For example, low levels of mercury have severe effects on the foetuses of pregnant mothers whom ingest contaminated food. Recent research suggests that these chemicals may affect the ability of children to learn, integrate socially, fend off disease, and reproduce' (p.31).
Such health effects are not the direct focus of this research project, but a cursory review of the literature serves to highlight the health problems related to the ingestion of contaminants. Many complex interactions are involved and some elements may have antagonistic or synergistic effects on the biological properties of other elements (Parke and Ioannides, 1981). Many of the toxic effects of the heavy elements are general and not specific for the element and many of the effects are also similar for the different elements. This is not surprising but does mean that care is necessary in diagnosing a particular metal as the source of the problem. 3.4.1 Lead Research on lead intakes illustrate the health hazards and also the complexities of heavy metal poisoning. The adverse effects of lead (and mercury) on the brain were recognised in antiquity and the weight of evidence points to some negative effect of low level lead exposure on intelligence, cognitive functioning and behaviour (Beattie
30

et al. 1975; Thatcher et al. 1982; Needleman, 1983). Other general effects are that lead competes with other elements and can therefore produce other apparent deficiencies. The first signs of low-level lead exposure are effects on the biosynthesis of haem and some claim that this may be involved in the neuro-toxic effects (Fergusson, 1990). In the renal system initial damage occurs in the peripheral tubular system occasionally leading to renal failure. Exposure to lead has also been implicated in cot deaths (Erickson et al. 1983) and still births (Bryce-Smith et al. 1977). In the body more than 90% of lead is stored in the skeleton and its metabolism is similar to that of calcium. Its presence in bone is probably not a health hazard, but where the diet is low in calcium and bone demineralisation occurs, lead is released into the blood where it can damage other tissues and also becomes available to the foetus. Calcium deficiency increases the toxic effect of lead, and increased calcium intakes can alleviate lead toxicity while lead ingestion can increase calcium deficiency (Silbergeld, 1991; Pitkin, 1992; Bogden et al., 1995). Some animal studies suggest an antagonistic effect of ascorbic acid on lead absorption and toxicity. The exact nature of this possibly protective relationship between vitamin C and lead is not clear. In a study on the levels of intake of certain heavy metals in different geographical areas of Spain Cuadrado (1995) showed that lead intake was highest in the Madrid area because of the intake of contaminated vegetables and cereals. The level of intake exceeded the provisional tolerable weekly intake. Alexander (1974) and Ziegler (1978) showed that infants and children absorb substantially more lead than adults, and therefore have a higher risk of poisoning than adults when exposed to environmental lead. The foetus and neonate are especially sensitive to the toxic effects of lead (Mushak et al.1989). Injury to foetuses is also particularly noteworthy in accidental mercury poisoning (Clarkson, 1983). In Canada, levels of mercury found in the breastmilk of Inuit women were not such as to endanger adults’ health but may been sufficient to have adverse effects on foetuses and breast-fed infants (Wormworth, 1995). According to Nriagu (1992), eating foods exposed to contaminated dusts is highlighted as one of a number of possible source of significantly elevated blood lead levels in African children. Besides inhalation, environmental dust levels leading to contaminated food distribution, soil ingestion and poor hygiene and household practices are implicated. ‘There is no doubt that many children in the urban areas of Africa receive higher doses of lead-contaminated dusts compared to their counterparts in temperate countries’ p. 27. For lead ingested from airborne pollution, sources from the site of production may be important, although Nriagu states that ‘most of the contamination, however, is introduced during the local processing and marketing of the food products’ p. 28. 3.4.2 Other metals Excess copper also causes brain injury. Inorganic mercury salts are less easily absorbed into the body than mercury vapour, but the amount depends on the solubility of the salt. A well-documented intoxication was the Minamata catastrophe in Japan in 1956 when a large number of people of all ages who had eaten seafood contaminated
31

with organic mercury were affected by a crippling chronic neurological disease. The critical organ at risk from inhalation or ingestion is the kidney and, like lead, mercury causes damage to the tubular epithelium. Chronic increased oral intake of cadmium affects the kidneys and lead to proteinurea. Cadmium probably adversely affects calcium and vitamin D metabolism as well. High blood pressure or hypertension has also been associated with cadmium toxicity, although the evidence is not conclusive in humans. Slight anaemia is also associated with cadmium, possibly because of competition between cadmium and iron leading to an apparent iron deficiency (Fergusson, 1990). 3.5 Pathogenic bacterial contamination Although the main emphasis of this project was initially on heavy metal contamination, our studies to date have indicated that microbial contamination is likely to be significant, and so we have begun to investigate this contamination in more detail following HACCP procedures (section 4.6), and to access relevant literature. Domestic sewage is known to carry a full spectrum of mainly enteric pathogenic microorganisms that cause infections such as enteritis, salmonellosis, shigellosis, cholera and yersiniosis. Most of these water and excreta related diseases are prevalent in developing countries because of poor sanitation and poor treatment of urban waste water. Tertiary treatment in sewage works is important in removing pathogens, but is absent in most developing countries (Gopo and Chingobe, 1995). Most wastewater treatment plants are designed to reduce organic pollution of rivers and lakes and rarely are designed to remove all risks from pathogenic organisms. Regardless of the level of treatment provided, some pathogenic bacteria will always reach agricultural fields if this water is used for irrigation. Where sewage water has not been treated the level of pathogens is likely to be much higher. WHO (1989) recommended microbiological quality guidelines or wastewater used in agriculture of ≤1000 faecal coliforms per 100 ml for irrigated crops likely to be eaten uncooked. This faecal coliform level is being used as a water quality guideline in the USA, and has been adopted in some countries, for example Chile, as an irrigation water quality standard. Gopo and Chingobe (1995) sampled the final effluent from Firle sewage treatment works and found that 1.8% of samples tested were positive for Salmonella, and thus the works did not achieve total removal of pathogens such as Salmonella. The reload of non bacterial pathogens such as viruses and other parasitic organisms may be significantly higher. This occurrence of pathogens means that reuse of the sewage and waste water treated effluent for irrigation of vegetables and grazing areas for cattle, should be discouraged as it may constitute a major health hazard to humans and cattle (Gopo and Chingobe, 1995). Gopo et al (1991) found 54.4 % positive samples for Salmonella in water from Lake Chivero. Survival of these organisms is highly dependent on temperature, with greatly increased persistence at lower temperature. At 20-30oC, a common maximum survival time for bacteria is 20-30 days. Viral survival is longer, up to 2 months at 20-30oC, but up to 9 months at 10oC (WHO, 1989). Bacterial survival also depends on soil moisture, organic matter content, pH, sunlight and predation or competition with
32

other organisms. Pathogens survive for shorter time on crop surfaces than in soil, as they are less well protected from effects of sunlight and desiccation. However, survival times can sometimes be longer than crop growth periods, particularly for vegetables, and so the length of time since the last irrigation cycle (potential exposure cycle) is critical. The health risk associated with pathogenic contamination varies with type and purpose of crop grown. Shuval et al (1986) defined three levels of risk in selecting a crop to be grown: low risk to consumer, but field worker protection still needed; increased risk to consumer and handler; and highest risk to consumer, field worker and handler. Vegetables and fruit grown exclusively for canning or other processes that destroys pathogens falls in the first category. Crops for human consumption normally eaten only after cooking, fall into the second category. Any crops eaten uncooked and grown in close contact with wastewater effluent, for example fresh vegetables, fall into the third category. 3.6 Pesticide residue contamination Use of pesticides to control crop pests and diseases is important in maintaining high levels of agricultural production. Without pesticide use the FAO (1988) estimated pest induced crop losses of greater than 35 %. Africa has the fastest growing market for pesticides, with sales increasing by 182 % between 1980 and 1984 (WHO, 1989), and is thought to account for 5% of total global pesticide use (Mhlanga & Madziva, 1990). The dissipation of a pesticide from soil occurs as a result of microbial degradation, chemical hydrolysis, photolysis, volatility, leaching and/or surface runoff. The degree to which each mechanism contributes to the loss of a pesticide depends on the physicochemical properties of the pesticide (eg. water solubility, sorptive affinity), soil characteristics (pH, organic matter, biomass, redox status), environmental conditions (temperature, moisture) and management practices (eg application rate, fomulation type). Hydrolysis is important for degradation of organophosphate and carbamate insecticides and phenoxy herbicide esters. Some organophosphate and carbamate insecticides (terbufos, phorate, isofenphos, aldicarb) are rapidly oxidised in aerobic soils whereas other pesticides, including organochlorine insecticides and pesticides with free nitro-groups (eg. parathion, fenitrothion, PCNB, chlomethoxynil) are rapidly degraded under anaerobic conditions. Photoinduced transformations can also be significant depending on O3 concentration, UV light, and soil organic matter. Soil microorganisms play an important part in the degradation and subsequent mineralisation of several pesticides. Microbial degradation of a particular pesticide may be cometabolic, or may be linked with nutritional requirement, resulting in growth of the degrading microbial population. Microorganisms may adapt to previous exposure to a particular pesticide, resulting in future enhanced degradation. Pesticides susceptible to this include aldicarb, carbaryl, carbofuran, 1,3-D, 2,4-D, EPTC, fenamiphos, isofenphos and terbufos.
33
Pesticide degradation rates and pathways are comparable between tropical and temperate soils. However, Racke et al (1997) found that dissipation of pesticides in tropical soils was more rapid than in temperate soils. This was attributed to higher temperatures associated with tropical climates increasing volatility and enhancing chemical and microbial degradation. 3.6.1 Types of pesticides and their categorisation The most commonly used pesticides in Zimbabwe include organophosphates, organochlorines, carbamates and pyrethrins; fungicides such as dithiocarbamates, inorganic compounds, benzimidazoles and cyanic nitrogenous compounds; herbicides such as paraquat, diquat, triazines and urea based herbicides; and rodenticides, wood preservatives, textile and leather protectants (Chitemerere, 1996). Pesticides are divided into four categories; green, amber, red and purple triangles, depending on their acute oral lethal dosage (LD50), strength of the formulation and persistence after application. Green, amber, red and purple triangle pesticides have oral LD50s of greater than 2001, 501-2000, 101-500 and 0.1-100, respectively. By 1991 268, 103, 85 and 96 formulated pesticides were registered in each of these categories, respectively (Muchena, 1996). The degree of protective clothing required at application varies between categories, with long-sleeved overalls and rubber gloves required for green triangle pesticides, but waterproof jacket and trousers, rubber boots and gloves, face shield and hood and a respirator for applying and handling purple triangle pesticides (Government of Zimbabwe, 1985). Green triangle pesticides can be used in the home, or added to stored produce for human and animal consumption. Amber triangle pesticides can be used in home gardens. Red triangle pesticides are restricted to horticultural, agricultural or industrial pest control. Purple triangle pesticides should not be used by the general public and should only be sold to those whose business, profession or trade require them. Most of the pesticides used in Zimbabwe are insecticides (50-55% of marketed pesticides) (Table 16), followed by herbicides. The horticultural sector accounts for 5-13% of the pesticide market (Mudimu et al. 1995). Herbicides, fungicides and growth regulators are predominantly used in the large-scale commercial farming sector. Communal farmers generally only apply very specific pesticides, which are applied when the need arises. In contrast, large-scale commercial farmers tend to use a variety of pesticides and apply routinely as a preventative measure. Sales representatives of agrochemicals and agricultural extension workers are the major sources of information on pesticide products and use for farmers in Zimbabwe. Other sources are printed materials, pesticide labels and the media. For smallholders most of the promotion is effected through field days and training programmes organised by the extension service. Increased vegetable production has been coupled with increased use of pesticides in this sector. This is of concern due to increased human consumption of pesticide residues and increased drainage into water supply systems. In Zimbabwe the concern is that use of alternative pest and disease strategies could make horticultural products non competitive.
34

35

Table 16. Quantity of insecticide product sales 1986-1994 (‘000kg) __________________________________________________________________________
Year 1986 1987 1988 1989 1990 1991 1992 1993 1994 __________________________________________________________
chlorinated hydrocarbons
28 13 11 27 23 25 26 25 24
organophosphates 218 197 219 198 239 263 276 263 249 carbamates 290 222 193 184 256 281 295 280 266 pyrethroids 54 20 21 25 34 38 40 38 36 mineral oils
(kg/litre) 37 31 38 42 42 47 49 47 44
others 2277 2148 2197 2153 2523 2775 2914 2768 2630 __________________________________________________________________________ 3.6.2 Health effects of pesticides There is no consistent monitoring system for reporting agrochemical poisonings in Zimbabwe, and any existing data depends on reports of acute pesticide poisoning to health facilities. Acute exposure is usually reported, whereas chronic exposure tends to go unreported. Sickness as a result of pesticide exposure is still largely misdiagnosed in Zimbabwe because of the lack of knowledge among health professionals (Chitemerere, 1996). Lack of medical surveillance of rural workers using pesticides and lack of access to health facilities undermines monitoring and detection of pesticide-related illness. Hospital admissions for acute poisoning may give a poor indication of sub-acute or chronic exposure. Most poisoning accidents occur during spraying of crops. Exposure to workers is related to the method of application resulting in contact with skin and inhalation of aerial sprays, contact with the spraying machines, mixing of the chemicals and drinking contaminated water or eating contaminated crops (Bwititi et al., 1987). Organophosphate poisoning incidents among farm workers tend to occur during the 4 month spraying season, December to March (Bwititi et al, 1987), with the 21-30 year age group being the most vulnerable (Kasilo et al., 1991). Pesticide exposure not only affects the sprayer, but also affects communities living on farms by spill-over (Loewenson and Nhachi, 1996). This may result from poor control of distribution, poor storage, re-use of pesticide containers, contamination of food and water sources, or from too early re-entry onto sprayed fields. Similar results have been found in Kenya (Kanja et al., 1986). To date most education on pesticide usage has focused on use of protective clothing or safe disposal of containers, but there is a need for information on safe methods of mixing and spraying, appropriate re-entry times, and detection of equipment faults (Loewenson and Nhachi, 1996). Low level exposure to organophosphates is associated with symptoms of nausea, anxiety, vomiting, abdominal pains, diarrhoea, blurred vision and dizziness (Chitemerere, 1996). Chronic organophosphate and organochloride poisoning damages the nervous, digestive and cardiovascular systems. For example, dipyridals, such as paraquat, result in local injury to the skin, eyes, respiratory and gastrointestinal systems, including nasal bleeding and lung damage.
36

Organophosphates vary in toxicity, for example the estimated oral fatal dose of parathion for an adult is approximately 0.1-0.3 g, compared with 25 g diazinon and 60 g malathion (Ellenhorn and Barceloux, 1988). Most developing countries, including Zimbabwe, used DDT until the 1980’s and small amounts of DDT are still used in Zimbabwe against vegetable and garden pests and for tstetse and mosquito control. Most spraying is done during the rainy season, so the wash out from the streams and rivers assists to distribute the DDT, which eventually finds its way into Lake Kariba (Zaranyika et al., 1994) which provides food, drinking water and water for small vegetable gardens. This means that in this area the main possible source of DDT pollution is diet related. The acceptable daily intake for adults is estimated by the FAO/WHO to be 5 kg per day for sum DDT. Wind drift from the sprayed areas and gaseous uptake are also possible sources of exposure to DDT. Chikuni et al (1997) found extremely high levels of DDT (25.26 mg kg-1 milk fat sum-DDT detected) around Lake Kariba suggesting that use of DDT may be continuing for vector control. According to Chikuni and Nhachi (1996) there is also the possibility of sustained exposure to DDT in the Greater Harare area, particularly in the lower income group. 3.6.3 Environmental implications of pesticides The increasing use of organochlorine pesticides, particularly DDT, dieldrin, endosulfan, deltamethrin, in Zimbabwe is of major environmental concern. Pesticides can drain into lakes from where they can enter the food chain via fish, vegetable irrigation and drinking water. Erosion can also result in transfer of pesticides from agricultural areas into lake sediments (Zaranyika and Makhubalo, 1996). Kubus and Berg (1991) confirmed a link between tsetse fly control sprays with levels of pesticides in Lake Kariba. They found that DDT was both bioaccumulating and biomagnifying in the lake, with higher levels than found in the Mazvikadei Dam and Lake Chivero, which are outside the tsetse and malaria control areas. Mhlanga & Madziva (1990) measured pesticide residue contamination in lake Chivero. Water, bottom sediment, soil and fish samples were analysed for hexachlorobenzene, DDT (DDE and DDD), aldrin, dieldrin, endrin, chlordane, toxaphene and thiodan. Traces of BHCs, aldrin, dieldrin, DDE, DDD and DDT were detected in water, soil and sediment samples. BHCs and DDTs were detected in all fish species analysed. Water was found to contain the lowest levels of residues, well below permissive levels for consumption. 3.6.3.1 Case study: Ho Chin Minh City, Vietnam The approaches and lessons learned from Ho Chin Minh City in reducing pesticide abuse and reducing contamination may be applicable to the situation in Zimbabwe. Vegetables grown around Ho Chin Minh city were previously highly contaminated with pesticide residues, particularly organophosphates, which were higher than FAO and WHO international standards. This was thought to be a result of several factors including lack of knowledge of integrated pest management, use of highly toxic, persistent pesticides, including organophosphate, organochlorine and carbamate compounds, continual use of particular pesticides for long periods without rotation of
37

compounds, resulting in development of resistance and subsequent overapplication, and application of pesticides too close to harvest time. In 1996 the Plant Protection Department introduced a program ‘ Campaign for guiding and encouraging farmers to produce safe vegetables’ the objectives of which were to: 1. help farmers understand the damage caused by pesticide abuse – to the health of
producers and consumers, to ecosystems, and in causing outbreaks of pests, and threfore the need to reduce pesticide use and introduce integrated pest management.
2. advise farmers to stop using certain banned pesticides on vegetable produce. 3. recommend farmers not to use organophosphates, organochlorines or carbamates
which have a high toxicity and persistence especially on vegetable crops approaching harvest.
4. recommend farmers to alternatively use insecticides with low toxicity and short-lived residues, such as microorganisms, insect growth regulators and pyrethroid group chemicals.
5. instruct farmers how to correctly apply pesticides at accurate dosages and to rotate the use of different pesticides to prevent development of resistance.
6. recommend to farmers that they observe appropriate periods between pesticide application and harvest and sale of vegetables.
The program was implemented by: 1. organising instruction sessions for almost all farmers growing vegetables in
suburbs of Ho Chin Minh city. 2. establishing workshops and demonstration fields in which pesticides were used
correctly. 3. distributing leaflets to vegetable producers about effective and safe use of
pesticides on vegetables. 4. instruction sessions on radio encouraging farmers to use pests safely and
effectively so as to protect the health of consumers and themselves. The program was evaluated by means of questionnaires on changes in perception, adoption and application practices after participating in the program. Over the first 3 years of the program insecticide use decreased from 50 to 11%, but farmers continued to use banned insecticides on vegetables mainly due to low price and rapid insect kill, although use of these banned pesticides fell from 76 to 32%. 100% of farmers surveyed perceived pesticide abuse to potentially harm the health of farmers and consumers, 85% recognised the potential harm to the environment, and only 28% recognised that pesticide misuse can result in an outbreak of pests.
38

4. Food safety: an international perspective There have always been concerns about food safety, and four historical stages can be identified. Earliest evidence has been traced back to the documents of the ancient civilisations - Egyptians, Assyrians, Greeks and Romans. Subsequently, there was legislation enacted by European states in the Middle Ages which aimed to tackle food safety problems, and some such legislation is still extant. More recently, the current basis for food safety and QA was laid by scientific advances in the 19th century. Modern concerns were first drawn together in 1961 when first steps were taken to establish an international food code (subsequently the responsibility of the joint FAO/WHO Codex Alimentarius Commission - CAC) (Codex Alimentarius Commission, 1999). Interest in systems for assuring the safety of food products has increased dramatically since the beginning of the 1990s. In advanced economy countries, consumer awareness of the incidence of contaminated food products and the associated health risks has been the principal factor that has boosted demand for safety as a food quality attribute. Changes have resulted mostly from contamination crises. Safety scares have also occurred in the food systems of developing economies, where the effective demand for food safety and QA is less evident. According to Motarjemi, ‘it should be remembered that the developing countries bear the heaviest burden of foodborne diseases in the world' (Motarjemi et al. 1996: 82). In such countries, including Zimbabwe, public awareness of the health, education and economic implications of unsafe food systems in developing economies is growing fast, partly through the advocacy role of national and international media (Poole et al. 2000c; Poole et al. 2000d). 4.1 Safety and quality assurance in the food chain Quality is a complex of properties and characteristics of a good or service that satisfy a customer’s implicit and explicit needs. Food safety is a subset of the broader concept of food quality, and includes a number of dimensions: • production and post-harvest handling techniques: process, or ‘best practice’ in
respect of technology and inputs including choice and application of agrochemicals and organic fertilisers, processing and storage;
• product safety: freedom from environmental and other contaminants and sources of toxicity (chemical and biological) injurious to health;
• product attributes: both objective (nutritional and other physical characteristics such as shelf life, appearance, and other presentational aspects including labelling), and subjective (utility in respect of economic value, consumer preferences and satisfaction, including flavour, texture, range of choice….)
These quality attributes have been divided by others into other subsets: safety, nutrition, value and packaging, and process attributes (Hooker and Caswell, 1996; Caswell, 1998). Assuring food safety in respect of these dimensions is a complex task involving a range of stakeholders and disciplines throughout the food chain. Different environments, production practices and food products present different challenges, and the different dimensions vary in importance between food systems and cultures.
39
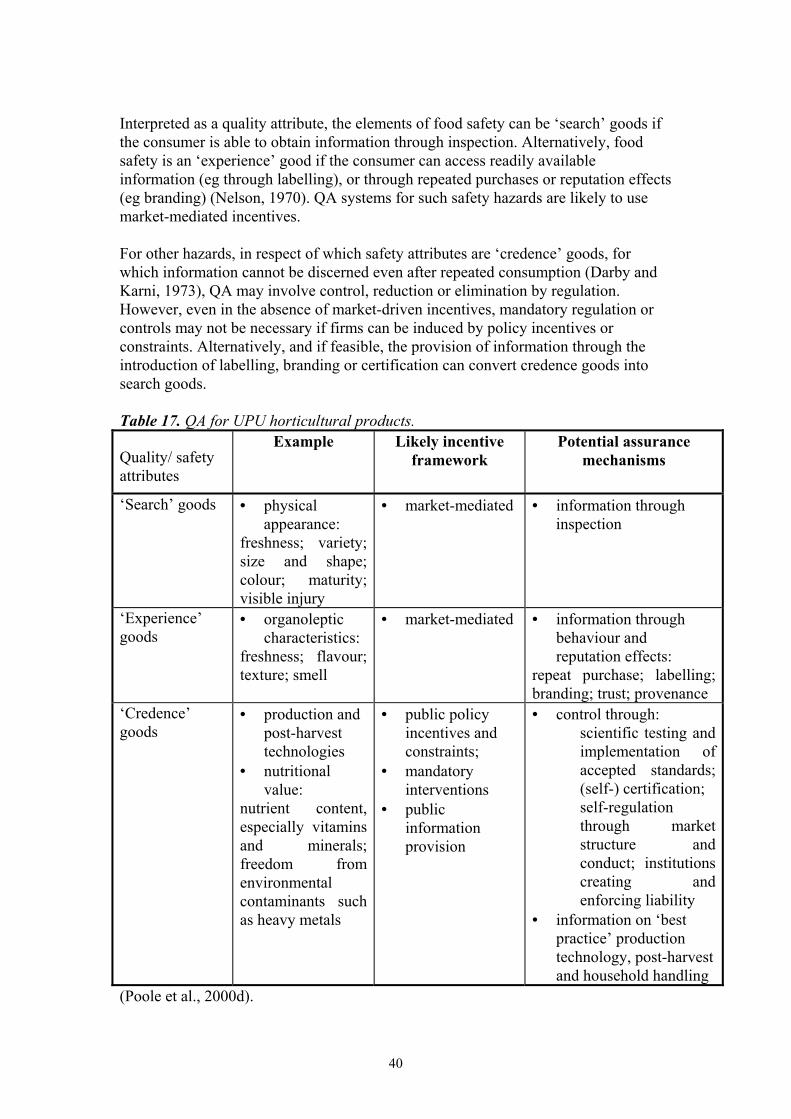
Interpreted as a quality attribute, the elements of food safety can be ‘search’ goods if the consumer is able to obtain information through inspection. Alternatively, food safety is an ‘experience’ good if the consumer can access readily available information (eg through labelling), or through repeated purchases or reputation effects (eg branding) (Nelson, 1970). QA systems for such safety hazards are likely to use market-mediated incentives. For other hazards, in respect of which safety attributes are ‘credence’ goods, for which information cannot be discerned even after repeated consumption (Darby and Karni, 1973), QA may involve control, reduction or elimination by regulation. However, even in the absence of market-driven incentives, mandatory regulation or controls may not be necessary if firms can be induced by policy incentives or constraints. Alternatively, and if feasible, the provision of information through the introduction of labelling, branding or certification can convert credence goods into search goods. Table 17. QA for UPU horticultural products.
Quality/ safety attributes
Example Likely incentive framework
Potential assurance mechanisms
‘Search’ goods • physical appearance:
freshness; variety; size and shape; colour; maturity; visible injury
• market-mediated • information through inspection
‘Experience’ goods
• organoleptic characteristics:
freshness; flavour; texture; smell
• market-mediated • information through behaviour and reputation effects:
repeat purchase; labelling; branding; trust; provenance
‘Credence’ goods
• production and post-harvest technologies
• nutritional value:
nutrient content, especially vitamins and minerals; freedom from environmental contaminants such as heavy metals
• public policy incentives and constraints;
• mandatory interventions
• public information provision
• control through: scientific testing and implementation of accepted standards; (self-) certification; self-regulation through market structure and conduct; institutions creating and enforcing liability
• information on ‘best practice’ production technology, post-harvest and household handling
(Poole et al., 2000d).
40
4.2 Demand for food safety Swinbank (1993) has reviewed the complexity of the economic issues surrounding food safety. Poorer societies characterised by food scarcity, lower life expectancy and lower levels of education, are likely to demand less food safety than richer societies. But food safety is probably income-elastic (ie greater than 1), so that as incomes rise, more food safety is demanded. Unnevehr and Jensen (1999) also link the demand for food safety to growing affluence, among other things. In short, in economic terms, food safety is a ‘luxury’ good. Besides income and prices, the demand for food safety depends also on perceived risk. The level of risk perceived by food consumers depends in part on their awareness of safety hazards and therefore is a function of the level and value of available information. Perceived risk is also a function of individual attributes such as age and education. Where incentives and information flows are imperfect, the market alone may fail to provide the level of food safety demanded by society. According to Bunte (2000) product demand grows when perceived quality rises due to improved health and safety measures. Efficient markets and cooperative trading relationships signal demand changes and enhance the flows of information and incentives. However, in non-cooperative vertical supply chain relationships firms may under-deliver safety improvements: individual profit-maximising firms will not consider the positive externality of increased output and profits accruing to other firms resulting from improved health and safety. Quality specifications with the appropriate monitoring and enforcement methods may serve as a mechanism to internalise the health benefits within the food chain. 4.3 Food safety: science, economics and institutional development The review by Collins (1993) of the improvements in the British food system in the 19th century is instructive for developing economies and illustrates how economic factors played a part as significant as that of improved science. Bad food unquestionably was a major contributor to the poor quality of life in the industrial towns of early 19th century Britain. Food standards in Britain had fallen from the mid-18th century because of a range of factors: low incomes, high distributive costs which failed to keep pace with urban development, fraud on a massive scale, congestion and lack of adequate structures in food retailing, the absence of legislation, and the difficulties of detecting adulteration and of linking adulteration with impaired health. Growing urbanisation and industrialisation no doubt exacerbated conditions of contamination and lack of sanitation. 4.3.1 Science and institutions Improvements in food quality were not just a matter of scientific achievement, but also of institutional development and improved commerce. The regulatory framework was enhanced from 1860 onwards by establishing public analysis, introducing penalties for adulteration, and formulating clearer descriptions of punishable offences.
41

Changes in business culture also played a part, with the development of ethical approaches such as fixed prices, fair dealing and value for money. By the late 19th century firms traded on their reputation for honesty, integrity and quality, and trade associations developed. The Provision Trade Association, founded in 1887, 'had regulations covering every aspect of the conduct of the provision trade, from transactions between members to the grading of produce' (Collins, 1993: 105). 4.3.2 Market organisation There were major changes in the structure and organisation of the food industry, accompanied by a fall in real food prices and growth in real incomes. Collins also argues that increasing concentration of supply to the major UK markets was significant, particularly through greater reliance on imports (1993). Improvements in transport technology, physical infrastructure and food handling techniques and conservation technologies also improved supply conditions. Distributors were increasingly concerned with securing greater control of their suppliers, even to the point of integration with overseas production. Concentration in manufacturing also led to higher standards through the application of improved technology, greater standardisation of products, and the generation of steady profits. Increased competition played a part in increasing market concentration, not just in manufacturing but also in retailing. Loss of specialisation of food handling trades, and the increased dependence on merchandising forced moves towards assured quality. 'Sainsbury, for example, was obsessed with quality; he bought only on the basis of detailed information about the product and its provenance, and searched relentlessly for producers who were the best in their field and who could deliver at speed' (Collins, 1993: 107). As incomes rose, distributors competed more on quality, service and freshness than on price. Branding evolved 'in response to the anarchy of the marketplace with its multiplicity of products of unknown origin and doubtful quality' (p. 108). Comparable organisational and institutional changes in the UK food system of today are driven by many of the same factors that were at work 100 or so years ago. Above all, advanced food industries are driven by the need for control of the food chain in order to satisfy consumer demands in respect of product quality – including food safety - and value-for-money. ‘Efficient response to consumer demands for traceability and market performance in a range of dimensions is the major contemporary driver of the structural changes in food markets in Europe’ (Poole, 1997a: 10). 4.4 The challenge in developing countries Measures leading to improved food QA in developing countries are likely to bear some similarity to the British experience outlined above. Efficient, effective and relevant QA mechanisms are likely to involve improved scientific knowledge, accompanied by technical and institutional responses through both regulatory and market mechanisms. Therefore, information and incentives are likely to play a part in
42

QA mechanisms at least as important as policy, especially where the regulatory environment is weak. This insight is particularly relevant to developing countries. Information is an important dimension. The World Development Report 1998/99 suggested three approaches to addressing information problems in developing countries that are relevant to food safety issues (World Bank, 1998): • providing and eliciting information to verify the quality of products and services,
which can be achieved, for example, through developing and/or implementing accepted standards;
• monitoring and enforcing the performance of transactions – arguing for a strong legal and judicial system, but also creating incentives to minimise recourse to it. It may be possible to explore innovative alternative approaches to enforcement problems such as consumer pressure and eco-labelling; creating consumer awareness will be enhanced by:
• ensuring two-way flows of information by giving the poor a voice, learning about the poor, working through local channels and providing knowledge to the poor in a way that they can use.
Uncertainty about the fundamental science of food safety is important, but information problems arise not just because of lack of information but have much to do with the abuse of information, or dissemination of misinformation, and the existence of asymmetric information between stakeholders and the attendant agency problems. The appropriate approach to QA will depend on the type of hazard or quality imperfection and also the potential technological and institutional solutions. Further evidence of the evolution of technological and institutional approaches comes from Brazil. Resende (1993) states that the level of food safety in Brazil is associated with the level of socioeconomic development. His case study shows how consumer protection was enhanced by the measures in the 1988 Constitution that established the municipalisation of food control services. The more dynamic and modern food control mechanisms introduced then have been associated with improved primary health care and a unified health system. At the time of Resende’s work, the appropriate balance of responsibilities between central and decentralised administration was unclear. Moreover, it was suggested that considerable technical and financial assistance and institution-building would be needed to implement the new system. The relevance of institution-building to food safety in Zimbabwe is worth noting. Initial research among public organisations that are stakeholders in the safety of the fresh produce system in Zimbabwe has been conducted by Agritex (Appendix 1). 4.4.1 The potential for regulation in developing countries Drawing on case material for food markets in India, Harriss-White (1995) has explored the apparent incongruity of the need for market regulation in an environment of economic reform dominated by the themes of deregulation and privatisation. While economic reform in Zimbabwe appears to be on ‘hold’ and subordinate to other economic and political issues (notably land redistribution) lessons from India may be
43

applicable. In the Northian tradition, Harriss-White argues that formal institutions such as those that provide a secure framework for the transfer of property rights are a precondition for commerce. Such a framework may have micro (firm level), meso (collective action) and macro (state level) elements. From a theoretical starting point, Harriss-White employs NIE concepts (market characteristics such as uncertainty and limited information, behavioural characteristics such as bounded rationality and opportunism, transaction characteristics such as asset specificity) to explain the existence of institutions which have the functions of enabling, disciplining and constraining market exchange. ‘These are the necessary elements of a regulatory system’ (1995: 586) which are the responsibility of the state, are enshrined in law, and define the operation of the efficient private market economy. Besides efficiency, markets have other objectives such as reducing uncertainty. It is clear that economic exchange can be consummated through horizontal and vertical interfirm arrangements other than the market mechanism, such as ‘networks of repeated or relational contracts and collective action’, for which rules and conventions are equally necessary. She comments that informal collective institutions have evolved in place of ineffective formal regulation. She argues that there are three layers of transaction and supervision costs associated with regulation: the firm, the collective and the state. Market imperfections remain rooted in incentives to private and public rent-seeking, and social institutions such as gender and ethnicity that create structural imperfections, condition market conduct and determine performance outcomes. Foreign-funded projects to overcome market imperfections add an additional layer of complexity to the regulatory environment with consequences which are unpredictable because of failure to understand the complexities of the market system. Harriss-White distinguishes two approaches to the debate on market regulation: one is the tendency to expand interventionism; and the other is to reduce regulation because no law is better than poor law, poorly implemented. She dismisses both approaches, arguing that regulatory law needs to be reformed and implemented. Quoting Shaffer, she presents a taxonomy of agricultural market regulation for India with dimensions of: • market structure, conduct and performance objectives of regulation; • enforcement mechanisms; • degree of specification; • type of regulatory incentives; • contingencies for implementation; • jurisdiction at the boundaries. 4.4.2 Lessons for food safety Within this policy scenario, there are lessons for food safety. Micro-interventions alone provide the precision to tackle market-specific problems. They are likely to take the form of incentives rather than controls. They must account for a range of stakeholder interests (in particular consumer interests, but also those of poor labourers, producers and intermediaries). The objectives should not just fall within the
44

narrow confines of food policy interventions but take into account also the broader health and education imperatives (Poole et al., 2000d). 4.5 Approaches to regulation in developing countries The question of regulation arises because food safety is an experience or credence good, as noted above, not readily observable or measurable. Market failure to deliver the level of safety and QA to meet public health requirements and consumer demands constitutes economic grounds for public policy intervention (Unnevehr and Jensen, 1999). However, the existence of market failure in respect of food safety does not mean that government intervention can necessarily improve the performance of unregulated markets. Even where there are positive net benefits, the distributional consequences of regulation need to be understood (Antle, 1999). Approaches to public food regulation range from low to high levels of intervention such as the provision of information; the development and enforcement of standards (safety targets, performance criteria, product and process specifications); and prior approval. According to Hilmer, et al., (2000) food safety regulations can take two broad forms, performance and process standards: • performance standards specify a quality level that a firm’s output must meet,
involve enforcement through testing, but allow the firm autonomy over its production process;
• process standards specify production procedures required to produce output of the desired quality.
Unnevehr and Jensen (1999) distinguish between direct command and control (CAC) interventions and information-based incentives for private market solutions: provision of information to consumers, lowering information costs through improved testing mechanisms, certification schemes, and institutions (laws) creating enforceable liability. Branding, labelling, self-certification, reputation effects and trust are additional private mechanisms: ‘in India you do business with people with whom there is prior mutual trust’ (Basu, 1992: 344). Absenting trust and full information, public intervention is needed. High levels of intervention create the potential for firms to ‘capture’ the regulatory process and thereby attempt to co-opt the regulatory system to gain competitive advantage. This phenomenon, together with the enforcement problems that arise from a heavy regulatory approach - evident, for example, in the case of India (Harriss-White, 1995) – suggest that regulation must be approached with caution. Under a light regulatory regime, on the other hand, one might expect differing levels of ‘sanitary propensity’: voluntary compliance to high sanitary standards (Hilmer et al., 2000). There is a growing consensus that both public and private sector initiatives are necessary in enhancing the integrity of food systems. Analysis of QA mechanisms in the UK by Wye researchers has highlighted the importance of the appropriate balance between the ‘carrot’ and ‘stick’ approaches (Fearne and García, 1999). Commercial considerations and government policy together have led the global food industry to
45

introduce assurance mechanisms throughout the food chain. National and international regulatory initiatives to impose ‘due diligence’ requirements and legal liability cannot work alone. Nor can the task to secure the integrity of the supply chain be left to individual or firm initiatives in response to market forces. Drèze and Sen (1995) argue that the contrast between market-based and government-based economic decision requires a clear understanding of context, of the nature of the state and the nature of markets: ‘There are variations in market forms… And there are diversities in the nature of governments’ (1995: 18), and the two forms of economic decision-making are interdependent. Markets need an institutional framework, and the government may have a role in initiating market-reliant growth. As Basu argues, ‘In reality, an effective market is one which operates freely, but within a structure of norms and legal institutions’ (Basu, 1992: 341). At the state level in India, they note among other things the essential role three factors. There must be: a) well-functioning public (ie state-provided) services; b) public (ie democratic and participative) action; and c) a particular type of public action – the political organisation of deprived sections of the society. These insights may be relevant to other developing economies, including Zimbabwe. Elsewhere, Drèze and Sen reinforce their assertion that public action is vitally important. In the context of food safety, consumer pressure might be the form of public action expected to play a role in bringing about improved QA: ‘Public action can also affect outcomes without having to work through swaying government policy’ (Drèze and Sen, 1995: 89). These assertions are consistent with the climate of economic and policy adjustment that seeks to find an efficient and effective balance between intervention and regulation by the state, and private sector activity in response to incentives created by the market. In the words of the World Bank: ‘At the core of today’s environmental agenda is identifying creative ways of combining markets, governments, and civil societies to promote efficient mechanisms for the generation, diffusion, and use of sound environmental knowledge’ (World Bank, 1998: 116). 4.5.1 Incentive problems: the costs and benefits of food safety in developing countries There are increasing concerns about the costs to the industry of regulatory compliance. The costs to the regulatory authorities are those of the enforcement of performance measures through product testing, and to firms are the costs of conforming to industry-wide standards that may not be appropriate. HACCP (Hazard Analysis Critical Control Points) process standards are becoming widespread because they are considered to be less costly. Whether or not food chain stakeholders engage in QA activities depends in part on the mix of incentives to which they are subject. Incentives may be positive, and result in the voluntary adoption of appropriate QA mechanisms. They may be negative, either purposive (in the form of policy-mediated sanctions for non-compliance such as fines), or consequential (in the form of declining market share and exclusion from the
46

market). Characteristics of QA mechanisms that are likely to affect distributional issues include: • the level of sunk costs; • the costs of compliance • market power considerations; • continued or enhanced market access (cf market exclusion); • increases in product quality; • improvements to operational efficiency. Efficient, effective and relevant safety mechanisms are likely to involve both regulatory and market mechanisms. The policy framework is an important element of a QA system. Experience gained from studies in advanced economies suggests that market- or contract-mediated incentives may be more important.
market organization•degree of vertical coordination
• level of intermediary concentration•pricing efficiency and signalling effects
•horizontal trader associations
scientific capital•knowledge of safety hazards
•standards and testing
technological development•agrifood handling technologies
•marketing and processing infrastructure•testing and monitoring systems
commercial attitudes to exchange•fixed prices and value for money
•trust, fair contracts and repeat dealing
public participation•awareness of safety hazards•propensity to public action
institutional efficiency•political leadership•quality of regulation
•contract enforcement mechanisms•capacity of central and local
government
PUBLIC ANDREGULATORYMECHANISMS
PRIVATE ANDVOLUNTARYMECHANISMS
Figure 3. Factors conditioning the effectiveness of QA mechanisms 4.5.2 Risk assessment in developing countries The scientific rationale for regulation depends on risk assessment procedures, the principles of which are accepted within the international frameworks such as Codex Alimentarius and WTO (Henson and Caswell, 1999). There are three stages within risk assessment procedures: • risk assessment; • risk management; • risk communication.
47

Practical application of risk assessment procedures for assessing food safety is difficult even in economies well-endowed with statistical resources such as the US. The analytical techniques are as yet undeveloped and there is not yet international agreement about principles and procedures. For example, take the precautionary principle: it is argued that uncertainty about health hazards should not be used as a justification for postponing risk management and reduction (Henson and Caswell, 1999). The EU adopted this precautionary approach during the BSE crisis and also the dioxin contamination in 1999. However, the US is challenging EU claims that the 'precautionary principle' is enshrined in a range of international rules, including a WTO agreement and a biological diversity pact. A 28 page communication on the principle in February 2000 was partly welcomed by the US, but further clarification has been sought about decision making, definitions and terminology, and the role of the principle in EU and in international law (Financial Times, 2000). Demand for food safety is often interpreted within the framework of marginal analysis in which safety measures are supplied such that marginal costs and benefits are equated. Different methods of regulatory impact analysis (RIA) are evolving in an attempt to define the optimum level of provision. However, the application of CBA to food safety is fraught with practical difficulties which fall under three main headings (Henson and Caswell, 1999: 593): • conceptual issues; • measurement and other methodological issues; • political economy reasons: potential mismatches exist between expert opinion and
public perception of food safety hazards. Antle (1999) argues that even for the US, where RIA is probably most advanced, underlying assumptions are simplistic and at best the results of quantitative RIA are highly uncertain. Techniques such as cost of illness analyses to assess benefits such as reduction in morbidity and mortality are not likely to be practised widely elsewhere. Cost-benefit analysis is less developed in the UK. An analysis of the costs and benefits of introducing HACCP in Japan in the kaiware (radish sprouts) system (responsible for the massive E.coli 0157 outbreak in 1996) was described by the authors as ‘not far beyond anecdotal’ (Maruyama et al. 2000: 333). A simpler micro-level approach was used by Mortlock et al. to study HACCP-adoption among small retail and catering businesses (2000). They assessed the costs of planning and implementation of a HACCP system and the ongoing costs of running the system. They consider the micro analytical approach to be capable of extension to other firms and sectors, and ongoing work combines CBA with willingness-to-pay studies of consumers in the UK. The Social Accounting Matrix of Golan et al. (2000) can be used to estimate the distribution of costs and benefits of HACCP, indicating the direction and magnitude of economic flows resulting from regulation. The value of the approach depends on the validity of estimates of the costs of foodborne illness and the estimates of expenditure on compliance. In developing economies, the measurement problems are likely to be extreme.
48

4.5.3 International standards and developing countries The safety issues of the food industry are related to the regulatory environment for international production and trade in food products. It has been argued that international food safety assurance standards are – or should be - converging (Caswell and Hooker, 1996). The concept of critical limits of contaminants is relevant to both health and trade purposes. In this context, it is noteworthy that sanitary and phytosanitary (SPS) measures were introduced into the international policy environment at the end of the Uruguay Round of multilateral trade talks in 1994, by means of the SPS Agreement, in order to regulate the use of such measures as non-tariff barriers to trade. In the international arena, the priority of the Codex Alimentarius Commission is to protect the health of consumers and ensure fair practices in the food trade. The significance of the CAC food code for consumer health protection was underscored in 1985 by the UN Resolution 39/248 in which guidelines were adopted for the development of consumer protection policies. In the 1997 biennial meeting of the Codex about 75% of delegations were from developing countries (Codex Alimentarius Commission, 1999). In the Codex, the instruments of consumer protection are two types of standards, commodity standards and general standards. There are also general principles, guidelines and recommended codes of practice. Codex commodity standards cover various elements: • scope - including the name of the standard; • description, essential composition and quality factors - defining the minimum
standard for the food; • food additives; • hygiene, weights and measures; • labelling; • methods of analysis and sampling. The general standards cover the following: • food labelling; • food additives; • contaminants; • methods of analysis and sampling; • food hygiene; • nutrition and foods for special dietary uses; • food import and export inspection and certification systems; • residues of veterinary drugs in foods; • pesticide residues in foods. An example of food QA mechanisms within the CAC is the ‘Recommended International Code of Practice – General Principles of Food Hygiene’ (CAC/RCP 1-1969, Rev.3 (1997)). Food safety is defined therein as assurance that food will not cause harm when it is prepared and/or eaten according to its intended use. For the
49

purposes of this project, a positive approach to food quality and safety should also embrace production, marketing and distribution practices that impair nutritional and economic quality characteristics of food, such as nutrient levels and shelf life. The ‘General Principles’ sets out provisions for Good Manufacturing Practices based on risk assessment principles, including HACCP guidelines (Oriss, 1999). Among the measures taken by CAC to provide assistance to developing countries has been developing and publishing training manuals on food inspection and quality and safety assurance, particularly with respect to the application of the HACCP system in the food-processing industry (Codex Alimentarius Commission, 1999). Zimbabwe is a member of the Codex Alimentarius Commission (The Government Analyst, The Government Analyst's Laboratory, P.O. Box CY 231, Causeway, Harare - Tel: +263 4 792026; Fax: +263 4 708527). 4.6 HACCP (Hazard Analysis Critical Control Point) The HACCP procedure for food products is the most widely disseminated mechanism for enhancing food chain integrity. It allows the food industry to analyse potential hazards and develop effective controls that meet the individual needs of products, processes and firms. Most commonly, the safety hazards are conceived as microbial in nature, but properly the concept of hazard should cover any biological, chemical or physical agent with the potential to cause an adverse health effect. HACCP substitutes easily monitored control processes for costly testing, targets specific hazards, and can be linked to system-wide risk assessment. A particular advantage is the reduction in costly testing and monitoring. Analyses of HACCP implementation in the US show that costs are significant but usually modest in relation to total industry costs (Oriss, 1999). The HACCP approach to food quality assurance is founded on the following concepts: • hazard: unacceptable contamination that may affect food safety or spoilage; • severity: magnitude of the hazard, or the seriousness of the possible
consequences; • risk: an estimate of the probability of the hazard occurring. HACCP involves a series of sequential steps encompassing the food chain from growth, through harvesting, processing & manufacture, distribution, preparation, to the consumption of agrifood products (Bryan, 1992):
50

identify hazards and assess their severity and risk ⇓
determine critical control points ⇓
specify criteria to measure control ⇓
monitor critical control points ⇓
take corrective action whenever monitoring indicates that criteria are not met ⇓
verify that the system is functioning as planned HACCP was advocated by the World Health Organisation as long ago as the early 1970s, and is regarded as ‘the universally recognized and accepted method for food safety assurance’ (Motarjemi et al., 1996: 77). It was endorsed much later, in 1993, by the Joint FAO/WHO Codex Alimentarius Commission as the most cost-effective current approach for ensuring food safety. The European Union adopted the HACCP approach in Directive 93/43 (Ziggers, 2000). The Codex Committee on Food Hygiene is responsible for developing and implementing international guidelines for HACCP (Codex Volume 1B31 and Supplement32, General Requirements (Food Hygiene)). For example, at the 32nd Session in Washington D.C., (29 November - 04 December 1999), the Committee agreed to identify the issues involved in elaborating appropriate guidance on the application of HACCP principles in redrafting the Discussion Paper on the ‘Application of HACCP in Small and/or Less Developed Businesses’ (Food and Agriculture Organisation, 2000). HACCP is much studied (Unnevehr, 2000). It is practised increasingly in advanced food markets, where firm-operated HACCP-based QA is an important mechanism for ensuring production and product integrity. HACCP is the choice of control system that is increasingly used by food-importing countries and is being adopted in the export sectors of developing economies (Unnevehr and Jensen, 1999). According to Motarjemi, ‘in view of the high prevalence of food-borne diseases in the developing world, and the limitation of resources, the potential benefits that the application of the HACCP system may afford in comparison to the problems faced are more important for developing countries…’ (1996: 82). It also serves for linking product QA and quality business management processes. Commonly the latter fall within the ISO 9000 series of international quality management accreditation systems, under which firms are obliged to match self-documented standards (Stringer, 1994). ISO standards are recommended in European Union policy on food hygiene rules and standards.
31 Guidelines for the Application of the Hazard Analysis Critical Control Point (HACCP) System: CAC/GL 18-1993 32 Hazard Analysis and Critical Control Point (HACCP) System and Guidelines for its Application: Annex to CAC/RCP 1-1969, Rev. 3 (1997)
51

Adoption and implementation of HACCP has both international and country-specific dimensions. Internationally, as noted above, HACCP has been integrated into the CAC General Principles of Food Hygiene, and ideally should not be implemented independently of the hygiene principles. Developing countries frequently need overall QA systems and basic hygiene controls before considering and implementing a national HACCP strategy. At the individual country level, regulations to control hazardous substances in the food chain are being formulated, in developing countries as well as advanced economies, notwithstanding the difficulties of implementation. According to Oriss, 'Governments should identify acceptable levels of food safety risks, set food quality and safety objectives and implement measures necessary to ensure that these objectives are met by the food industry. Governments have the responsibility of establishing the necessary standards, legislation and enforcement programmes. The food industry has the responsibility of implementing QA systems, including HACCP, where necessary to ensure compliance with the standards and legislation' (1999: 255). HACCP was developed as a firm- or plant-level tool to enhance safety of processed foods, and the application of HACCP industry-wide is necessarily different. The approach needs to be inclusive of the multiplicity of stakeholders in a given food chain. HACCP approaches to food safety have been used in the WHO Healthy Cities Project, begun in 1986, and has emphasised the importance of health linkages to peri-urban marketplaces. The main hazards to food safety arising from the marketplace were due to contamination during transport, lack of quality control standards, improper handling, storage and environmental conditions, and misrepresentation or adulteration leading to health, nutritional or economic problems for the consumer (Birley and Lock, 1999). At an industry level, there are likely to be structural effects of implementing HACCP procedures. The long-run implications, like other forms of regulatory control, are unlikely to be 'scale-neutral': large firms can more easily invest in the technology and managerial skills necessary to satisfy procedures. According to Mortlock et al.(2000) HACCP has been received with muted enthusiasm in the UK retail and catering sectors because of the wide range of food products which need to be handled within the system, the financial implications for small firms, and the relatively small scale of human resources available to such firms. Greater vertical coordination is a likely result of the widespread use of HACCP, which may both enhance food safety and also create barriers to the effective participation of small firms. The equity considerations for food chain participants are likely to be significant, although the scale and distribution of costs and benefits are likely to vary with nature of the product or sector. 4.7 Food safety management and ISO One of the driving forces behind improving the management of food safety is the commercial advantages accruing to firms which market safe products. There will be demonstrable benefits to safety-accredited firms as markets internationalise. Moreover, as markets become more competitive and consumers’ spending power
52

increases, there will be a growing requirement for objective measures of safety and quality control. Globalisation of food markets implies adherence to international standards, among which are quality management standards and food safety procedures such as HACCP (Varzakas and Jukes, 1997). In theory, accredited standards are a source of competitive advantage, becoming both a prerequisite for market access as a signal of quality to suppliers and customers, and also a source of increased efficiency within accredited firms. For Greece, a small European country distant from the main centres of world capital, globalisation of food safety standards presents both opportunities and threats. Reporting research in the Greek food industry, Varzakas and Jukes (1997) highlight the potential benefits of adopting international standards. These may be increased customer trust and enhanced reputation effects; greater ease of contracting between suppliers and customers; better products leading to reduced wastage and improved consumer satisfaction; easier market entry and increased market share; and improved morale, communication and human capital resources. HACCP serves for linking product QA and quality business management processes. Commonly the latter fall within the ISO 9000 series of international quality management accreditation systems. HACCP can be incorporated into an ISO 9000 system and certificated as part of the system (Caswell and Hooker, 1996; Motarjemi et al., 1996). 4.7.1 What is ISO 9000? The ISO (International Standards Organisation) 9000 series is internationally accepted as the standards for firm quality management systems. ISO does not set objective standards, but measures performance against a company's own criteria. ISO 9000 assures quality management procedures, not product quality. For firms which adhere to established and agreed criteria the relationship between customer and supplier can concentrate in the product (Stringer, 1994). What does ISO 9000 seek to achieve? According to Stringer (1994): IT IS: • a series of standards describing the requirements for a quality system within the
industry; • a way of operating a quality system to a standard which can be externally audited
and certified; • a way of making sure that the quality system never stands still. Continuous
management review is a requirement of a certified system; • a way of formally considering deviation from the system and therefore creating
continuous improvement; • a valuable competitive edge as market boundaries extend; • a foundation stone for TQM. IT IS NOT: • industry specific; • designed to standardise quality systems implemented by organisations;
53

• a method of setting standards. Providing that legal requirements and safety standards are met, the producer owns the quality standards;
• a guarantee of 100% superior quality goods: the quality levels will reflect the standards set;
• permanent: monitoring is required to maintain certification status. 4.7.2 What is ISO 14000? A parallel set of standards, the ISO 14000 series assures compliance to environmental quality management and may be relevant to the food safety research questions (http://www.trst.com/iso2a.htm, ). Establishing environmental management systems and ensuring compliance have potential to reduce inputs used by a firm by making better use of resources and by reducing waste and other emissions. Thereby environmental management systems can both reduce internal costs and inefficiencies, and also reduce exposure to legal action and censure by lobbyists for compromising sustainability objectives. Improved firm image and reputation, and more satisfied and productive workers are other potential benefits. ISO 14000 is a group of standards covering Environmental Management Systems (14001,14002, 14004), Environmental Auditing (14010, 14011, 14012), Evaluation of Environmental Performance (14031), Environmental Labeling (14020, 14021, 14022, 14023, 14024, 14025) and Life-Cycle Assessment (14040, 14041,14042, 14043). These standards emerged out of the Earth Summit at Rio de Janeiro, Brazil, 1992, and were conceived to help achieve sustainable development. ISO 14001 is the only standard intended for registration by third parties. All the others are for guidance. It is a process for managing company activities that impact the environment. The underlying purpose of ISO 14001 is that companies will improve their environmental performance by implementing ISO 14001, but there are no objective standards for performance or the level of improvement. That is to say, ISO 14001 is self-certification, a management standard set by a firm itself, against which performance is monitored by an accredited audit organisation. It does not involve judgements of performance against an external standard, or nor does it provide guarantees about product standards. 4.8 Quality assurance, food systems and contractual relationships: a food systems approach Researchers from Wye have been involved in analysing market systems that are primarily rural in origin. These have concerned livelihood and other studies of market systems for inputs and products, domestic staples, other edibles including vegetables and fruit, and other cash crops, in advanced and developing economies (Dorward, Kydd and Poulton, 1998; Poole, 1999; Poole, 2000; Poole et al. 2000a; Poole et al. 2000b). In well-integrated and more populous areas, the boundaries between rural, peri-urban and urban regions are at best indistinct. Similarly the distinction between production and post-harvest stages in the food chain needs to be handled with caution. Regarding the safety of food at the time of consumption, due recognition needs to be given to
54

sources of contamination and critical points from the primary factors of production and inputs, through production and post-harvest handling, transport, storage and processing, wholesaling and retailing to domestic food preparation and consumption. The food chain from the supply of inputs to the point of final consumption is the channel for the physical flows of produce and finance. Marketing economics is concerned principally with the technical and economic efficiency of marketing functions and organisations of the system - which is not the focus of this study. The marketing system is also the mechanism whereby information and incentives are communicated among participants. The economics of institutions is concerned primarily with the efficiency of coordination of the interpersonal and interfirm transactions. Thus, understanding the production and marketing chain and the regulatory environment is a prerequisite for analysing the form and terms of transactions that communicate incentives and information to market participants. 4.8.1 Information problems: the NIE contribution Efficient and effective vertical transmission of information and incentives is an important constituent of the mechanisms for QA. Information and incentives are likely to play a part in QA mechanisms at least as important as policy, especially where the regulatory environment is weak. This insight is particularly relevant to developing countries. Even in advanced food systems, deficiencies in the flow of information through market systems have been found to be a source of market imperfection in matching market intermediaries’ perceptions of quality to consumers’ preferences and demand characteristics (Poole and Baron, 1996; Poole, 1997b). Insights from New Institutional Economics (NIE) have been used to analyse the often interlinked contractual relations between input suppliers, producers and first buyers in agrifood systems in developing countries (Dorward et al. 1996; Dorward et al., 1998; Poole and Del Campo Gomis, 1998). Recently completed work on vegetable markets in three Sub-Saharan African countries (DFID project R7151) focused on informational imperfections as a constraint to market efficiency, and assessed the importance of production, producer and product characteristics on market access (Poole et al., 2000a; Poole et al., 2000b). Contractual relationships and even written contracts - are an important mechanism to address agency problems in food systems (Poole et al. 1998) and these issues are directly relevant to the establishment of QA mechanisms (Compés López and Poole, 1998). Basu envisages that written contracts, or ‘a limited contract-enforcing regime’ may even have a part to play in reducing transaction costs in the agricultural sector in India (1992: 347). Transaction cost economics (TCE) – one of the branches of NIE – has provided a framework to analyse the costs and benefits of food quality standards for a number of researchers. On the one hand, transaction costs are often increased by food safety regulations, product liability law and customer requirements. Institutional innovation to reduce transaction costs such as searching for good suppliers, negotiating specifications, monitoring performance, and enforcing compliance is a likely result. The development and adoption of international, national standards and voluntary, proprietary QA mechanisms such as ISO accreditation is one such response.
55

Incentives for adoption of QA systems are therefore both internal and external to the firm. Bredahl and Holleran (1997) suggest that different QA mechanisms may give rise to the same levels of food safety with different levels of transaction costs. Holleran et al., (1999) argue that it is the cost of carrying out transactions which create the private incentives for adopting voluntary food quality assurance programmes. The balance of costs and benefits of QA mechanisms and the distributional issues have been referred to above. Ziggers’ approach to food safety and industry organisation is similarly new institutionalist (2000). He emphasises the role of management and cooperative inter-firm relationships (or ill-specified ‘partnerships’) in establishing controls mechanisms such as QA systems. Vertical integration is a logical control mechanism. 4.8.2 Identification of hazards A measured policy approach must be predicated on a better understanding of the hazards within UPU horticultural markets. The HACCP procedures provide the starting point for a system-wide multidisciplinary approach to assessing horticultural product quality. The first stage is to identify the sources and nature of industrial contaminants – a task more difficult than apparent in cities whose industries are characterised by a multitude of small firms. 4.8.3 Critical point determination Subsequently, the determination of critical points employs a range of techniques involving scientific testing for contaminants and objective nutritional quality, quantitative surveys of consumer perceptions, and participant observation of technology, handling practices and exposure to hazards. Quantification of hazards and identification of critical points is to be conducted in relation to accepted national and international standards. Table 18. Critical point determination.
Quality and safety
characteristics
Market system stages: field-level production - wholesale handling and
marketing - retail handling and marketing – household-level consumption
Safety and contaminant levels
• Monitoring ambient pollutant levels • Product testing
Other objective & subjective attributes
• Product testing • Quantitative surveys of stakeholders
Technology & handling practices
• Quantitative surveys of stakeholders • Observation and appraisal
(Poole et al., 2000d).
56

4.8.4 Incentive and constraint mechanisms At this point, system-wide analysis involving a multiplicity of stakeholders probably departs from the firm- or plant level HACCP procedure. Moreover, the context, or ‘reality’, of Zimbabwean food markets will temper the appropriateness of specification and monitoring of system-wide criteria and controls (Mooij, 1999). Mechanisms such as large scale testing, correction and verification may be ruled out on the grounds of unfeasibility and high cost that apply to QA systems even in advanced economies. Low levels of health hazard awareness and high rates of poverty mean that effective demand for food safety is probably low. Market failure is likely and public intervention is probably necessary to tackle the social costs. Direct public intervention is likely to be necessary for improving food quality through implementing emission controls in line with national and international standards. These direct macro controls are highlighted below.
CENTRALGOVERNMENT
•international standards•regional (SADC) standards
•scientific capital
LOCALGOVERNMENT
•attenuation/eradication of contaminant sources
•product sampling•trader licensing
POLITICAL LEADERSHIP
PUBLIC AWARENESS
•advocacy•information•incentives & constraints
PRIVATE ENTERPRISE•contracts and supply chain
management -spillover from
export to domestic sector?
MICRO•best practice at level of :
–production–intermediaries
–consumer
MESO•commercial attitudes•market organisation•public participation
MACRO•institutional efficiency
•technological development•scientific capital
MICRO•best practice at level of :
–production–intermediaries
–consumer
MESO•commercial attitudes•market organisation•public participation
MACRO•institutional efficiency
•technological development•scientific capital
controlcontrol
facilitation
information
support
controlinformation
information
controlcontrol
facilitation
information
support
controlinformation
information
Figure 4. Regulatory and incentive framework for UPU horticulture in Zimbabwe Direct intervention, preferably at the state level, is necessary to improve institutional efficiency, technology and infrastructure. Enhancing these elements of the macro environment is likely to lead to better performance at the meso level through an improved framework of incentives and constraints. Direct investment in scientific capital is likely to require central government support. As indicated previously, the role of the state is not limited to direct interventions. Markets that are efficient in respect of incentive (price and quality) signalling require
57

relatively sophisticated vertical and horizontal coordination. However, ‘traditional’ direct interventions in market structure, conduct and performance are inconsistent with the liberalisation agenda and probably would be ineffective. ‘Facilitation’ that is indirect, but targeted at the meso-level is a creative alternative. First, there is an enabling role for the state to facilitate horticultural market re-organization in order to exploit the benefits of market scale, concentration and ease of vertical coordination. Associative organisations involving producers will enable mechanisms such as branding, labelling and self-certification to become feasible. Secondly, creative public intervention can address the awareness issues that are preconditions for effective public participation. Dissemination of knowledge about health hazards and standards through the appropriate public bodies can be allied to support for consumer groups, in the expectation that awareness will lead to the kind of participatory public action referred to above. The challenge of achieving fruitful public sector coordination can only be highlighted here, however: among the constraints affecting healthy city initiatives generally are significant difficulties in implementing an integrated approach, and also securing political backing by local decision-makers (Werna et al. 1998). Improved market organization and vertical coordination in particular are likely to be fundamental to improve the flow of incentives and information. Again, a facilitatory approach by the state administration is indicated. Together with heightened public awareness and public action, this has the potential to provide incentives for institutional innovation to mitigate the transaction costs by improving market organization and adopting best practice technologies throughout the horticultural chain. Finally, consistent information should be provided through the range of different public entities involved in horticultural production and extension, market regulation, food policy initiatives and consumer organisations. The development of consumer power is likely to be one of the most powerful forces for impelling improved standards, and may take two forms. Firstly, awareness creates the possibility of lobbying by informed local and national consumer organisations, and second may serve to empower the decisions of consumers, even those of limited purchasing power.
58
5. References Alexander, F.W. (1974). The uptake of lead by children in differing environments. Environmental Health Perspectives (May): 155-159. Antle, J.M. (1999). Benefits and costs of food safety regulation. Food Policy, 24 (6), 605-623. Basu, K. (1992). Markets, Laws and Governments, pp. 338-355 in. In B. Jalan, (Eds.) The Indian Economy: Problems and Prospects, New Delhi: Penguin. Beattie, A.D., Moore, M.R., Goldberg, A., Finlayson, M.J.W., Graham, J.F., Mackie, E.M., Main, J.C., McLaren, D.A., Murdoch, R.M. and Stewart, G.T. (1975). Role of chronic low level lead exposure in the aetiology of mental retardation. Lancet 1, 589-592. Birley, M.H. and Lock, K. (1999). The Health Impacts of Peri-Urban Natural Resource Development. Liverpool: Liverpool School of Tropical Medicine. Bockett, G., C. Boyd, et al. (1997). Post-Harvest Horticultural Constraints Facing Smallholders: A Needs Assessment Survey in Three Districts of Zimbabwe. Chatham, Natural Resources Institute. .Bogden, J.D., Kemp, F.W., Han, S., Murphy, M., Fraiman, M., Czerniach, D., Flynn, C.J., Banna, M.L., Scimone, A., Castrovilly, L. and Gertner, S.B. (1995). Dietary calcium and lead interact to modify maternal blood pressure, erythropoiesis, and fetal and neonatal growth in rats during pregnancy and lactation. Journal of Nutrition, 125 (4), 990-1002. Bredahl, M.E. and Holleran, E. (1997). Food safety, transaction costs and institutional innovation, pp. 51-67 in. In G. Schiefer and R. Helbig, (Eds.) Quality Management and Process Improvement for Competitive Advantage in Agriculture and Food, Bonn: University of Bonn. Bryan, F.L. (1992). Hazard Analysis Critical Control Point Evaluations: A guide to identifying hazards and assessing risks associated with food preparation and storage. Geneva: World Health Organization. Bryce-Smith, D., Deshpande, R.R., Hughes, J. and Waldron, H.A. (1977). Lead and cadmium levels in stillbirths. Lancet, 77 (May), 1159. Bunte, F.H.J. (2000). The vertical organization of food chains and health and safety efforts, ch. 17, pp. 285-300. In L. Unnevehr, (Eds.) The Economics of HACCP: Costs and Benefits, St. Paul, Minnesota: Eagan Press. Bwititi, T., Chikuni, O., Loewenson, R., Murambiwa, W., Nhachi, C.F.B. & Nyazema, N.Z. (1987). health hazards in organophosphate use among farm workers in the large-scale farming sector. Central Africa Journal of Medicine 33, 120-126.
59

Caswell, J.A. (1998). Valuing the benefits and costs of improved food safety and nutrition. Australian Journal of Agricultural and Resource Economics, 42 (4), 409-424. Caswell, J.A. and Hooker, N.H. (1996). HACCP as an international trade standard. American Journal of Agricultural Economics`, 78 (August), 775-779. Chikuni, O. and Nhachi, C.F.B. (1996). Residues of organochlorine pesticides in human milk. In; Pesticides in Zimbabwe: Toxicity and Health Implications. (Nhachi, C.F.B. & Kasilo, O.M.J. Eds.), pp. 73-80. University of Zimbabwe, Harare. Chitemerere, R. C. (1996). Pesticides and occupational safety and health in Zimbabwe. In; Pesticides in Zimbabwe: Toxicity and Health Implications. (Nhachi, C.F.B. & Kasilo, O.M.J. Eds.) pp. 17-24. University of Zimbabwe, Harare. Chollet, S. (1997). The Market Issue for Small-Scale Farmers. Harare, Agritex / HTP. Clarkson, T.W. (1983). Methylmercury toxicity to the mature and developing nervous system: possible mechanisms, pp. 183-197. In B. Sakar, (Eds.) Biological Aspects of Metals and Metal-related Diseases, New York: Raven Press. Codex Alimentarius Commission (1999). http://www.fao.org/es*/esn/codex. Collins, E.J.T. (1993). Food adulteration and food safety in Britain in the 19th and early 20th centuries. Food Policy, 18 (2), 95-109. Compés López, R. and Poole, N.D. (1998). Quality assurance in the maritime port logistics chain: the case of Valencia. Supply Chain Management: An International Journal, 3 (1), 33-44. City of Harare (1992). Sewage installations: pollution control and farming operations. pp. 1-10. Cuadrado, C., Kumpulainen, J. and Moreiras, O. (1995). Lead, cadmium and mercury contents in average Spanish market basket diets from Galicia, Valencia, Andalucía and Madrid. Food Additives and Contaminants, 12 (1), 107-118. Darby, M.R. and Karni, E. (1973). Free competition and the optimal amount of fraud. Journal of Law and Economics, 16: 67-88. Dorward, A., Kydd, J. and Poulton, C. (1996). New Institutional Economics and the provision of agricultural services in Sub-Saharan Africa. Journal of Agricultural Economics and Development, 1, 57-67. Dorward, A., Kydd, J. and Poulton, C. Eds. (1998). Smallholder Cash Crop Production Under Market Liberalisation: A New Institutional Economics Perspective. Wallingford, Oxon: CAB International.
60

Dowdy, R. H., Latterell, J.J., Hinsely, T.T., Grossman, R.B. & Sullivan, D.L. (1991). Trace metal movement in an Aeric Ochraqualf following 14 years of annual sludge applications. Journal of Environmental Quality 20, 119-123. Drakakis-Smith, D. and D. Tevera (1993). Informal Food Retailing in Harare: Preliminary Report. Gothenburg, Gothenburg University: 31. Drèze, J. and Sen, A. (1995). India: Economic Development and Social Opportunity. New Delhi: Oxford University Press. Ellenhorn, M. J. & Barceloux, D.G.B. (1988). Pesticide. Medical Toxicology. Diagnosis and Treatment of Human Poisoning. Elsevier Science, New York. FAO (1988). Annual Report on Pesticide Use and Safety. FAO, Rome. Erickson, M.M., Poklis, A., Dickinson, A.W. and Hillman, L.S. (1983). Tissue mineral levels in victims of sudden infant death syndrome. 1. Toxic metals - lead and cadmium. Pediatric Research, 17, 779-784. Fearne, A. and García, M. (1999). The Assured Combinable Crop Scheme in England and Wales: carrot or stick? Farm Management, 10 (5), 243-261. Fergusson, J.E. (1990). The Heavy Elements: Chemistry, Environmental Impact and Health Effects. Oxford: Pergamon Press. Financial Times (2000). US challenges Europe's food safety stance, 31 March, p. 10. Food and Agriculture Organisation (2000). http://www.fao.org/es/esn/codex/reports.htm. Golan, E.H., Ralston, K.L., Frenzen, P.D. and Vogel, S.J. (2000). The costs, benefits and distributional consequences of improvements in food safety: the case of HACCP, ch. 10, pp. 149-16. In L. Unnevehr, (Eds.) The Economics of HACCP: Costs and Benefits, St. Paul, Minnesota: Eagan Press. Gopo, J. M., Musara, T., Mupfumira, M. & Sabeta, C.T. (1991). Use of a Salmonella specific DNA probe in rapid, routine detection of salmonella spp in drinking water in Zimbabwe. Discovery and Innovation 3, 61-66. Gopo, J. M. C., N. (1995). Salmonella contamination of recycled effluent of treated sewage and urban waste water. Water SA 21, 245-250. Gordon, A. (1997). Strenghtening Research Linkages with Agricultural Markets in Sub-Saharan Africa: Zimbabwe Case Study, ISNAR. Government of Zimbabwe (1985). Hazardous Substances and Articles (Protective Clothing: Pesticides). Regulations. Government Printers, Harare.
61

Government of Zimbabwe. (1977). Water (Effluent and Waste Water Standards) Regulations; 1977; revised 1985. Harriss-White, B. (1995). The changing public role in services to food and agriculture: the legal regulation of food markets in India. Food Policy, 20 (6), 585-596. Henson, S. and Caswell, J. (1999). Food safety regulation: an overview of contemporary issues. Food Policy, 24 (6), 589-603. Hernandez, T., Moreno, J.I., Costa, F. (1991). Influence of sewage sludge application on crop yields and heavy metal availability. Soil Science and Plant Nutrition 37, 201-210. Hilmer, C.E., Thurman, W.N. and Morales, R.A. (2000). The distributional effects of food safety regulation in the egg industry, ch. 9, pp.133-148. In L. Unnevehr, (Eds.) The Economics of HACCP: Costs and Benefits, St. Paul, Minnesota: Eagan Press. Holleran, E., Bredahl, M.E. and Zaibet, L. (1999). Private incentives for adopting food safety and quality assurance. Food Policy, 24 (6), 669-683. Hooker, N.H. and Caswell, J.A. (1996). Trends in food quality regulation: implications for processed food trade and foreign direct investment. Agribusiness, 12 (5), 411-419. http://www.trst.com/iso2a.htm Environmental management and ISO 14000 Jackson, J., A. Turner, et al., Eds. (1997). Smallholder Horticulture in Zimbabwe. Harare. University of Zimbabwe Publications. Jackson, J. E. (1997). Vegetable crop production in communal areas in Mashonaland East and Mashonaland West: Results of a survey in 1988. In; Smallholder Horticulture in Zimbabwe (J. E. Jackson, Turner, A.D. & Matanda, M.L., ed.), pp. 3-9. University of Zimbabwe, Harare. Jaure, A. (1997). Marketing systems for smallholders: A comparison of assembly markets in areas of production with farmer marketing at Mbare Musika in Harare. In; Smallholder Horticulture in Zimbabwe (J. E. Jackson, Turner, A.D. & Matanda, M.L., ed.). University of Zimbabwe, Harare. Jerayathnam, J. (1986). Acute poisonings caused by chemicals. In Proceedings of the International Symposium on Health and Environment in Developing Countries. Haikkor, Finland. Kanja, l., Skaare, J.U., Nafstad, J., Maitai, C. & Lokken, P. (1986). Organochlorine pesticides in human milk from different areas of Kenya. Journal of Toxicology and Environmental Health 19, 449-461.
62

Kasilo, O. M. J., Hobane, T. & Nhachi, C.F.B. (1991). Organophosphate poisoning in urban Zimbabwe. Journal of Applied Toxicology 11, 269-273. Kubus, M. B., H. (1991). Pesticides in Lake Kariba. A report prepared for the Department of Systems Ecology, University of Stockholm 5-10691, Stockholm, Sweden. Loewenson, R. N., C.F.B. (1996). Epidemiology of the health impact of pesticide use in Zimbabwe. In; Pesticides in Zimbabwe: Toxicity and Health Implications. (Nhachi, C.F.B. & Kasilo, O.M.J. Eds), pp. 25-37. University of Zimbabwe, Harare. Mabaya, E. (1998). Smallholder Horticultural Markets in Zimbabwe: Market Organization and Price Movements. Faculty of the Graduate School. Ithaca, Cornell: 130. Mangwayana, E. S. (1995). Heavy metals pollution from sewage sludge and effluent of soil and grasses at Crowborough farm. BSc thesis, University of Zimbabwe. Maruyama, A., Kurihara, S. and Matsuda, T. (2000). The 1996 E.coli 0157 outbreak and the introduction of HACCP in Japan, ch. 19, pp. 315-334. In L. Unnevehr, (Eds.) The Economics of HACCP: Costs and Benefits, St. Paul, Minnesota: Eagan Press. Matchaba, R. B. Z. (1996). Organophosphate exposure in pesticide manufacturing factories in Zimbabwe. In; Pesticides in Zimbabwe: Toxicity and Health Implications. (Nhachi, C.F.B. & Kasilo, O.M.J. Eds), pp. 50-62. University of Zimbabwe, Harare. Mathuthu, A. S., Zaranyika, M.F. & Jonnalagadda, S.B. (1993). Monitoring of water quality in Upper Mukivisi River in Harare, Zimbabwe. Environment International 19, 51-61. Mathuthu, A. S., Zaranyika, M.F., Tafirenyika, S. & Chibanda, B. (1995). Impact assessment of sewage effluent discharges on the quality of the receiving lower Mukivisi River waters in Harare, Zimbabwe. Journal of Environmental Science and Health A30, 281-297. Mathuthu, A. S., Mwanga, K. & Simoro, A. (1997). Impact assessment of industrial and sewage effluents on water quality of the receiving Marimba River in Harare. In; Lake Chivero: A polluted Lake (N.A.G. Moyo, ed.). University of Zimbabwe, Harare. Mathuthu, A. S., Mutetwa, B. & Zaranyika, M.F. (1998). An assessment of pasture irrigation as a method of sewage treatment - efficiency of Crowborough pastures in Harare in sewage tretament: A case study. Journal of Environmental Science and Health A33, 1781-1801. McGrath, S. P. L., P.W. (1989). An explanation for the apparent losses of metals in long-term field experiment with sewage sludge. Environmental Pollution 60, 235-256.
63
Mooij, J. (1999). Food Policy and the Indian State: The Public Distribution System in South India. New Delhi: Oxford University Press. Mortlock, M.P., Peters, A.C. and Griffith, C.J. (2000). Applying HACCP to small retailers, ch. 18, pp. 301-314. In L. Unnevehr, (Eds.) The Economics of HACCP: Costs and Benefits, St. Paul, Minnesota: Eagan Press. Motarjemi, Y., Käferstein, G., Moy, G., Miyagawa, S. and Miyagishima, K. (1996). Importance of HACCP for public health and development: the role of the World Health Organization. Food Control, 7 (2), 77-85. Moyo, N. A. G. W., K. (1997). the effects of organic pollution on the Mukivisi River, Harare, Zimbabwe. In; Lake Chivero: A polluted lake (N.A.G. Moyo, ed.), pp. 53-63. University of Zimbabwe, Harare. Muchena, P. (1996). Legislation and registration of pesticides used for plant protection in Zimbabwe. In; Pesticides in Zimbabwe: Toxicity and Health Implications. (Nhachi, C.F.B. & Kasilo, O.M.J. Eds), pp. 1-11. University of Zimbabwe, Harare. Murphy, A. (1996). Fruit and Vegetable Drying in Zimbabwe. Cork / Harare, University College / Ranche House College. Mushak, P., Davis, J.M., Crocetti, A.F. and Grant, L.D. (1989). Prenatal and postnatal effects of low-level lead exposure: integrated summary of a report to the US Congress on childhood lead poisoning. Environmental Research, 50, 11-36. Needleman, H.L. (1983). The behavioural consequences of low level exposure to lead, pp. 219-224. In B. Sakar, (Eds.) Biological Aspects of Metals and Metal-Related Diseases, New York: Raven Press. Nelson, P. (1970). Information and consumer behaviour. Journal of Political Economy, 78, 311-329. Nriagu, J.O. (1992). Toxic metal pollution in Africa. Science of the Total Environment, 121, 1-37. Nyamangara, J. M., J. (1999). The effect of long-term sewage sludge application on Zn, Cu, Ni and Pb levels in a clay loam soil under pasture grass in Zimbabwe. Agriculture, Ecosystems and Environment 73, 199-204. Oriss, G.D. (1999). Equivalence of food quality assurance systems. Food Control, 10, 255-260. Pitkin, R.M. (1992). Calcium metabolism in the pregnant and lactating female, pp. 27-37. In R.C. Tsang and F. Mimouni, (Eds.) Calcium Nutrition for Mothers and Children, New York: Raven Press.
64

Poole, N.D. (1997a). Change in the European food industry: a research agenda for marketing economists. Journal of International Food and Agribusiness Marketing, 9 (1), 1-17. Poole, N.D. (1997b). Conocimiento y cualidades de los frutos cítricos en el mercado británico. Investigación Agraria: Economía, 12 (1, 2 & 3), 89-101. Poole, N.D. (1999). Vertical Coordination in the Spanish Citrus Industry. Unpublished PhD thesis, Wye College, University of London. Poole, N.D. (2000). Production and marketing strategies of Spanish citrus farmers. Journal of Agricultural Economics, 51 (2), 210-223. Poole, N.D. and Baron, L. (1996). Consumer awareness of citrus fruit attributes. British Food Journal, 98 (1), 23-28. Poole, N.D. and Del Campo Gomis, F.J. (1998). Uncertainty in the Spanish Citrus Industry. In G.W. Ziggers, J.H. Trienekens and P.J.P. Zuurbier, (Eds.), Proceedings of the Third International Conference on Chain Management in Agribusiness and the Food Industry, (pp. 199-209). Conference held at Ede, Netherlands, 28-29 May. Department of Management Studies, Wageningen Agricultural University, Netherlands. Poole, N.D., Del Campo Gomis, F.J., Juliá Igual, J.F. and Vidal Giménez, F. (1998). Formal contracts in fresh produce markets. Food Policy, 23 (2), 131-142. Poole, N.D., Kydd, J., Loader, R., Lynch, K., Poulton, C. and Wilkin, K. (2000a). Literature Review - Overcoming informational constraints: improving horticultural marketing and technical information flows to smallholders. DFID Crop Post-Harvest Programme Project R7151. Wye, Kent, Wye College: 96 pp. Poole, N.D., Kydd, J., Lynch, K. and Poulton, C. (2000b). Summary Report - Overcoming informational constraints: improving horticultural marketing and technical information flows to smallholders. DFID Crop Post-Harvest Programme Project R7151. Wye, Kent, Wye College: 39 pp. Poole, N.D., Lintelo te, D. and Marshall, F. (2000c). Quality assurance mechanisms for air pollution impacts on vegetable systems in India. Health for the Millions, 26 (4), 36-39. Poole, N.D., Marshall, F. and Lintelo te, D. (2000d). Quality and safety of vegetables in India. Gate. Lemmens Verlag- & Mediengesellschaft mbH. Bonn., 4/2000, 14-17. Poulton, C., L. Mukwereza, et al. (1999). Overcoming Informational Constraints: Improving Horticultural Marketing and Technical Information Flows to Smallholders - Zimbabwe Case Study Report, Wye College. Resende, R.V. (1993). Brazil: a case study. Food Policy, 18 (2), 120-130.
65

Sena, M. (1997). Horticultural marketing in Zimbabwe: Problems met by smallholders and experience of the Mashonaland East fruit and vegetable project in addressing these. In; Smallholder Horticulture in Zimbabwe (J. E. Jackson, Turner, A.D. & Matanda, M.L., ed.), pp. 65-77. University of Zimbabwe, Harare. Silbergeld, E.K. (1991). Lead in bone: implications for toxicology during pregnancy and lactation. Environmental Health Perspectives, 91, 63-70. Sithole, S. D., Moyo, N. & Macheka, M. (1993). An assessment of lead pollution from vehicle emisisons along selected roadways in Harare (Zimbabwe). International Journal of Environmental Analytical Chemistry 53, 1-12. Staneva, E. M. (1997). Pollution from industrial effluents. In; Lake Chivero: A polluted lake (N.A.G. Moyo, Ed.). University of Zimbabwe, Harare. Thornton, J.A. & Nduku, W.K. (1982). Water chemistry and nutrient budgets. In; Lake McIlwaine (J.A. Thornton, Ed.), pp. 11-23. W. Junk Publishers, The Hague. Stringer, M.F. (1994). Safety and quality management through HACCP and ISO 9000. Dairy, Food and Environmental Sanitation, 14 (8), 478-481. Swinbank, A. (1993). The economics of food safety. Food Policy, 18 (2), 83-93. Thatcher, R.W., Lester, M.L., McAlaster, R. and Horst, R. (1982). Effects of low levels of cadmium and lead on cognitive functioning in children. Archives of Environmental Health, 37, 159-166. Turner, A. and O. Chivinge (1999). Production and Marketing of Horticultural Crops in Zimbabwe: A Survey of Smallholder Farmers in the Mashonaland East Province. Ithaca, Cornell International Institute for Food, Agriculture and Development: 52. United Nations Environment Programme (1999). Global Environmental Outlook. London: Earthscan. Unnevehr, L. Ed. (2000). The Economics of HACCP: Costs and Benefits. St Paul, Minnesota: Eagan Press. Unnevehr, L. and Jensen, H.H. (1999). The economic implications of using HACCP as a food safety regulatory standard. Food Policy, 24 (6), 625-635. van Santen, A. (1996). Zimbabwe Urban Vegetable Marketing. Harare, Floto Consult / MEFVP. van Santen, A. (1997). Field Production Survey for the Mashonaland East Fruit and Vegetable Project. Harare, Floto Consult / MEFVP: 20. Varzakas, T. and Jukes, D. (1997). Globalisation of food quality standards. Food Policy, 22 (6), 501-514.
66

VeCoZimbabwe (1999). Horticultural Marketing Workshop. Harare, VeCo Zimbabwe: 55 Werna, E., Harpham, T., Blue, I. and Goldstein, G. (1998). Healthy Cities Projects in Developing Countries. London: Earthscan. WHO (1989). Public health impact of pesticides used in agriculture. Geneva. WHO (1989b). Management and control of the Environment. World Bank (1998). Knowledge for Development. World Development Report 1998/99. New York: Oxford University Press. Wormworth, J. (1995). Toxins and tradition: the impact of food-chain contamination on the Inuit of Northern Quebec. Canadian Medical Association Journal, 152 (8), 1237-1240. Zaranyika, M. F., Mtetwa, L., Zvomuya, S., Gongora, G. & Mathuthu, A.S. (1993). the effect of industrial effluent and leachate from landfills on the levels of selected trace heavy metals in the waters of Upper and Middle Mukivisi River in Harare, Zimbabwe. Bull. Chem. Soc. Ethiop. 7, 1-10. Zaranyika, M. F. (1997). Sources and levels of pollution along Mukivisi River: A review. In, Lake Chivero: A polluted lake (N.A.G. Moyo, Ed.), pp. 35-42. University of Zimbabwe, Harare. Zaranyika, M. F. M., J.M. (1996). Organochlorine pesticide residues in in land waters in Zimbabwe. In; Pesticides in Zimbabwe: Toxicity and Health Implications. (Nhachi, C.F.B. & Kasilo, O.M.J. Eds.), pp. 89-106. University of Zimbabwe, Harare. Ziegler, E.E., Edwards, B.B., Jameson, R.L., Mahaffey, K.R. and Foman, S.J. (1978). Absorption and retention of lead by infants. Pediatric Research, 12, 29-34. Ziggers, G.W. (2000). HACCP, vertical coordination and competitiveness in the food industry, ch. 16, pp. 269-284. In L. Unnevehr, (Eds.) The Economics of HACCP: Costs and Benefits, St. Paul, Minnesota: Eagan Press.
67

68
Appendix 1 Interview guide for investigating the food safety policy environment, Zimbabwe
Initiate discussion by introducing the topic of increasing worldwide concerns about food safety.
• Cite relevant cases where consumer health has probably been impaired • explain the economic losses that arise from negative impacts on demand • explain the potential industry and economy-wide benefits from safer food:
increased demand, enhanced consumer satisfaction… • explore interviewees own concerns
Explain that the research is • to investigate possible contamination of the urban vegetable supply through
pesticide use and abuse, and through the presence of soil-borne contaminants;
• about developing mechanisms to improve the safety of vegetables; • to apply to other countries the lessons learned in Zimbabwe. • What level of public concern about food safety do they perceive in different strata
of Zimbabwe society (nil, moderate, high? • are purchasing decisions of different socioeconomic groups affected by food
safety concerns (not at all, somewhat, very)? • are some locations/retailers/distribution systems preferred to others for reasons of
perceived food safety? list all the governmental and non-governmental organisations involved in food safety issues (Government Ministries, producer organisations, trade organisations, consumer organisations…)
• list the laws, regulations and enforcement mechanisms applying to the production and distribution of safe food (agricultural policy, marketing policy)?
• what mechanisms does each organisation employ (regulation, advice, information…)?
• how effective is each perceived to be (not at all, somewhat, very)?