pollen-based biome reconstructions for latin america at 0 ... · 15instituto de geociencias-dpe,...
TRANSCRIPT

Clim. Past, 5, 725–767, 2009www.clim-past.net/5/725/2009/© Author(s) 2009. This work is distributed underthe Creative Commons Attribution 3.0 License.
Climateof the Past
Pollen-based biome reconstructions for Latin America at 0, 6000and 18 000 radiocarbon years ago
R. Marchant1, A. Cleef2, S. P. Harrison3, H. Hooghiemstra2, V. Markgraf 4, J. van Boxel2, T. Ager5, L. Almeida6,R. Anderson7, C. Baied8, H. Behling9, J. C. Berrio10, R. Burbridge10, S. Bjorck11, R. Byrne12, M. Bush13,J. Duivenvoorden2, J. Flenley14, P. De Oliveira15, B. van Geel2, K. Graf 16, W. D. Gosling17, S. Harbele18,T. van der Hammen19, B. Hansen20, S. Horn21, P. Kuhry22, M.-P. Ledru23, F. Mayle24, B. Leyden25,S. Lozano-Garcıa26, A. M. Melief 27, P. Moreno28, N. T. Moar29, A. Prieto30, G. van Reenen2, M. Salgado-Labouriau31,F. Schabitz32, E. J. Schreve-Brinkman33, and M. Wille34
1The York Institute for Tropical Ecosystem Dynamics (KITE), Environment Department, University of York, York,Heslington, YO10 5DD, UK2Institute for Biodiversity and Ecosystem Dynamics (IBED), Faculty of Science, University of Amsterdam, Postbus 94062,1090 GB Amsterdam, The Netherlands3Bristol Research Initiative for the Dynamic Global Environment (BRIDGE), School of Geographical Sciences, UniversityRoad, University of Bristol, Bristol BS8 1SS, UK4INSTAAR, University of Colorado, Boulder, CO 80309, USA5USGS, National Centre, MS 970, Reston, VA 22092, USA6Laboratorio Biogeografıa, Facultad de Ciencias, Universidad Nacional Autonoma de Mexico, Aptdo Postal 70-296, 04510Mexico D.F., Mexico7Department of Geography, University of Montana, Missoula, Montana 59812-1018, USA8Environmental Studies Program, University of Montana, Missoula Montana 59812, USA9Georg-August-Universitat, Albrecht-von-Haller-Institut fur Pflanzenwissenschaften, Abteilung Palynologie undKlimadynamik, Untere Karspule 2, 37073 Gottingen, Germany10Department of Geography, University Road, University of Leicester, LE1 7RH, UK11Geological Institute, University of Copenhagen, Øster Volgade 10, 1350 Copenhagen, Denmark12Department of Geography, University of California, Berkeley, California 94720-4740, USA13Dept. of Biological Sciences, Florida Institute of Technology, 150 W. University Boulevard, Melbourne, FL 32905, USA14Department of Geography, Massey University, Palmerston, New Zealand15Instituto de Geociencias-DPE, Universidade de Sao Paulo, Caixa Postal 11348, Sao Paulo, SP 05422-970, Brazil16Geographisches Institut der Universitat, Winterthurerstraße 190, 8057 Zurich, Switzerland17Dept. of Earth and Environmental Sciences, CEPSA, The Open University, Walton Hall, Milton Keynes, MK7 6AA, UK18Department of Archaeology and Natural History, College of Asia and the Pacific, Australian National University, Canberra,ACT 0200, Australia19Fundacion Tropenbos Colombia, Carrera 21 # 39-35, Santafe de Bogota, Colombia20Limnological Research Centre, University of Minnesota, 220 Pillsbury Hall, 310 Pillsbury Drive, Minneapolis, MN55455-0219, USA21Arctic Centre, University of Lapland, PL 122, 96101 Rovaniemi, Finland22Department of Geography, University of Tennessee, 408 G&G Building, Knoxville, TN 37996-1420, USA23Equipe Paleoenvironements, Institut des Sciences de l’Evolution Institut de Recherche pour le Developement, Montpellier,France24Geography Building, Drummond Street, Edinburgh, EH8 9XP, UK25Department of Geology, University of South Florida, 4202 East Fowler Avenue, SCA 203, Tampa, FL 33620-5200, USA26Universidad Nacional Autonoma de Mexico, Instituto de Geologıa, Aptdo Postal 70-296, 04510 Mexico D.F., Mexico272E Oosterparkstraat 163A, 1092 BE Amsterdam, The Netherlands28Facultad de Ciencias, Universidad de Chile, Casilla 653, Santiago, Chile29Botany Division, D.S.I.R., Private Bag, Christchurch, New Zealand30Laboratorio de Palinologia, National Universidad Mar del Plata, Dept. de Biologia, Funes 3250, 7600 Mar del Plata,Argentina31Inst. de Geociencias, Fundacao Universidade do Brazilia, Campus Universitario, Asa Norte, 0910-900, DF Brazilia, Brazil
Published by Copernicus Publications on behalf of the European Geosciences Union.

726 R. Marchant et al.: Pollen-based biome reconstructions for Latin America
32Geographisches Institut, Universitat Bamberg, Am Kranen 1, 96045 Bamberg, Germany33Welbergsweg 8, 7495 SZ Delden, The Netherlands34Geographisches Institut, Universitat Essen, Essen, Germany
Received: 13 October 2008 – Published in Clim. Past Discuss.: 10 February 2009Revised: 7 August 2009 – Accepted: 29 September 2009 – Published: 1 December 2009
Abstract. The biomisation method is used to reconstructLatin American vegetation at 6000±500 and 18 000±1000radiocarbon years before present (14C yr BP) from pollendata. Tests using modern pollen data from 381 samples de-rived from 287 locations broadly reproduce potential naturalvegetation. The strong temperature gradient associated withthe Andes is recorded by a transition from high altitude coolgrass/shrubland and cool mixed forest to mid-altitude cooltemperate rain forest, to tropical dry, seasonal and rain for-est at low altitudes. Reconstructed biomes from a numberof sites do not match the potential vegetation due to localfactors such as human impact, methodological artefacts andmechanisms of pollen representivity of the parent vegetation.
At 6000±500 14C yr BP 255 samples are analysedfrom 127 sites. Differences between the modern andthe 6000±500 14C yr BP reconstruction are comparativelysmall; change relative to the modern reconstruction aremainly to biomes characteristic of drier climate in the northof the region with a slight more mesic shift in the south. Cooltemperate rain forest remains dominant in western SouthAmerica. In northwestern South America a number of sitesrecord transitions from tropical seasonal forest to tropical dryforest and tropical rain forest to tropical seasonal forest. Sitesin Central America show a change in biome assignment, butto more mesic vegetation, indicative of greater plant availablemoisture, e.g. on the Yucatan peninsula sites record warm ev-ergreen forest, replacing tropical dry forest and warm mixedforest presently recorded.
At 18 000±1000 14C yr BP 61 samples from 34 sitesrecord vegetation reflecting a generally cool and dry environ-ment. Cool grass/shrubland is prevalent in southeast Brazilwhereas Amazonian sites record tropical dry forest, warmtemperate rain forest and tropical seasonal forest. Southern-most South America is dominated by cool grass/shrubland,a single site retains cool temperate rain forest indicating thatforest was present at some locations at the LGM. Some sitesin Central Mexico and lowland Colombia remain unchangedin the biome assignments of warm mixed forest and tropicaldry forest respectively, although the affinities that these siteshave to different biomes do change between 18 000±1000
Correspondence to:R. Marchant([email protected])
14C yr BP and present. The “unresponsive” nature of thesesites results from their location and the impact of localedaphic influence.
1 Introduction
Biomisation is an objective method to reconstruct broad veg-etation types based on the assignment of pollen taxa toone or more plant functional types (PFTs) (Prentice et al.,1996a). The method is based on the assumption that a pollenspectrum will have different degrees of affinity to differentbiomes that can be quantified by a simple algorithm. Biomereconstructions from pollen data at 6000±50014C yr BP andthe last glacial maximum (LGM) at 18 000±100014C yr BPhave been produced for most regions of the world under theauspices of the BIOME 6000 project (Prentice et al., 1998,2000). The validity of the method in reconstructing biomesat different time intervals has been demonstrated for Africa(Jolly et al., 1998a; Elenga et al., 2000), Australia (Pickettet al., 2004) Beringia (Bigelow et al., 2003; Edwards et al.,2000), China (Yu et al., 1998, 2001), Eastern North Amer-ica (Williams et al., 2000), Eurasia (Tarasov et al., 1998a),Europe (Prentice et al., 1996a, b; Tarasov et al., 1998a, b;Elenga et al., 2000), Japan (Takahara et al., 2001) and West-ern North America (Thompson and Anderson, 2000). Re-sults from Latin America, presented here, represent the lastgeographically large area to undergo this process. WithinLatin America the biomisation method has been previouslyapplied to Colombian and Mexican pollen data at a rangeof spatial and temporal scales; from the middle Holocene(Marchant et al., 2001a; Ortega-Rosas et al., 2008a, b), theLGM (Marchant et al., 2002a), to investigate modern-pollenvegetation relationships (Marchant et al., 2001b), impact ofhuman societies on vegetation (Marchant et al., 2004a) andas a basis for comparisons with output from a vegetationmodel run under different climatic and environmental sce-narios (Marchant et al., 2004b, 2006). In addition to thesespatial investigations, the method has been applied down-core down to a 450 000 year pollen record from the highplain of Bogota (Marchant et al., 2002b). As Colombia isbiogeographically complex, encompasses high altitude, tem-perate and tropical floras reflecting a range of environmentalspace including transitions from hyper-humid to semi-aridclimates, these analyses provided a suitable test-bed for thewider geographical focus presented here.
Clim. Past, 5, 725–767, 2009 www.clim-past.net/5/725/2009/

R. Marchant et al.: Pollen-based biome reconstructions for Latin America 727
In addition to reconstructing vegetation patterns, and in-vestigating factors that can explain observed changes, data onpast biomes contributes to testing of climate and vegetationmodels (Prentice et al., 1992; Haxeltine and Prentice, 1996;Peng et al., 1998; Marchant et al., 2006; Braconnot et al.,2007). Vegetation models can be used to portray output fromGlobal Circulation Models (GCMs) as maps of potential veg-etation (Claussen and Esh, 1994; Foley et al., 1996; Prenticeet al., 1996b; Williams et al., 1998) that can be used in the de-velopment of models that couple biosphere, atmosphere andoceanic components (Braconnot et al., 2007; Claussen, 1994;Harrison et al., 2003; Texier et al., 1997) and testing of bio-geochemical dynamics (Peng et al., 1998). There has beengrowing interest has focused how atmosphere-biosphere in-teractions have operated under the changing environmentalconditions since the LGM, particularly in trying to under-stand the response of ecosystems to different types of envi-ronmental forcing (Jolly and Haxeltine, 1997). Transformedpollen data can further be used in conjunction with other datatypes, such as on lake status (Jolly et al., 1998b) and archae-ological evidence (Piperno et al., 1990, 1991a, b), to betterunderstand the causal factors driving vegetation change overthe recent geological past.
1.1 Latin American region
Latin America comprises the area from 35◦ N to 65◦ S,and from 35◦ W to 120◦ W extending from Mexico to is-lands off southernmost South America from Eastern Brazilto the Galapagos Islands. Latin America is characterisedby strong environmental gradients associated with 100◦ oflatitude, approximately 7000 m of altitude and the transi-tion from oceanic- to continentally-dominated climate sys-tems (Fig. 1). Despite this great extent there has been per-manent contact between the tropical and temperate domainsthroughout geological time. Physiographically, Latin Amer-ica is characterised by stable cratons associated with the inte-rior and areas of active mountain building, particularly asso-ciated with the Andes. This environmental variability is re-flected by an incredibly diverse biogeography, ranging fromthe highly diverse rain forest of the Choco Pacific (Colom-bia) to the cold deserts of the high Andes, from the hot semi-desert areas of Mexico to the cold moorlands of Tierra delFuego (Fig. 2). Descending an altitudinal gradient there is atransition from paramo (cool grass/shrubland ) to high An-dean forests (cool mixed and cool temperate rain forests) andlower Andean forest (warm evergreen forest) (Fig. 3). Com-plicating this potential vegetation distribution is the factor ofhuman impact with the majority of the vegetation in LatinAmerica being impacted on by the vegetation (Ellis and Ra-mankutty, 2008). The timing of early human settlement inLatin America is a contentious subject, although it seemsfrom the early Holocene there was considerable cultural di-versity and adaptation to a series of different environments(Gnecco, 1999). Human-induced impact has had a direct in-
ITCZ position July ITCZ position January
Prevailing wind direction
110 90 70 50
20
40
20
0
Figure 1. Map of Latin America depicting the present-day summer and winter position of the ITCZ and the macro-scale wind (and hence moisture) patterns over Latin America.
Fig. 1. Map of Latin America depicting the present-day summer andwinter position of the ITCZ and the macro-scale wind (and hencemoisture) patterns over Latin America.
fluence on vegetation composition and distribution throughland-use practices and the introduction of alien taxa and cul-tivars to the Latin American flora. For example, in excessof 100 plants were under cultivation prior to the Europeanconquests in the 15th century (Piperno et al., 2000).
1.2 Latin America climate
Cerverny (1998), Eidt (1968) and Metcalfe et al. (2000) havereviewed Latin American climate. Given the broad geo-graphical scope, Latin America is characterised by a vari-ety of climates that relates to its global position, shape ofthe landmass, location and height of the Andes, offshore cur-rents, general hemisphere air flow and proximity of large wa-ter bodies (Fig. 1). Four dominant circulation regimes influ-ence Latin America: the Inter-Tropical Convergence Zone(ITCZ), the prevailing westerlies, the semi-permanent highpressure cells located over the South Pacific and South At-lantic Oceans and the trade winds. Perhaps most domi-nant is the annual oscillation of the meteorological equator(ITCZ), this migrating some 10–15◦ latitude about the equa-tor (Fig. 1). The ITCZ reaches its northernmost location inJune, this bringing high rainfall for northern South Amer-ica and the Caribbean, with January and February record-ing the dry season (Cerveny, 1998). However, due to theinfluence of the westerlies from the Pacific, and the sharplyrising topography of the Andes, the ITCZ has a sinusoidal
www.clim-past.net/5/725/2009/ Clim. Past, 5, 725–767, 2009
728 R. Marchant et al.: Pollen-based biome reconstructions for Latin America
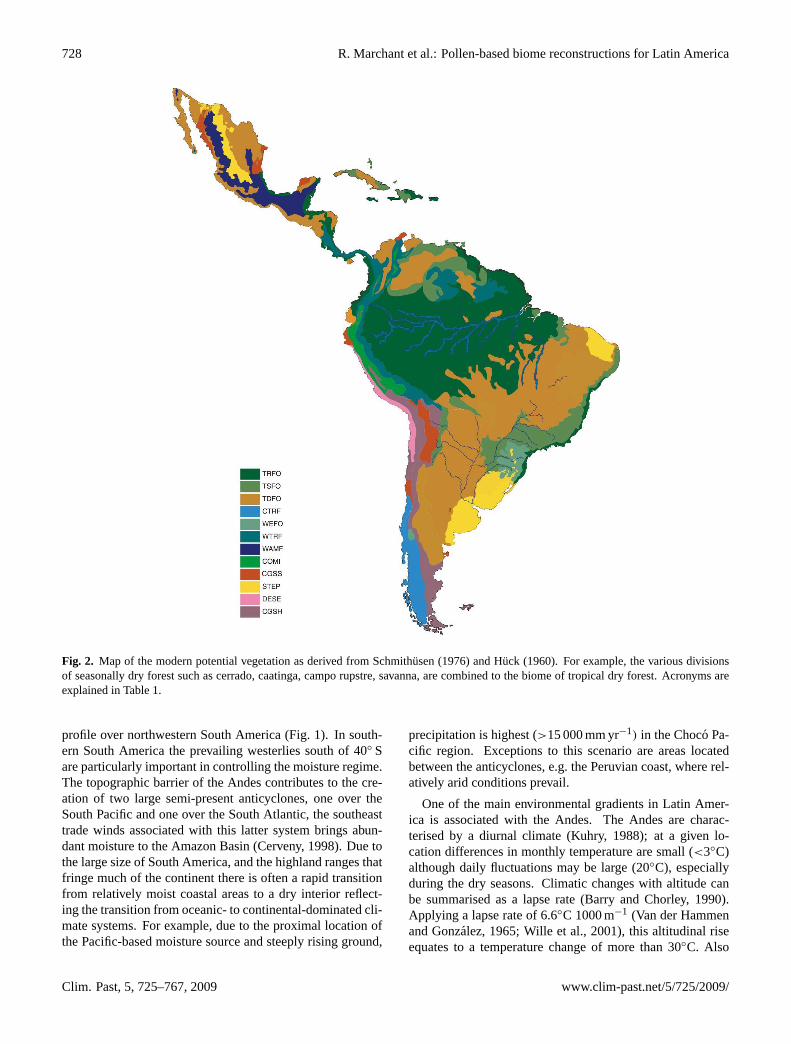
Figure 2. Map of the modern potential vegetation as derived from Schmithüsen, J. (1976) and Hück (1960). For example, the various divisions of seasonally dry forest such as cerradõ, caatinga, campo rupstre, savanna, are combined to the biome of tropical dry forest. Acronyms are explained in Table 1.
Fig. 2. Map of the modern potential vegetation as derived from Schmithusen (1976) and Huck (1960). For example, the various divisionsof seasonally dry forest such as cerrado, caatinga, campo rupstre, savanna, are combined to the biome of tropical dry forest. Acronyms areexplained in Table 1.
profile over northwestern South America (Fig. 1). In south-ern South America the prevailing westerlies south of 40◦ Sare particularly important in controlling the moisture regime.The topographic barrier of the Andes contributes to the cre-ation of two large semi-present anticyclones, one over theSouth Pacific and one over the South Atlantic, the southeasttrade winds associated with this latter system brings abun-dant moisture to the Amazon Basin (Cerveny, 1998). Due tothe large size of South America, and the highland ranges thatfringe much of the continent there is often a rapid transitionfrom relatively moist coastal areas to a dry interior reflect-ing the transition from oceanic- to continental-dominated cli-mate systems. For example, due to the proximal location ofthe Pacific-based moisture source and steeply rising ground,
precipitation is highest (>15 000 mm yr−1) in the Choco Pa-cific region. Exceptions to this scenario are areas locatedbetween the anticyclones, e.g. the Peruvian coast, where rel-atively arid conditions prevail.
One of the main environmental gradients in Latin Amer-ica is associated with the Andes. The Andes are charac-terised by a diurnal climate (Kuhry, 1988); at a given lo-cation differences in monthly temperature are small (<3◦C)although daily fluctuations may be large (20◦C), especiallyduring the dry seasons. Climatic changes with altitude canbe summarised as a lapse rate (Barry and Chorley, 1990).Applying a lapse rate of 6.6◦C 1000 m−1 (Van der Hammenand Gonzalez, 1965; Wille et al., 2001), this altitudinal riseequates to a temperature change of more than 30◦C. Also
Clim. Past, 5, 725–767, 2009 www.clim-past.net/5/725/2009/
R. Marchant et al.: Pollen-based biome reconstructions for Latin America 729
D BA C
FE G H
I J K L
M N O P
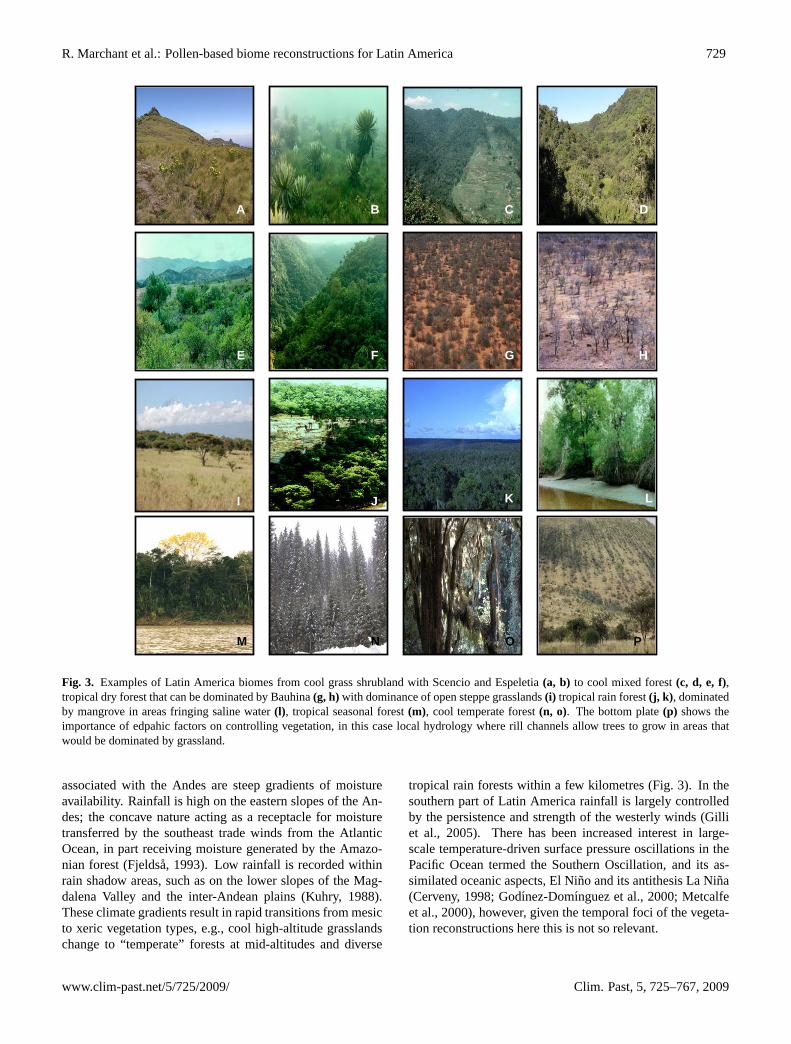
Figure 3. Examples of Latin America biomes from cool grass shrubland with Scencio and Espeletia (a, b) to cool mixed forest (c, d, e, f), tropical dry forest that can be dominated by Bauhina (g, h) with dominance of open steppe grasslands (i) tropical rain forest (j, k), dominated by mangrove in areas fringing saline water (l), tropical seasonal forest (m), cool temperate forest (n, o). The bottom plate (p) shows the importance of edpahic factors on controlling vegetation, in this case local hydrology where rill channels allow trees to grow in areas that would be dominated by grassland.
Fig. 3. Examples of Latin America biomes from cool grass shrubland with Scencio and Espeletia(a, b) to cool mixed forest(c, d, e, f),tropical dry forest that can be dominated by Bauhina(g, h) with dominance of open steppe grasslands(i) tropical rain forest(j, k) , dominatedby mangrove in areas fringing saline water(l), tropical seasonal forest(m), cool temperate forest(n, o). The bottom plate(p) shows theimportance of edpahic factors on controlling vegetation, in this case local hydrology where rill channels allow trees to grow in areas thatwould be dominated by grassland.
associated with the Andes are steep gradients of moistureavailability. Rainfall is high on the eastern slopes of the An-des; the concave nature acting as a receptacle for moisturetransferred by the southeast trade winds from the AtlanticOcean, in part receiving moisture generated by the Amazo-nian forest (Fjeldsa, 1993). Low rainfall is recorded withinrain shadow areas, such as on the lower slopes of the Mag-dalena Valley and the inter-Andean plains (Kuhry, 1988).These climate gradients result in rapid transitions from mesicto xeric vegetation types, e.g., cool high-altitude grasslandschange to “temperate” forests at mid-altitudes and diverse
tropical rain forests within a few kilometres (Fig. 3). In thesouthern part of Latin America rainfall is largely controlledby the persistence and strength of the westerly winds (Gilliet al., 2005). There has been increased interest in large-scale temperature-driven surface pressure oscillations in thePacific Ocean termed the Southern Oscillation, and its as-similated oceanic aspects, El Nino and its antithesis La Nina(Cerveny, 1998; Godınez-Domınguez et al., 2000; Metcalfeet al., 2000), however, given the temporal foci of the vegeta-tion reconstructions here this is not so relevant.
www.clim-past.net/5/725/2009/ Clim. Past, 5, 725–767, 2009

730 R. Marchant et al.: Pollen-based biome reconstructions for Latin America
Table 1. Range of plant functional types identified within the Latin American region giving bioclimatic range and physiological adaptation.
Code Plant functional type Bioclimatic range and plant physiological adaption
g Graminoid Ecologically broad category that occurs in a number of biomes, a highly adap-tive PFT with a ubiquitous distribution and little diagnostic value.
man Mangrove Constituent of lowland tropical vegetation, control on distribution is mainlyhydrological
tx Tree fern Can be locally dominant. Occupying a broad bioclimatic range, particularlycommon in temperate moist areas.
Te1 Tropical broad-leaved evergreen tree MTCO>15.5◦C, α>0.7, short dry season (1month), GDD>5000.
Te2 Tropical xeric broad-leaved evergreen tree MTCO>15.5◦C, α>0.6–08, longer dry season (2–4 months), GDD>5000,withstands longer dry season by shedding leaves.
Tr1 Tropical rain green tree MTCO>15.5◦C, α>0.9, GDD>5000, present in wettest tropical rain forest.
Tr2 Dry tropical rain green tree MTCO>15.5◦C, α0.8–0.9, GDD>5000, present in range of tropical seasonalforest types.
ctc Cold temperate conifer MTCO 5◦C–15◦C, α>0.7, GDD>4500, common in the Brazilian highlands.
ctc1 Cool temperate conifer MTCO−5◦C–10◦C, α 0.95–0.75, GDD>900, common along the westerncoast of southern South America.
ctc2 Maritime evergreen conifer MTCO−10◦C–5◦C, α>0.65, GDD>1000, common along the western coastof southern South America.
ec Eurythermic conifer MTCO>5◦C, α 0.4–0.6, GDD>5000, common within dry forest of SouthAmerica and Mexico.
txts Tropical xerophytic tree/shrub MTCO>20◦C,α 0.2–0.35, GDD>5000, woody shrubs common in dry forest.
ds Desert shrub MTCO>20◦C, α 0.2–0.35, GDD>5000, woody shrub and cacti in Mexicoand coastal Peru
df Xerophytic forb MTCO>20◦C, α 0.2–0.35, GDD>5000, woody shrub and cacti in Mexicoand coastal Peru
tf Tropical forb MTCO>15.5◦C, α>0.6, GDD>5000, frost intolerant
tef Temperate forb MTCO>5◦C–15◦C, α>0.6, GDD>1000, frost tolerant
sf Eurythermic forb MTCO 5◦C–10◦C, α 0.65–0.7, GDD 2500–4000, requires a seasonal moistenvironment
af Arctic forb MTCO−5◦C–0◦C, α 0.05–0.1, GDD<500, frost tolerant
cp Cushion forb MTCO<−5◦C, α<0.2, GDD<500, specific growth form, frost tolerant.
wte Warm temperate evergreen broad-leaved tree MTCO 5◦C–15◦C, α>0.65, GDD>3000, frost tolerant mesophyllous trees
ts Temperate summer green tree MTCO 0◦C–5◦C, α>0.65, GDD>2000, frost tolerant micro and mesophyl-lous trees
ts1 Temperate evergreen broad-leaved tree MTCO−5◦C–5◦C, α>0.5, GDD>1000, sclerophyllous, usually evergreen
wte1 Temperate cool deciduous broad-leaved tree MTCO 0◦C–15◦C, α>0.6, GDD>3000, winter deciduous, requires warmgrowing season.
wte4 Temperate cold-deciduous broad-leaved tree MTCO−5◦C–5◦C, α 0.55, GDD is>2500, winter deciduous, requires warmgrowing season but this can be short.
aa Arctic shrub MTCO−5◦C–0◦C, α 0.2–0.4, GDD 500–1000, frost tolerant
Clim. Past, 5, 725–767, 2009 www.clim-past.net/5/725/2009/

R. Marchant et al.: Pollen-based biome reconstructions for Latin America 731
5000
4000
3000
2000
1000
0
Te1Tr1
cp
sftf
Te2 Tr2
tx
af
tfwte
wte1
wte4
Alti
tude
(m)
ts
man
g
aa
ctc2
ecctc1
txts
5000
4000
3000
2000
1000
0
TROPICAL RAIN FOREST
SAVANNA
LOWER ANDEAN FOREST
UPPER ANDEAN FOREST
SUB-PARAMO
PARAMO / SUPER PARAMO
CGSS
TRFO TSFO
CGSH
WAMF
WEFO
COMI
STEP
CEFO
TDFO
(a)
(b)
Alti
tud e
(m)
Figure 4. Cross an altitudinal cross section across the northern Andes in Colombia showing the standard vegetation units and their relationship to Biomes (a) and plant functional types (b). Acronyms are explained in Tables 1 and 2
5000
4000
3000
2000
1000
0
Te1Tr1
cp
sftf
Te2 Tr2
tx
af
tfwte
wte1
wte4
Alti
tude
(m)
ts
man
g
aa
ctc2
ecctc1
txts
5000
4000
3000
2000
1000
0
TROPICAL RAIN FOREST
SAVANNA
LOWER ANDEAN FOREST
UPPER ANDEAN FOREST
SUB-PARAMO
PARAMO / SUPER PARAMO
CGSS
TRFO TSFO
CGSH
WAMF
WEFO
COMI
STEP
CEFO
TDFO
(a)
(b)
Alti
tud e
(m)
Figure 4. Cross an altitudinal cross section across the northern Andes in Colombia showing the standard vegetation units and their relationship to Biomes (a) and plant functional types (b). Acronyms are explained in Tables 1 and 2
Fig. 4. Cross an altitudinal cross section across the northern Andesin Colombia showing the standard vegetation units and their rela-tionship to Biomes(a) and plant functional types(b). Acronymsare explained in Tables 1 and 2.
1.3 Latin America vegetation
For the purpose of this investigation the potential vegetationcomposition and distribution Latin America is classified at acoarse resolution with twelve biomes being identified (Fig. 2)that summarise the 57 categories mapped by Huck (1960)and 45 by Schmithusen (1976). This process of reclassifyingthe vegetation was carried out in consultation with a num-ber of the co-authors, particularly those with good ecolog-ical knowledge and a range of geographical expertise. Re-ducing the number of vegetation categories results in a sig-nificant smoothing of the ecosystem transitions, particularlywhen these are very sharp or specific biomes are quite iso-lated. A good example are the relatively small deserts ofnorth-western Mexico that get mapped as tropical dry forestrather than desert. The vegetation composition and distri-bution generally reflects the main climatic and topographicgradients described above. However, a series of caveats tothis must be stressed. Firstly, the actual and potential veg-etation can be quite different, the former reflecting a longhistory of human interaction that has been particularly pro-nounced since the colonial period but has been influencingthe vegetation for at least the last 5000 years (Marchant et
al., 2004). In numerous areas this interaction has completelytransformed the potential vegetation to an agricultural land-scape. Another factor complicating the relationship betweenclimate and vegetation is the locally strong edaphic influenceby substrate, topography or geographic character (Fig. 3).The strength of this influence is demonstrated by areas oftropical dry forest that form on free-draining sandstones, e.g.the Llanos Orientales (Colombia); these are located in ar-eas where the climate regime would support tropical seasonalforest, or even tropical rain forest.
Broad types of vegetation with similar composition anddistribution (biomes) result from a combination of plantfunctional types (PFTs). PFTs and biomes, which lie at theheart of the biomisation technique, allow the high floristicdiversity within the Latin America pollen flora to link withthe relatively coarse vegetation classification (Fig. 4). PFTsgroup together species that have common character (Pren-tice et al., 1992). This grouping is based on common lifeform and phenology, combined with the geographic distribu-tion that is in part determined by climate (Woodward, 1987).An indication of the bioclimatic range of each PFT and plantphysiological adaptation, to the given environmental condi-tion, is presented in Table 1. The range of biomes identifiedwithin the Latin America, floristic description, main locationand equivalent floristic units is portrayed in Table 2. Thecool grass/shrubland biome incorporates a relatively widerange of vegetation dominated by grasses, heath, cool tem-perate sclerophyll shrubs and cushion plants (Fig. 3). Thisbiome is present in southern South America and at high al-titudes along the Andes. In addition to the cool grassland awarm grassland (steppe) is identified. Steppe is found pre-dominately under the warm, dry climates of southeast andnortheast Brazil, northwestern Argentina and coastal north-ern South America. Warm temperate rain forest representsa mix of warm conifers such asAraucaria, Andean and At-lantic rain forest elements, whereas cool temperate rain forestcontains cool conifers, such asFitzroya, Andean and Valdi-vian rain forest elements. Dry forests are extensive in LatinAmerica, specifically associated with areas located betweenthe two semi-permanent anticyclones and influenced by thehigh seasonality of rainfall imposed by the annual migrationof the ITCZ. For our classification we characterise the diversedry vegetation formations (Fig. 4) as the tropical dry forestbiome. Xerophytic trees and shrubs is widespread in the inte-rior of South America, along the southwestern Pacific coastand northeast Brazil where it grades into steppe, addition-ally, there are patches in Colombia, on the Yucatan peninsulaand in Mexico (Fig. 2). Tropical dry forest is predominantlyrecorded in two main swaths either side of the Amazon basin,with an extension through Central America. The tropical sea-sonal forest biome is predominantly recorded to the north ofAmazonia where it is interspersed with patches of dry for-est; this reflecting a strong edaphic influence. A large areaof tropical seasonal forest is recorded away from the hyper-humid area of Brazil along the Atlantic coast. The tropical
www.clim-past.net/5/725/2009/ Clim. Past, 5, 725–767, 2009

732 R. Marchant et al.: Pollen-based biome reconstructions for Latin America
Table 2. Biomes identified within the Latin American region as portrayed in the vegetation map (Fig. 2) indicting a floristic description, themain location and equivalent floristic units found in a macro scale analysis of the Latin American vegetation.
Code Biome Definition Main locations Equivalent Floristic characteristics
TRFO Tropicalrainforest
Closed canopy low-land evergreen forests.Canopy broken byemergent trees (>40 m).MTCO>18◦C, precipi-tation >1500 mm yr−1,frost-intolerant.
Characterise much ofthe Amazon catchment.Can form a relativelythin band along tropi-cal coastal areas, e.g.Atlantic rain forest ofBrazil, Choco pluvialforest of Colombia,maintained by highmoisture derived fromclose proximity ofoceanic influence.
Amazonian forest, Trop-ical moist forest, Atlanticrain forest, Terra firmeforest, Varzea, Galleryforest, Choco pluvial for-est.
Generally characterisedby plants with meso-phyll leaf, although somesclerophyllous plants arepresent, often tree fernsand palms.
TSFO Tropicalseasonalforest
Relatively tall (20–30 m)closed canopy forestwith occasionally tall(>40 m) emergent trees.Canopy opens in amosaic as deciduouselements loose leaves.Seasonally dry from 1–4months.
Dominant to the north ofAmazonian tropical rain-forest, in central Amer-ica and formerly exten-sive in the interior ofBrazil prior to extensiveclearance.
Marsh forests, savannagallery forest, Seasonalswamp forest withpalms.
A mix of mesophyllousand sclerophyllous taxa.The structure of the for-est is dependent on mois-ture demand and lengthof dry season – this de-termines the amount ofdeciduous taxa. Palmscan be locally common.
TDFO Tropical dryforest
Relatively low (5–10 m),occasionally tall (20 m)trees. Mixed forest,forming where the dryseason leads to droughtand plant water stress.
Extensive in centralBrazil and central SouthAmerica adjacent trop-ical rainforest. Morefragmented in north-western South Americawhere free drainingsubstrate leads to water-stress. Extends to midaltitudes, particularlywithin rain shadowareas. Extensive inwestern Central Americaand Mexico. Present onthe Galapagos Islands.
Andean xerophytic bush,Cerrado, Campo ru-pestres, Campo cerrado(“campo” is more asso-ciated with grasslands).Cactus forest, Matorral,Deciduous xerophyticforest, Andean xero-phytic bush, Espinar,Restinga dune forests,Thorn forest, Chaco.
Xeromorphic charac-teristic, particularly firetolerant. For example,microphyllous leaves,thorns, deciduous leaves,thick bark, stomata oftenpresent along lines.Drought adapted taxaare common, e.g. treecacti (Opuntia and Jas-minocerus) with denseundergrowth of shrubsand herbs.
WTRF Warm tem-perate rain-forest
Evergreen closed forest,of relatively low stature(<20 m) with tall emer-gent trees (>25 m). Nottolerant of freezing. Atransitional forest typebetween lowland andhigher altitude forms(1000–2500 m).
Extending along theAndes at mid to low el-evations (500–2000 m).Present at slightly lowerelevations in easternBrazilian highlands(<1000 m).
Lower montane forest,Moist lower montaneforest, Submontaneforest and Araucaria-dominated forest alsowith Podocarpus.
A mix of mesophyllousand sclerophyllous taxaconstrained by altitudeand length of dry season.Palms and tree ferns canbe locally common.
WEFO Warm-temperateevergreenbroadleafforest
Evergreen semi-closedforest with tall emergenttrees (>30 m). Nottolerant of freezing.
Present within a rel-atively restricted rangeand along the Andes,particularly present from1000–2000 m.
Andean forest, Transi-tional Andean forest,Upper Andean forest.
A mix of mesophyllousand sclerophyllous taxa.Tree ferns can be locallycommon.
Clim. Past, 5, 725–767, 2009 www.clim-past.net/5/725/2009/

R. Marchant et al.: Pollen-based biome reconstructions for Latin America 733
Table 2. Continued.
Code Biome Definition Main locations Equivalent Floristic characteristics
CTRF Cool tem-peraterainforest
Medium height (<15 m)closed canopy forestwith a dense under-story.Can tolerate freezing.
Predominant along west-ern coast of southernSouth America extend-ing to Patagonian steppe.Also present along theAndes at mid to high al-titudes.
Patagonian rain forest,Temperate rain forest,Valdivian rain forest,Magallenic rain forest.
A mix of mesophyllousand sclerophyllous taxa.The structure can bequite variable dependingon location – from denseforest to scrubby heath.
WAMF Warmtemperatemixed forest
Medium height (<15 m)open canopy with openunder-story. Drought tol-erant, semi fire-tolerant.
Mid to high altitudes ofnorth Central America,in particular Mexico.
Pinus and Quercus-dominated forest.
Mixed evergreen forestdominated by scle-rophyllous taxa thatrequire warm for bud-burst.
COMI Cool mixedforest
Short stature woodlands(<5 m) open canopy,open under-story forest.Frost tolerant.
High Andeanshrub/dwarf tree forests,present close to theforest line
Upper montane forests,High Andean forest,Cloud forest.
Predominantly evergreentaxa with physiologicaladaptation to night frost,e.g. retaining old leavesfor insulation.
CGSS Cool grass-lands
Common above theforest line of the Andes,dominated by tussockgrasses and cushionplants.
Present only at the high-est altitudes of the Andes
Puna, Heath, Cushionheath.
Poaceae-dominatedcool grasslands withoccasional cushionplants
STEP Steppe Dominated by grasses,occasional shrubs andsteppe herbs. Profuseflowering during the wetseason
Extensive in easternArgentina, present inlowland Central Americaand northeast Brazil.
Steppe grasslands,Campo limpo, Pampa.
Grasses and chenopodsforming low altitudewarm grasslands.
DESE Desert Open semi-arid to aridvegetation.
Coastal Peru and Chileand western Mexico.
Coastal desert. Occurrence of CAM-plants, cacti and succu-lents.
CGSH Cool grassshrublands
Tropic-alpine environ-ments, common abovethe forest line of theAndes. A mixture oftussock grasses andcold-adapted shrubs.
Present from extremesouthern South America,on Tierra del Fuegoabove the forest line ofAndes (2800–4000 m).
Paramo, Subparamo,Magallenic moorland,Paramillo, Vegas.
Poaceae-dominated coolgrasslands with numer-ous tussock forminggrass. Also present areshrubs, e.g.Empetrum,EspeletiaandPuya.
rain forest biome is present in three main areas: Amazo-nia, linear strips along the Atlantic coast and northeast SouthAmerica extending into Central America. Forest associatedwith highland areas is divided into three biomes: warm ever-green forest, cool temperate rain forest and cool mixed for-est (Fig. 4). Warm evergreen forest is most extensive alongthe lowland Andes, adjacent to the tropical rain forest. Coolmixed forest has a more restricted distribution, occupying ahighland position until temperature becomes limiting for anumber of taxa. Warm mixed forest is characterised by amix of PinusandQuercusspecies and is mainly restricted
to Central America. The desert biome is restricted to coastalPeru, due to the Pacific Ocean anticyclone, this area receivesvery little moisture.
2 Methods
2.1 Data sources
Over the past five decades researchers have collected nu-merous pollen-based records from lakes and bogs (Table 3)
www.clim-past.net/5/725/2009/ Clim. Past, 5, 725–767, 2009

734 R. Marchant et al.: Pollen-based biome reconstructions for Latin America
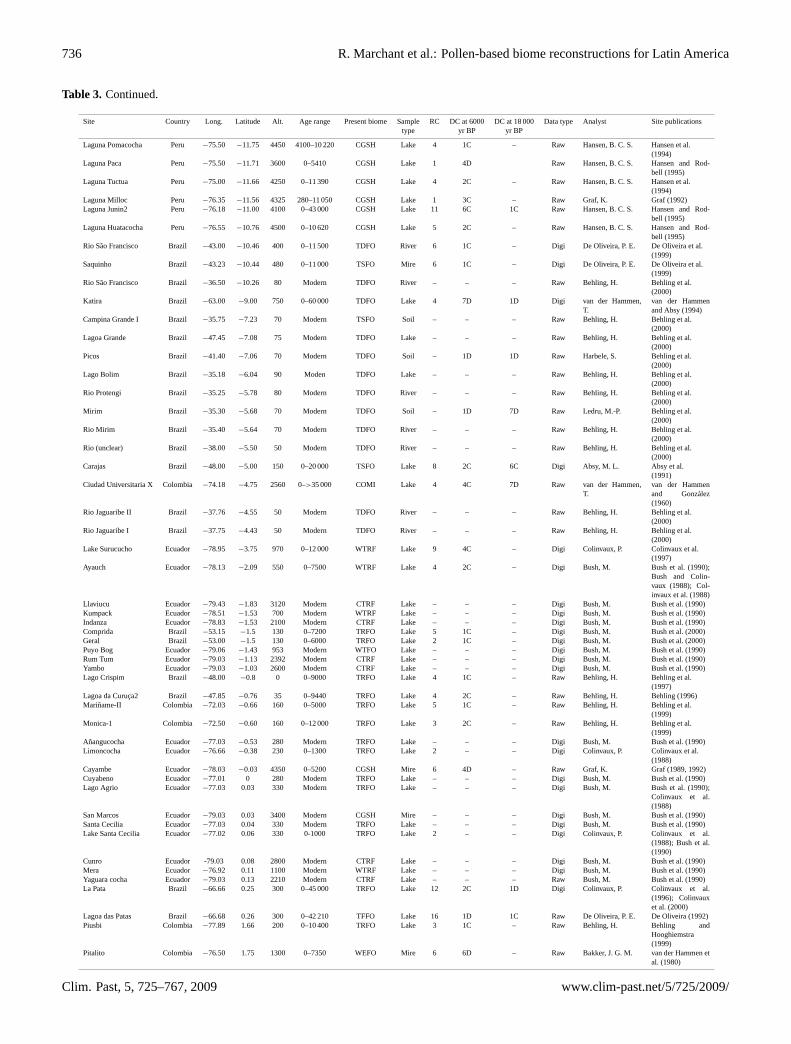
Table 3. Characteristics of the sites from Latin America: specifically detailing location, potential vegetation around the sites, sample type,age range of sediments, number of C14 dates (RC), data type, principle analysts and associated references. Dating control (DC) codes arebased on the COHMAP dating control scheme (Webb, 1985; Yu and Harrison, 1995). For sites with a continuous sedimentation (indicatedby C after the numerical code), the dating control is based on bracketing dates as follows. 1: both dates within 2000 years of the selectedinterval, 2: one date within 2000 years the other within 4000 years, 3: both dates within 4000 years, 4: one date within 4000 one date within6000 years, 5: both dates within 6000 years, 6: one date within 6000 the other within 8000 years, 7 bracketing dates more than 8000 yearsfrom the selected interval. For sites with discontinuous sedimentation (indicated by D after the numerical code), the dating control is basedon single dates 1: indicated a date within 250 years of the selected interval, 2: a date within 500 years, 3: a date within 750 years, 4: a datewithin 1000 years, 5: a date within 1500 years, 6: a date within 2000 years, 7: a date of more than 2000 years from the selected interval.
Site Country Long. Latitude Alt. Age range Present biome Sample RC DC at 6000 DC at 18 000 Data type Analyst Site publicationstype yr BP yr BP
LakeAsa3 Antarctica −61.13 −62.62 35 1280–4980 CGSH Soil 14 – – Raw Bjorck, S. Bjorck et al. (1993)Harberton Argentina −67.16 −54.88 20 0–13 360 STEP Mire 16 1C – Raw Markgraf, V. Markgraf (1989, 1991,
1993)Puerto del Hambre Chile −70.92 −53.59 5 0–16 000 CTRF Mire 5 4C 7D Digi Heusser, C. Heusser et al. (1995)La Mision Argentina −67.83 −53.5 5 0–9990 STEP Mire 4 4C – Raw Markgraf, V. Markgraf (1993)Punta Arenas Chile −70.97 −53.15 75 0–16 500 CTRF Mire 5 4C 7D Digi Heusser, C. Heusser et al. (1995)Meseta Latorre 1 Argentina −72.05 −51.52 980 240–7120 CGSH Mire 3 4C – Raw Schabitz, F Schabitz (1991)Meseta Latorre 2 Argentina −72.03 −51.44 1000 0–7000 CGSH Mire 1 6D – Raw Schabitz, F. Schabitz (1991)Torres del Paine Chile −72.66 −50.98 100 0–11 000 CTRF Lake 8 2C – Digi Heusser, C. Heusser et al. (1995)Moreno Glacier Bog Argentina −73.00 −50.46 200 0–9550 CTRF Mire 2 4C – Raw Ager, T. A. Mercer and Ager (1983)Patagonia Argentina −72.90 −50.25 50 Modern CTRF Soil – – – Digi Mancini, M. V. Mancini (1993)Patagonia Argentina −72.90 −50.20 20 Modern CTRF Soil – – – Digi Mancini, M. V. Mancini (1993)Patagonia Argentina −72.70 −50.20 80 Modern CTRF Soil – – – Digi Mancini, M. V. Mancini (1993)Patagonia Argentina −72.98 −50.15 20 Modern CTRF Soil – – – Digi Mancini, M. V. Mancini (1993)Patagonia Argentina −72.95 −50.15 50 Modern CTRF Soil – – – Digi Mancini, M. V. Mancini (1993)Patagonia Argentina −72.90 −50.15 50 Modern CTRF Soil – – – Digi Mancini, M. V. Mancini (1993)Patagonia Argentina −72.85 −50.15 60 Modern CTRF Soil – – – Digi Mancini, M. V. Mancini (1993)Patagonia Argentina −72.75 −50.15 60 Modern CTRF Soil – – – Digi Mancini, M. V. Mancini (1993)Patagonia Argentina −72.80 −50.15 70 Modern CTRF Soil – – – Digi Mancini, M. V. Mancini (1993)Patagonia Argentina −72.00 −50.15 150 Modern CTRF Soil – – – Digi Mancini, M. V. Mancini (1993)Patagonia Argentina −71.70 −50.15 180 Modern CTRF Soil – – – Digi Mancini, M. V. Mancini (1993)Patagonia Argentina −71.50 −50.15 180 Modern CTRF Soil – – – Digi Mancini, M. V. Mancini (1993)Patagonia Argentina −71.10 −50.15 180 Modern CTRF Soil – – – Digi Mancini, M. V. Mancini (1993)Patagonia Argentina −69.90 −50.15 180 Modern CTRF Soil – – – Digi Mancini, M. V. Mancini (1993)Patagonia Argentina −69.30 −50.15 180 Modern CTRF Soil – – – Digi Mancini, M. V. Mancini (1993)Patagonia Argentina −71.30 −50.15 190 Modern CTRF Soil – – – Digi Mancini, M. V. Mancini (1993)Patagonia Argentina −70.90 −50.15 190 Modern CTRF Soil – – – Digi Mancini, M. V. Mancini (1993)Patagonia Argentina −70.20 −50.15 190 Modern CTRF Soil – – – Digi Mancini, M. V. Mancini (1993)Patagonia Argentina −69.60 −50.15 190 Modern CTRF Soil – – – Digi Mancini, M. V. Mancini (1993)Patagonia Argentina −70.50 −50.15 200 Modern CTRF Soil – – – Digi Mancini, M. V. Mancini (1993)Patagonia Argentina −72.55 −50.10 100 Modern CTRF Soil – – – Digi Mancini, M. V. Mancini (1993)Patagonia Argentina −71.95 −50.10 180 Modern CTRF Soil – – – Digi Mancini, M. V. Mancini (1993)Patagonia Argentina −69.00 −50.10 190 Modern CTRF Soil – – – Digi Mancini, M. V. Mancini (1993)Patagonia Argentina −72.90 −50.05 50 Modern CTRF Soil – – – Digi Mancini, M. V. Mancini (1993)Patagonia Argentina −68.60 −50.05 50 Modern CTRF Soil – – – Digi Mancini, M. V. Mancini (1993)Patagonia Argentina −68.90 −50.05 100 Modern CTRF Soil – – – Digi Mancini, M. V. Mancini (1993)Patagonia Argentina −72.00 −50.05 150 Modern CTRF Soil – – – Digi Mancini, M. V. Mancini (1993)Patagonia Argentina −68.10 −50.00 0 Modern CTRF Soil – – – Digi Mancini, M. V. Mancini (1993)Patagonia Argentina −68.30 −50.00 20 Modern CTRF Soil – – – Digi Mancini, M. V. Mancini (1993)Dichan Chile −73.88 −49.66 50 0–8000 CTRF Mire 5 2C – Digi Heusser, C. Heusser et al. (1995)Puerto Eden Chile −74.41 −49.13 50 0–14 750 CTRF Mire 7 4C – Raw Markgraf, V. Ashworth and Markgraf
(1989); Ashworth et al.(1991)
La Esperanza Chile −72.83 −46.63 330 0–1500 CTRF Mire – – – Raw Graf, K. Graf (1992)LagoBsAs Argentina −71.45 −46.44 230 Modern CTRF Soil – – – Raw Schabitz, F. Schabitz (1994)Laguna Stibnite Chile −74.43 −46.43 50 0–14 000 CTRF Lake 6 1C 4D Digi Lumley, S. Lumley and Switsur
(1993)Laguna Stibnite Chile −74.38 −46.43 50 0–17 500 CTRF Lake 10 1C 2D Digi Bennet, K. Bennet et al. (2000)Laguna Six Minutes Chile −74.33 −46.43 50 0–17 500 CTRF Lake 4 4C 7D Digi Bennet, K. Bennet et al. (2000)Pico Salam Argentina −67.43 −45.42 637 Modern STEP Soil – – – Raw Schabitz, F. Schabitz (1994)Laguna Lincoln Chile −74.07 −45.34 50 0–16 500 CTRF Lake 5 2C 7D Digi Bennet, K. Bennet et al. (2000)Laguna Lofel Chile −74.43 −44.85 50 0–16 500 CTRF Lake 5 2C 6D Digi Bennet, K. Bennet et al. (2000)Estero Huitanque Chile −73.82 −43.61 52 0–14 000 CTRF Mire 9 1C – Digi Heusser, C. Heusser et al. (1995)AustroEsqu Argentina −71.47 −42.66 1100 Modern CTRF Soil – – – Raw Schabitz, F. Schabitz (1994)Mayol Chile −73.75 −42.64 75 0–14 000 CTRF Mire 12 3C – Digi Heusser, C. Heusser et al. (1995)Puchilco Chile −73.62 −42.63 110 0–12 500 CTRF Mire 7 2C – Digi Heusser, C. Heusser et al. (1995)AlercesNor Argentina −71.60 −42.56 800 Modern CTRF Soil – – – Raw Schabitz, F. Schabitz (1994)San Pedro Chile −73.95 −42.25 650 Modern CTRF Mire – – – Raw Moar, N. T. Godley and Moar (1973)Chepu Chile −73.66 −42.17 140 Modern CTRF Mire – – Raw Moar, N. T. Godley and Moar (1973)Mallin Book Argentina −71.58 −41.33 800 290–14 200 CTRF Mire 9 1C – Raw Markgraf, V. Markgraf (1983)Comallo Argentina −70.21 −41.01 815 Modern CGSH Soil – – – Raw Schabitz, F. Schabitz (1994)Puerto Octay PM13 Chile −72.90 −40.93 120 500–20 000 CTRF Mire 16 4C 1C Raw Moreno, P. I. Moreno (1994)Espuma Argentina −63.25 −40.67 50 Modern TDFO Soil – – – Raw Schabitz, F. Schabitz (1994)Primavera Argentina −71.18 −40.66 800 1800–4380 CTRF Midden 6 – – Raw Markgraf, V. Markgraf et al. (2009)Encantado Argentina −71.13 −40.66 960 290–1260 CTRF Midden 3 – – Raw Markgraf, V. Markgraf et al. (2009)Ruta 3.4 Argentina −62.79 −40.50 20 Modern STEP Soil – – – Raw Schabitz, F. Schabitz (1994)Ruta 3.3 Argentina −62.59 −40.08 20 Modern STEP Soil – – – Raw Schabitz, F. Schabitz (1994)Caunahue Chile −72.00 −40.00 500 4370–14 930 CTRF Section 9 2C – Raw Markgraf, V. Markgraf (1991)Ruta 250.19 Argentina −65.58 −39.54 117 Modern STEP Soil – – – Raw Schabitz, F. Schabitz (1994)
Clim. Past, 5, 725–767, 2009 www.clim-past.net/5/725/2009/

R. Marchant et al.: Pollen-based biome reconstructions for Latin America 735
Table 3. Continued.
Site Country Long. Latitude Alt. Age range Present biome Sample RC DC at 6000 DC at 18 000 Data type Analyst Site publicationstype yr BP yr BP
Pedro Luro Argentina −62.53 −39.50 20 Modern STEP Soil – – – Raw Schabitz, F. Schabitz (1994)Origone Argentina −62.43 −39.08 20 Modern STEP Soil – – – Raw Schabitz, F. Schabitz (1994)Gaviotas Argentina −63.65 −39.07 90 Modern TDFO Soil – – – Raw Schabitz, F. Schabitz (1994)Salina Anzotegui Argentina −63.77 −39.06 −5 0–10 360 STEP Playa 5 3D – Raw Schabitz, F. Schabitz (1994)Cueva Haichol Argentina −70.66 −38.58 1050 200–6890 STEP Cave 2 1C – Raw Markgraf, V. Markgraf (1988)Arroyo Sauce Chico Argentina −62.23 −38.07 85 Modern STEP Soil – – – Raw Prieto, A. R. Prieto (1996)Cerro La China Argentina −58.64 −37.84 200 0–10 500 STEP Soil 2 4C – Raw Prieto, A. R. Prieto and Paez
(1989); Paez andPrieto (1993)
Empalme Querandıes Argentina −60.65 −37.00 105 0–15 000 STEP Lake 8 2C – Raw Prieto, A. R. Prieto (1996)Veranada Pelan Argentina −70.38 −36.88 1860 0–10 890 CGSH Mire 3 3C – Raw Schabitz, F. Schabitz (1989)Vaca Lauquen Argentina −71.08 −36.83 1450 0–11 260 CTRF Mire 3 1C – Raw Markgraf, V. Markgraf (1987)Veranada Vulkanpickel Argentina −70.41 −36.68 2800 0–7790 CGSH Mire 1 7D – Raw Schabitz, F. Schabitz (1989)Salado Argentina −69.75 −35.33 3200 20–4330 CGSH Mire 2 – – Raw Markgraf, V. Markgraf (1983)Salina 2 Argentina −69.33 −32.25 2000 100–6510 CGSH Mire 2 1C – Raw Markgraf, V. Markgraf (1983)Serra do Rio Rastro Brazil −49.55 −28.55 1420 800–11 180 WTRF Mire 3 2C – Raw Behling, H. Behling (1993);
Behling (1997a, b)Morro da Igreja Brazil −49.86 −28.18 1800 0–10 390 WTRF Mire 2 – – Raw Behling, H. Behling (1993);
Behling (1997a, b)Serra da Boa Vista Brazil −49.15 −27.70 1160 0–14 000 WTRF Mire 4 2C – Raw Behling, H. Behling (1993);
Behling (1997a, b)Rano Kao Chile −109.43 −27.18 110 0–1360 TDFO Lake 2 – – Raw Flenley, J. Flenley and King
(1984); Flenley etal. (1991)
Rano Raraku Bore 3 Chile −109.28 −27.16 75 0–35 260 TDFO Lake 10 4C 4C Raw Flenley, J. Flenley and King(1984); Flenley etal. (1991)
Rano Aroui Chile −109.40 −27.08 425 0–37 600 TDFO Lake 11 2C 6C Raw Flenley, J. Flenley and King(1984)
Poco Grande Brazil −48.86 −26.41 10 0–4840 WTRF Section 4 – – Raw Behling, H. Behling (1993);Behling (1997a, b)
Reserva Volta Velha Brazil −48.38 −26.04 0 Modern WTRF Trap – – – Digi Behling, H. Behling et al.(1997)
Atlantic Brazil −48.35 −25.95 200 Modern WTRF Trap – – – Raw Behling, H. Behling et al.(1997)
Colombo Brazil −49.23 −25.33 920 Modern TSFO Trap – – – Raw Behling, H. Behling et al.(1997)
Serra Campos Gerais Brazil −50.21 −24.66 1200 0–12 480 WTRF Mire 4 3C – Raw Behling, H. Behling (1997a)Aguilar Argentina −65.75 −23.83 4000 0–9830 CGSH Mire 3 2C – Raw Markgraf, V. Markgraf (1985)Rio da Curua Brazil −48.83 −23.83 800 0–7500 WTRF Lake 4 – – Raw Behling, H. Behling et al.
(1997)Tumbre 2 Chile −67.78 −23.31 3880 241–7500 CGSH Lake 3 2C – Raw Graf, K. Graf (1992)Aguas Calientas Chile −67.42 −23.08 4210 0–6400 CGSH Mire 1 7D – Raw Graf, K. Graf (1992)Botucatu Brazil −48.00 −23.00 700 Modern WTRF Soil – – – Raw Behling, H. Behling (2009)Curcuab Brazil −48.00 −23.00 700 Modern WTRF Soil – – – Raw Behling, H. Behling (2009)Lagoa da Caco Brazil −43.43 −22.97 5 3000–20 000 TDFO Lake 14 1C – Raw Behling, H. Ledru et al.
(2001)Morro de Itapeva Brazil −45.63 −22.78 1850 0–35 010 WTRF Lake 9 4C – Raw Behling, H. Behling (1997b)Assis Brazil −50.50 −22.68 540 Modern TSFO Soil – – – Raw Behling, H. Behling (2009)Lagoa Santa Brazil −47.45 −22.36 630 Modern WTRF River – – – Digi Parizzi, M. G. Salgado-Labouriau
et al. (1998)Bauru Brazil −49.07 −22.32 570 Modern TSFO Soil – – – Raw Behling, H. Behling (2009)Brotas Brazil −48.08 −22.29 700 Modern WTRF Soil – – – Raw Behling, H. Behling (2009)Salitre Brazil −46.78 −19.00 1050 0–50 000 WTRF Lake 14 1C 7C Raw Ledru, M.-P. Ledru (1992,
1993); Ledru et al.(1994, 1996)
Ajata Chile −69.20 −18.25 4700 0–1460 CGSH Mire 1 – – Raw Graf, K. Graf (1992)Sajama Bolivia −68.88 −18.16 4250 0–4400 CGSH Lake 9 – – Raw Graf, K. Graf (1992)Lago do Pires Brazil −42.21 −17.95 390 0–9720 TSFO Lake 7 1C – Raw Behling, H. Behling (1993);
Behling (1997a, b)Wasa Mayu Bolivia −65.91 −17.54 2720 1000–31 000 COMI Lake 1 7D 7D Raw Graf, K. Graf (1992)Crominia Brazil −49.45 −17.28 200 0–32 200 TDFO Palm swamp 5 2C 1D Digi Salgado-
Labouriau, M. L.Salgado-Labouriauet al. (1998)
Mt. Blanco Bolivia −67.35 −17.02 4780 1250–7500 CGSH Lake 7 1C – Raw Graf, K. Graf (1992)Lake Huinamimarca Bolivia −69.00 −16.50 3765 0–25 000 CSGH Lake 48 1C 3C Digi Mourguiart, P. H. Mourguiart et al.
(1995); Argolloand Mourguiart(2000)
Cerro Calvario Bolivia −68.50 −16.50 3950 0–8360 CGSH Mire 4 1C – Raw Graf, K. Graf (1992)Rio Kaluyo Bolivia −68.13 −16.43 4070 130–9920 CGSH Lake 3 3C – Raw Graf, K. Graf (1992)Chacaltaya 1 Bolivia −68.13 −16.36 4750 80–7400 CGSH Mire 1 1C – Raw Graf, K. Graf (1992)Cumre Unduavi Bolivia −68.03 −16.33 4620 0–9200 CGSH Mire 6 3C – Raw Graf, K. Graf (1992)Rio Jequitinhonha Brazil −38.92 −15.85 80 Modern TDFO River – – – Raw Behling, H. Behling et al.
(2000)Brasilia 1 Brazil −47.66 −15.59 1030 Modern TDFO Soil – – – Raw Behling, H. Behling (2009)Aguads Emendadas Brazil −47.58 −15.56 200 0–28 000 TDFO Palm swamp 6 7C 7D Digi Salgado-
Labouriau, M. L.Salgado-Labouriauet al. (1998)
Cuiaba Brazil −55.86 −15.35 350 Modern TDFO Soil – – – Raw Behling, H. Behling (2009)Amarete Bolivia −68.98 −15.23 4000 0–9160 CGSH Mire 2 5D – Raw Graf, K. Graf (1992)Cotapampa Bolivia −69.11 −15.21 4450 0–9560 CGSH Mire 5 2C – Raw Graf, K. Graf (1992)Katantica Bolivia −69.18 −14.8 4820 50–7720 CGSH Mire 3 1C – Raw Graf, K. Graf (1992)Laguna Chaplin Bolivia −61.05 −14.50 750 0–40 000 TSFO Lake 14 2C 1D Digi Mayle, F. Mayle et al.
(2000)Rio de Contas Brazil −39.00 −14.28 80 Modern TDFO River – – – Raw Behling, H. Behling et al.
(2000)Laguna Bella Vista Bolivia −61.56 −13.58 750 0–55 000 TSFO Lake 15 2C 1D Digi Mayle, F. Mayle et al.
(2000)Laguna Jeronimo Peru −75.21 −11.78 4450 0–11 260 CGSH Lake 4 4C – Raw Hansen, B. C. S. Hansen et al.
(1994)
www.clim-past.net/5/725/2009/ Clim. Past, 5, 725–767, 2009
736 R. Marchant et al.: Pollen-based biome reconstructions for Latin America
Table 3. Continued.
Site Country Long. Latitude Alt. Age range Present biome Sample RC DC at 6000 DC at 18 000 Data type Analyst Site publicationstype yr BP yr BP
Laguna Pomacocha Peru −75.50 −11.75 4450 4100–10 220 CGSH Lake 4 1C – Raw Hansen, B. C. S. Hansen et al.(1994)
Laguna Paca Peru −75.50 −11.71 3600 0–5410 CGSH Lake 1 4D Raw Hansen, B. C. S. Hansen and Rod-bell (1995)
Laguna Tuctua Peru −75.00 −11.66 4250 0–11 390 CGSH Lake 4 2C – Raw Hansen, B. C. S. Hansen et al.(1994)
Laguna Milloc Peru −76.35 −11.56 4325 280–11 050 CGSH Lake 1 3C – Raw Graf, K. Graf (1992)Laguna Junin2 Peru −76.18 −11.00 4100 0–43 000 CGSH Lake 11 6C 1C Raw Hansen, B. C. S. Hansen and Rod-
bell (1995)Laguna Huatacocha Peru −76.55 −10.76 4500 0–10 620 CGSH Lake 5 2C – Raw Hansen, B. C. S. Hansen and Rod-
bell (1995)Rio Sao Francisco Brazil −43.00 −10.46 400 0–11 500 TDFO River 6 1C – Digi De Oliveira, P. E. De Oliveira et al.
(1999)Saquinho Brazil −43.23 −10.44 480 0–11 000 TSFO Mire 6 1C – Digi De Oliveira, P. E. De Oliveira et al.
(1999)Rio Sao Francisco Brazil −36.50 −10.26 80 Modern TDFO River – – – Raw Behling, H. Behling et al.
(2000)Katira Brazil −63.00 −9.00 750 0–60 000 TDFO Lake 4 7D 1D Digi van der Hammen,
T.van der Hammenand Absy (1994)
Campina Grande I Brazil −35.75 −7.23 70 Modern TSFO Soil – – – Raw Behling, H. Behling et al.(2000)
Lagoa Grande Brazil −47.45 −7.08 75 Modern TDFO Lake – – – Raw Behling, H. Behling et al.(2000)
Picos Brazil −41.40 −7.06 70 Modern TDFO Soil – 1D 1D Raw Harbele, S. Behling et al.(2000)
Lago Bolim Brazil −35.18 −6.04 90 Moden TDFO Lake – – – Raw Behling, H. Behling et al.(2000)
Rio Protengi Brazil −35.25 −5.78 80 Modern TDFO River – – – Raw Behling, H. Behling et al.(2000)
Mirim Brazil −35.30 −5.68 70 Modern TDFO Soil – 1D 7D Raw Ledru, M.-P. Behling et al.(2000)
Rio Mirim Brazil −35.40 −5.64 70 Modern TDFO River – – – Raw Behling, H. Behling et al.(2000)
Rio (unclear) Brazil −38.00 −5.50 50 Modern TDFO River – – – Raw Behling, H. Behling et al.(2000)
Carajas Brazil −48.00 −5.00 150 0–20 000 TSFO Lake 8 2C 6C Digi Absy, M. L. Absy et al.(1991)
Ciudad Universitaria X Colombia −74.18 −4.75 2560 0–>35 000 COMI Lake 4 4C 7D Raw van der Hammen,T.
van der Hammenand Gonzalez(1960)
Rio Jaguaribe II Brazil −37.76 −4.55 50 Modern TDFO River – – – Raw Behling, H. Behling et al.(2000)
Rio Jaguaribe I Brazil −37.75 −4.43 50 Modern TDFO River – – – Raw Behling, H. Behling et al.(2000)
Lake Surucucho Ecuador −78.95 −3.75 970 0–12 000 WTRF Lake 9 4C – Digi Colinvaux, P. Colinvaux et al.(1997)
Ayauch Ecuador −78.13 −2.09 550 0–7500 WTRF Lake 4 2C – Digi Bush, M. Bush et al. (1990);Bush and Colin-vaux (1988); Col-invaux et al. (1988)
Llaviucu Ecuador −79.43 −1.83 3120 Modern CTRF Lake – – – Digi Bush, M. Bush et al. (1990)Kumpack Ecuador −78.51 −1.53 700 Modern WTRF Lake – – – Digi Bush, M. Bush et al. (1990)Indanza Ecuador −78.83 −1.53 2100 Modern CTRF Lake – – – Digi Bush, M. Bush et al. (1990)Comprida Brazil −53.15 −1.5 130 0–7200 TRFO Lake 5 1C – Digi Bush, M. Bush et al. (2000)Geral Brazil −53.00 −1.5 130 0–6000 TRFO Lake 2 1C – Digi Bush, M. Bush et al. (2000)Puyo Bog Ecuador −79.06 −1.43 953 Modern WTFO Lake – – – Digi Bush, M. Bush et al. (1990)Rum Tum Ecuador −79.03 −1.13 2392 Modern CTRF Lake – – – Digi Bush, M. Bush et al. (1990)Yambo Ecuador −79.03 −1.03 2600 Modern CTRF Lake – – – Digi Bush, M. Bush et al. (1990)Lago Crispim Brazil −48.00 −0.8 0 0–9000 TRFO Lake 4 1C – Raw Behling, H. Behling et al.
(1997)Lagoa da Curuca2 Brazil −47.85 −0.76 35 0–9440 TRFO Lake 4 2C – Raw Behling, H. Behling (1996)Mariname-II Colombia −72.03 −0.66 160 0–5000 TRFO Lake 5 1C – Raw Behling, H. Behling et al.
(1999)Monica-1 Colombia −72.50 −0.60 160 0–12 000 TRFO Lake 3 2C – Raw Behling, H. Behling et al.
(1999)Anangucocha Ecuador −77.03 −0.53 280 Modern TRFO Lake – – – Digi Bush, M. Bush et al. (1990)Limoncocha Ecuador −76.66 −0.38 230 0–1300 TRFO Lake 2 – – Digi Colinvaux, P. Colinvaux et al.
(1988)Cayambe Ecuador −78.03 −0.03 4350 0–5200 CGSH Mire 6 4D – Raw Graf, K. Graf (1989, 1992)Cuyabeno Ecuador −77.01 0 280 Modern TRFO Lake – – – Digi Bush, M. Bush et al. (1990)Lago Agrio Ecuador −77.03 0.03 330 Modern TRFO Lake – – – Digi Bush, M. Bush et al. (1990);
Colinvaux et al.(1988)
San Marcos Ecuador −79.03 0.03 3400 Modern CGSH Mire – – – Digi Bush, M. Bush et al. (1990)Santa Cecilia Ecuador −77.03 0.04 330 Modern TRFO Lake – – – Digi Bush, M. Bush et al. (1990)Lake Santa Cecilia Ecuador −77.02 0.06 330 0-1000 TRFO Lake 2 – – Digi Colinvaux, P. Colinvaux et al.
(1988); Bush et al.(1990)
Cunro Ecuador -79.03 0.08 2800 Modern CTRF Lake – – – Digi Bush, M. Bush et al. (1990)Mera Ecuador −76.92 0.11 1100 Modern WTRF Lake – – – Digi Bush, M. Bush et al. (1990)Yaguara cocha Ecuador −79.03 0.13 2210 Modern CTRF Lake – – – Raw Bush, M. Bush et al. (1990)La Pata Brazil −66.66 0.25 300 0–45 000 TRFO Lake 12 2C 1D Digi Colinvaux, P. Colinvaux et al.
(1996); Colinvauxet al. (2000)
Lagoa das Patas Brazil −66.68 0.26 300 0–42 210 TFFO Lake 16 1D 1C Raw De Oliveira, P. E. De Oliveira (1992)Piusbi Colombia −77.89 1.66 200 0–10 400 TRFO Lake 3 1C – Raw Behling, H. Behling and
Hooghiemstra(1999)
Pitalito Colombia −76.50 1.75 1300 0–7350 WEFO Mire 6 6D – Raw Bakker, J. G. M. van der Hammen etal. (1980)
Clim. Past, 5, 725–767, 2009 www.clim-past.net/5/725/2009/

R. Marchant et al.: Pollen-based biome reconstructions for Latin America 737
Table 3. Continued.
Site Country Long. Latitude Alt. Age range Present biome Sample RC DC at 6000 DC at 18 000 Data type Analyst Site publicationstype yr BP yr BP
Piagua Colombia −76.50 2.30 1700 0–14 000 WEFO Lake 7 7D – Raw Wille, M. Wille et al. (2001);van der Hammen et al.(1980)
Pantano de Genagra Colombia−76.50 2.50 1750 0–9000 WEFO Mire 7 4C – Raw Behling, H. Behling et al. (1999);van der Hammen et al.(1980)
Rio Timbio Colombia −76.50 2.50 1750 0–14 000 WEFO Lake 6 2C – Raw Wille, M. van der Hammen et al.(1980)
El Caimito Colombia −76.60 2.53 50 0–4500 TRFO Lake 4 – – Raw Wille, M. Wille et al. (1999)Loma Linda Colombia −73.35 3.22 310 0–8720 TDFO Lake 8 1C – Raw Behling, H. Behling et al. (1999)Lago Agua Sucia Colombia −73.54 3.46 260 0–15 340 TDFO Lake 4 7D – Raw Wijmstra, T. A. Wijmstra and van der
Hammen (1966)El Gobernador Colombia −75.00 3.95 3815 0–10 050 CTRF Mire 2 2C – Raw Melief, A. B. M. Melief (1985)La Guitarra Colombia −74.28 4.00 3450 0–15 300 COMI Mire 3 4C – Raw Melief, A. B. M. Melief (1985)La Primavera Colombia −74.13 4.00 3525 0–11 200 CGSH Mire 6 1C – Raw Melief, A. B. M. Melief (1985)Corazon Partido Colombia −74.25 4.00 4100 Modern CGSH Mire – – – Raw Melief, A. B. M. Melief (1985)El Trinagulo Colombia −74.25 4.00 4100 Modern CGSH Mire – – – Raw Melief, A. B. M. Melief (1985)Carimagua Colombia −74.14 4.04 180 0–8270 TDFO Lake 6 2C – Raw Behling, H. Behling and Hooghiem-
stra (1999)La Rabona Colombia −74.25 4.05 4000 0–5100 CGSH Mire 1 4D – Raw Melief, A. B. M. Melief (1985)El Pinal Colombia −70.40 4.09 185 0–19 000 TDFO Lake 8 4C 2D Raw Behling, H. Behling and Hooghiem-
stra (1999)Alsacia Colombia −74.11 4.09 3100 0–13 700 COMI Mire 3 6D – Raw Melief, A. B. M. Melief (1985)Andabobos Colombia −74.15 4.09 3570 0–15 000 CGSH Mire 2 7D – Raw Melief, A. B. M. Melief (1985)Ubaque Colombia −73.55 4.33 2000 Modern WEFO Lake – – – Raw Jean-Jarcob, K. Wille et al. (2001);
van der Hammen et al.(1980)
de la America Colombia −74.00 4.33 3550 0–9000 CGSH Mire 1 1D – Raw Kuhry, P. Kuhry (1988); van derHammen and Gonzalez(1960)
Turbera de Calostros Colombia −73.48 4.41 3730 Modern CGSH Soil 1 – – Raw Salomons, J. B. van der Hammen et al.(1980)
Laguna Angel Colombia −70.54 4.45 205 0–10 026 TDFO Lake 8 2C – Raw Behling, H. Behling and Hooghiem-stra (1998)
Libano Colombia −75.50 4.50 1820 0–14 000 WEFO Soil 1 7D – Raw Salomons, J. B. van der Hammen et al.(1980)
de Pedro Palo III Colombia −74.41 4.50 2000 0–5500 COMI Lake 2 7D - Raw van der Hammen,T.
van der Hammen (1974)
Paramo Palacio Colombia −73.88 4.76 3550 0–5500 CGSH Mire 4 5D – Raw van der Hammen,T.
van der Hammen andGonzalez (1960)
Greja Colombia −73.70 4.86 4000 0–12 000 CGSH Lake 2 3C – Raw van der Hammen,T.
van der Hammen (1962)
Sardinas Colombia −69.45 4.95 180 0–11 600 TDFO Lake 6 2C – Raw Behling, H. Behling and Hooghiem-stra (1998)
Herrera Colombia −73.91 5.00 2000 0–20 000 COMI Lake 3 4D – Raw van Geel, B. van Geel and van derHammen (1973)
Agua Blanca Colombia −74.45 5.0 3250 0–46 000 COMI Mire 2 6D 7D Raw Kuhry, P. Graf (1992); Kuhry(1988b); Kuhry et al.(1983)
El Abra II Colombia −73.96 5.02 2570 0–11 000 COMI Cave 1 7D – Raw Schreve-Brinkman,E. J.
Schreve-Brinkman(1978)
Paramo de Pena Negra Colombia −74.09 5.09 3625 0–12 500 CGSH Mire 10 2C – Raw Kuhry, P. Kuhry et al. (1983)ODP site 932 Brazil −47.03 5.18 0 0–45 000 TRFO Fan 2 2C 1D Raw Haberle, S. Haberle and Maslin
(1999)Paramo de Laguna Verde Colombia−74.00 5.25 3625 0–5500 CGSH Mire 2 4D – Raw Kuhry, P. Kuhry et al. (1983)Fuquene II Colombia −73.87 5.50 2580 0–25 000 COMI Lake 2 7D 7C Raw van Geel, B. van Geel and van der
Hammen (1973)Jotaordo Colombia −76.66 5.66 50 0–4200 TRFO Lake 7 – – Raw Berrio, J. C. B. Berrio et al. (2000)Cienaga del Visitador Colombia −72.83 6.13 3300 0–12 000 COMI Mire 2 7D – Raw van der Hammen,
T.van der Hammen andGonzalez (1965)
Bobos Colombia −72.85 6.13 3800 0–5000 CGSH Lake 4 6D – Raw van der Hammen,T.
van der Hammen (1962)
Ciega I Colombia −72.31 6.50 3510 0–2000 COMI Lake 1 – – Raw van der Hammen,T.
van der Hammen et al.(1980)
Valle de Lagunillas Colombia −72.34 6.50 3880 0–7100 CGSH Lake 8 7D – Raw van der Hammen,T.
van der Hammen et al.(1980)
Cana, Darien Panama −77.58 7.68 1000 Modern TSFO Pollster – – – Raw Bush, M. Bush (1995); Bush andRivera (1998)
Cana Swamp Panama −77.59 7.74 500 0-4600 TRFO Swamp 5 – – Digi Bush, M. Bush and Colinvaux(1994)
Wodehouse Swamp Panama −77.58 7.75 500 0–4200 TRFO Swamp 1 – – Digi Bush, M. Bush and Colinvaux(1994)
La Chonta Costa Rica −82.00 8.00 2310 0–80 000 CTRF Lake 3 2C 7D Digi Islebe, G. Hooghiemstra et al.(1992); Islebe andHooghiemstra (1997);Islebe et al. (1995a, b)
www.clim-past.net/5/725/2009/ Clim. Past, 5, 725–767, 2009

738 R. Marchant et al.: Pollen-based biome reconstructions for Latin America
Table 3. Continued.
Site Country Long. Latitude Alt. Age range Present biome Sample RC DC at 6000 DC at 18 000 Data type Analyst Site publicationstype yr BP yr BP
El Valle Panama −79.78 8.43 500 0–20 000 TSFO Lake 5 – 2C Digi Bush, M. Bush (1995); Bush andRivera (1998); Piperno etal. (1991a, b)
La Yeguada, Panama −80.78 8.43 650 0–14 000 TSFO Lake 11 1C – Digi Bush, M. Bush (1995); Bush et al.(1992); Bush and Rivera(1998); Piperno et al.(1991a, b)
Cerro Campana Panama −79.93 8.63 800 Modern WTFO Pollster – – – Raw Bush, M. Bush (1995); Bush andRivera (1998)
Quebrada Nelson Panama −82.31 8.66 1130 Modern WTRF Pollster – – – Raw Bush, M. Bush (1995); Bush andRivera (1998)
Laguna Volcan Panama −82.75 8.75 1500 0–2860 WTRF Lake 4 – – Digi Behling, H. Behling (2000)Valle Laguna Negra Venezuela −70.76 8.79 3450 0–3350 CGSH Lake 1 – – Raw Graf, K. Rull et al. (1987)Valle Laguna Victoria Venezuela −70.79 8.80 3250 0–12 210 CGSH Lake 4 4C – Raw Graf, K. Rull et al. (1987)Horsefly Ridge Panama −82.24 8.83 1150 Modern WTRF Pollster – – – Raw Bush, M. Bush (1995); Bush and
Rivera (1998)El Bosque Colombia −75.45 8.85 3650 0–4700 CGSH Mire 4 – – Raw Melief, A. B. M. Kuhry (1988a); Melief
(1985)Volcan Baru Panama −82.52 8.85 2600 Modern CTRF Pollster – – – Raw Bush, M. Bush (1995); Bush and
Rivera (1998)Finca Lerida Panama −82.45 8.87 1630 Modern WTRF Pollster – – – Raw Bush, M. Bush (1995); Bush and
Rivera (1998)Volcan Irazu Panama −82.52 8.88 2300 Modern CTRF Pollster – – – Raw Bush, M. Bush (1995); Bush and
Rivera (1998)Paramo de Miranda Venezuela−70.85 8.91 3290 310–11 470 CGSH Mire 3 4C – Raw Salgado-
Labouriau, M. L.Salgado-Labouriau(1988, 1991)
Panama Panama −80.87 9.00 100 0–7200 TSRO Lake 8 1C – Raw Leyden, B. W. Leyden et al. (1995)Ocelot Pond Panama −79.59 9.12 20 Modern TSFO Pollster – – – Raw Bush, M. Bush (1995); Bush and
Rivera (1998)Soberania Panama −79.66 9.13 20 Modern TSFO Pollster – – – Raw Bush, M. Bush (1995); Bush and
Rivera (1998)Paramo Piedras Blancas Venezuela−70.83 9.16 4080 0–1340 CGSH Mire 2 – – Raw Salgado-
Labouriau, M. L.Rull et al. (1987)
Pipeline Rd Panama −79.66 9.33 40 Modern TSFO Pollster – – – Raw Bush, M. Bush (1995); Bush andRivera (1998)
Barro Colorado Island Panama −79.75 9.35 50 Modern TSFO Pollster – – – Raw Bush, M. Bush (1995); Bush andRivera (1998)
Lago Chirripo Costa Rica −83.48 9.48 3520 Modern CTRF Lake – – – Digi Horn, S. P. Rodgers and Horn(1996)
Talamancas Costa Rica −83.72 9.5 2500 Modern CTRF Pollster – – – Raw Bush, M. Bush (1995); Bush andRivera (1998)
Lago de las Morrenas Costa Rica−83.49 9.50 3480 0–10 000 CTRF Lake 6 2C – Digi Horn, S. P. Horn (1993)Bog 70 Costa Rica −83.85 9.61 2670 Modern CTRF Bog – – – Digi Horn, S. P. Rodgers and Horn
(1996)Tres de Junio Costa Rica −83.87 9.62 2670 Modern CTRF Bog – – – Digi Horn, S. P. Rodgers and Horn
(1996)Bog 68 Costa Rica −83.85 9.64 2670 Modern CTRF Bog – – – Digi Horn, S. P. Rodgers and Horn
(1996)Asuncion Costa Rica −83.75 9.64 3340 Modern CTRF Lake – – – Digi Horn, S. P. Rodgers and Horn
(1996)Carara Biological Reserve Costa Rica−84.62 9.73 0 Modern TSFO Pollster – – – Raw Bush, M. Bush (1995); Bush and
Rivera (1998)Quebrador Costa Rica −83.84 9.74 3040 Modern CTRF Lake – – – Digi Horn, S. P. Rodgers and Horn
(1996)Cataracta, Carara 1 Costa Rica−84.63 9.83 270 Modern TSFO Pollster – – – Raw Bush, M. Bush (1995); Bush and
Rivera (1998)Cataracta, Carara 2 Costa Rica−84.63 9.85 270 Modern TSFO Pollster – – – Raw Bush, M. Bush (1995); Bush and
Rivera (1998)Carara Costa Rica −84.60 9.88 35 Modern TSFO Lake – – – Digi Horn, S. P. Rodgers and Horn
(1996)Laguna Bonilla Costa Rica −83.61 9.99 380 Modern TSFO Lake – – – Digi Horn, S. P. Rodgers and Horn
(1996)Laguna Barva Costa Rica −84.11 10.14 2840 Modern CTRF Lake – – – Digi Horn, S. P. Rodgers and Horn
(1996)Laguna Palmita Costa Rica −84.95 10.18 60 Modern TDFO Soil – – – Digi Horn, S. P. Rodgers and Horn
(1996)Laguna Botos Costa Rica −84.18 10.18 2600 Modern CTRF Lake – – – Digi Horn, S. P. Rodgers and Horn
(1996)Bosque Alegre Costa Rica −84.21 10.21 740 Modern WTRF Lake – – – Digi Horn, S. P. Rodgers and Horn
(1996)Laguna Gonzalez Costa Rica −84.45 10.25 710 Modern WTRF Lake – – – Digi Horn, S. P. Rodgers and Horn
(1996)Laguna Congo Costa Rica −84.29 10.27 740 Modern WTRF Lake – – – Digi Horn, S. P. Rodgers and Horn
(1996)Laguna Hule Costa Rica −84.19 10.27 740 Modern WTRF Lake – – – Digi Horn, S. P. Rodgers and Horn
(1996)Laguna Marıa Aguilar Costa Rica −84.18 10.27 770 Modern WTRF Lake – – – Digi Horn, S. P. Rodgers and Horn
(1996)Brauillo Carillo, Heredia Costa Rica −83.94 10.3 630 Modern WTRF Pollster – – – Raw Bush, M. Bush (1995); Bush and
Rivera (1998)Monteverde, Heredia Costa Rica −84.8 10.3 1500 Modern WTRF Pollster – – – Raw Bush, M. Bush (1995); Bush and
Rivera (1998)Volcan Poas Costa Rica −84.19 10.3 2580 Modern CTRF Pollster – – – Raw Bush, M. Bush (1995); Bush and
Rivera (1998)Lake Valencia Venezuela −67.75 10.32 403 400–13 000 STEP Lake 28 1C – Raw Leyden, B. W. Bradbury et al. (1981);
Leyden (1985)Laguna Rıo Cuarto Costa Rica −84.18 10.34 380 Modern WTRF Lake – – – Digi Horn, S. P. Rodgers and Horn
(1996)
Clim. Past, 5, 725–767, 2009 www.clim-past.net/5/725/2009/

R. Marchant et al.: Pollen-based biome reconstructions for Latin America 739
Table 3. Continued.
Site Country Long. Latitude Alt. Age range Present biome Sample RC DC at 6000 DC at 18 000 Data type Analyst Site publicationstype yr BP yr BP
La Selva, Heredia Costa Rica −84.00 10.43 80 Modern TSFO Pollster – – – Raw Bush, M. Bush (1995); Bushand Rivera (1998)
Cantarrana Swamp Costa Rica−84.00 10.45 36 Modern TRFO Swamp – – – Digi Horn, S. P. Rodgers and Horn(1996)
La Pacifica, Guanacaste Costa Rica−85.11 10.45 110 Modern TSFO Pollster – – – Raw Bush, M. Bush (1995); Bushand Rivera (1998)
Sendro Sedro Swamp Costa Rica−84.00 10.46 40 Modern TRFO Swamp – – – Digi Horn, S. P. Rodgers and Horn(1996)
Laguna La Palma Costa Rica −84.73 10.49 570 Modern WTRF Lake – – – Digi Horn, S. P. Rodgers and Horn(1996)
Laguna Cedeno Costa Rica −84.71 10.49 610 Modern WTRF Lake – – – Digi Horn, S. P Rodgers and Horn(1996)
Tortuguero Costa Rica −83.53 10.53 0 Modern TSFO Pollster – – – Raw Bush, M. Bush (1995); Bushand Rivera (1998)
Santa Rosa2 Costa Rica −85.64 10.83 0 Modern TSFO Soil – – – Digi Horn, S. P. Rodgers and Horn(1996)
Santa Rosa1 Costa Rica −85.66 10.84 0 Modern TRFO Soil – – – Digi Horn, S. P. Rodgers and Horn(1996)
Boca de Lopez Colombia −75.36 10.85 0 0–4000 TRFO Coastal 5 – – Raw van der Hammen,T.
Behling et al.(1999)
Cafetal, Guanacaste Costa Rica−85.65 10.85 300 Modern TSFO Pollster – – – Raw Bush, M. Bush (1995); Bushand Rivera (1998)
Santa Rosa3 Costa Rica −85.62 10.86 280 Modern TSFO Soil – – – Digi Horn, S. P. Rodgers and Horn(1996)
Santa Rosa4 Costa Rica −85.62 10.86 280 Modern TSFO Soil – – – Digi Horn, S. P. Rodgers and Horn(1996)
Escondido Costa Rica −85.61 10.87 280 Modern TSFO Lake – – – Digi Horn, S. P. Rodgers and Horn(1996)
Volcan Cacao Costa Rica −85.47 10.92 1000 Modern WTRF Soil – – – Digi Horn, S. P. Rodgers and Horn(1996)
Sierra de Cuchumatanes5 Guatemala−91.00 15.75 2800 Modern WAMF Polster – – – Digi Islebe, G. Islebe andHooghiemstra(1995)
Sierra de Cuchumatanes4 Guatemala−91.25 15.75 3000 Modern CTRF Polster – – – Digi Islebe, G. Islebe andHooghiemstra(1995)
Sierra de Cuchumatanes3 Guatemala−91.5 15.75 3400 Modern CTRF Polster – – – Digi Islebe, G. Islebe andHooghiemstra(1995)
Sierra de Cuchumatanes2 Guatemala−91.75 15.75 3600 Modern WAMF Polster – – – Digi Islebe, G. Islebe andHooghiemstra(1995)
Sierra de Cuchumatanes1 Guatemala−92.00 15.75 4200 Modern CGSH Polster – – – Digi Islebe, G. Islebe andHooghiemstra(1995)
Lago Quexil Guatemala −89.88 16.92 110 0–27 500 TSFO Lake 4 7D – Raw Leyden, B. W. Leyden (1984);Leyden et al.(1993, 1994)
Lake Peten-Itza Guatemala −90.00 17.25 200 0–9000 TDFO Lake 7 2C – Digi Islebe, G. Islebe et al.(1996)
Lago Catemaco Mexico −95.00 18.66 340 0–2230 TRFO Lake 5 2C – Raw Byrne, A. R. Byrne and Horn(1989)
Zempoala Mexico −99.30 19.20 3100 0–4600 WAMF Lake 5 – – Raw Almeida, L. Almeida (1997)Quila Mexico −99.20 19.30 2800 0–10 000 WAMF Lake 4 3C – Raw Almeida, L. Almeida (1997)Lake Texcoco Mexico −99.12 19.44 2330 0–35 000 WAMF Lake 7 3C 4C Digi Lozano-Garcıa, S. Lozano-Garcıa and
Ortega-Guerrero(2009)
Chalco Lake Mexico −99.00 19.50 2240 8000–27 500 WAMF Lake 8 3C 1C Raw Lozano-Garcia,M. S.
Lozano-Garcia andOrtega-Guerrero(1994); Lozano-Garcia et al.(1993); Ortega-Guerrero (1992)
Lake Patzcuaro Mexico −101.58 19.58 2044 20–44 100 WAMF Lake 24 2C 6C Raw Watts, W. A. Saporito (1975),Watts and Bradbuy(1982)
San Jose Chulchaca Mexico −90.13 20.86 1 0–7300 TDFO Lake 8 2C – Raw Leyden, B. W. Leyden et al.(1995)
Lake Coba Mexico −87.55 20.86 100 5880–19 230 WAMF Playa 8 7D 2C Raw Leyden, B. W. Leyden et al.(1998)
that have been used to unravel past vegetation changes inLatin America with ecosystem reconstructions now exist-ing from all major vegetation types over the late Quater-nary period. The Latin American Pollen Database (LAPD)(www.ncdc.noaa.gov/paleo/lapd.html) is an online resourceused to collate these data and facilitated the systematic inter-operation presented here; indeed the majority of the pollen
data used here are available through the LAPD. Additionaldata were obtained from researchers working in Latin Amer-ica; all active palynolgists being given the opportunity tocontribute data not currently lodged in the LAPD. Indeed,data from a number of sites in Argentina, Brazil, Costa Rica,Mexico and Panama were made available specifically for thiswork. The majority of data from Colombia were prepared for
www.clim-past.net/5/725/2009/ Clim. Past, 5, 725–767, 2009

740 R. Marchant et al.: Pollen-based biome reconstructions for Latin America
this analysis directly from the original count sheets and arein preparation for uploading to the LAPD.
The majority of the data used in our analysis are completeraw pollen counts, this permitted all pollen taxa recorded bythe original analyst to be allocated to PFTs and allowed theintegrity of the data to be maintained throughout the analy-sis. Application of raw pollen data in other regions has beenshown to help in differentiating between biomes (Tarasov etal., 1998b). However, numerous pollen records are eithernot submitted to the LAPD, or, were not made available forthis analysis. Rather than omitting these data, the pollencounts were digitised from published pollen diagrams (Ta-ble 3): digitising such data provides a spatially more com-plete reconstruction than available from presented archiveddata. The process of digitisation involved either back cal-culation of the pollen counts if information on the pollensum was present; if the pollen sum was not available thepollen percentage diagram was used as a count of 100 andvalues for the pollen taxa were abstracted at the time in-tervals used for our analysis. This scenario of combiningdata from different formats comes with a number of caveatsthat can have bearing on the results, and their interpretation(Marchant and Hooghiemstra, 2001). Firstly, the sub-set ofpollen taxa in a count used to construct published pollen di-agrams, and pollen sums that comprise it, often result fromthe bias of individual researchers’, particularly on what arethe reliable indicator taxa for a particular area and range ofdifferent vegetation types under investigation. This issue isparticularly crucial in Latin America where the large num-bers of pollen taxa encountered in the original counting arerarely depicted on published pollen diagrams. Furthermore,the level of identification achieved within pollen analysis, toa generic or family level, commonly comprises species thatcan be found in a range of different vegetation types, ecolo-gies and growth forms (Marchant et al., 2002c). The majorityof the samples for the biomisation presented here are derivedfrom sites close to the Andean spine. Primarily, this concen-tration reflects the sensitive response of the vegetation to cli-mate change on the steep altitudinal gradients (Marchant etal., 2001b); the area forming an ideal location for palaeoeco-logical research. Additionally, the comparative lack of datafrom the lowlands is fuelled by problems of access, suitablesites and strong river dynamics that commonly result in sed-imentary hiatuses (Ledru, 1998). Because of the steep en-vironmental gradients associated with 7000 m of altitudinalchange found along the Andes this spatial bias did not reducethe number of biomes we were able to reconstruct, (Fig. 4).However, the concentration of sites did result in numerousassignments being mapped overlapping each other and hencethe changes between the different time periods difficult todetect. To rectify this problem in addition to presenting theresults on the traditional biome dot maps (Figs. 7, 8 and 9)results are presented for all sites in a table (Table 6) that hasbeen ordered by altitude so one can see which biome hasbeen reconstructed for each site, how this compares to the
potential vegetation and how it changes at each time period.Uncalibrated radiocarbon dates available from the original
stratigraphic analysis were used to select samples represent-ing the time period used here. On a site-by-site basis, a linearage-depth model was applied to the pollen data. The validityof this model was assessed at each site taking into accountsedimentary hiatuses and dating problems such as age rever-sals and dates with large standard errors; a summary of thisdating control is provided in Table 1 following the COHMAPscheme (Webb, 1995; Yu and Harrison, 1999). Multiple sam-ples (≤3) were selected when more than one sample fellwithin the age range allowed for each time period. Thesedata were compiled, to produce a sitevs taxa matrix thatwas then checked to standardise nomenclature, e.g., the com-bined file contained many synonyms such as Gramineae andPoaceae, andMysineandRapanea. Synonymous taxa werecombined using the nomenclature of Kewensis (1997) andthe International Plant Names Index (IPNI) (2008). Aquaticand non-tree fern taxa were removed from the matrix as theycommonly reflect local hydrological conditions rather thanlocal climate envelope. Marker additions and exotic spikessuch asLycopodiumwere also removed.
A total of 381 samples from 287 locations derived fromcore tops (<500 14C yr BP), surface samples, pollen trapsand moss polsters comprise the modern data set (Table 3).For the time period 6000±500 14C yr BP, 255 samples de-rived from 127 pollen records comprise the data set (Table 3).For the time period 18 000±100014C yr BP, 61 samples de-rived from 34 pollen records comprise the data set (Table 3).The data sets to undergo analysis comprised 515 pollen taxafor the modern calibration, 493 for the 600014C yr BP recon-struction and 232 for the 18 00014C yr BP reconstruction.The taxonomic diversity of the Neotropical phytogeograph-ical realm is greater than Africa [364] (Jolly et al., 1998a),Europe [41] (Prentice et al., 1996b), Russia and Mongolia[98] (Tarasov et al., 1998a) and China [68] (Yu et al., 1998),however this number will be biased by sampling intensityand density and some of these previous applications only fo-cuses on the numerically important taxa.
2.2 Biomisation
Prentice et al. (1996a) and Prentice and Webb (1998) havedocumented the steps involved in the biomisation technique.First, a conceptual framework for PFTs and biomes in LatinAmerican vegetation was developed by investigating the re-lationship between potential biomes and three environmen-tal gradients. The environmental gradients considered weremoisture availability (α: Priestley-Taylor coefficient of plantavailable moisture), temperature (MTCO: mean temperatureof the coldest month) and seasonal warmth (GDD: growingdegree-days). Similarly to the biomes, but at a finer ecologi-cal resolution, the spatial distribution of PFTs is determinedby environmental controls on plant growth form and eco-logical tolerance (Woodward, 1987). In Latin America the
Clim. Past, 5, 725–767, 2009 www.clim-past.net/5/725/2009/

R. Marchant et al.: Pollen-based biome reconstructions for Latin America 741
dominant environmental gradients are temperature, primar-ily associated with altitude, moisture availability and season-ality. PFT definitions were modified from the classificationoriginally developed for the BIOME 1 model (Prentice et al.,1992, 1996a, b) taking into account schemes developed forother regions, particularly those that abut the Latin Ameri-can region or contain similar floristic elements (Jolly et al.,1998a; Pickett et al., 2004; Takahara et al., 2001 Elenga etal., 2000; Thompson and Anderson, 2000; Yu et al., 2000).Five main groups of PFT were distinguished: these contain-ing tropical (non-frost tolerant), coniferous (needle-leaved),temperate (frost tolerant), xerophytic (drought tolerant), andfrost and drought tolerant taxa (Table 1, Fig. 6). This lat-ter group is present in cold dry conditions of southern SouthAmerica and the high Andes. A sixth “miscellaneous” grouprepresents various life forms with restricted diagnostic value.The Latin American flora was divided into 25 PFTs (Ta-ble 1) that, although being of ecologically distinct, can bemultiply assigned to the biomes (Table 2). The classifica-tion is based on the original scheme devised for the Biome-1 vegetation model (Prentice et al., 1992) and modificationthrough regional applications to pollen data. Where possi-ble the scheme devised for Latin America conforms to exist-ing classification and definitions. However, some of the spe-cific vegetation types in Latin America were not adequatelycovered by the existing range so two new PFTs (heath andcushion plants) were added. To aid in the separation of theAfrican forest/savanna boundary, Jolly et al. (1998a) subdi-vided the tropical raingreen trees PFT (Tr) into three groups.In the case of Latin America, it was decided that the overlap(taxa being multiply assigned to the PFTs) between the PFTswould be too great, and the distinction somewhat minimal.Furthermore, the tropical xerophytic trees and shrubs PFTencompass many taxa that would be assigned to the driesttropical raingreen category. Therefore, the Tr PFT was sub-divided into “wet” (Tr1) and “dry” (Tr2) tropical raingreentrees.
The cornerstone of research concerned with the composi-tion and distribution of Latin American vegetation, be it ina contemporary time frame, or one that aims to work in thepast, is a good understanding of the ecology and distributionof the taxa concerned. The Latin American pollen taxa wereassigned to one or more PFTs depending on the modern eco-logical range of the most important (i.e. most abundant) taxaresponsible for producing the pollen identifiable within themodern data set. These assignments were made followingreference to the known biology of plants from several floras(Rzedowski, 1983; Schofield, 1984; Wingenroth and Suarez,1984; Kahn and de Granville, 1992; Gentry, 1993; Maberly,1993; Seibert, 1996), botanical and palynological studies(Beard, 1955; van der Hammen, 1963; 1972; Wijmstra andvan der Hammen, 1966; Eiten, 1972; Cleef and Hooghiem-stra, 1984; Hooghiemstra and Cleef, 1984; Pires and Prance,1985; Prance, 1985; Cuatrecasas and Barreto, 1988; Brownand Lugo, 1990; Bush, 1991; Dov Par, 1992; Kappelle, 1993;
Duivenvoorden and Cleef, 1994; Witte, 1994; Armesto etal., 1995; Harley, 1995; Kappelle, 1995; Kershaw and Mc-Glone, 1995; Veblen et al., 1995; Colinvaux, 1996; Grabherr,1997; Hooghiemstra and van der Hammen, 1998) and per-sonal communication with modern ecologists and palaeoe-cologists. Much of this information has been collated intoa dictionary on the distribution and ecology of parent taxaof pollen lodged within the Latin American Pollen Database(Marchant et al., 2002c). The resultant taxon vs. PFT assign-ments are presented in Table 4. Due to the high intra-genericdiversity, and also the wide range of ecology’s exhibited bythe parent taxa present within some genera, a number of taxawere multiply assigned to a number of PFTs; where possi-ble, pollen taxa were assigned to the PFTs within which theparent taxa are most common.
Thus, the identified PFTs from Latin America are de-scribed by the suite of pollen taxa assigned to them, in turnthe biomes are distinguished by the suite of constituent PFTs(Table 5). A number of pollen taxa belong to more than onePFT (Table 4), and, as is the case with the potential vegeta-tion, most PFTs contribute to more than one biome (Table 5).Two problems can arise here for our analysis that can be cir-cumvented by manipulation of the input matrices and outputbiome affinity scores (the numerical sum computed for thepollen spectra for each sample this is equal to the sum ofthe square root of the percentages of the pollen types). First,pollen samples can have equal maximum affinity with morethan one biome; this commonly occurs when the PFTs char-acteristic of one biome are a subset of another biome. As-signing the biomes so that subsets always come first in theanalysis solves the problem. A second problem arises wheremultiple samples fall within the time window we are inter-ested in. Multiple samples from a single site may have max-imum affinity to a number of different biomes; the chance ofthis is high when the score of the “best” biome is close tothat of the next “best” and the dominant biome switches be-tween the top scoring biomes. In such cases, the “majority”biome is mapped. For example, site A contains eight sampleswithin the time frame of 6000±50014C yr BP, five sampleshave the greatest affinity to biome 1, two samples to biome2 and one sample to biome 3. The result is that biome 1 ismapped for site A at 6000±50014C yr BP. This situation isnot ideal as it masks the transient nature of the ecosystemto environmental shifts, however, this is a problem with thebiomisation technique and can be overcome at a single site orfew sites by mapping the biome scores rather than the mostdominant biome (Marchant et al 2002a, b).
To enable a definition of the biomes to be based on biocli-matic data the climate space encompassed by Latin Amer-ica (as abstracted from the climate data set of Leemansand Cramer, 1991) was used to plot plant available mois-ture (α) against a temperature gradient (MTCO). This plotwas used to map the locational range of the biomes and toidentify the location of the sites used in the analysis wherethere are pollen data for each of the three time periods in
www.clim-past.net/5/725/2009/ Clim. Past, 5, 725–767, 2009

742 R. Marchant et al.: Pollen-based biome reconstructions for Latin America
two-dimensional bioclimatic space (Fig. 5). Two immedi-ate issues are apparent from this plot – firstly there is a biasof sites with anα of 1 within Latin America and a poten-tially different measure of moisture could provide some def-inition in this area of the plot. Secondly, as would be ex-pected, there is little desert bioclimatic space in Latin Amer-ica and no pollen sites located in this area of the plot. Thetwelve biomes identified within Latin America (Table 2) aredesigned to incorporate the range of major vegetation typesand ensure consistency with previous areas to undergo theprocess within the BIOME-6000 community. Biomes werereconstructed from pollen data at sites with surface sample,trap and radiocarbon-dated core-top data. The results wereused to produce a modern pollen-derived biome dot map(Fig. 7); for each site a colour dot records the reconstructedbiome with the highest affinity score. These were comparedsite by site, with the potential modern vegetation distribution(Fig. 2). The biomisation procedure was applied to the fossildatasets without modification. Results for all sites and peri-ods are provided in Table 6 which allows a site-by-site com-parison through time and a comparison between the modernreconstruction and potential vegetation.
3 Results
3.1 Modern pollen vs. potential biome reconstruction
Visual comparison shows that the biomes reconstructed frommodern pollen data (Fig. 7) reflect the broad features in thepotential vegetation map (Fig. 2). In particular the mod-ern reconstruction reproduces the transition from relativelymesic vegetation types, around the coastal areas of SouthAmerica, to the more xeric biomes towards the interior.For example, in eastern Argentina there is a transition fromsteppe to xerophytic woods and scrub. Warm temperate rainforest is an important biome in the southern and southeast-ern Brazilian highlands, with tropical dry forest being re-constructed towards the interior. Notable from this regionis the large number of different biomes being reconstructedin a relatively small area. In part this reflects the variabil-ity of potential vegetation, not portrayed in our relativelycoarse resolution vegetation map (Fig. 2). For example, asite recording tropical rain forest reflects the sites’ lowlandposition where it is characterised by moist gallery forest witha number of typical rain forest taxa present. Steppe is cor-rectly reconstructed from the grasslands of south-eastern Ar-gentina and dry forest in central Argentina, mirroring thetransition to “drought-deciduous thorn forests” of central Ar-gentina (Schmithusen, 1976). Steppe is assigned farther westat approximately 1000 m in the Andes, southernmost SouthAmerica and northeast Brazil. The vegetation of southernSouth America is dominated by cool temperate rain for-est. The failure of the analysis to pick up the transitionfrom cool temperate rain forest to cool grass/shrubland as
one progresses east along Tierra del Fuego stems from thepollen spectra having a relatively large amount ofNothofaguspollen. Moving northwards from southern South Americathere is a transition to cool mixed forest, cool grass/shrublandand steppe; these latter assignments are particularly associ-ated with eastern flanks of the Cordillera de los Andes.
The concentration of sites along the Andes results in awide range of reconstructed biomes being geographically ad-jacent to each other when mapped in two-dimensional space(Fig. 7). This phenomenon is most apparent in the north-ern Andes where the altitudinal, and therefore climatic gra-dients are at their steepest. Despite these rapid environmentalchanges, the biome assignments reflect the changing vegeta-tion patterns (Table 6). There is an altitudinal transition withlow altitudes (<300 m) being mainly assigned to the trop-ical rain forest, tropical dry forest, tropical seasonal forestand steppe. Sites located at mid altitudes are described bya number of different biomes including tropical seasonal for-est, warm mixed forest, cool mixed forest and cool temperaterain forest. Within this wide range of warm temperate rainforest and tropical seasonal forest are commonly assignedat lower elevations (Fig. 7, Table 6). Many of the sites athigh altitude have a high affinity to the cool grass/shrublandbiome. The line of the Andes can be easily seen by the coolgrass/shrubland biome assignments, these being commonlyrecorded at sites above 3800 m. The warm temperate rain for-est is assigned at lower elevations and is analogous to Andeanforest, being dominated byPodocarpus, QuercusandWein-manniacomprises a different forest type to that assigned insouthern and southeast Brazil or southern South America. Amixture of biomes presently characterises the Amazon Basinwith only four sites recording the tropical rain forest biome;two of these are in coastal locations. Tropical seasonal forestis recorded in four locations; this representing a slightly driertype of forest than tropical rain forest, containing some de-ciduous taxa. A number of “Amazonian” sites record warmtemperate rain forest, these assignments responding to thepresence of Andean floristic elements within lowland vege-tation. There are a number of sites that record tropical dryforest, this being relatively widespread, e.g. on Easter Island,lowland Colombia and the Brazilian interior. Warm temper-ate rain forest describes the majority of the sites in the Pana-manian and southern Costa Rican isthmus with warm mixedforest, being commonly at higher altitudes. This is an areawhere the comparison between the observed and predictedbiomes shows a discrepancy; the possible reasons behind thiswill be discussed fully. Warm mixed forest is correctly as-signed to the highlands of central and southern Mexico as istropical dry forest in southern Mexico.
Investigating the correspondence between the pollen-based reconstruction and the potential vegetation for in-dividual biomes provides a check on the methodology,particularly the construction of the matrices. The coolgrass/shrubland biome is accurately reconstructed at the ma-jority of sites. The sites that do not match the potential
Clim. Past, 5, 725–767, 2009 www.clim-past.net/5/725/2009/

R. Marchant et al.: Pollen-based biome reconstructions for Latin America 743
Table 4. Latin American pollen taxa used in the biomisation analysis and their assignment to the plant functional types (PFTs).
PFT Codes Pollen Taxa
g Poaceae.
man Acrostichum-type, Avicennia, Laguncularia, Rhizophora.
tx Alsophila, Alstroemeria, Cnemidaria, Cyathea, Dicksonia, Nephelea.
Tr1 Alibertia, Anacardiaceae,Andira-type, Astronium, Bauhinia, Bombacaceae,Bougainvillea, Caesalpineae,Casearia-type, Clematis, Coccoloba, Copaifera, Didymopanax, Eugenia, Euterpe, Goupia-type, Guapira, Heliocarpus, Hura,Hieronima, Hippocrateaceae,Ipomoea, Laplacea, Lecythidaceae, Leguminoseae, Loranthaceae,Macharium, Macrolo-bium, Malpighiaceae, Malvaceae,Maytenus, Ocotea-type, Pera, Phyllostylon, Piper, Pisonia, Psychotria, Rubiaceae,Rutaceae,Salix, Sapium, Simira, Siparuna, Spirotheca, Spondias, Symplocos, Tecoma, Trema, Xylosma, Zanthoxylum.
Tr2 Acacia, Alchornea, Alibertia, Andira-type, Anacardiaceae, Apocynaceae,Astronium, Banisteriopsis, Bauhinia, Bom-bacaceae,Bougainvillea, Brosimum, Brunellia, Bulnesia, Bumelia-type, Bursera, Byrsonima, Caesalpineae, Celas-traceae,Chrysophyllum, Clematis, Combretaceae,Copaifera, Cordia, Coriaria, Cuphea, Curatella, Didymopanax,Elaeocarpaceae,Eryngium, Erythrina, Euterpe, Gallesia, Guapira, Hieronima, Hura, Hymenophylleace,Ipomoea, Lo-ranthaceae, Malvaceae,Maytenus, Melastomataceae, Meliaceae,Mimosa, Passiflora, Pera, Phyllostylon, Piper, Piso-nia, Protium, Pseudobombax, Rhamnaceae, Rutaceae,Salix, Sapium, Schinus, Simira, Siparuna, Spirotheca, Spondias,Styrax, Symplocos, Tiliaceae,Trema, Xylosma, Zanthoxylum.
Te1 Abutilon, Actinostemon concolor, Alchornea, Amanoa, Apeiba, Apocynaceae, Araliaceae, Arecaceae,Arrabidaea, As-pidosperma, Astrocarium, Begoniaceae, Bignoniaceae, Bombacaceae,Bonamia, Brosimum, Brunellia, Brownea, Cal-liandra, Campomanesia, Cardiospermum, Castilla, Cecropia, Cedrela, Celtis, Copaifera, Coprosma, Cucurbitaceae,Cunoniaceae,Dalbergia, Dioclea, Doliocarpus, Elaeagia, Euterpe, Ficus, Flacourtiaceae,Forsterania, Geonoma,Guapira, Guazuma, Guarea, Hura, Ilex, Inga, Iriartea, Iva xanthifolia-type, Lecythidaceae, Leguminoseae,Lica-nia, Mabea, Macharium, Macrolobium, Macrocarpea, Malpighiaceae,Mauritia, Marcgraviaceae,Maripa, Marat-tia, Matayba, Melastomatacae, Meliaceae,Miconia, Moraceae,Myrsine, Myrtaceae,Mauritiella, Nyctaginaceae,Ochnaceae,Ocotea-type, Oenocarpus, Oreopanax, Palmae,Panopsis, Parahancornia, Passiflora, Plenckia, Protium,Pseudopanax laetevirens, Rauvolfia, Rhipsalis, Rubiaceae, Sapotaceae,Scheelea, Scleronema, Socratea, Sloanea,Solanaceae,Sophora, Strutanthus, Symphonia, Swartzia, Taperira, Ternstroemiacf. T . brasiliensis, Tetrochiduim,Tetraploa aristata, Thymelaeaceae, Tiliaceae,Trichilia, Trigonia, Vismia, Warsewiczia.
Te2 Abutilon, Acacia, Aegiphila, Alibertia, Apeiba, Apocynaceae,Aspidosperma, Boraginaceae,Bougainvillea, Brosimum,Brunellia, Calliandra, Cecropia, Cedrela, Celtis, Combretaceae,Croton, Cucurbitaceae,Dalbergia, Didymopanax, Dio-clea, Forsterania, Hippocrateaceae,Humiria, Humulus, Ilex, Iriartea, Leguminoseae,Macrolobium, Mauritia, Melas-tomataceae,Miconia, Moraceae,Mysine, Myrtaceae, Ochnaceae,Ocotea-type, Palmae,Panopsis, Passiflora, Plenckia,Pseudopanax, Psychotria, Sapotaceae,Scleronema, Serjania, Sophora, Strutanthus, Swartzia, Taperira, Tiliaceae,Vis-mia, Warsewiczia.
wtc Abies, Araucaria, Juniperus, Pinus.
ctc2 Abies, Araucaria, Araucaria augustifolia, Cupressaceae,Dacrydium, Juniperus, Pilgerodendron, Podocarpus, Prumno-pitys andina, Saxegothaea conspicua.
ctc1 Austrocedrus chilensis, Cupressaceae,Dacrydium, Fitzroya cupressoides-type, Pilgerodendron, Pinus, Podocarpus,Prumnopitys andina, Saxegothaea conspicua, Taxodium.
txts Acacia, Aeschynomene, Agave, Anthurium, Aphelandra, Arrabidaea, Atamisquea, Ayenia, Bursera, Byrsonima, Byt-tneria, Cabomba, Cactaceae,Caryocar, Cayaponia, Cercidium, Chomelia, Chrysophyllum, Chuquiragua, Cissus, Clu-sia, Combretaceae, Convolvulaceae,Cordia, Cuphea, Curatella, Dodonaea, Echinodorus, Eichhornia, Evolvulus, Hip-pocrateaceae,Humulus, Hyptis, Ipomoea, Larrea, Lithraea, Malpighiaceae,Manihot, Maprounea, Menispermaceae,Metopium, Miconia, Mimosa cf M.taimbensis, Palicourea, Peperommia, Phaseolus, Phyllanthus, Polygala, Polylepis-Acaena, Pouteria, Portulaccaceae undiff.,Prosopis, Rhamnaceae,Sapium, Schefflera, Schinus, Sebastiana, Serjania,Solanaceae,Sloanea, Stryphnodendron, Tecoma, Trixis, Zornia.
h Arenaria, Aristotelia, Asteraceae, Berberidaceae,Berberis, Empetrum, Ericaceae,Sisyrinchium-type.
ds Agave, Atamisquea, Cactaceae,Ephedra, Monttea aphylla.
df Alternanthera, Ephedra, Monttea aphylla, Xyris.
www.clim-past.net/5/725/2009/ Clim. Past, 5, 725–767, 2009
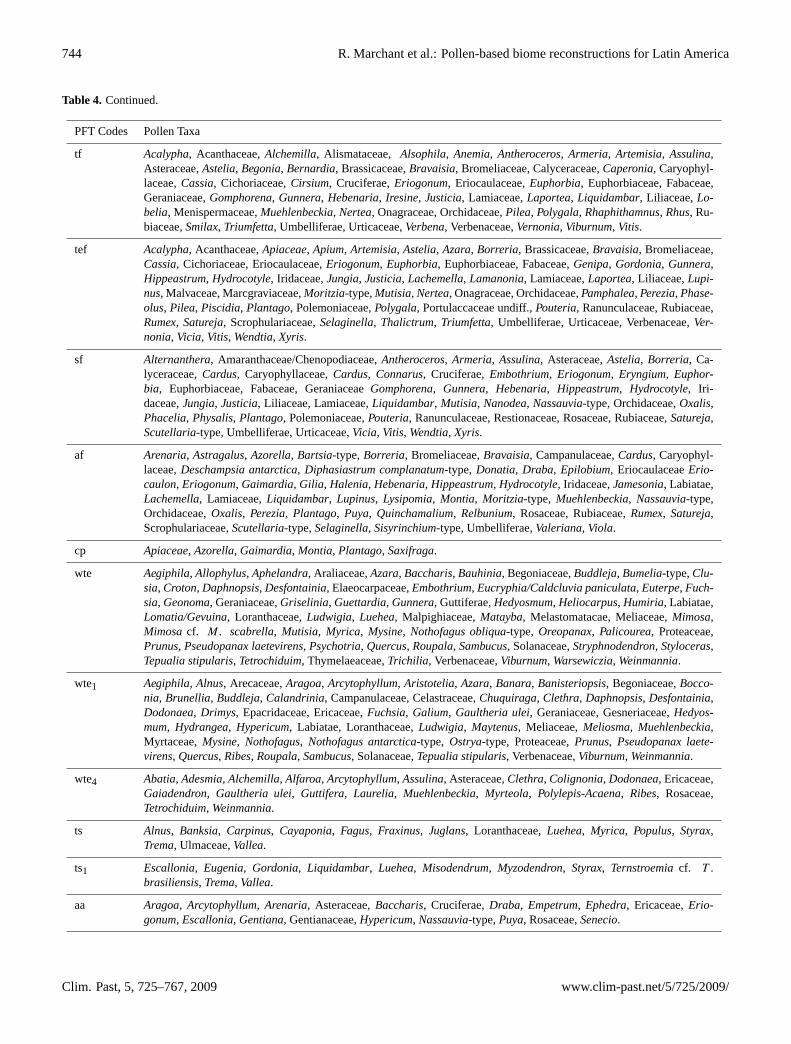
744 R. Marchant et al.: Pollen-based biome reconstructions for Latin America
Table 4. Continued.
PFT Codes Pollen Taxa
tf Acalypha, Acanthaceae,Alchemilla, Alismataceae,Alsophila, Anemia, Antheroceros, Armeria, Artemisia, Assulina,Asteraceae,Astelia, Begonia, Bernardia, Brassicaceae,Bravaisia, Bromeliaceae, Calyceraceae,Caperonia, Caryophyl-laceae,Cassia, Cichoriaceae,Cirsium, Cruciferae,Eriogonum, Eriocaulaceae,Euphorbia, Euphorbiaceae, Fabaceae,Geraniaceae,Gomphorena, Gunnera, Hebenaria, Iresine, Justicia, Lamiaceae,Laportea, Liquidambar, Liliaceae,Lo-belia, Menispermaceae,Muehlenbeckia, Nertea, Onagraceae, Orchidaceae,Pilea, Polygala, Rhaphithamnus, Rhus, Ru-biaceae,Smilax, Triumfetta, Umbelliferae, Urticaceae,Verbena, Verbenaceae,Vernonia, Viburnum, Vitis.
tef Acalypha, Acanthaceae,Apiaceae, Apium, Artemisia, Astelia, Azara, Borreria, Brassicaceae,Bravaisia, Bromeliaceae,Cassia, Cichoriaceae, Eriocaulaceae,Eriogonum, Euphorbia, Euphorbiaceae, Fabaceae,Genipa, Gordonia, Gunnera,Hippeastrum, Hydrocotyle, Iridaceae,Jungia, Justicia, Lachemella, Lamanonia, Lamiaceae,Laportea, Liliaceae,Lupi-nus, Malvaceae, Marcgraviaceae,Moritzia-type,Mutisia, Nertea, Onagraceae, Orchidaceae,Pamphalea, Perezia, Phase-olus, Pilea, Piscidia, Plantago, Polemoniaceae,Polygala, Portulaccaceae undiff.,Pouteria, Ranunculaceae, Rubiaceae,Rumex, Satureja, Scrophulariaceae,Selaginella, Thalictrum, Triumfetta, Umbelliferae, Urticaceae, Verbenaceae,Ver-nonia, Vicia, Vitis, Wendtia, Xyris.
sf Alternanthera, Amaranthaceae/Chenopodiaceae,Antheroceros, Armeria, Assulina, Asteraceae,Astelia, Borreria, Ca-lyceraceae,Cardus, Caryophyllaceae,Cardus, Connarus, Cruciferae,Embothrium, Eriogonum, Eryngium, Euphor-bia, Euphorbiaceae, Fabaceae, GeraniaceaeGomphorena, Gunnera, Hebenaria, Hippeastrum, Hydrocotyle, Iri-daceae,Jungia, Justicia, Liliaceae, Lamiaceae,Liquidambar, Mutisia, Nanodea, Nassauvia-type, Orchidaceae,Oxalis,Phacelia, Physalis, Plantago, Polemoniaceae,Pouteria, Ranunculaceae, Restionaceae, Rosaceae, Rubiaceae,Satureja,Scutellaria-type, Umbelliferae, Urticaceae,Vicia, Vitis, Wendtia, Xyris.
af Arenaria, Astragalus, Azorella, Bartsia-type,Borreria, Bromeliaceae,Bravaisia, Campanulaceae,Cardus, Caryophyl-laceae,Deschampsia antarctica, Diphasiastrum complanatum-type, Donatia, Draba, Epilobium, EriocaulaceaeErio-caulon, Eriogonum, Gaimardia, Gilia, Halenia, Hebenaria, Hippeastrum, Hydrocotyle, Iridaceae,Jamesonia, Labiatae,Lachemella, Lamiaceae,Liquidambar, Lupinus, Lysipomia, Montia, Moritzia-type, Muehlenbeckia, Nassauvia-type,Orchidaceae,Oxalis, Perezia, Plantago, Puya, Quinchamalium, Relbunium, Rosaceae, Rubiaceae,Rumex, Satureja,Scrophulariaceae,Scutellaria-type,Selaginella, Sisyrinchium-type, Umbelliferae,Valeriana, Viola.
cp Apiaceae, Azorella, Gaimardia, Montia, Plantago, Saxifraga.
wte Aegiphila, Allophylus, Aphelandra, Araliaceae,Azara, Baccharis, Bauhinia, Begoniaceae,Buddleja, Bumelia-type,Clu-sia, Croton, Daphnopsis, Desfontainia, Elaeocarpaceae,Embothrium, Eucryphia/Caldcluvia paniculata, Euterpe, Fuch-sia, Geonoma, Geraniaceae,Griselinia, Guettardia, Gunnera, Guttiferae,Hedyosmum, Heliocarpus, Humiria, Labiatae,Lomatia/Gevuina, Loranthaceae,Ludwigia, Luehea, Malpighiaceae,Matayba, Melastomatacae, Meliaceae,Mimosa,Mimosacf. M. scabrella, Mutisia, Myrica, Mysine, Nothofagus obliqua-type, Oreopanax, Palicourea, Proteaceae,Prunus, Pseudopanax laetevirens, Psychotria, Quercus, Roupala, Sambucus, Solanaceae,Stryphnodendron, Styloceras,Tepualia stipularis, Tetrochiduim, Thymelaeaceae,Trichilia, Verbenaceae,Viburnum, Warsewiczia, Weinmannia.
wte1 Aegiphila, Alnus, Arecaceae,Aragoa, Arcytophyllum, Aristotelia, Azara, Banara, Banisteriopsis, Begoniaceae,Bocco-nia, Brunellia, Buddleja, Calandrinia, Campanulaceae, Celastraceae,Chuquiraga, Clethra, Daphnopsis, Desfontainia,Dodonaea, Drimys, Epacridaceae, Ericaceae,Fuchsia, Galium, Gaultheria ulei, Geraniaceae, Gesneriaceae,Hedyos-mum, Hydrangea, Hypericum, Labiatae, Loranthaceae,Ludwigia, Maytenus, Meliaceae,Meliosma, Muehlenbeckia,Myrtaceae,Mysine, Nothofagus, Nothofagus antarctica-type, Ostrya-type, Proteaceae,Prunus, Pseudopanax laete-virens, Quercus, Ribes, Roupala, Sambucus, Solanaceae,Tepualia stipularis, Verbenaceae,Viburnum, Weinmannia.
wte4 Abatia, Adesmia, Alchemilla, Alfaroa, Arcytophyllum, Assulina, Asteraceae,Clethra, Colignonia, Dodonaea, Ericaceae,Gaiadendron, Gaultheria ulei, Guttifera, Laurelia, Muehlenbeckia, Myrteola, Polylepis-Acaena, Ribes, Rosaceae,Tetrochiduim, Weinmannia.
ts Alnus, Banksia, Carpinus, Cayaponia, Fagus, Fraxinus, Juglans, Loranthaceae,Luehea, Myrica, Populus, Styrax,Trema, Ulmaceae,Vallea.
ts1 Escallonia, Eugenia, Gordonia, Liquidambar, Luehea, Misodendrum, Myzodendron, Styrax, Ternstroemiacf. T .brasiliensis, Trema, Vallea.
aa Aragoa, Arcytophyllum, Arenaria, Asteraceae,Baccharis, Cruciferae,Draba, Empetrum, Ephedra, Ericaceae,Erio-gonum, Escallonia, Gentiana, Gentianaceae,Hypericum, Nassauvia-type,Puya, Rosaceae,Senecio.
Clim. Past, 5, 725–767, 2009 www.clim-past.net/5/725/2009/

R. Marchant et al.: Pollen-based biome reconstructions for Latin America 745
-10
-5
0
5
10 15
20
25
30
0 0.1 0.2 0.3 0.4 0.5 0.6 0.7 0.8 0.9 1(Alpha) clim pollen
TRFO
WTRF
CTRF
TSFO
WEFO
WAMF
COMI
XERO
DESE
CGSH
STEP
TDFO
Moisture
Temperature
(MTC
O)
Figure 5. Theoretical biome scheme for Latin America portrayed on a grid of environmental space along the gradients of temperature (mean temperature of the coldest month) and plant available moisture (alpha). Grey fields reflect the climate space in 100 x 100 km grid cells from Mexico to Patagonia as derived from Leemans and Crammer (1991). The location of sites where pollen data is used for the translation to biomes across Latin America are shown as red triangles.
Fig. 5. Theoretical biome scheme for Latin America portrayed on a grid of environmental space along the gradients of temperature (meantemperature of the coldest month) and plant available moisture (alpha). Grey fields reflect the climate space in 100×100 km grid cells fromMexico to Patagonia as derived from Leemans and Crammer (1991). The location of sites where pollen data is used for the reconstruction ofbiomes across Latin America are shown as red triangles.
Table 5. Assignment of Latin American plant functional types toBiomes.
CODES Plant functional types
TRFO man, tx, Te1, Te2, tfTSFO tx, Tr1, Tr2, Te2, tfTDFO Tr2, tf, txts, dfWTRF tx, Tr1, Te1, wtc, ctc2, tef, wteWEFO tx, Tr2, wtc, ctc2, ec, tef, wteCTRF tx, h, ctc1, tef, wte, wte1WAMF Tr2, wtc, tef, wte, tsCOMI ctc1, tef, wte1, wte4, ts1STEP sfDESE ds, dfCGSH af, aa, wte4, hCGSS af, aa, cp
vegetation commonly result from the inclusion of high al-titude arboreal pollen, this resulting in assignments of coolmixed forest and cool temperate rain forest. The other com-mon assignment is towards steppe; the dominance of thepollen spectra by Poaceae, and lack of shrubby taxa, resultin the assignment to the steppe biome. Indeed, the affinityscores to the cool grass/shrubland and steppe biome at mostsites, where one of these biomes is dominant, is normallyquite close. For the cool mixed forest biome 66% of sitesaccurately reconstruct the potential vegetation. The 34% of“wrong” assignments mainly result in either a reconstructionof cool grass/shrubland, thought to represent possible forestclearance, and the dominance of the vegetation by grassland,
or cool temperate rain forest biome due to the numerousshared taxa between these two biomes. 75% of cool tem-perate rain forest biome reconstructions match the potentialvegetation at the site. The remaining 25% of the sites mainlyshow either warm mixed forest or warm temperate rain forestassignments. For the tropical dry forest biome some 90% ofthe sites accurately reflect the potential vegetation at the site.For the remaining 10% of “wrong” assignments the commonresult is towards a cool temperate rain forest or steppe. Forthe tropical rain forest biome 85% of the sites accurately re-flect the potential vegetation. For the sites that do not match,a common reconstruction is warm temperate rain forest. Thiscan be explained by the number of Andean elements beingpresent within lowland tropical forests with a couple of sitesreconstructing the closely related biome of tropical seasonalforest. This facet of the pollen data is also exemplified by anumber (35%) of the tropical seasonal forest sites recordingthe warm temperate rain forest biome. Warm evergreen for-est is correctly assigned at 80% of the sites. Warm temperaterain forest is assigned correctly at 78% of sites. 75% of thesites that do not reconstruct this biome “correctly” lead toassignments of tropical rainforest and tropical seasonal for-est at low altitudes (<500 m) and cool mixed forest at high(>2000 m).
The generally correct biome assignments, in relation to amap of potential vegetation confirm the robustness of our ap-plication of the biomisation method to Latin America. Wherethe match between pollen and potential vegetation recon-structions is relatively low (tropical seasonal forest and warmtemperate rain forest), then a common forcing factor, thatof “high altitude” plants presently growing at low altitudes
www.clim-past.net/5/725/2009/ Clim. Past, 5, 725–767, 2009

746 R. Marchant et al.: Pollen-based biome reconstructions for Latin America
Table 6. Site locations showing biome changes from the present, 6000±500 and 18 000±100014C yr BP. The relationship between thepresent observed biome and the biome reconstructed from the modern pollen data is also shown.
Site Long. Latitude Alt. Present biome Modern 6000 18 000
LakeAsa3 −61.13 −62.62 35 CGSH CGSHHarberton −67.16 −54.88 20 STEP STEP STEPPuerto del Hambre −70.92 −53.59 5 CTRF CTRF CTRFLa Mision −67.83 −53.5 5 STEP STEP STEPPunta Arenas −70.97 −53.15 75 CTRF CTRF CTRF CGSHMeseta Latorre 1 −72.05 −51.52 980 CGSH COMI CTRFMeseta Latorre 2 −72.03 −51.44 1000 CGSH COMI CGSHTorres del Paine −72.66 −50.98 100 CTRF CTRF TDFOMoreno Glacier Bog −73.00 −50.46 200 CTRF CTRF COMIPatagonia −72.90 −50.25 50 CTRF CTRFPatagonia −72.90 −50.20 20 CTRF CTRFPatagonia −72.70 −50.20 80 CTRF CTRFPatagonia −72.00 −50.15 150 CTRF CTRFPatagonia −71.70 −50.15 180 CTRF CTRFPatagonia −71.50 −50.15 180 CTRF CTRFPatagonia −71.10 −50.15 180 CTRF CTRFPatagonia −69.90 −50.15 180 CTRF CTRFPatagonia −69.30 −50.15 180 CTRF CTRFPatagonia −71.30 −50.15 190 CTRF CTRFPatagonia −70.90 −50.15 190 CTRF CTRFPatagonia −70.20 −50.15 190 CTRF CTRFPatagonia −69.60 −50.15 190 CTRF CTRFPatagonia −72.98 −50.15 20 CTRF CTRFPatagonia −70.50 −50.15 200 CTRF CTRFPatagonia −72.95 −50.15 50 CTRF CTRFPatagonia −72.90 −50.15 50 CTRF CTRFPatagonia −72.85 −50.15 60 CTRF CTRFPatagonia −72.75 −50.15 60 CTRF CTRFPatagonia −72.80 −50.15 70 CTRF CTRFPatagonia −72.55 −50.10 100 CTRF CTRFPatagonia −71.95 −50.10 180 CTRF CTRFPatagonia −69.00 −50.10 190 CTRF CTRFPatagonia −68.90 −50.05 100 CTRF CTRFPatagonia −72.00 −50.05 150 CTRF CTRFPatagonia −72.90 −50.05 50 CTRF CTRFPatagonia −68.60 −50.05 50 CTRF CTRFPatagonia −68.10 −50.00 0 CTRF CTRFPatagonia −68.30 −50.00 20 CTRF CTRFDichan −73.88 −49.66 50 CTRF CTRF CTRFPuerto Eden −74.41 −49.13 50 CTRF CTRF CTRFLa Esperanza −72.83 −46.63 330 CTRF CTRFLagoBsAs −71.45 −46.44 230 CTRF WAMFLaguna Six Minutes −74.33 −46.43 50 CTRF CTRF CTRF CTRFLaguna Stibnite −74.43 −46.43 50 CTRF CTRF CGSHLaguna Stibnite −74.38 −46.43 50 CTRF CTRF CTRF CGSHPico Salam −67.43 −45.42 637 STEP STEPLaguna Lincoln −74.07 −45.34 50 CTRF CTRF CTRF CGSHLaguna Lofel −74.43 −44.85 50 CTRF CTRF CTRF CGSHEstero Huitanque −73.82 −43.61 52 CTRF CTRF COMIAustroEsqu −71.47 −42.66 1100 CTRF CTRFMayol −73.75 −42.64 75 CTRF CTRF CTRFPuchilco −73.62 −42.63 110 CTRF CTRF CTRFAlercesNor −71.60 −42.56 800 CTRF CGSHSan Pedro −73.95 −42.25 650 CTRF CTRFChepu −73.66 −42.17 140 CTRF CTRF
Clim. Past, 5, 725–767, 2009 www.clim-past.net/5/725/2009/

R. Marchant et al.: Pollen-based biome reconstructions for Latin America 747
Table 6. Continued.
Site Long. Latitude Alt. Present biome Modern 6000 18 000
Mallin Book −71.58 −41.33 800 CTRF COMI CTRFComallo −70.21 −41.01 815 CGSH STEPPuerto Octay PM13 −72.90 −40.93 120 CTRF CTRF CTRF COMIEspuma −63.25 −40.67 50 TDFO TDFOPrimavera −71.18 −40.66 800 CTRF CGSH TDFOEncantado −71.13 −40.66 960 CTRF COMIRuta 3.4 −62.79 −40.50 20 STEP STEPRuta 3.3 −62.59 −40.08 20 STEP STEPCaunahue −72.00 −40.00 500 CTRF CTRFRuta 250.19 −65.58 −39.54 117 STEP STEPPedro Luro −62.53 −39.50 20 STEP STEPOrigone −62.43 −39.08 20 STEP STEPGaviotas −63.65 −39.07 90 TDFO TDFOSalina Anzotegui −63.77 −39.06 −5 STEP STEP STEPCueva Haichol −70.66 −38.58 1050 STEP STEP STEPArroyo Sauce Chico −62.23 −38.07 85 STEP STEPCerro La China −58.64 −37.84 200 STEP TDFO TDFOEmpalme Querandıes −60.65 −37.00 105 STEP STEP TDFOVeranada Pelan −70.38 −36.88 1860 CGSH CGSH TDFOVaca Lauquen −71.08 −36.83 1450 CTRF COMI CGSHVeranada Vulkanpickel −70.41 −36.68 2800 CGSH STEP TDFOSalado −69.75 −35.33 3200 CGSH CGSHSalina 2 −69.33 −32.25 2000 CGSH STEP STEPSerra do Rio Rastro −49.55 −28.55 1420 WTRF WTRF CGSHMorro da Igreja −49.86 −28.18 1800 WTRF WTRF WTRFSerra da Boa Vista −49.15 −27.70 1160 WTRF WTRF CTRFRano Kao −109.43 −27.18 110 TDFO TDFORano Raraku Bore 3 −109.28 −27.16 75 TDFO TDFO TDFO TDFORano Aroui −109.40 −27.08 425 TDFO TDFO CGSH WTRFPoco Grande −48.86 −26.41 10 WTRF WTRFReserva Volta Velha −48.38 −26.04 0 WTRF WTRFAtlantic −48.35 −25.95 200 WTRF WTRFColombo −49.23 −25.33 920 TSFO TSFOSerra Campos Gerais −50.21 −24.66 1200 WTRF WAMF TDFOAguilar −65.75 −23.83 4000 CGSH CTRF STEPRio da Curua −48.83 −23.83 800 WTRF TRFOTumbre 2 −67.78 −23.31 3880 CGSH CGSH STEPAguas Calientas −67.42 −23.08 4210 CGSH CGSH CGSHBotucatu −48.00 −23.00 700 WTRF WTRFCurcuab −48.00 −23.00 700 WTRF WTRFLagoa da Caco −43.43 −22.97 5 TDFO TDFO STEPMorro de Itapeva −45.63 −22.78 1850 WTRF WEFO TDFO CGSHAssis −50.50 −22.68 540 TSFO TSFOLagoa Santa −47.45 −22.36 630 TDFO TDFOBauru −49.07 −22.32 570 TSFO TSFOBrotas −48.08 −22.29 700 WTRF WTRFSalitre −46.78 −19.00 1050 WTRF WTRF TDFO CGSHAjata −69.20 −18.25 4700 CGSH CGSHSajama −68.88 −18.16 4250 CGSH CGSHLago do Pires −42.21 −17.95 390 TSFO TSFO TSFOWasa Mayu −65.91 −17.54 2720 COMI CGSH STEPCrominia −49.45 −17.28 200 TDFO TDFO TSFO TDFOMt. Blanco −67.35 −17.02 4780 CGSS CGSSLake Huinamimarca −69.00 −16.50 3765 CGSH CGSH CGSH CGSSCerro Calvario −68.50 −16.50 3950 CGSH CGSH CGSH
www.clim-past.net/5/725/2009/ Clim. Past, 5, 725–767, 2009

748 R. Marchant et al.: Pollen-based biome reconstructions for Latin America
Table 6. Continued.
Site Long. Latitude Alt. Present biome Modern 6000 18 000
Rio Kaluyo −68.13 −16.43 4070 CGSH CGSH STEPChacaltaya 1 −68.13 −16.36 4750 CGSH CGSH CGSHCumre Unduavi −68.03 −16.33 4620 CGSS CGSS CGSSRio Jequitinhonha −38.92 −15.85 80 TDFO TDFOBrasilia 1 −47.66 −15.59 1030 TDFO CTRFAguads Emendadas −47.58 −15.56 200 TDFO CTRF TSFO CGSHCuiaba −55.86 −15.35 350 TDFO TDFOAmarete −68.98 −15.23 4000 CGSH CGSH CGSHCotapampa −69.11 −15.21 4450 CGSH CGSH CGSHKatantica −69.18 −14.8 4820 CGSH CGSH CGSHLaguna Chaplin −61.05 −14.50 750 TSFO TSFO TDFO TSFORio de Contas −39.00 −14.28 80 TDFO STEPLaguna Bella Vista −61.56 −13.58 750 TSFO TSFO TSFO TDFOLaguna Jeronimo −75.21 −11.78 4450 CGSH CGSH CGSHLaguna Pomacocha −75.50 −11.75 4450 CGSH CGSH CGSHLaguna Paca −75.50 −11.71 3600 CGSH CTRFLaguna Tuctua −75.00 −11.66 4250 CGSH COMI WTRFLaguna Milloc −76.35 −11.56 4325 CGSH CGSH CGSHLaguna Junin2 −76.18 −11.00 4100 CGSH COMI COMI CGSHLaguna Huatacocha −76.55 −10.76 4500 CGSH CGSH CGSHRio Sao Francisco −43.00 −10.46 400 TDFO TDFO TSFOSaquinho −43.23 −10.44 480 TSFO TSFO WEFORio Sao Francisco −36.50 −10.26 80 TDFO STEPKatira −63.00 −9.00 750 TDFO TDFO TDFO TDFOCampina Grande I −35.75 −7.23 70 TSFO STEPLagoa Grande −47.45 −7.08 75 TDFO CTRFPicos −41.40 −7.06 70 TDFO WTRFLago Bolim −35.18 −6.04 90 TDFO STEPRio Protengi −35.25 −5.78 80 TDFO CTRFMirim −35.30 −5.68 70 TDFO STEPRio Mirim −35.40 −5.64 70 TDFO WTRFRio (unclear) −38.00 −5.50 50 TDFO CTRFCarajas −48.00 −5.00 150 TSFO TSFO TSFO TSFOCiudad Universitaria X −74.18 −4.75 2560 COMI COMI WAMF WAMFRio Jaguaribe II −37.76 −4.55 50 TDFO TDFORio Jaguaribe I −37.75 −4.43 50 TDFO STEPLake Surucucho −78.95 −3.75 970 WTRF CTRF WTRFAyauch −78.13 −2.09 550 WTRF WTRF TSFOLlaviucu −79.43 −1.83 3120 CTRF WTRFIndanza −78.83 −1.53 2100 CTRF WTRFKumpack −78.51 −1.53 700 WTRF WTRFPuyo Bog −79.06 −1.43 953 WTRF WTRFRum Tum −79.03 −1.13 2392 CTRF WTRFYambo −79.03 −1.03 2600 CTRF WTRFLago Crispim −48.00 −0.8 0 TRFO STEP TSFOLagoa da Curuca2 −47.85 −0.76 35 TRFO TRFO TRFOMariname-II −72.03 −0.66 160 TRFO TRFO WTRFMonica-1 −72.50 −0.60 160 TRFO TRFO TRFOAnangucocha −77.03 −0.53 280 TRFO WTRFLimoncocha −76.66 −0.38 230 TRFO CTRFCayambe −78.03 −0.03 4350 CGSH CGSH CGSHLago Agrio −77.03 0.03 330 TRFO WTRFSan Marcos −79.03 0.03 3400 CGSH TDFOSanta Cecilia −77.03 0.04 330 TRFO WTRFLake Santa Cecilia −77.02 0.06 330 TRFO TRFOCuyabeno −77.01 0.08 280 TRFO WTRF
Clim. Past, 5, 725–767, 2009 www.clim-past.net/5/725/2009/

R. Marchant et al.: Pollen-based biome reconstructions for Latin America 749
Table 6. Continued.
Site Long. Latitude Alt. Present biome Modern 6000 18 000
Cunro −79.03 0.08 2800 CTRF WTRFMera −76.92 0.11 1100 WTRF WTRFLake Agrio −76.92 0.11 330 TRFO TRFOYaguara cocha −79.03 0.13 2210 CTRF WTRFLa Pata −66.66 0.25 300 TRFO TSFO WTRF WTRFLagoa das Patas −66.68 0.26 300 TRFO WTRF TSFO WTRFPiusbi −77.89 1.66 200 TRFO TRFO TRFOPitalito −76.50 1.75 1300 WEFO WEFO TSFOPiagua −76.50 2.30 1700 WEFO WEFO WEFOPantano de Genagra −76.50 2.50 1750 WEFO TDFO WEFORio Timbio −76.50 2.50 1750 WEFO WEFO WEFOEl Camito −76.60 2.53 50 TRFO TRFOLoma Linda −73.35 3.22 310 TDFO TDFO TDFOLago Agua Sucia −73.54 3.46 260 TDFO TDFO STEPEl Gobernador −75.00 3.95 3815 CTRF CTRF WTRFLa Guitarra −74.28 4.00 3450 COMI COMI CTRFLa Primavera −74.13 4.00 3525 CGSH CGSH COMICorazon Partido −74.25 4.00 4100 CGSH CGSHEl Trinagulo −74.25 4.00 4100 CGSH CGSHCarimagua −74.14 4.04 180 TDFO TDFO CGSSLa Rabona −74.25 4.05 4000 CGSH CGSH CTRFEl Pinal −70.40 4.09 185 TDFO TDFO TDFO TDFOAlsacia −74.11 4.09 3100 COMI WAMF COMIAndabobos −74.15 4.09 3570 CGSH CGSH CGSHUbaque −73.55 4.33 2000 WEFO WEFODe la America −74.00 4.33 3550 CGSH CGSH CTRFTurbera de Calostros −73.48 4.41 3730 CGSH CGSHLaguna Angel −70.54 4.45 205 TDFO TSFO TDFOLibano −75.50 4.50 1820 WEFO WEFO COMIde Pedro Palo III −74.41 4.50 2000 COMI WTRF WTRFParamo Palacio −73.88 4.76 3550 CGSH CGSH CGSHGreja −73.70 4.86 4000 CGSH CGSH CGSHSardinas −69.45 4.95 180 TDFO TDFO TDFOHerrera −73.91 5.00 2000 COMI CGSH COMI CTRFAgua Blanca −74.45 5.0 3250 COMI COMI CTRF CGSHEl Abra II −73.96 5.02 2570 COMI CTRF CTRFParamo de Pena Negra −74.09 5.09 3625 CGSH CGSH COMIODP site 932 −47.03 5.18 0 TRFO WTRF WTRF TSFOComprida −47.63 5.18 130 WTRF WTRF TRFOGeral −47.53 5.18 130 WTRF WTRF TRFOParamo de Laguna Verde −74.00 5.25 3625 CGSH CGSH CGSHFuquene II −73.87 5.50 2580 COMI CGSH CTRF CTRFJotaordo −76.66 5.66 0 TRFO TRFOCienaga del Visitador −72.83 6.13 3300 COMI COMI CGSHBobos −72.85 6.13 3800 CGSH CGSHCiega I −72.31 6.50 3510 COMI CTRFValle de Lagunillas −72.34 6.50 3880 CGSH CGSH CTRFCana, Darien −77.58 7.68 1000 TSFO TSFOCana Swamp −77.59 7.74 500 TRFO TRFOWodehouse Swamp −77.58 7.75 500 TRFO TRFOLa Chonta −82.00 8.00 2310 CTRF CTRF COMI WAMFEl Valle −79.78 8.43 500 TSFO TSFO TDFOLa Yeguada, −80.78 8.43 650 TSFO TSFO TSFOCerro Campana −79.93 8.63 800 WTRF WTRFQuebrada Nelson −82.31 8.66 1130 WTRF WTRFLaguna Volcan −82.75 8.75 1500 WTRF WAMF
www.clim-past.net/5/725/2009/ Clim. Past, 5, 725–767, 2009
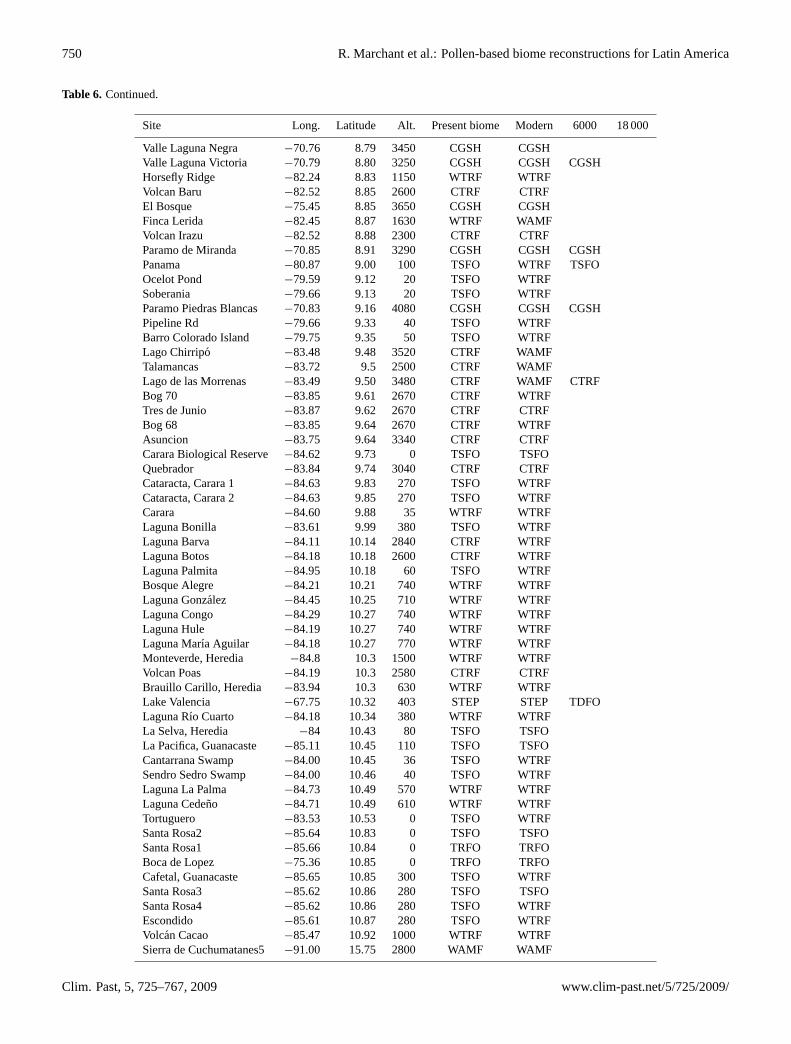
750 R. Marchant et al.: Pollen-based biome reconstructions for Latin America
Table 6. Continued.
Site Long. Latitude Alt. Present biome Modern 6000 18 000
Valle Laguna Negra −70.76 8.79 3450 CGSH CGSHValle Laguna Victoria −70.79 8.80 3250 CGSH CGSH CGSHHorsefly Ridge −82.24 8.83 1150 WTRF WTRFVolcan Baru −82.52 8.85 2600 CTRF CTRFEl Bosque −75.45 8.85 3650 CGSH CGSHFinca Lerida −82.45 8.87 1630 WTRF WAMFVolcan Irazu −82.52 8.88 2300 CTRF CTRFParamo de Miranda −70.85 8.91 3290 CGSH CGSH CGSHPanama −80.87 9.00 100 TSFO WTRF TSFOOcelot Pond −79.59 9.12 20 TSFO WTRFSoberania −79.66 9.13 20 TSFO WTRFParamo Piedras Blancas −70.83 9.16 4080 CGSH CGSH CGSHPipeline Rd −79.66 9.33 40 TSFO WTRFBarro Colorado Island −79.75 9.35 50 TSFO WTRFLago Chirripo −83.48 9.48 3520 CTRF WAMFTalamancas −83.72 9.5 2500 CTRF WAMFLago de las Morrenas −83.49 9.50 3480 CTRF WAMF CTRFBog 70 −83.85 9.61 2670 CTRF WTRFTres de Junio −83.87 9.62 2670 CTRF CTRFBog 68 −83.85 9.64 2670 CTRF WTRFAsuncion −83.75 9.64 3340 CTRF CTRFCarara Biological Reserve −84.62 9.73 0 TSFO TSFOQuebrador −83.84 9.74 3040 CTRF CTRFCataracta, Carara 1 −84.63 9.83 270 TSFO WTRFCataracta, Carara 2 −84.63 9.85 270 TSFO WTRFCarara −84.60 9.88 35 WTRF WTRFLaguna Bonilla −83.61 9.99 380 TSFO WTRFLaguna Barva −84.11 10.14 2840 CTRF WTRFLaguna Botos −84.18 10.18 2600 CTRF WTRFLaguna Palmita −84.95 10.18 60 TSFO WTRFBosque Alegre −84.21 10.21 740 WTRF WTRFLaguna Gonzalez −84.45 10.25 710 WTRF WTRFLaguna Congo −84.29 10.27 740 WTRF WTRFLaguna Hule −84.19 10.27 740 WTRF WTRFLaguna Marıa Aguilar −84.18 10.27 770 WTRF WTRFMonteverde, Heredia −84.8 10.3 1500 WTRF WTRFVolcan Poas −84.19 10.3 2580 CTRF CTRFBrauillo Carillo, Heredia −83.94 10.3 630 WTRF WTRFLake Valencia −67.75 10.32 403 STEP STEP TDFOLaguna Rıo Cuarto −84.18 10.34 380 WTRF WTRFLa Selva, Heredia −84 10.43 80 TSFO TSFOLa Pacifica, Guanacaste −85.11 10.45 110 TSFO TSFOCantarrana Swamp −84.00 10.45 36 TSFO WTRFSendro Sedro Swamp −84.00 10.46 40 TSFO WTRFLaguna La Palma −84.73 10.49 570 WTRF WTRFLaguna Cedeno −84.71 10.49 610 WTRF WTRFTortuguero −83.53 10.53 0 TSFO WTRFSanta Rosa2 −85.64 10.83 0 TSFO TSFOSanta Rosa1 −85.66 10.84 0 TRFO TRFOBoca de Lopez −75.36 10.85 0 TRFO TRFOCafetal, Guanacaste −85.65 10.85 300 TSFO WTRFSanta Rosa3 −85.62 10.86 280 TSFO TSFOSanta Rosa4 −85.62 10.86 280 TSFO WTRFEscondido −85.61 10.87 280 TSFO WTRFVolcan Cacao −85.47 10.92 1000 WTRF WTRFSierra de Cuchumatanes5 −91.00 15.75 2800 WAMF WAMF
Clim. Past, 5, 725–767, 2009 www.clim-past.net/5/725/2009/
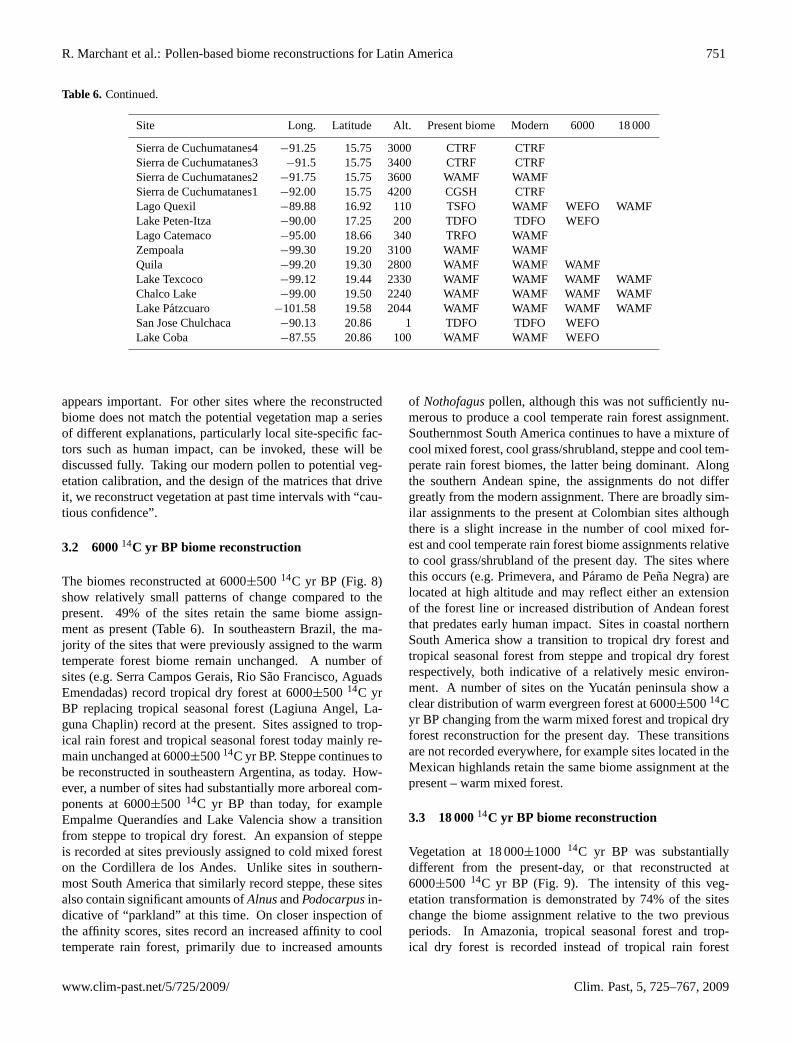
R. Marchant et al.: Pollen-based biome reconstructions for Latin America 751
Table 6. Continued.
Site Long. Latitude Alt. Present biome Modern 6000 18 000
Sierra de Cuchumatanes4 −91.25 15.75 3000 CTRF CTRFSierra de Cuchumatanes3 −91.5 15.75 3400 CTRF CTRFSierra de Cuchumatanes2 −91.75 15.75 3600 WAMF WAMFSierra de Cuchumatanes1 −92.00 15.75 4200 CGSH CTRFLago Quexil −89.88 16.92 110 TSFO WAMF WEFO WAMFLake Peten-Itza −90.00 17.25 200 TDFO TDFO WEFOLago Catemaco −95.00 18.66 340 TRFO WAMFZempoala −99.30 19.20 3100 WAMF WAMFQuila −99.20 19.30 2800 WAMF WAMF WAMFLake Texcoco −99.12 19.44 2330 WAMF WAMF WAMF WAMFChalco Lake −99.00 19.50 2240 WAMF WAMF WAMF WAMFLake Patzcuaro −101.58 19.58 2044 WAMF WAMF WAMF WAMFSan Jose Chulchaca −90.13 20.86 1 TDFO TDFO WEFOLake Coba −87.55 20.86 100 WAMF WAMF WEFO
appears important. For other sites where the reconstructedbiome does not match the potential vegetation map a seriesof different explanations, particularly local site-specific fac-tors such as human impact, can be invoked, these will bediscussed fully. Taking our modern pollen to potential veg-etation calibration, and the design of the matrices that driveit, we reconstruct vegetation at past time intervals with “cau-tious confidence”.
3.2 600014C yr BP biome reconstruction
The biomes reconstructed at 6000±500 14C yr BP (Fig. 8)show relatively small patterns of change compared to thepresent. 49% of the sites retain the same biome assign-ment as present (Table 6). In southeastern Brazil, the ma-jority of the sites that were previously assigned to the warmtemperate forest biome remain unchanged. A number ofsites (e.g. Serra Campos Gerais, Rio Sao Francisco, AguadsEmendadas) record tropical dry forest at 6000±500 14C yrBP replacing tropical seasonal forest (Lagiuna Angel, La-guna Chaplin) record at the present. Sites assigned to trop-ical rain forest and tropical seasonal forest today mainly re-main unchanged at 6000±50014C yr BP. Steppe continues tobe reconstructed in southeastern Argentina, as today. How-ever, a number of sites had substantially more arboreal com-ponents at 6000±500 14C yr BP than today, for exampleEmpalme Querandıes and Lake Valencia show a transitionfrom steppe to tropical dry forest. An expansion of steppeis recorded at sites previously assigned to cold mixed foreston the Cordillera de los Andes. Unlike sites in southern-most South America that similarly record steppe, these sitesalso contain significant amounts ofAlnusandPodocarpusin-dicative of “parkland” at this time. On closer inspection ofthe affinity scores, sites record an increased affinity to cooltemperate rain forest, primarily due to increased amounts
of Nothofaguspollen, although this was not sufficiently nu-merous to produce a cool temperate rain forest assignment.Southernmost South America continues to have a mixture ofcool mixed forest, cool grass/shrubland, steppe and cool tem-perate rain forest biomes, the latter being dominant. Alongthe southern Andean spine, the assignments do not differgreatly from the modern assignment. There are broadly sim-ilar assignments to the present at Colombian sites althoughthere is a slight increase in the number of cool mixed for-est and cool temperate rain forest biome assignments relativeto cool grass/shrubland of the present day. The sites wherethis occurs (e.g. Primevera, and Paramo de Pena Negra) arelocated at high altitude and may reflect either an extensionof the forest line or increased distribution of Andean forestthat predates early human impact. Sites in coastal northernSouth America show a transition to tropical dry forest andtropical seasonal forest from steppe and tropical dry forestrespectively, both indicative of a relatively mesic environ-ment. A number of sites on the Yucatan peninsula show aclear distribution of warm evergreen forest at 6000±50014Cyr BP changing from the warm mixed forest and tropical dryforest reconstruction for the present day. These transitionsare not recorded everywhere, for example sites located in theMexican highlands retain the same biome assignment at thepresent – warm mixed forest.
3.3 18 00014C yr BP biome reconstruction
Vegetation at 18 000±1000 14C yr BP was substantiallydifferent from the present-day, or that reconstructed at6000±500 14C yr BP (Fig. 9). The intensity of this veg-etation transformation is demonstrated by 74% of the siteschange the biome assignment relative to the two previousperiods. In Amazonia, tropical seasonal forest and trop-ical dry forest is recorded instead of tropical rain forest
www.clim-past.net/5/725/2009/ Clim. Past, 5, 725–767, 2009

752 R. Marchant et al.: Pollen-based biome reconstructions for Latin America
a b c d
e f g h
i j k l
m n o p
q r s t
Figure 6. Latin America plant functional types: (tropical rain green tree (a), tropical evergreen tree (b), temperate summer-green tree (c), tropical xerophytic tree / shrub (d), arctic shrub (e), desert shrub (f), dry tropical rain green tree (h), desert shrub (i), tropical forb (i), mangrove (j), xerophytic forb (k), tropical forb (l), temperate forb (m, n), grass (o), alpine forb (p), aquatic (q), desert forb (r, s) grass (t).
a
Fig. 6. Latin America plant functional types: (tropical rain green tree(a), tropical evergreen tree(b), temperate summer-green tree(c), tropi-cal xerophytic tree/shrub(d), arctic shrub(e), desert shrub(f), dry tropical rain green tree(h), desert shrub(i), tropical forb(i), mangrove(j) ,xerophytic forb(k), tropical forb(l), temperate forb(m, n), grass(o), alpine forb(p), aquatic(q), desert forb(r, s) grass(t).
Clim. Past, 5, 725–767, 2009 www.clim-past.net/5/725/2009/

R. Marchant et al.: Pollen-based biome reconstructions for Latin America 753
Figure 7. Modern biomes reconstructed from surface pollen data (core top, trap, surface sediment) used to compare against the potential vegetation (Figure 2).
Fig. 7. Modern biomes reconstructed from surface pollen data (coretop, trap, surface sediment) used to compare against the potentialvegetation (Fig. 2).
Figure 8. Biome reconstruction at 6000 ± 500 14C yr BP from radiocarbon dated fossil pollen.
Fig. 8. Biome reconstruction at 6000±500 14C yr BP from radio-carbon dated fossil pollen.
or tropical seasonal forest reconstructed for the present.A site on the present southern Amazonian boundary (La-guna Chaplin) records tropical seasonal forest. Sites insouthern South America nearly all show a transition fromcool mixed forest biomes and cool mixed forest to coolgrass/shrubland and cool grassland. However, within thishomogenous reconstruction a number of sites have a rela-tively high affinity to the cool temperate rain forest biome,due to a mix ofDonartia and Nothofaguspollen: this ex-
Figure 9. Biome reconstruction at 18,000 ± 1000 14C yr BP from radiocarbon dated fossil pollen.
Fig. 9. Biome reconstruction at 18 000±100014C yr BP from ra-diocarbon dated fossil pollen.
plains why the northernmost site in this cluster records cooltemperate rain forest. Sites in southeastern Brazil record atransition from tropical dry forest to tropical seasonal for-est and cool grass/shrubland. Sites in Amazonia recordmainly tropical seasonal forest, warm temperate rain forestor steppe; this combination indicating relatively mesic for-est. In the Colombian lowlands, tropical dry forest continuesto be assigned whereas Colombian highland locations reflecta marked change from cool temperate rain forest and coolmixed forest to the cool grass/shrubland biome. Sites in Cen-tral America show a change from tropical seasonal forest totropical dry forest, e.g. El Valle. The Mexican highland sitesremain unchanged, continuing to support warm mixed forestwith the pollen records being dominated byPinusandQuer-cus.
4 Discussion and conclusions
4.1 Modern reconstruction
Previous applications of the biomisation method in Africa(Jolly et al., 1998a; Elenga et al., 2000), China (Yu etal., 1998, 2001), Australia (Pickett et al., 2004), EasternNorth America (Williams et al., 2000), Eurasia (Tarasov etal., 1998a), Europe (Prentice et al., 1996a, b; Tarasov etal., 1998a, b; Elenga et al., 2000), Japan (Takahara et al.,2001) and Western North America (Thompson and Ander-son, 2000) demonstrate that technique is able to translatemulti-site pollen data to coarse resolution vegetation recon-structions that works well over a range of vegetation types.The Latin American results presented here provide a furthertest of this ability. The ability of the biomisation method to
www.clim-past.net/5/725/2009/ Clim. Past, 5, 725–767, 2009

754 R. Marchant et al.: Pollen-based biome reconstructions for Latin America
reconstruct biomes derives in part from the relatively coarsevegetation classification (Fig. 2); which conceals significantintra-biome variation; for example, we do not distinguishsubtypes of the warm evergreen forest biome which containsAraucaria in southern and southeastern Brazil andPodocar-pus in the northern Andes. The success of the biomisa-tion technique is in part be due to reconstructions being car-ried out at a regional scale, allowing the methodology to beadapted to the local flora, bioclimatic gradients and pollenspectra. For example, the treatment ofQuercuspollen inLatin America is quite different from that in a Europeancontext. Similarly, in AfricaPodocarpusis assigned to thewarm temperate broad-leaved evergreen PFT (Jolly et al.,2001), although this taxon is a coniferous needle-leafed tree,in Latin America it is assigned to cool and intermediate tem-perate conifers. This regional focus also allows the pollento plant functional type allocations to be based on good eco-logical information concerned with environmental tolerancesto growth limits and an understanding of how representativethe pollen is of the surrounding vegetation. This is partic-ularly important as the pollen taxa identified to the genericlevel (the taxonomic level usually identified to) exhibit con-siderable plasticity in their growth form and environmentaltolerance. For example, within the genusCordia, commonlya woody shrub of open thorn woodland, of the northern An-des (Cleef and Hooghiemstra, 1984) two species ofCordiaare herbs in cerrado (Pereira et al., 1990; Sarmiento, 1975),the genus is also present (C. lomatolobaandC. sagotii) inAmazonianterra firmeforest and Guyanese lowland rain for-est (Steege, 1998). Furthermore the specific nature of pollenproduction, dispersal and incorporation into a sedimentaryenvironment exhibits considerable variability that is part de-pendent on site characteristic. All these factors have a bear-ing on the results and need to be considered in the designingof the input matrices into the biomisation process and inter-pretation of results.
Biomes are mainly accurately reconstructed for thepresent-day even though large areas of Latin America arecovered with vegetation that has been altered by a long his-tory of human land use (Behling, 1996; Binford et al., 1987;Fjeldsa, 1992; Gnecco and Mohammed, 1994; Gnecco andMora, 1997; Marchant et al., 2004; Northrop and Horn,1996). One possible reason for this may relate to the na-ture of the “modern” samples. Within our analysis the mod-ern samples are largely derived from sedimentary columnsrather than surface trap pollen data, and hence they may stemfrom the last 500 years and be reflective of a period priorto intensive human-induced change. However, the signal ofvegetation clearance does impact on the modern reconstruc-tion as shown by the large number of sites recording coolgrass/shrubland, particularly at lower and mid-altitudes thatshould support cool mixed forest or cool temperate rain for-est. These assignments are thought to result from humanimpact with the pollen spectra being dominated by Poaceaeand hence recording more open vegetation. To quantify the
nature of this impact, it is possible to tailor the biomisationmethodology to include elements of the pollen spectra, suchas agricultural and ruderal taxa, that may indicate humanimpact (Marchant et al., 2002). The ability to reconstructpotential, rather than actual vegetation, may also relate tothe type of impact; although spatially relatively widespread,forest clearance is often only partial with many localisedpatches of forest and secondary vegetation remaining. Thisresults in the floristic composition of the remaining vegeta-tion, in palynological terms at least, closely reflecting theoriginal vegetation composition. For example, the forest sur-rounding the Fuquene-II site is a successional type of for-est whereas the natural vegetation would be a Andean for-est type dominated byQuercusandWeimanniamixed withCroton, OreopanaxandPhyllanthus(Van Geel and Van derHammen, 1973). In addition to the relatively coarse poten-tial vegetation and biome classification, mapping the highestbiome affinity score to each site as a single dot also allowsthe method to be relativity robust. Although this is suitablefor the relatively coarse reconstructions necessitated by thecontinental/sub-continental scale, when investigating a smallarea, more information can be preserved from the analy-sis. Indeed at a regional scale information on sub-dominatebiomes can be kept (Marchant et al., 2001a), new more de-fined biomes (Bigelow et al., 2003) or at a site-specific scalewhere the affinity scores to all the biomes can be retained(Marchant et al., 2001b, 2002b).
Despite the overall agreement between potential and re-constructed biomes a number of locations show anomalies.Due to the floristic and structural similarities between warmand cool grasslands (Tarasov et al., 1998a), grass-dominatedbiomes can be particularly difficult to distinguish from oneanother. Differentiation is possible by the other plants withinsteppe and cool grass/shrubland, although there remains ahigh affinity score to the cool grass/shrubland at low altitudeswith the reverse for the steppe biome at high altitudes. An-other facet is that some lowland sites show reconstructions ofhighland biomes, e.g. sites in central Panama and Amazoniarecording warm temperate rain forest. This result is drivenby the presence of genera that are typical of montane vege-tation, e.g.Hedyosmum, PodocarpusandQuercus. A possi-ble explanation for the presence of these highland elementsis that they are relictual; relatively isolated today they werepreviously much more widespread under the glacial climatenorm of the Quaternary. This suggestion is supported by thesimilarity, at a generic level, of the flora in highland Braziland the northeastern Andes, and the isolated patches of sa-vanna within Amazonian forest and the Brazilian cerrado.Furthermore, it is interesting that the presence of highlandelements appears to be greater when the moisture levels arehigh. For example, within the Choco Pacific region, whererainfall exceeds 15 000 mm yr−1, montane elements appearmore common than within Amazonia (Cleef, personal com-munication).
Clim. Past, 5, 725–767, 2009 www.clim-past.net/5/725/2009/

R. Marchant et al.: Pollen-based biome reconstructions for Latin America 755
Notwithstanding some of the anomalies mentioned, thebiomisation method applied to Latin American pollen datacan reconstruct large-scale vegetation patterns despite manypollen taxa having different ecological interpretations underdifferent environmental settings (Grabandt, 1980), represen-tation of parent vegetation by pollen likely to be subject tointer-annual variability (Behling et al., 1997b), and tropicalvegetation is difficult to reconstruct through pollen assem-blages (Bush, 1991; Mancini, 1993; Bush and Rivera, 1998;Behling et al., 1997). These factors demonstrate the impor-tance of basing the input matrices for the biomisation processon all the available ecological information that allowing forthe multiple assignment of the pollen taxa to the PFTs.
4.2 Late Quaternary biome change and palaeoenviron-mental interpretations
4.2.1 6000±50014C yr BP
Compared to the present, the sites at 6000±500 14C yrBP record either the same biome or one indicating morexeric vegetation. Dry environmental conditions in south-ern Brazil extend from the early Holocene until approxi-mately 450014C yr BP when there was an increase in ar-boreal taxa (Alexandre et al., 1999). Maximum aridity insoutheast Brazil was reached between approximately 6000and 500014C yr BP, prior to the transition to a modern cli-mate (Behling, 1997a). The driest phase in central Brazil isat approximately 500014C yr BP; relatively moist climateconditions similar to today setting in after 400014C yr BP(Ledru, 1993; Marchant and Hooghiemstra, 2004). Althoughfire has been proposed as being responsible for late Holocenevariation in the forest/savanna boundary in Brazil (Vernet etal., 1994; Desjardins et al., 1996; Horn, 1993), this relativearidity is thought to reflect an extended dry season duringthis period (Behling, 1997b). An extended dry season mayexplain whyAraucaria-dominated forest were still restrictedin their distribution relative to the modern day, not signifi-cantly increasing in range until approximately 300014C yrBP (Behling, 1997a). From our analysis the temporal per-spective is missing, hence, we are unable to indicate if thevegetation reflects a stable dry period, or a period wherethere are alternating periods of dry and humid climates linkedfor example to El Nino activity (Martin et al., 1993; Sifed-dine et al., 2001). A relatively dry phase is also recorded innorthwestern Argentina between 7500 and 580014C yr BP(Schabitz, 1991). Although pollen assemblages do not lendthemselves well to distinguishing moisture from temperaturechanges, stable hydrogen isotope analysis on mosses showthe vegetation of southern South America is highly sensitiveto changes in moisture regime (Pendall et al., 2001). The pre-dominance of steppe in southeastern Argentina agrees withthe reconstruction by Prieto (1996): steppe characterisingthe area between 7000 and 500014C yr BP. Locally highmoisture levels at sites closer to the Atlantic Ocean (Prieto,
1996) may explain why sites under strongest maritime in-fluence (Aguads Emendadas, Cerro La China) changes fromsteppe to tropical dry forest as the local environment is ableto support more arboreal taxa. In soutwestern Patagonia asustained increase inNothofaguspollen has been detectedfrom around 6800 yr BP thought to result from locally in-creased moisture levels (Villa-Martinez and Moreno, 2007)Locally increased moisture levels in this part of Latin Amer-ica during the mid Holocene are though to stem from inten-sification of the southern Westerlies (Gilli et al., 2005).
Farther west, cool temperate rain forest assignments indi-cate a similar climatic regime and the maintenance of Val-divian rain forest (Villigran, 1988). A dry phase is alsorecorded at many Andean sites, for example, in northernChile desiccation of the Puna ecosystem is recorded between8000 and 650014C yr BP (Baied and Wheeler, 1993; Vil-ligran, 1988). In lowland Chile, the period of maximumaridity occurred between 9400 and 760014C yr BP withdrier than present conditions continuing until 500014C yr BP(Heusser, 1982), this could explain the increased presence ofsteppe at sites along the southern Andes. On the central Pe-ruvian Andes, a dry warm climate was encountered between7000 and 400014C yr BP (Hansen et al., 1994).δ18O mea-surements from an ice core record taken from highland Perushow that mid-Holocene climatic warming and drying wasrecorded from 8200 to 520014C yr BP with maximum arid-ity between 6500 to 520014C yr BP (Thompson et al., 1995).Farther north on the Bolivian Andes, a dry phase is recordedfrom approximately 550014C yr BP (Abbot et al., 1997). Theslight increase in the number of arboreal biome assignmentsat northern Andean sites can be interpreted as an up-slopeshift of forest line. This conforms to the suggestion based onpollen data by van Geel and van der Hammen (1973) that thevegetation zones in the northern Andes were several hundredof meters higher than the present at approximately 600014Cyr BP. Relatively dry conditions have also been indicated forlowland Colombia for the mid-Holocene although the onsetof dry conditions varied considerably between sites – occur-ring between 6500 and 450014C yr BP (Behling et al., 1999).Added complexity is caused by steep environmental gradi-ents associated with non-climatic factors. For example, thepresence of the tropical dry forest biome in lowland Colom-bia, e.g. the catchment of El Pinal, results from a combina-tion of strongly seasonal conditions at present and locallystrong edaphic influence (Behling and Hooghiemstra, 1999).
Farther north, the assignment of Lake Valencia to the trop-ical dry forest is in agreement with the site-specific interpre-tation that more arboreal taxa (Bursera, Piper and Trema)were present after approximately 10 00014C yr BP due tothe onset of a more humid climate (Bradbury et al., 1981):these tropical raingreen taxa are indicative of a seasonal cli-mate with relatively dry conditions. This appears to be a re-gional signal as early Holocene evergreen forests of northernVenezuela were replaced by semi-deciduous elements duringthe mid-Holocene (Leyden, 1984). Enhanced precipitation
www.clim-past.net/5/725/2009/ Clim. Past, 5, 725–767, 2009

756 R. Marchant et al.: Pollen-based biome reconstructions for Latin America
over Central America would have been accompanied by anorthward shift of the ITCZ, enhanced southerlies and coolerequatorial sea surface temperatures (Harrison et al., 2003).Low lake levels in central Panama also indicate that environ-mental conditions at this period were more xeric (Piperno etal., 1991b; Bush et al., 1992) whereas sites on the Yucatanpeninsula show a shift to warm evergreen forest where thewarmer conditions that characterise the early Holocene per-sisted until approximately 650014C yr BP (Brown, 1985).This result may stem from locally high moisture levels as aresult of maritime influence, a similar mechanism having be-ing proposed to explain a comparable shift in coastal Braziland Argentina. Despite the majority of the evidence for amid-Holocene dry period, there still remains a debate aboutthe intensity, and even the occurrence, of this. Salgado-Labouriau et al. (1998) suggests that most savanna areaswere characterised by increased rainfall between 7000 and6000 14C yr BP although there is considerable variation inthe timing of the onset of more humid conditions so it maybe that such a mesic period falls outside our temporal win-dow.
One of the main mechanisms used to explain moistureshifts is fluctuations in the Southern Oscillation and the mi-gration of the ITCZ (Martin et al., 1997). Martin et al. (1997)suggests that during the mid-Holocene, the ITCZ was lo-cated farther north than its present-day position (Fig. 1) –this would produce a summer rainfall deficit and increasedwinter precipitation; in short greater seasonality. Rather thanchanges in the median position of the ITCZ, changes in thecharacter of the ITCZ oscillation, such as greater latitudinalrange for annual migration, can be invoked to explain veg-etation changes (Behling and Hooghiemstra, 2001). How-ever, due to the topographical influence of the Andes and theconvergence of westerly and easterly winds, the ITCZ hasa sinusoidal profile over northern South America (Fig. 1).Therefore, moisture changes over northeastern South Amer-ica are likely to result from the importance of convectivemoisture sources; reduced precipitation, particularly in midlatitude western South America, following reduced intensityof westerly climate systems. It is also possible that episodicdry events that presently occur in South America in relationto sea-surface temperature anomalies of the Pacific Ocean(ENSO) were more frequent in the mid-Holocene (Markgraf,1998). This later suggestion may also have led to the in-creased fire frequency indicated in southeast Brazil (Alexan-dre et al., 1999).
The spatial relationship between Latin American andAfrica (Servant et al., 1993; Jolly et al., 1998a) warrants fur-ther investigation (Marchant and Hooghiemstra, 2004). Aparticular target for the investigation could be the impact andfeedbacks of vegetation changes on climate. For example,large changes in African vegetation about the Sahel are sug-gested to have been important in influencing Indian monsoondynamic (Doherty et al., 2000). Such a phenomena of veg-etation feedbacks on the climate system appears weaker in
South America than in Africa although it is likely to havehad an impact as yet unqualified. Certainly Latin Americawould benefit from targeted model applications in the sameway that has been applied to Africa (Kubatzki and Claussen,1998; Doherty et al., 2000). This modelling of climate dy-namics Latin American represents a special challenge for cli-mate models and modellers (Valdes, 2000) primarily due tothe steep environmental gradients and rapid transition fromone biome to another (Fig. 2).
4.2.2 18 000±100014C yr BP
The dating of the LGM in Latin America can be problem-atic (Bush et al., 1990; Hooghiemstra et al., 1992; Ledru etal., 1996, 1998; Sifeddine et al., 2001); late Pleistocene sed-iments often containing sedimentary gaps at, or about, theLGM (Ledru et al., 1998), that are compounded by slow sed-imentation rates. These sedimentary constraints make char-acterisation of the LGM vegetation highly contentious andhave fuelled debates on LGM climates spanning two decades(Hooghiemstra and van der Hammen, 1998; Colinvaux et al.,2000; Thomas, 2000). Indeed, it has been suggested thatsome of the sites used in our analysis do not contain a sedi-mentary record of the LGM (Ledru et al., 1998) although dueto application of a 2000 year-wide time window, we are ableto include some of these sites with contentious sediments.
The LGM in Latin America, like most of the tropics,was characterised by a cold dry climate (Gonzalez et al.,2008) with temperature reduced by about 4◦C and precipi-tation by about 30% (Farrera et al., 1999). Ice caps werepresent on the southern tip of South America which spreadonto the plains and the coastal area (Heine, 1995). Evi-dence from glacial moraines also indicates considerable ex-pansion of Andean glaciers (Hollis and Schilling, 1981; Vil-lagran, 1988; Birkland et al., 1989; Seltzer, 1990; Thouretet al., 1997). Most of southern South America was char-acterised by an erosional environment; locations that wouldlater accumulate sediments were glaciated, or subject to flu-vial activity (Heine, 2000). This situation is recorded byice cores from the high Andes that contain large amountsof dust about the LGM, this being derived from surround-ing deflating desert areas (Thompson et al., 1995). Thiscold, arid environment is clearly reproduced by the vege-tation which shows a transformation from the cool temper-ate rain forest to the cool grass/shrubland biome. AlthoughNothofagus-dominated forest is thought to have been extir-polated from coastal Chile at the LGM (Hollis and Schilling,1981), fossil beetle assemblages in basal peat from PuertoEden (49◦ S, 74◦ W) indicate thatNothofagus-dominated for-est survived glaciation within the Chilean channels (Ash-worth et al., 1991). An earlier date of deglaciation of theTaitao Peninsula indicates there was relatively local migra-tion from Chiloe Island that may explain the rapid re-growthof Nothofagus-dominated forest (Lumley and Switsur, 1993).Along the Chilean Pacific coast the present cool evergreen
Clim. Past, 5, 725–767, 2009 www.clim-past.net/5/725/2009/

R. Marchant et al.: Pollen-based biome reconstructions for Latin America 757
forest was shifted approximately 5◦ northwards relative tothe present day; not as a discrete forest type but as a park-land type vegetation mosaic (Villagran, 1988), not form-ing closed forests until the early Holocene (Schabitz, 1994;Heusser, 1995). This vegetation is evidenced with the analy-sis presented here by the northernmost site (Laguna Six Min-utes) recording cool temperate rain forest. However, it isunlikely this represents closed forest persisting in the area,trees being present within a woodland/steppe vegetation mo-saic (Villagran, 1988). The rate of spreading of this forestinto the Holocene would probably have been strongly depen-dent on the density of the parent plants from the initial seed-ing fraction (Huntingford et al., 2000). The maintenance ofcool temperate rain forest taxa, albeit at relatively low lev-els, may result from high moisture levels as recorded by highlake stands at this time (Markgraf et al., 2000). These mayreflect outbreaks of polar air and subsequent generation oflow-pressure systems in the western Atlantic; combined withlower temperatures this situation would lead to a positive wa-ter balance. Indeed, the presence of relatively local moisturesources would have been important at the LGM and allowus to explain regional patterns of biome change outside theinfluence of the ITCZ migrations (Markgraf et al., 2000).
Considering the sites along the northern Andes, it is clearfrom the vegetation that climate was colder during the LGM,reductions up to 12◦C may have been reached at very highaltitudes (Thompson et al., 1995). A substantial tempera-ture depression during the last glacial period is mirrored bya significant impact on the vegetation composition and dis-tribution. From our analysis it is apparent that the tree linewas significantly lower at the LGM, concordant with a sug-gested lowering of vegetation zones by approximately 1000to 1500 m relative to the present-day position (Monslave,1985; Wille et al., 2001). At lower elevations in westernColombia, a more conservative depression of the vegetationhas been suggested from Timbio (Wille et al., 2000). In-deed, the spatial character of the cooling and drying in theNeotropics is still under debate (Markgraf, 1993; Colinvaux,1996; Hooghiemstra and Van der Hammen, 1998; Farrera etal., 1999; Boom et al., 2002). Greater temperature changeat high altitudes compared with those at low altitudes and atthe sea surface (CLIMAP, 1976) can be explained in termsof changes in lapse rate (Bush et al., 1990; Peyron et al.,2000; Wille et al., 2001) or compression of vegetation belts(Van der Hammen and Absy, 1994). The lapse-rate gradientis partly influenced by atmospheric moisture levels (Barryand Chorley, 1990). As precipitation was reduced at theLGM, an overall steeper lapse rate, particularly at higher al-titudes where moisture reductions would have been highest,seems likely (Wille et al., 2001). The extent to which lapse-rate changes can be used to explain spatially different sig-nals from the data must be used with caution, particularlyas most palaeoclimatic reconstructions have been carried outwith some kind of modern analogue approach (Farrera et al.,1999). These reconstructions commonly do not take into ac-
count non-climatic parameters which would impact on vege-tation composition and distribution such as volcanic activity(Kuhry, 1988), fire (Cavelier et al., 1998; Rull, 1999), UV-B insolation (Flenley, 1998) or atmospheric composition, inparticular changing CO2 levels (Woodward and Bond, 2004).For example, concentrations of CO2 reduced to glacial levels(200 ppmV) have been shown to have a very significant im-pact on tropical vegetation (Jolly and Haxeltine, 1997; Boomet al., 2002; Marchant et al., 2002b; Wu et al., 2007a, b).
In south-east Brazil vegetation at the LGM was charac-terised by tropical dry forest and tropical seasonal forest;this latter vegetation type may have been restricted withindeep valleys and along waterways; site-specific recordsfrom southeast Brazil indicate open grasslands (campolimpo) with forest elements being retained as gallery for-est (Behling, 1997a). Some model reconstructions of globalvegetation patterns have indicated that there was an increasein warm evergreen forest in Brazil at the LGM at the ex-pense of tropical seasonal forest (Prentice et al., 1993). Thispattern of change is supported by the data presented herewhere plants generally found at high altitudes today weremore common in Amazonia at the LGM. Clapperton (1993)used geomorphic data to infer a very sparsely vegetated land-scape on the Brazilian Highlands, possibly relating to our re-construction of steppe for a site in eastern Brazil. However,the cool grass/shrubland biome appears to be a common typeof vegetation at this time. Cold climates in eastern SouthAmerica could have resulted from the incursion of polar coldfronts that would occasionally reach northwards of the equa-tor (Ledru, 1993; Behling and Hooghiemstra, 2001). Thisphenomenon could combine with equatorward shift of po-lar high-pressure areas and mid-latitude cyclones resultingin displacement and compression of the subtropical anticy-clone between mid latitudes westerlies (Dawson, 1992). Thisclimatic regime would result in more restricted migration ofthe ITCZ and pronounced aridity that would have been com-pounded by lower sea surface temperatures and associatedreduction in atmospheric moisture.
At altitudes of approximately 3000 m in northern Peruvegetation about the LGM comprised a mixture of wet andmoist montane forest elements with open woodland (Hansenand Rodbell, 1995); this vegetation association having nomodern analogue. Although the Andes remained relativelymoist at the LGM, particularly in the northern part wherethe concave shape of the mountain chain entrap moisturefrom the rising air (Fjeldsa et al., 1997), it is not certainwhat occurred in the lowland areas to the east of the Andes(Colinvaux, 1989; Colinvaux et al., 1997; Bush et al., 1990;Thouret et al., 1997). In the Colombian lowlands two sitesare characterised by the tropical dry forest biome, this agreeswith the suggestion from a pollen study at Rondonia that veryopen savanna characterised the catchment at the LGM (vander Hammen and Absy, 1994). Similarly, sparse vegetationcover would have been present on the Plateau of Mato Grosso(Servant et al., 1993) and is likely to have extended along the
www.clim-past.net/5/725/2009/ Clim. Past, 5, 725–767, 2009

758 R. Marchant et al.: Pollen-based biome reconstructions for Latin America
coastal areas of Guyana and Surinam (Wijmstra, 1971) – thisscenario is supported by our analysis, i.e. a site in lowlandPanama recording tropical seasonal forest. Although the ma-jority of the area presently covered by drier types of tropi-cal forest would probably have been replaced by more openwoodland at the LGM, environmental changes in savannas atthe LGM appear to have been spatially complex. Whetherthe drier, cooler, conditions resulted in restricted range forestrefugia cannot be answered from the available evidence al-though the vegetation appears heterogeneous as a mosaic ofAndean, savanna and tropical rain forest taxa combined. In-deed, this reiterates the suggestion by Colinvaux et al. (2001)and now widely accepted within the palaeoecological com-munity, that plants responded to Quaternary climate changesas individuals not as biomes. Therefore, to fully investigatevegetation response to climate change is necessary to retaininformation contained within the affinity scores to the sub-dominant biomes (Marchant et al., 2002), or to carry out theanalysis at the PFT level. Indeed this approach would al-low investigations into which elements of the vegetation wereparticularly sensitive to environmental change. Expansion ofsavanna could have been aided by reduced CO2 concentra-tions and the resultant competitive advantage attained by C4grasses over C3 plants (Haberle and Maslin, 1999; Marchantet al., 2002).
Within highland Mexico, warm mixed forest continues tobe reconstructed due to the presence ofPinusandQuercus-dominated forests. Although the same biome is recordedat all time periods, it unlikely to be analogous to presentday mixed forest; this was characterised by sparsely forestedtemperate scrub (Binford et al., 1987). This continued re-construction also could be demonstrating that certain loca-tions are unlikely to register a change due to their positionin bioclimatic space: those sites located far away from theboundaries of adjacent biomes would need a massive cli-matic change to result in an ecosystem shift. Such a situationhas clearly been shown for the Holocene where the sites toundergo biomisation show little change relative to the mod-ern (Ortega-Rosas et al., 2008a, b). Indeed, a site located innorthwestern Mexico records a transition from cool coniferforest to warm mixed forest about 6000 yr BP (Ortega-Rosaset al., 2008b). Similarly, a strong aridity signal is directlyrecorded by low lake levels in central Mexico due to reducednorthern excursion of the ITCZ, trade wind circulation, andensuing reduced oceanic-land moisture transfer (Markgraf etal., 2000) that would have been reflected in ecosystem re-sponse. For example, forest on the Pacific side of the CentralAmerica contained a mosaic of high and low altitude for-est species; a similarly novel type of forest has also beenshown for Mera, Ecuador (Liu and Colinvaux, 1985) andPeten, Guatemala (Leyden, 1984). Of the two sites thatrecord the warm evergreen forest biome at this period a sitein Guatemala was dominated by Chenopodiaceae,Juniperus,PinusandQuercus.
We have presented vegetation reconstructions throughoutLatin America at 6000±500 14C yr BP and 18 000±100014C yr BP using an objective method based on biomes, con-stituent PFTs that are described by a set of unique pollenspectra. As a unified methodology has been applied to thepollen data, this reconstruction of biomes provides an objec-tive basis for interpreting large-scale vegetation dynamics,and the environmental controls on these over the late Qua-ternary and can be used as a dataset for model-data com-parisons at 6000 and 18 000 yr BP. Changes at 6000±50014C yr BP, although relatively small, indicate a transition tomore xeric vegetation. The changes at 18 000±100014C yrBP are more homogenous and indicative of a cooler, drierclimate. These reconstructions are consistent with numer-ous site-specific interpretations of the pollen data. The suc-cess of the reconstruction has in part been determined by thecoarse resolution of biome definitions, and using the mostdominant biome for description and interpretation of the re-sults. To develop understanding of vegetation response toenvironmental change, and possible feedbacks, informationthat is presently redundant should be retained and the re-sults combined with climate/vegetation modelling initiatives.It is apparent from the relatively sparse coverage, in com-parison to Europe and North America, that the late Quater-nary vegetation history of the Neotropical phytogeographicalrealm remains still relatively poorly resolved despite its im-portance in model testing, developing biogeographical the-ory (Tuomisto and Ruokolainen, 1997), and understandingissues concerned with biodiversity and human-environmentinteractions. It has been shown that environmental changeis rarely spatially uniform and as such necessitates an evengreater number of sites to determine more precisely this com-plexity and the driving mechanisms behind this. New sites,located in key areas, combined with the application of arange of proxies of environmental change, are required to re-fine our understanding of Neotropical ecosystem responsesto late Quaternary climatic variations.
Acknowledgements.This research has been funded by theNetherlands Organisation for Scientific Research (NWO) underaward 750:198:08 to Henry Hooghiemstra/Rob Marchant. RobMarchant recent contribution being supported by EU Grant No:EU-MXC-KITE-517098. This paper contributes to the BIOME6000-research initiative which is a community-wide collaborationthat started in 1994 under four elements of the InternationalGeosphere-Biosphere Program (IGBP-GAIM, IGBP-DIS, IGBP-GCTE and IGBP-PAGES) with the aim to create fully documentedpollen and plant macrofossil data sets for 6000 and 18 00014C yrBP. Dominique Jolly was instrumental in developing and applyingthese techniques in Africa and subsequent application to differentgeographical regions – indeed the Latin American applicationpresented here would not have been possible without this massivecontribution and encouragement throughout the developmentof this work. In particular we thank Sandra Diaz, Liz Pickett,Colin Prentice and Bob Thompson for comments on earlier draftsof this manuscript. C. Penalba and an anonymous reviewer arethanked for insightful reviews that have improved the manuscript
Clim. Past, 5, 725–767, 2009 www.clim-past.net/5/725/2009/
R. Marchant et al.: Pollen-based biome reconstructions for Latin America 759
and some of the associated figures. Ary Teixeira de Oliveira-Filhoand Olando Rangel are particularly thanked for comments on theecology of the Latin American taxa. Kirsten Sickel, Gerhard Boen-ish and Silvana Schott are thanked for help in producing the figuresand archiving the results. Particular thanks must go to Eric Grimm,John Keltner and Vera Markgraf for their energies in establishing,and developing, the Latin American Pollen Database. At the verycentre of this work are all those palynologists who have supplieddata to the LAPD, or specifically to be used for this paper; withouttheir efforts such syntheses would not be possible.
Edited by: R. Bonnefille
Publication of this paper was granted byEDD (Environnement, Developpement Durable)and INSU (Institut des Sciences de l’Univers) at CNRS.
References
Abbot, M. B., Sletzer, G., Kelts, K. R., and Southon, J.: Holocenepaleohydrology of the tropical Andes from lake records, Quatern.Res., 47, 70–80, 1997.
Absy, M. L.: A palynolgical study of Holocene sediments inthe Amazon basin. Dissertation, University of Amsterdam, TheNetherlands, 1979.
Absy, M. L., Cleef, A., Fournier, M., Servant, M., Siffedine, A.,Da Silva, M. F., Soubies, F. Suguio, K., Turcq, B., and van derHammen, T.: Mise enevidence de quatre phases d’ouverturede la foret dense dans la sud-east de l’Amazonie au cours des60 000 dernieres annees. Premiere comparison avec d’autres re-gions tropicales, Competes Rendues Academie Science Paris,313, 673–678, 1991.
Alexandre, A., Meunier, J. D., Mariotti, A., and Soubies, F.: LateHolocene phytolith and carbon-isotope record from a latosol atSalitre, South-Central Brazil. Quatern. Res., 51, 187–194, 1999.
Almeida, L.: Vegetacion, fitogeographica y paleoecologıca delzacatonal alpine y bosques montanos de la region central deMexico, PhD thesis, University of Amsterdam, 1997.
Armesto, J. J., Villagran, C. Aravena, J. C., Perez, C., Smith-Ramirez, C., Cortes, M., and Hedin, L.: Conifer forests of theChilean coastal ranges, Ecology of Southern Conifers, edited by:Enright, N. J. and Hill, R. S., Melbourne University Press, 1995.
Ashworth, A. C. and Markgraf, V.: Climate of the Chilean Channelsbetween 11,000 and 10,000 yr B.P. based on fossil pollen andbeetle analysis, Revista Chilena de Historia Natural., 62, 61–74,1989.
Ashworth, A. C., Markgraf, V., and Villagran, C.: Late Quaternaryclimatic history of the Chilean channels based on fossil pollen
and beetle analyses, with an analysis of the modern vegetationand pollen rain, Jn Quatern. Sci., 6, 279–291, 1991.
Argollo, J. and Mourguiart, P.: Late Quaternary climate history ofthe Bolivian Altiplano, Quatern. Int., 72, 37–51, 2000.
Baied, C. A. and Wheeler, J. C.: Evolution of high Andean Punaecosystems: environment, climate, and cultural change over thelast 12,000 years in the central Andes, Mount. Res. Dev., 13,145–156, 1993.
Barry, P. and Chorley, L.: Mountain weather and climate, Methuen,London and New York, 1990.
Beard, J. S.: The classification of tropical American vegetation, Jn.Ecol., 36, 89–100, 1955.
Behling, H.: Untersuchungen zur spatpleistozanen und HolozanenVegetations und Klimageschichte der tropische Kustenwalderund der Araukarienwalder in Santa Catarina (Sud Brazilien),Dissertations Botanicae Band 206, J. Cramer, Berlin Stuttgart,1993.
Behling, H.: First report on new evidence for the occurrence ofPodocarpusand possible human presence at the mouth of theAmazon during the Late-glacial, Veg. His. Archaeobot., 5, 241–246, 1996.
Behling, H.: Late Quaternary vegetation, climate and fire his-tory from the tropical mountain region of Morro de Itapeva,SE Brazil, Palaeogeog., Palaeoclim., Palaeoecol. 129, 407–422,1997a.
Behling, H.: Late Quaternary vegetation, climate and fire historyof the Araucaria forest and campos region from Serra CamposGerais, Parana State (South Brazil), Rev. Palaeobot. Palynol., 97,109–121, 1997b.
Behling, H., Berrio, J. C., and Hooghiemstra, H.: Late Quaternarypollen records from the middle Caqueta River basin in centralColombian Amazon. Palaeogeog., Palaeoclim., Palaeoecol., 145,193–213, 1999.
Behling, H. and Hooghiemstra, H.: Late Quaternary palaeoecol-ogy and palaeoclimatology from pollen records of the savannasof the Llanos Orientales in Colombia, Palaeogeog., Palaeoclim.,Palaeoecol., 139, 251–267, 1998.
Behling, H. and Hooghiemstra, H.: Environmental history of theColombian savannas of the Llanos Orientales since the LastGlacial Maximum from lake records El Pinal and Carimagua,Jn. Paleolim., 21, 461–476, 1999.
Behling, H. and Hooghiemstra, H.: Holocene Amazon rain forest-savanna dynamics and climatic implications: high-resolutionpollen record from Laguna Loma Linda in eastern Colombia, JnQuatern. Sci., 15, 687–695, 2000.
Behling, H. and Hooghiemstra, H.: Neotropical savanna environ-ments in space and time: Late Quaternary inter-hemisphericcomparisons, in: Inter-hemispheric climate linkages, edited by:Markgraf, V., Academic Press, pp. 307–323, 2001.
Behling, H., Hooghiemstra, H., and Negret, A. J.: Holocene historyof the Choco rain forest from Laguna Piusbi, Southern PacificLowlands of Colombia, Quatern. Res., 50, 300–308, 1999.
Behling, H., Keim, G., Irion, G., Junk, W., and Nunes de Mello, J.:Holocene changes in the Central Amazon Basin inferred fromLago Calado (Brazil), Palaeogeog., Palaeoclim., Palaeoecol.,173, 87–101, 2001.
Behling, H. and Lima da Costa, M.: Holocene vegetational and en-vironmental changes from the Lago Crispim record in northeast-ern Para State, eastern Amazonia, Rev. Palaeobot. Palynol., 114,
www.clim-past.net/5/725/2009/ Clim. Past, 5, 725–767, 2009

760 R. Marchant et al.: Pollen-based biome reconstructions for Latin America
145–155, 2001.Behling, H., Negrelle, R. B., and Colinvaux, P.: Modern pollen rain
from the tropical Atlantic rain forest, Reserve Volta Velha, SouthBrazil, Rev. Palaeobot. Palynol., 97, 287–299, 1997.
Behling, H., Negret, A. J., and Hooghiemstra, H.: Late Quatrnaryvegeteational and climatic change in the Popayan region, south-ern Colombian Andes, Jn Quatern. Sci., 13, 43–53, 1999.
Bennet, K. D., Haberle, S., and Lumley, S. H.: The Late Glacial-Holocene transition in southern Chile, Science, 290, 325–327,2000.
Berrio, J. C., Hooghiemstra, H., Behling, H., and Van der Borg, K.:Late Holocene history of savanna gallery forest from Carimaguaarea, Colombia, Rev. Palaeobot. Palynol., 111, 295–308, 2000.
Berrio, J. C., Behling, H., and Hooghiemstra, H.: Tropical rain for-est history from the Colombian Pacific area: a 4200-yr pollenrecord from Laguna Jotaordo, The Holo., 10, 749–756, 2000.
Berrio, J. C., Hooghiemstra, H., Behling, H., Botero, P., and Vander Borg, K.: Late Quaternary savanna history of the ColombianLlanos Orientales from Lagunas Chenevo and Mozambique: atransect synthesis, The Holo., 12, 35–48, 2002.
Berrio, J. C., Boom, A., Botero, P., Herrera, L., Hooghiemstra, H.,Romero, F., and Sarmiento, G.: Multi-interdisciplinary evidenceof The Holocene history of a cultivated floodplain area in thewetlands, Veg. His. Archaeobot., 10, 161–174, 2002.
Berrio, J. C., Hooghiemstra, H., Marchant, R., and Rangle, O.: Lateglacial and Holocene history of dry forest in the Cauca Valleyfrom sites Quilichao and La Teta, Jn Quatern. Sci., 17, 667–682,2002.
Bigelow, N. H., Brubaker, L. B., Edwards, M. E., Harrison, S. P.,Prentice, I. C., Anderson, P. M., Andreev, A. A., Bartlein, P. J.,Christensen, T. R., Cramer, W., Kaplan, J. O., Lozhkin, A. V.,Matveyeva, N. V., Murray, D. V., McGuire, A. D., Razzhivin, V.Y., Ritchie, J. C., Smith, B., Walker, D. A., Gajewski, K., Wolf,V., Holmqvist, B. H., Igarashi, Y., Kremenetskii, K., Paus, A.,Pisaric, M. F. J., and Vokova, V. S.: Climate change and Arcticecosystems I. Vegetation changes north of 55◦ N between the lastglacial maximum, mid-Holocene and present, J. Geophys. Res.,108, 1–17, 2003.
Binford, M. W., Brenner, M., Whitmore, T. J., Higuera-Gundy,A., Deevey, E. S., and Leyden, B. W.: Ecosystems, palaeoecol-ogy and human disturbance in subtropical and tropical America,Quatern. Sci. Rev., 6, 115–128, 1987.
Birkland, P. W., Rodbell, D. T., and Short, S. K.: Radiocarbon dateson deglaciation, Cordillera Central, Northern Peruvian Andes,Quatern. Res., 32, 111–113, 1989.
Bjorck, S., Hakansson, H., Olsson, S., Barnekow, L., and Janssens,J.: Palaeoclimatic studies in South Shetland Islands, Antarctica,based on numerous stratigraphic variables in lake sediments, J.Palaeolim., 8., 233–272, 1993.
Boom, A., Marchant, R. A., Hooghiemstra, H., and SinningheDamste, J. S.: CO2 and temperature-controlled altitudinal shiftsof C4- and C3- dominated grasslands allow reconstruction ofρCO2, Palaeogeog., Palaeoclim., Palaeoecol., 177, 29–45, 2002.
Braconnot, P., Otto-Bliesner, B., Harrison, S., Joussaume, S., Pe-terchmitt, J.-Y., Abe-Ouchi, A., Crucifix, M., Driesschaert, E.,Fichefet, Th., Hewitt, C. D., Kageyama, M., Kitoh, A., Lan, A.,Loutre, M.-F., Marti, O., Merkel, U., Ramstein, G., Valdes, P.,Weber, S. L., Yu, Y., and Zhao, Y.: Results of PMIP2 coupledsimulations of the Mid-Holocene and Last Glacial Maximum –
Part 1: experiments and large-scale features, Clim. Past, 3, 261–277, 2007,http://www.clim-past.net/3/261/2007/.
Bradbury, J. P., Leyden, B., Salgado-Labouriau, M. L., Lewis Jr.,W. M., Schubert, C., Binford, M. W., Schubert, C. Binford, M.W., Frey, D. G., Whitehead, D. R., and Weibezahn, F. H.: LateQuaternary environmental History of Lake Valencia, Venezuela,Science, 214, 1299–1305, 1981.
Brown, B.: A summary of Late Quaternary pollen records fromMexico west of the Isthmus of Tehuantepec, Pollen records ofLate Quaternary North American Sediments, edited by: Bryant,V. M. and Holloway, R. G., American Association of Strati-graphic Palynologists Foundation, Dallas, Texas, 1985.
Brown, S. and Lugo, A. E.: Tropical secondary forests, Jn. Trop.Ecol., 6, 1–32, 199.
Bush, M. B.: Modern pollen-rain data from South and CentralAmerica: a test of the feasibility of fine-resolution lowland trop-ical palynology, The Holo., 1, 162–167, 1991.
Bush, M. B.: Neotropical plant reproductive strategies and fossilpollen representation, The American Naturalist, 145, 594–609,1995.
Bush, M. B. and Colinvaux, P.: A 7000-year pollen record from theAmazon lowlands, Ecuador. Vegetatio., 76, 141–154, 1988.
Bush, M., Colinvaux, P., Wiemann, M. C., Piperno, D. R., andLiu, K.: Late Pleistocene temperature depression and vegetationchange in Ecuadorian Amazonia, Quatern. Res., 34, 330–345,1990.
Bush, M. B., Miller, M., de Oliveira, P. E., and Colinvaux, P.: Twohistories of environmental change and human disturbance in east-ern lowland Amazonia, The Holo., 10, 543–553, 2000.
Bush, M., Piperno, D. O., Colinvaux, P., Oliveria, P. E., Krissek, L.A., Miller, M. C., and Rowe, W. E.: A 14,300-yr palaeoecologi-cal profile of a lowland tropical lake in Panama, Ecol. Mono., 62,251–275, 1992.
Bush, M. and Rivera, M.: Pollen dispersal and representation in aNeotropical rain forest, Global Ecol. Biogeog. Lett., 7, 379–392,1998.
Bjorck, S., Hakansson, S. H., Olsson, S., Barnekow, L., andJanssens, J. A.: Palaeoclimatic studies in South Shetland Is-lands, Antarctica, based on numerous stratigraphic variables inlake sediments, J. Paleolim., 8, 233–272, 1993.
Byrne, R. and Horn, S. P.: Prehistoric agriculture and forest clear-ance in the Sierra de los Tuxtlas, Veracruz, Mexico, Palynology,13, 181–194, 1989.
Cavelier, J., Aide, T. M., Santos, C., Eusse, A. M., and Dupuy, J.M.: The savannization of moist forests in the Sierra Nevada deSanta Marta, Colombia, J. Biog., 25, 901–912, 1998.
Cerverny, R. S.: Present climates of South America, in: Climatesof the Southern Continents: Present, Past and Future, edited by:Hobbs, J. E., Lindesay, J. A., and Bridgeman, H. A., J. Wiley andSons, Chichester, 1998.
Clapperton, C. M.: Quaternary geology and geomorphology ofSouth America. Elsevier, Amsterdam, 1993.
Claussen, M.: On coupling global climate models with climatemodels, Clim. Res., 4, 203–221, 1994.
Claussen, M. and Esch, M.: Biomes computed from simulated cli-matologies, Clim. Dynam., 9, 235–243, 1994.
Cleef, A. M. and Hooghiemstra, H.: Present vegetation of the areaof the high plain of Bogota, in: Vegetation and Climatic History
Clim. Past, 5, 725–767, 2009 www.clim-past.net/5/725/2009/

R. Marchant et al.: Pollen-based biome reconstructions for Latin America 761
of the High Plain of Bogota, Colombia, edited by: Hooghiemstra,H., Ganter Verlag, Vaduz. Dissertationes Botanicae, 79, 1–368,1984.
CLIMAP Project Members: The surface of ice-age Earth, Science,191, 1131–1137, 1976.
Colinvaux, P. A.: Ice-age Amazon revisited, Nature, 340, 188–189,1989.
Colinvaux, P. A.: Quaternary Environmental History and ForestDiversity in the Neotropics, in: Evolution and Environment inTropical America, edited by: Jackson, B. C., Budd, A. F., andCoates, A. G., The University of Chicago Press, Chicago, Lon-don, 1996.
Colinvaux, P. A., Bush, M., Steinitz-Kannan, M., and Miller, M.C.: Glacial and postglacial pollen records from the EcuadorianAndes and the Amazon, Quatern. Res., 48, 69–78, 1997.
Colinvaux, P. A., De Oliveira, P. E., Moreno, J. E., Miller, M. C.,and Bush, M.: A long pollen record from Lowland Amazonia:Forest and cooling in glacial times, Science, 274, 85–88, 1996.
Colinvaux, P. A., de Oliveira, P. E., and Bush, M. B.: Amazonianand neotropical communities on glacial time-scales: the failureof the aridity and refuge hypothesis, Quatern. Sci. Rev., 19, 141–169, 2000.
Colinvaux, P. A., Frost, M., Frost, I., Liu, K.-B., and Steinitz-Kannan, M.: Three pollen diagrams of forest disturbance inthe western Amazon basin, Rev. Palaeobot. Palynol., 55, 83–99,1988.
Cuatrecasas, J. and Barreto, A. J.: Paramos. Villegas editores, Bo-gota, Colombia, 1988.
De Oliveira, P. E.: A palynological record of Late Quaternary veg-etation and climatic change in southeastern Brazil, PhD Thesis,Ohio State University, Colombus, OH, 1992.
De Oliveira, P. E., Barreto, A. M. F., and Suguio, K.: Late Pleis-tocene/Holocene climatic and vegetational history of the Brazil-ian caatinga: the fossil dunes of the middle Sao Francisco River,Palaeogeog., Palaeoclim., Palaeoecol., 152, 319–337, 1999.
Dawson, A. G.: Ice Age Earth: Late Quaternary Geology and Cli-mate, Routledge, 1992.
Desjardins, T., Carneiro-Filho, A., Mariotti, A., Chauvel, A., andGirardin, C.: Changes of the forest-savanna boundary in Brazil-ian Amazonia during The Holo. revealed by stable isotope ratiosof soil organic carbon, Oecologia, 108, 749–187, 1996.
Dominquez, G., Rojo-Vazquez, J. R., Galvan-Pina, V., and Aguilar-Palomino, B.: Changes in the structure of a coastal fish assem-blage exploited by a small scale gillnet fishery during an El Nino-La Nina event, Est. Coast. Shelf Sci., 51, 773–787, 2000.
Dov Par, F.: Sooretama: The Atlantic rain forest of Brazil, SPBAcademic Publishing, The Hague, 1992.
Doherty, R., Kutzbach, J., Foley, J., and Pollard, D.: Fully coupledclimate/dynamical vegetation model simulations over northernAfrica during the mid-Holocene, Clim. Dynaam., 16, 561–573,2000.
Duivenvoorden, J. F. and Cleef, A. M.: Amazonian savanna vegeta-tion on the sandstone near Araracuara, Colombia, Phytocoenesis,24, 197–232, 1994.
Edwards, M. E., Anderson, P. M., Brubaker, L. B., Ager, T., An-dreev, A. A., Bigelow, N. H., Cwynar, L. C., Eisner, W. R., Harri-son, S. P., Hu, F.-S., Jolly, D., Lozhkin, A. V., MacDonald, G. M.,Mock, C. J., Ritchie, J. C., Sher, A. V., Spear, R. W., Williams,J., and Yu, G.: Pollen-based biomes for Beringia 18,000, 6000
and 014C yr B.P, J. Biog., 27, 521–554, 2000.Eidt, R. C.: The climatology of South America, in: Biogeography
and ecology in South America, edited by: Fittkau, E. J., 1, 54–81,Junk, The Hague, 1968.
Eiten, G.: The cerrado vegetation of Brazil, Bot. Rev., 2, 210–341,1972.
Elenga, H., Peyron, O., Bonnefille, R., Prentice, I. C., Jolly, D.,Cheddadi, R., Guiot, J., Andrieu, V., Bottema, S., Buchet, G.,de Beaulieu, J. L., Hamilton, A. C., Maley, J., Marchant, R.,Perez-Obiol, R., Reille, M., Riollet, G., Scott, L., Straka, H.,Taylor, D., Van Campo, E., Vincens, A., Laarif, F., and Jonson,H.: Pollen-based reconstruction for southern Europe and Africa18,000 years ago, J. Biog., 27, 621–634, 2000.
Ellis, E. C. and Ramankutty, N.: Putting people in the map: an-thropgenic biomes of the world, Front Ecol. Environ., 6, 18–25,2008.
Farrera, I., Harrison, S. P., Prentice, I. C., Ramstein, G., Guiot, J.,Bartlein, P. J., Bonnefille, R., Bush, M., Cramer, W., von Grafen-stein, U., Holmgren, K., Hooghiemstra, H., Hope, G., Jolly, D.,Lauritzen, S. E., Ono, Y., Pinot, S., Stute, M., and Gu, Y.: Trop-ical climates at the last glacial maximum: a new synthesis ofterrestrial palaeoclimate data. I. Vegetation, lake-levels and geo-chemistry, Clim. Dynam., 11, 823–856, 1999.
Flenley, J. R.: Tropical forests under the climates of the last 30,000years, Climate Change, 39, 177–197, 1998.
Flenley, J. R. and King, S. M.: Late Quaternary pollen records fromEaster Island, Nature, 307, 47–50, 1984.
Flenley, J. R., King, S. M., Jackson, J., Chew, C., Teller, J. T., andPrentice, M. E.: The late Quaternary vegetation and climatic his-tory of Easter Island, J. Quat. Sci., 6, 85–115, 1991.
Fjeldsa, J. A.: Un analisis biogeografico de la avifauna de losbosques de quenoa (Polylepis) de los Andes y su relevancia paraestablecer prioridades de conservacion, Memorias del Museo deHistoria Natural, U.N.M.S.M. (Lima), 21, 207–221, 1992.
Fjeldsa, J. A.: The avifauna of thePolylepiswoodlands of the An-dean highlands: the efficiency of basing conservation prioritieson patterns of endemism, Bird Conservation International, 3, 3–55, 1993.
Fjeldsa, J. A., Ehrlich, D., Lambin, E., and Prins, E.: Are biodiver-sity ‘hot spots’ correlated with current ecoclimatic stability? Apilot study using the NOAA-AVHRR remote sensing data, Bio-div. Conserv., 6, 399–420, 1997.
Foley, J. A., Prentice, I. C., Ramankutty, N., Levis, S., Pollard, D.,Sitch, S., and Haxeltine, A.: An integrated biosphere model ofland surface processes, terrestrial carbon balance and vegetationdynamics, Global Biogeochem. Cycles, 10, 603–628, 1996.
Gilli, A., Anselmetti, F. S., Ariztegui, D., Beres, M., McKenzie, J.A., and Markgraf, V.: Seismic stratigraphy, buried beach ridgesand contourite drifts: the Late Quaternary history of the closedLago Cardiel basin, Argentina (49◦ S), Sedimentology, 52, 1–22,2004.
Gentry, A. H.: A field guide to the families and genera of woodyplants of South America (Colombia, Ecuador, Peru), Conserva-tion International, Washington, D.C., 1993.
Godinez-Domınquez, M., Rojo-Vazquez, J. R., Galvan-Pina, V.,and Aguilar-Palomino, B.: Changes in the structure of a coastalfish assemblage exploited by a small scale gillnet fishery duringan El Nino-La Nina event, Est. Coast. Shelf Sci., 51, 773–787,2000.
www.clim-past.net/5/725/2009/ Clim. Past, 5, 725–767, 2009

762 R. Marchant et al.: Pollen-based biome reconstructions for Latin America
Godley, E. J. and Moar, N. T.: Vegetation and pollen analysis of twobogs on Chiloe, New Zea. J. Bot., 11, 255–268, 1973.
Gnecco, C.: An archaeological perspective on the Pleis-tocene/Holocene boundary in northern South America, Quatern.Int., 53, 3–9, 1999.
Gnecco, C. and Mohammed, A.: Technologia de cazadores-recolectores subandinos: Analisis functional y organizacion tec-nologica, Rev. of Colombian Anthropol., 31, 6–31, 1994.
Gnecco, C. and Mora, S.: Early occupations of the tropical forestsof northern South America by hunter-gatherers, Antiquity, 71,683–690, 1997.
Grabandt, R. J.: Pollen rain in relation to arboreal vegetation inthe Colombian Cordillera Oriental, Rev. Palaeobot. Palynol., 29,65–147, 1980.
Graf, K.: Palinologiadel cuaternario reciente en los Andes delEcuador, del Peru, y de Bolivia, Boletin Servicio Geologico Bo-livia, 4, 69–91, 1989.
Graf, K.: Pollen diagramme aus den Anden: Eine Synthesezur Klimageschichte und Vegetationsentwicklung seit der let-zen Eiszeit. Physiche Geographie vol 34 University of Zurich,Switzerland, 72–94, 1992.
Graherr, G.: FarbatlasOkosysteme der Erde: naturliche, naturnahebund kunstliche Land-Okosysteme aus geobotanischer Sicht, Ul-mer, Stuttgart, Germany, 1997.
Hansen, B. C. S. and Rodbell, D. T.: A glacial/Holocene pollenrecord from the eastern Andes of northern Peru, Quat. Res., 44,216–227, 1995.
Hansen, B. C. S., Seltzer, G. O., and Wright Jr., H. E.: Late Quater-nary vegetational change in the central Peruvian Andes, Palaeo-geog., Palaeoclim., Palaeoecol., 109, 263–285, 1994.
Haberle, S. and Maslin, M.: Late Quaternary vegetation and cli-mate change in the Amazon Basin based on a 50,000 year pollenrecord from the Amazon fan, ODP site 932, Quatern. Res., 51,27–38, 1999.
Harley, R. M.: Introduction to the vegetation, in: Flora of the Picodas Almas. Chapada Diamantina, Bahia, Brazil, edited by: Stan-nards, B. L., Royal Botanic Gardens, Kew, 1995.
Harrison, S. P., Kutzbach, J. E., Liu, Z., Bartlein, P. J., Otto-Bliesner, B., Muhs, D., Prentice, I. C., and Thompson, R. S.:Mid-Holocene climates of the Americas: a dynamical responseto changed seasonality, Clim. Dynam., 20, 663–668, 2003.
Haxeltine, A. and Prentice, I. C.: BIOME3: an equilibrium ter-restrial biosphere model based on ecophysiological constraints,resource availability, and competition among plant functionaltypes, Global Biogeochem. Cycles, 10, 693–709, 1996.
Heine, K. K.: Late Quaternary glacial sequences in Bolivia,Ecuador and Mexico-data and palaeoclimatic implications. Ab-stracts, 14 th INQUA Congress, Berlin, 1995.
Heine, K. K.: Tropical South America during the Last Glacial max-imum: evidence from glacial, periglacial and fluvial records,Quatern. Int., 72, 7–21, 2000.
Helmens, K. F. and Kuhry, P.: Middle and late Quaternary vegeta-tional and climatic history of the Paramo de Agua Blanca (East-ern Cordillera Colombia), Palaeogeog., Palaeoclim., Palaeoecol.,56, 291–335, 1986.
Heusser, C. J.: Quaternary palynology of Chile, Quaternary ofSouth America and the Antarctic Peninsula, 1, 5–22, 1982.
Heusser, C. J.: Three late Quaternary pollen diagrams from South-ern Patagonia and their palaeoecological implications, Palaeo-
geog., Palaeoclim., Palaeoecol., 118, 1–24, 1995.Heusser, C. J., Denton, G. H., Hauser, A., Anderson, B., and
Lowell, T.: Quaternary pollen records from the Archipelago deChiloe in the context of glaciation and climate, Revista Geolog-ica de Chile, 22, 25–46, 1995.
Heusser, C. J., Lowell, T., Heusser, L., Moreira, A., and Moreira,S. M.: Pollen sequence from the Llanquihue glaciation in marineOxygen Isotope Stage 4-2, J. Quat. Sci., 15, 115–125, 2000.
Hollis, J. H. T. and Schilling, D. H.: Late Wisconsin-Weichselianmountain glaciers and small ice caps, in: The last great ice sheets,edited by: Denton, G. H. and Hughes, T. J., Wiley, New York,1981.
Hooghiemstra, H.: Vegetation and climate history of the high plainof Bogota, Columbia: a continuous record of the last 3.5 millionyears, Ganter Verlag, Vadiz, 1984.
Hooghiemstra, H. and Cleef, A. M.: Development of Vegetationaland Climatic Sequence of the Area of the High Plain of Bogota,in: Vegetation and climate history of the high plain of Bogota,Columbia: a continuous record of the last 3.5 million years,edited by: Hooghiemstra, H., Ganter Verlag, Vadiz, 1984.
Hooghiemstra, H., Cleef, A. M., Noldus, G. W., and Kappelle, M.:Upper Quaternary vegetation dynamics and palaeoeclimatologyof the La Chonta bog area (Cordillera de Talamanca, Costa Rica),J. Quat. Sci., 7, 205–225, 1992.
Hooghiemstra, H. and van der Hammen, T.: Neogene and Qua-ternary development of the neotropical rain forest : the forestrefugia hypothesis, and a literature overview, Earth Sci. Rev., 44,147–103, 1998.
Horn, S. P.: Prehistoric fires in the highlands of Costa Rica: sedi-mentary charcoal evidence, Rev. Bio. Trop., 37, 139–148, 1989.
Horn, S. P.: Postglacial vegetation and fire history in the ChirripoParamo of Costa Rica, Quatern. Res., 40, 107–116, 1993.
Huck, K.: Die waldgeographische Regionen und Unterregionen vonSudamerika (with map 1:55,000,000), Geographische Taschen-buch, 1960.
Huntingford, C., Cox, P. M., and Lenton, T. M.: Contrasting re-sponse of a simple terrestrial ecosystem model to global change,Ecol. Mod., 134, 41–58, 2000.
International Plant Names Project: International Plant Names In-dex,http://www.ipni.org, 2009.
Iselbe, G. and Hooghiemstra, H.: Recent pollen spectra of highlandGuatemala, J. Biog., 22, 1091–1099, 1995.
Iselbe, G. and Hooghiemstra, H.: Vegetation and the Climate His-tory of Montane Costa Rica since the Last Glacial, Quat. Sci.Rev., 16, 589–604, 1997.
Iselbe, G., Hooghiemstra, H., and van der Borg, K.: A coolingevent during the Younger Dryas Chron in Costa Rica, Palaeo-geog., Palaeoclim., Palaeoecol., 117, 73–80, 1995a.
Iselbe, G., Hooghiemstra, H., and van der Borg, K.: The YoungerDryas in the Cordillera de Talamanca, Costa Rica, Geologie enMijnbouw, 74, 281–283, 1995b.
Iselbe, G., Hooghiemstra, H., Brenner, M., Curtis, J. H., and Hodell,D. A.: A Holocene vegetation history from lowland Guatemala,The Holo., 6, 265–271, 1996.
Jolly, D., Harrison, S. P., Damnati, B., and Bonnefille, R.: Simu-lated climate and biomes of Africa during the Late Quaternary:comparisons with pollen and lake status data, Quat. Sci. Rev., 17,629–657, 1998b.
Jolly, D. and Haxeltine, A.: Effect of low glacial atmospheric CO2
Clim. Past, 5, 725–767, 2009 www.clim-past.net/5/725/2009/
R. Marchant et al.: Pollen-based biome reconstructions for Latin America 763
on tropical African montane vegetation, Science, 276, 786–788,1997.
Jolly, D., Prentice, I. C., Bonnefille, R., Ballouche, A., Bengo, M.,Brenac, P., Buchet, G., Burney, D., Cazet, J-P., Cheddadi, R.,Edorh, T., Elenga, H., Elmoutaki, S., Guiot, J., Laarif, F., Lamb,H., Lezine, A.-M., Maley, J., Mbenza, M., Peryon, O., Reille, M.,Reynaud-Farrera, I., Riollet, G., Ritchie, J. C., Roche, E., Scott,L., Ssemmanda, I., Straka, H., Umer, M., Van Campo, E., Vili-mumbalo, S., Vincens, A., and Waller, M.: Biome reconstructionfrom pollen and plant macrofossil data for Africa and the Ara-bian peninsula at 0 and 6 ka, J. Biog., 25, 997–1005, 1998a.
Kahn, F. and de Granville, J. J.: Palms in the forest ecosystems ofAmazonia, Springer Verlag, Germany, 1992.
Kappelle, M.: Structural and floristic differences between westernAtlantic and moist Pacific montaneMyrsine-Quercusforest inCosta Rica. Academic Press, 1992.
Kappelle, M.: Ecology of mature and recovering Talamancan Mon-tane Quercus forests, Costa Rica, PhD Thesis, University of Am-sterdam, The Netherlands, 1995.
Kershaw, A. P. and McGlone, M.: The Quaternary history of thesouthern conifers, in: Ecology of Southern Conifers, edited by:Enright, N. J. and Hill, R. S., Melbourne University Press, 1995.
Kewensis: Index Kewensis version 2.0, Developed by systems sim-ulations Ltd, Oxford University Press.
Kubatzki, C. and Claussen, M.: Simulation of the global biogeo-physical interactions during the Last Glacial Maximum, Clim.Dynam., 14, 461–471, 1997.
Kuhry, P.: A Paleobotanical and palynological study of Holocenepeat from the El Bosque Mire, located in a volcanic area of theCordillera Central of Colombia, 1988a.
Kuhry, P.: Palaeobotantical-palaeoecological studies of tropicalhigh Andean peatbog sections (Cordillera Oriental, Colombia),Dissertationes Botanicae 116, J. Cramer, Berlin-Stuttgart, 1988.
Kuhry, P., Salomons, J. B., Riezebos, P. A., and Van der Hammen,T.: Paleoecologia de los ultimos 6.000 anos en el area de la La-guna de Otun-El Bosque. In T. van der Hammen, P.A. Perez, andP. Pinto (eds.) Studies on Tropical Andean Ecosystem, Vol 1: LaCordillera Central Colombiana transecto Parque Los Nevados,Cramer, Vaduz, 1983.
Latin American Pollen Database (LAPD):http://www.ncdc.noaa.gov/paleo/lapd.html, last access 4 November 2009.
Ledru, M.-P.: Modifications de la vegetation du Brazil entre ladernieier epoque glaciaire et lınterglaciaire ectuel, Comptes Ren-dus de l’Academie des Sciences Paris, 314, 117–123, 1992.
Ledru, M.-P.: Late Quaternary environmental and climatic changesin Central Brazil, Quatern. Res., 39, 90–98, 1993.
Ledru, M.-P., Behling, H., Fournier, M. L., Martin, L., and Servant,M.: Localisation de la foret d’Acaucaria du Brazil au cours del’Holocene. Implications paleoclimatiques, C.R. Acadamie Sci-ence Paris, 317, 517–521, 1994.
Ledru, M.-P., Bertaux, J., and Sifeddine, A.: Absence of LastGlacial Maximum records in lowland tropical forests, Quatern.Res., 49, 233–237, 1998.
Ledru, M.-P, Corderio, R. C., Dominquez, J. M. L., Martin, L.,Mourguiart, P., Sifeddine, A., and Turcq, B.: Late-glacial cool-ing in Amazonia inferred from pollen at Lagoa de Caco, northernBrazil, Quatern. Res., 55, 47–56, 2001.
Ledru, M.-P. and Lorscheitter, M. L.: Vegetation dynamics insouthern and Central Brazil during the last 10,000 yr B.P, Rev.
Palaeobot. Palynol., 99, 131–142, 1998.Ledru, M.-P., Soares Braga, P. I., Soubies, F., Fournier, M. L., Mar-
tin, L., Suguio, K., and Turcq, B.: The last 50,000 years inthe Neotropics (southern Brazil): evolution of vegetation andclimate, Palaeogeog., Palaeoclim., Palaeoecol., 123, 239–257,1996.
Leemans, R. and Cramer, W. P.: The IISA database for meanmonthly values of temperature, precipitation and cloudiness ona global terrestrial grid. Rep IIASA Research RR-91-18, Interna-tional Institute for Applied Systems Analysis, Laxenburg, Aus-tria, 1991.
Leyden, B. W.: Guatemalan forest synthesis after Pleistocene arid-ity. Proceedings of the National Academy of Sciences (USA), 81,4856–4859, 1984.
Leyden, B. W.: Late Quaternary aridity and Holocene moisture fluc-tuations in the Lake Valencia Basin, Venezuela, Ecol., 66, 1279–1295, 1985.
Leyden, B. W.: Man and climate in Maya lowlands, Quatern. Res.,28, 407–414, 1987.
Leyden, B. W., Brenner, M., Hodell, D. A., and Curtis, J. H.: LatePleistocene climate in the central American lowlands, in: Amer-ican Geophysical Union Geophys. Mono., 78, edited by: Swar,P. K., Washington, D.C., USA, 1993.
Leyden, B. W., Brenner, M., Hodell, D. A., and Curtis, J. H.: Or-bital and internal forcing of the climate on the Yucatan peninsulafor the past ca 36 ka, Palaeogeog., Palaeoclim., Palaeoecol., 109,193–210, 1994.
Leyden, B. W., Brenner, M., Whitmore, T., Curtis, J. H., Piperno, D.R., and Dahlin, B. H.: A record of long and short-term climaticvariation from northwest Yucatan: Cenote San Jose Chulchaca,in: The managed mosaic: Ancient Maya agriculture and resourceuse, edited by: Fedick, S. L., University of Utah Press, USA,1995.
Liu, K. and Colinvaux, P.: Forest changes in the Amazon Basin atthe LGM, Nature, 318, 556–577, 1985.
Lozano-Garcial, M. S. and Ortega-Guerroero, B.: Palynologicaland magnetic susceptibility records of Lake Chalco, centralMexico, Palaeogeog., Palaeoclim., Palaeoecol., 109, 177–191,1994.
Lozano-Garcial, M. S., Ortega-Guerroero, B., Caberallero-Mirandan, M., and Urrutia-Fucugauchi, F.: Late Holocene Pale-oenvironments of Chalco Lake, Central Mexico, Quatern. Res.,40, 332–342, 1993.
Lozano-Garcial, M. S. and Xelhuantzi-Lopez, M. S.: Some prob-lems in the late Quaternary pollen records of Central Mexico:Basins of Mexico and Zacapu, Quatern. Int., 43, 117–123, 1993.
Lumley, S. H. and Switsur, R.: Late Quaternary of the Taitao Penin-sula, southern Chile, J. Quatern. Sci., 8, 161–165, 1993.
Maberly, D. J.: The Plant Book: A portable dictionary of the higherplants, Cambridge University Press, 1993.
Mancini, M. V.: Recent pollen spectra from forest and steppe ofSouth Argentina: a comparison with vegetation and climate data,Rev. Palaeobot. Palynol., 77, 129–142, 1993.
Marchant, R. A., Almeida, L., Behling, H., Berrio, J. C., Bush, M.,Cleef, A., Duivenvoorden, J., Kappelle, M., De Oliveira, P.E.,Hooghiemstra, H., Teixeira de Oliveira-Filho, A., Ledru, M-P.,Lozano-Garcıa, M. S., Ludlow-Wiechers, B., Mancini, V., Paez,M., Markgraf, V., Prieto, A., Rangel, O., and Salgado-Labouriau,M. L.: Distribution and ecology of parent taxa of pollen lodged
www.clim-past.net/5/725/2009/ Clim. Past, 5, 725–767, 2009
764 R. Marchant et al.: Pollen-based biome reconstructions for Latin America
within the Latin American Pollen Database, Rev. Palaeobot. Pa-lynol., 121, 1–75, 2002c.
Marchant, R. A., Behling, H., Berrio, J. C., Cleef, A., Duivenvo-orden, J., van Geel, B, van der Hammen, T., Hooghiemstra, H.,Kuhry, P., Melief, B. M., van Reenen, G., and Wille, M.: LateHolocene Colombian vegetation dynamics, Quat. Sci. Rev., 20,1289–1308, 2001a.
Marchant, R. A., Behling, H., Berrio, J. C., Cleef, A., Duivenvo-orden, J., van Geel, B, van der Hammen, T., Hooghiemstra, H.,Kuhry, P., Melief, B. M., van Reenen, G., and Wille, M.: A re-construction of Colombian biomes derived from modern pollendata along an altitude gradient, Rev. Palaeobot. Palynol., 117,79–92, 2001b.
Marchant, R. A., Behling, H., Berrio, J. C., Cleef, A., Duivenvo-orden, J., van Geel, B, van der Hammen, T., Hooghiemstra, H.,Kuhry, P., Melief, B. M., van Reenen, G., and Wille, M.: Colom-bian vegetation derived from pollen data at 0, 3000, 6000, 9000,12,000, 15,000 and 18,000 radiocarbon years before present, J.Quatern. Sci., 17, 113–129, 2002a.
Marchant, R. A., Behling, H., Berrıo, J. C., Cleef, A., Duivenvo-orden, J., van Geel, B., van der Hammen, T., Hooghiemstra, H.,Kuhry, P., Melief, B. M., van Reenen, G., and Wille, M.: Mid toLate Holocene vegetation disturbance in Colombia – a regionalreconstruction, Antiquity, 78, 828–838, 2004b.
Marchant, R. A., Berrıo, J. C., Behling, H., Boom, A., andHooghiemstra, H.: Colombian dry moist forest transitions inthe Llanos Orientales – a comparison of model and pollen-based biome reconstructions, Palaeogeog., Palaeoclimatol.,Palaeoecol., 234, 28–44, 2006.
Marchant, R. A., Boom, A., Behling, H., Berrıo, J. C., van Geel, B.,van der Hammen, T., Hooghiemstra, H., Kuhry, P., and Wille, M.:Colombian vegetation at the Late Glacial Maximum – a compar-ison of model and pollen-based biome reconstructions, J. Quat.Sci., 19, 721–732, 2004.
Marchant, R. A., Boom, A., and Hooghiemstra, H.: Pollen-basedbiome andδ13C reconstructions for the past 450,000 years fromthe Funza II core, Colombia - ecosystem relationships to lateQuaternary CO2 change as detected in the Vostok ice core record,Palaeogeog., Palaeoclim., Palaeoecol., 177, 29–45, 2002b.
Marchant, R. A. and Hooghiemstra, H.: Rapid environmentalchange in tropical Africa and Latin America about 4000 yearsbefore present: a review, Earth Sci. Rev., 66, 217–260, 2004.
Marchant, R. A. and Hooghiemstra, H.: ‘Letter to the Editor’ Cli-mate of East Africa 600014C Yr B.P. as inferred from pollendata, By Odile Peyron, Dominique Jolly, Raymonde Bonnefille,Annie Vincens and Joel Guiot, Quatern. Res., 56, 133–135,2001b.
Marchant, R. A. and Taylor, D. M.: Numerical analysis of mod-ern pollen spectra and in situ montane forest – implications forthe interpretation of fossil pollen sequences from tropical Africa,New Phytol., 146, 505–515, 2000.
Markgraf, V.: Late and postglacial vegetational and paleoclimaticchanges in sub-Antarctic, temperate, and arid environments inArgentina, Palynol., 7, 43–52, 1983.
Markgraf, V.: Late Pleistocene and Holocene vegetation history oftemperate Argentina: Lago Morenito, Bariloche, Diss. Bot., 72,235–254, 1984.
Markgraf, V.: Late Pleistocene faunal extinction in southern Patag-onia, Science, 228, 1110–1112, 1985a.
Markgraf, V.: Paleoenvironmental history of the last 10,000years in northwestern Argentina, Zentralblatt fur Geologie undPalaontolgie, 11/12, 1739–1749, 1985b.
Markgraf, V.: Paleoenvironmental changes at the northern limitof the sub-AntarcticNothofagusforest, latitude 37S, Argentina,Quatern. Res., 28, 119–129, 1987.
Markgraf, V.: Fells cave: 11,000 years of changes in paleoenviron-ments, fauna, and human occupation. In J. Hyslop (ed.) Travelsin Archaeology in South Chile, University of Iowa, Iowa City,USA, 1988.
Markgraf, V.: Late Pleistocene/Holocene paleoclimates from sub-Antarctic latitudes, Antarctic Journal of the United States, 24,1–2, 1989.
Markgraf, V.: Palaeoclimates in Central and South America since18,000 BP based on pollen and lake-level records, Quat. Sci.Rev., 8, 1–24, 1989.
Markgraf, V.: Climatic history of Central and Southern Americasince 18,000 yr B.P., in: Global Climates since the Last GlacialMaximum, edited by: Wright, H. E., Kutzbach, J. E., Webb III,T., Ruddiman, W. F., Street-Perrot, F. A., and Bartlein, P. J., Uni-versity of Minnesota Press, USA, 1993.
Markgraf, V.: Younger Dryas in southern South America?, Boreas,20, 63–69, 1991.
Markgraf, V.: Paleoenvironments and paleoclimates in Tierra delFuego and southernmost Patagonia, South America. Palaeo-geog., Palaeoclim., Palaeoecol. 102, 53–68, 1993.
Markgraf, V.: Past climates of South America, in: Climates of theSouthern Continents: Present, Past and Future, edited by: Hobbs,E., Lindesay, J. A., and Bridgman, H. A., Wiley, Chichester,1998.
Markgraf, V., Baumgartner, T. R., Bradbury, J. P., Diaz, H. F., Dun-bar, R. B., Luckman, B. H., Seltzer, G. O., Swetman, T. W., andVillalba, R.: Paleoclimate reconstruction along the Pole-Equator-Pole transect of the Americas (PEP 1), Quat. Sci. Rev., 19, 125–140, 2000.
Markgraf, V., Bradbury, J. P., and Fernandez, P.: Bajada de Rahue,Province Neuquen, Argentina: an interstadial deposit in northernPatagonia, Palaeogeog., Palaeoclim., Palaeoecol., 56, 251–258,1986.
Martin, L., Fournier, M., Mourguiart, P., Sifeddine, A., and Turcq,B.: Southern Oscillation signal in South American palaeocli-matic data of the last 7000 years, Quatern. Res., 39, 338–346,1993.
Martin, L., Bertaux, J., Correge, T., Ledru, M.-P., Mourguiart, P.,Sifeddine, A., Soubies, F., Wirrmann, D., Suguio, K., and Turcq,B.: Astronomical forcing of contrasting rainfall changes in tropi-cal South America between 12,400 and 8800 cal yr BP, Quatern.Res., 47, 117–122, 1997.
Mayle, F. E., Burbridge, R., and Killeen, T. J.: Millennial-scale dy-namics of southern Amazonian rain forest, Science, 290, 2291–2294, 2000.
Melief, A. B. M.: Late Quaternary palaeoecology of the Parque Na-tional los Nevados Cordillera Central, and Sumapaz CordilleraOriental areas, Colombia, Dissertation University of Amsterdam,Amsterdam, The Netherlands, 1985.
Mercer, J. H. and Ager, T. A.: Glacial and floral changes in southernArgentina since 14,000 years ago, National Geographic ScienceReports, 15, 457–477, 1983.
Moreno, P. I.: Vegetation and climate near Lago Llanquihue in
Clim. Past, 5, 725–767, 2009 www.clim-past.net/5/725/2009/

R. Marchant et al.: Pollen-based biome reconstructions for Latin America 765
the Chilean Lake District between 20,200 and 95014C yr BP,J. Quat. Sci., 12, 485–500, 1994.
Metclafe, S. E., O’Hara, S. L., Caballero, M., and Davies, S. J.:Records of late Pleistocene-Holocene climate change in Mexico– a review, Quat. Sci. Rev., 19, 699–721, 2000.
Monsalve, J. G.: A pollen core from the Hacienda Lusitania, ProCalima, 4, 40–44, 1985.
Mourguiart, P. H., Argollo, J., and Wirrmann, D.: Evoucioun dellago Titicaca desde 25,000 nos BP, in: Climas cuaternarios enAmerica del Sur, edited by: Argollo, J. and Mourguiart, Ph., Edi-tions ORSTOM-La Paz, Bolivia, p. 157–171, 1995.
Noblet-Docoudre, N., Claussen, M., and Prentice, C.: Mid-Holocene greening of the Sahara: first results of the GAIM6000 year BP experiment with two asynchronously coupled at-mosphere/biome models, Clim. Dynam., 16, 643–659, 2000.
Northrop, L. A. and Horn, S. P.: Precolombian agriculture and for-est disturbance in Costa Rica: palaeoecological evidence fromtwo lowland rain forest lakes, The Holo., 6, 289–299, 1996.
Ortega-Guerrero, B.: Paleomagnestismo, magnetoestrtifia y paleoe-cologia del Cuaternario tardio en el Lago de Chalco, Cuenca deMexico, Dissertation, National University of Mexico, 1992.
Ortega-Rosas, C. I., Guiot, J., Penalba, M. C., and Ortiz-Acosta,M. E.: Biomization and quantitative climate reconstruction tech-niques in northwestern Mexico – with an application to fourHolocene pollen sequences, Glob. Plan. Cha., 61, 242–266,2008a.
Ortega-Rosas, C. I., Penalba, M. C., and Guiot, J.: Holocene altitu-dinal shifts in vegetation belts and environmental changes in theSierra Madre Occidental, northwestern Mexico based on modernand fossil pollen data, Rev. Paleobot. Palynol., 151, 1–20, 2008b.
Paez, M. M. and Prieto, A. R.: Paleoenvironmental reconstructionby pollen analysis from loess sequences from the Southeast ofBuenos Aires (Argentina), Quatern. Int., 17, 139–153, 1993.
Pendall, E., Markgraf, V., White, J. W. C., and Dreier, M.: Multi-proxy record of late Pleistocene-Holocene climate and vegetationchanges from a peat bog in Patagonia, Quatern. Res., 55, 168–178, 2001.
Peng, C. H., Guiot, J., and van Campo, E.: Estimating changes interrestrial vegetation and carbon storage: using palaeoecologicaldata and models, Quatern. Sci. Rev., 17, 719–735, 1998.
Pereira, B. A. S., de-Mendonca, R. C., Filgueiras, T. S., de-Paula,J. E., and Heringer, E. P.: Levantamento florıstico daarea deprotecao ambiental (APA) da bacia do Rio Sao Bartolomeu, Dis-trito Federal, Anais XXXVI Congresso Brazileiro de Botanica,Socied. Bot. Brazil, 1985, edited by: IBAMA, Curitiba, vol. 1,1990.
Peyron, O., Jolly, D., Bonnefille, R., Vincens, A., and Guiot, J.:Climate of East Africa 600014C yr B.P. as inferred from pollendata, Quatern. Res., 54, 90–101, 2000.
Pickett, E. J., Harrison, S. P., Hope, G., Harle, K., Dodson, J. R.,Kershaw, A. P., Prentice, I. C., Backhouse, J., Colhoun, E. A.,D’Costa, D., Flenley, J., Grindrod, J., Haberle, S., Hassell, C.,Kenyon, C., Macphail, M., Martin, H., Martin, A. C., McKenzie,M., Newsome, J. C., Penny, D., Powell, J., Raine, J. I., Southern,W., and Stevenson, J.: Pollen-based reconstructions of biomedistributions for Australia, Southeast Asia and the Pacific (SEA-PAC region) at 0, 6000 and 18,000 C-14 yr BP, J. Biogeog., 31,1381–1444, 2004.
Piperno, D. R., Bush, M., and Colinvaux, P. A.: Palaeoenvironments
and human occupation in Late Glacial Panama, Quatern. Res.,33, 108–116, 1990.
Piperno, D. R., Bush, M., and Colinvaux, P. A.: Palaeoecologicalperspectives on human adaption in Central Panama. I: The Pleis-tocene, Geoarchaeol., 6, 201–226, 1991a.
Piperno, D. R., Bush, M., and Colinvaux, P. A.: Palaeoecologi-cal perspectives on human adaption in Central Panama. II: TheHolo., Geoarchaeol., 6, 227–250, 1991b.
Piperno, D. R., Ranere, A. J., Holst, I., and Hansell, P.: Starch grainsreveal early root crop horticulture in the Panamanian tropical for-est, Nature, 407, 894–897, 2000.
Pires, J. M. and Prance, G. T.: The vegetation types of the BrazilianAmazon, in: Key Environments Amazonia, edited by: Prance,G. T. and Lovejoy, T., Pergamon Press, 1985.
Prance, G. T.: The changing forest, in: Key Environments Amazo-nia, edited by: Prance, G. T. and Lovejoy, T., Pergamon Press,1985.
Prentice, I. C., Cramer, W., Harrison, S. P., Leemans, R., Monserud,R. A., and Solomon, A. M.: A global biome model based on plantphysiology and dominance, soil properties and climate, J. Biog.,19, 117–134, 1992.
Prentice, I. C., Sykes, M. T., Lautenschlager, M., Harrison, S. P.,Denissenko, O., and Bartlein, P.: Modelling global vegetationpatterns and terrestrial carbon storage at the last glacial maxi-mum, Glob. Ecol. Biogeog. Lett., 3, 67–76, 1993.
Prentice, I. C., Guiot, J., Huntley, B., Jolly, D., and Cheddadi, R.:Reconstructing biomes from palaeoecological data: a generalmethod and its application to European pollen data at 0 and 6 ka.,Clim. Dynam., 12, 185–194, 1996a.
Prentice, I. C., Harrison, S. P., Jolly, D., and Guiot, J.: The climateand biomes of Europe at 6000 yr BP: comparison of model sim-ulations and pollen-based reconstructions, Quat. Sci. Rev., 17,659–668, 1996b.
Prentice, I. C. and Webb III, T.: BIOME 6000: reconstructingglobal mid-Holocene vegetation patterns from palaeoecologicalrecords, J. Biog., 25, 997–1005, 1998.
Prentice, I. C., Jolly, D., and BIOME 6000 Participants: Mid-Holocene and glacial-maximum vegetation: geography of thenorthern continents and Africa, J. Biog., 27, 507–519, 2000.
Prieto, A. R.: Late Quaternary vegetation and climatic changes inthe Pampa grassland of Argentina, Quatern. Res., 45, 73–88,1996.
Prieto, A. R. and Paez, M. M.: Pollen analysis of discontinuousstratigraphical sequences: Holocene at Cerro La China locality(Buenos Aires, Argentina), Quaternary of South America andAntarctica Peninsula, 7, 219–236, 1989.
Rodgers, J. C. and Horn, S. P.: Modern pollen spectra from CostaRica, Palaeogeog., Palaeoclim., Palaeoecol., 124, 53–71, 1996.
Rull, V.: A palynological record of a secondary succession after firein Gran Sabana, Venezuela, J. Quat. Sci., 14, 137–152, 1999.
Rull, V., Salgado-Labouriau, M. L., Schubert, C., and ValastroJr., S.: Late Holocene temperature depression in the Venezue-lan Andes: Palynological evidence, Palaeogeog., Palaeoclim.,Palaeoecol., 60, 109–121, 1987.
Rzedowski, V.: Vegetacion de Mexico, Editorial Lemusa, Mexico,1983.
Salami, M.: Additional information on the findings in the Mylodocave at Ultima Esperanza, Acta Geografica, 14, 314–333, 1955.
Salgado-Labouriau, M. L.: Sequence of colonisation by plants in
www.clim-past.net/5/725/2009/ Clim. Past, 5, 725–767, 2009

766 R. Marchant et al.: Pollen-based biome reconstructions for Latin America
the Venezuelan Andes after the Pleistocene glaciation, J. Paly-nol., 23–24, 189–204, 1988.
Salgado-Labouriau, M. L.: Late Quaternary palaeoclimate in thesavannas of South America, J. Quatern. Sci., 12, 371–379, 1997.
Salgado-Labouriau, M. L., Barberi, M., Ferraz-Vicentini, K. R., andParizzi, M. G.: A dry climatic event during the late Quaternaryof tropical Brazil, Rev. Palaeobot. Palynol., 99, 115–129, 1998.
Salgado-Labouriau, M., Ferraz-Vicentini, K. R., and Parizzi, M. G.:A dry climatic event during the late Quaternary of tropical Brazil,Rev. Palaeobot. Palynol., 99, 1515–129, 1998.
Saporito, M. S.: Chemical and mineral studies of a core from LakePatzcuaro, Mexico, MSc thesis, University of Minnesota, Min-neapolis, Minnesota, USA, 1975.
Sarmiento, G.: The dry plant formations of South America and theirfloristic connections, J. Biog., 2, 233–251, 1975.
Schabitz, F.: Untersuchungen zum aktuellen Pollenniederschlagund zur Holozanen Klima-und Vegetationsentwicklung in denAnden Nord-Neuquens, Argentinien, Bamberger GeographischeSchriften, 8, 1–131, 1989.
Schabitz, F.: Holocene vegetation and climate in southern SantaCruz, Argentina, Bamberger Geographische Schriften [Bd.] 11,235–244, 1991.
Schabitz, F.: Holocene climatic variations in northern Patagonia,Argentina, Palaeogeog., Palaeoclim., Palaeoecol., 109, 287–294,1994.
Schreve-Brinkman, E. J.: A palynological study of the upperQuaternary sequence in the El Abra corridor and rock shel-ters Colombia, Palaeogeog., Palaeoclim., Palaeoecol., 25, 1–109,1978.
Schmithusen, J.: Atlas zur Biogeographie, Bibliographisches Insti-tut, Mannheim/Wien/Zurich, 1976.
Schofield, K.: Plants of the Galapagos Islands, Universe Books,1984.
Seibert, P.: Farbatlas Sudamerika – Landschaften und Vegetation,Verlag Eugen Ulmer, Mannheim, 1996.
Seltzer, G. O.: Recent glacial history and palaeoclimate of thePeruvian-Bolivian Andes, Quatern. Sci. Rev., 9, 137–152, 1990.
Servant, M., Maley, J., Turcq, B., Absy, M., Brenac, P. Furnier, M.,and Ledru, M.-P.: Tropical Forest changes during the late Qua-ternary in African and South American lowlands, Glob. Planet.Cha., 7, 25–40, 1993.
Sifeddine, A., Martin, L., Turcq, B., Volkermer-Ribero, C., Sou-bies, F., Cordeiro, R. C., and Suguio, K.: Variations in the Ama-zonian rain forest environment: a sedimentological record cov-ering 30,000 years, Palaeogeog., Palaeoclim., Palaeoecol., 168,221–235, 2001.
Steege, H. T.: The use of forest inventory data for a National Pro-tected Area Strategy in Guyana, Biodiv. Conserv., 7, 1457–1483,1998.
Takahara, H., Sugita, S., Harrison, S. P., Miyoshi, N., Morita, Y.,and Uchiyama, T.: Pollen-Based Reconstruction of JapaneseBiomes at 0, 6000 and 18,000 yr B.P., J. Biog., 27, 665–683,2001.
Tarasov, P. E., Webb III, T., Andreev, A. A., Afanas’eva, N. B.,Berezina, N. A., Bezusko, L. G., Blyakharchuk, T. A., Bo-likhovskaya, N. S., Chernavskaya, M. M., Chernova, G. M., Do-rofeyuk, N. I., Dirksen, V. G., Elina, G. A., Filimonova, L. V.,Glebov, F. Z., Guiot, J., Gunova, V. S., Harrison, S. P., Jolly, D.,Khomutova, V. I., Kvavadze, E. V., Osipova, I. M., Panova, N.
K., Prentice, I. C., Saarse, L., Sevastyanov, C. S., Volkova, V. S.,and Zernitskaya, V. P.: Present day and mid-Holocene BiomesReconstructed from Pollen and Plant Macrofossil Data from theFormer Soviet Union and Mongolia, J. Biog., 25, 1029–1053,1998a.
Tarasov, P. E., Cheddadi, R. Guiot, J., Sytze, B., Peyron, O.,Belmonte, J., Ruiz-Sanchez, V, Saadi, F., and Brewer, S.: Amethod to determine warm and cool steppe biomes from pollendata; application to the Mediterranean and Kazakhstan regions,J. Quatern. Sci., 13, 335–344, 1998b.
Texier, D., de Noblet, N., Harrison, S. P., Haxeltine, A., Jous-saume, S., Jolly, D., Laarif, F., Prentice, I. C., and Tarasov, P.E.: Quantifying the role of biosphere-atmosphere feedbacks inclimate change: a coupled model simulation for 6000 yr B.P. andcomparison with palaeodata for Northern Eurasia and northernAfrica, Clim. Dynam., 13, 865–881, 1997.
Thompson, L. G., Mosely-Thompson, E., Davis, E. M., Lin, P. E.,Henderson, K. A., Cole-Dai, B., and Liu, K.: Late glacial stageand Holocene tropical ice core records from Huascaren, Peru,Science, 269, 46–50, 1995.
Thompson, R. S. and Anderson, K. H.: Biomes of Western NorthAmerica at 18,000, 6,000 and 014C yr B.P. Reconstructed fromPollen and Packrat Midden Data, J. Biog., 27, 655–664, 2000.
Thouret, J., van der Hammen, T., Salomons, B., and Juvigne, E.:Late Quaternary glacial studies in the Cordillera Central, Colom-bia, based on glacial geomorphology, tephra-soil stratigraphy,palynology and radiocarbon dating, J. Quatern. Sci., 12, 347–369, 1997.
Thomas, M. F.: Late Quaternary environmental changes and thealluvial record in humid tropical environments, Quatern. Int., 72,23–36, 2000.
Tuomisto, H. and Ruokolainen, K.: The role of ecological knowl-edge in explaining biogeography, and biodiversity in Amazonia,Biodiv. Conserv., 6, 347–357, 1997.
Valencio, A. A., Creer, K. M., Sinito, A. M., Mazzoni, M. M.,Alonso, M. S., and Markgraf, V.: Palaeomagnetism, sedimentol-ogy, radiocarbon age determinations and palynology of the Llaoarea, southwestern Argentina (lat. 41 S, long. 71.3 W): paleolim-nological aspects, Quaternary of South America and AntarcticPeninsular., 3, 109–148, 1985.
Van der Hammen, T.: Palinologıa de la region de Laguna de losBobos, Historia de su clima, vegetacion y agricultura durante losultimos 5000 anos. Revista Acad Colombiana Ciencias ExactasFisicas Naturales, 11, 359–361, 1962.
Van der Hammen, T.: A Palynological Study on the Quaternaryof British Guyana, Leidse Geologische Mededelingen, 29, 126–168, 1963.
Van der Hammen, T.: Changes in vegetation and climate in theAmazon Basin and surrounding areas during the Pleistocene, Ge-ologie en Mijnbouw, 51, 641–643, 1972.
Van der Hammen, T.: The Pleistocene changes of vegetation andclimate in tropical South America, J. Biog., 1, 3–26, 1974.
Van der Hammen, T. and Absy, M.: Amazonia during the lastglacial Palaeogeog., Palaeoclim., Palaeoecol., 109, 247–261,1994.
Van der Hammen, T., Barelds, T. J., de Jong, H., and de Veer, A. A.:Glacial sequence and environmental history in the Sierra Nevadadel Cocuy Colombia, Palaeogeog., Palaeoclim., Palaeoecol., 32,247–340, 1980.
Clim. Past, 5, 725–767, 2009 www.clim-past.net/5/725/2009/

R. Marchant et al.: Pollen-based biome reconstructions for Latin America 767
Van der Hammen, T. and Gonzalez, E.: Upper Pleistocene andHolocene climate and vegetation of the Saban de Bogota, Lei-des Geologische Mededelingen, 25, 261–315, 1960.
Van der Hammen, T. and Gonzalez, E.: A Late glacial and Holocenepollen diagram from Cienaga del Vistador Dep. Boyaca, Colom-bia, Leids Geologische Mededelingen, 32, 193–201, 1965.
Van Geel, B. and Van der Hammen, T.: Upper Quaternary veg-etation and climatic sequence of the Fuquene area EasternCordillera, Colombia, Palaeogeog., Palaeoclim., Palaeoecol., 14,9–92, 1973.
Valdes, P.: South American palaeoclimate model simulations: howreliable are the models, J. Quat. Sci., 15, 357–368, 2000.
Veblen, T. T., Burns, B. R., Kitzberger, T., Lara, A., and Villalba,R.: The Ecology of the Conifers of southern South America, in:Ecology of southern Conifers, edited by: Enright, N. J. and Hill,R. S., Melbourne University Press, 1995.
Vernet J.-L., Wengler, L., Solari, M.-E., Ceccantini, G., Fournier,M., Fournier, M., Ledru, M.-P., and Soubies, F.: Feux, climats etvegetations au Bresil central durant l’Holocene: les donnees dunprofil de sol a charbons de bois (Salitre, Minas Gerais), CRAS,Paris, 319, 1391–1397, 1994.
Villagran, C.: Expansion of Megallanic Moorland during theLate Pleistocene: palynological evidence from Northern Isla deChiloe, Chile, Quatern. Res., 30, 304–314, 1988.
Watts, W. A. and Bradbury, J. P.: Palaeoecological studies on LakePatzcuaro on the wets-central Mexican Plateau and at Chalco inthe Basin of Mexico, Quatern. Res., 17, 56–70, 1982.
Webb III, T.: A global paleoclimatic data base for 6000 yrBP, DOE/EV/10097-6, US Department of Energy, Washington,1985.
Wijmstra, T. A. and van der Hammen, T.: Palynological data on thehistory of tropical savannas in northern South America, LeidesGeologische Mededelingen, 38, 71–90, 1966.
Wille, M., Hooghiemstra, H., Behling, H., Van der Borg, K., andNegret, A. J.: Environmental change in the Colombian suban-dean forest belt from 8 pollen records: the last 50 kyr, Veg. His.Archaeobot., 10, 61–77, 2001.
Wille, M., Negret, J. A., and Hooghiemstra, H.: Paleoenvironmen-tal history of the Popayan area since 27000 yr BP at Timbio,Southern Colombia, Rev. Palaeobot. Palynol., 109, 45–63, 2000.
Wijmstra, T. A. and van der Hammen, T.: Palynological data on thehistory of tropical savannas in northern South America, LeidseGeologische Mededelingen, 38, 71–90, 1966.
Wijmstra, T. A.: The Palynology of the Guiana coastal Basin, Uni-versity of Amsterdam, 72 pp, 1971.
Whitmore, T. C.: Quaternary History of tropical America, in: Bio-geography and Quaternary History in Tropical America, editedby: Whitmore, T. C. and Prance, G. T., Clarendon Press, Oxford,1987.
Williams, J. W., Summer, R. S., and Webb III, T.: Applying PlantFunctional types to construct biome maps from eastern NorthAmerican Pollen Data: Comparisons with model results, Quat.Sci. Rev., 17, 607–627, 1998.
Williams, J. W., Webb III, T., Richard, P. J. H., and Newby, P.: LateQuaternary Biomes of Canada and the Eastern United States, J.Biog., 27, 523–538, 2000.
Wingenroth, M. and Suarez, J.: Flores de los Andes – Alta montanade Mendoza. IANIGLA (Instituto Argentino de Nivolgia y Gla-cologia, Argentina, 1984.
Witte, H. J. L.: Present and past vegetation and climate in the NorthAndes (Cordillera Central, Colombia); a quantitative approach.PhD Thesis, University of Amsterdam, The Netherlands, 1994.
Woodward, F. I.: Climate and plant distribution, Cambridge Uni-versity Press, Cambridge, 1987.
Wu, H., Guiot, J., Brewer, S., and Guo, Z.: Climatic changesin Eurasia and Africa at the last glacial maximum and mid-Holocene: reconstruction from pollen data using inverse vege-tation modelling, Clim. Dynam., 29, 211–229, 2007a.
Wu, H., Guiot, J., Brewer S., Guo, Z., and Peng, C.: Dominant fac-tors controlling glacial and interglacial variations in the treelineelevation in tropical Africa, PNAS 104, 9720–9724, 2007b
Yu, G. and Harrison, S. P.: Lake status records from Europe: database documentation. NOAA Paleoclimatology Publication Se-ries, report, 3, 1–451, NOAA, Boulder, Colorado, 1995.
Yu, G., Prentice, I. C., Harrison, S. P., and Sun, X.: Pollen-basedbiome reconstruction for China at 0 and 6000 years, J. Biog., 25,1055–1069, 1998.
Yu, G., Xudong, C., Jian, N., Cheddadi, R., Guiot, J., Huiyou, H.,Harrison, S. P., Ci-xuan, H., Jolly, D., Manhong, K., Zhaochen,K., Shengfeng, L., Wen-yi, L., Liew, P. M., Gunagxu, L., Jinling,L., Liu, K-B., Prentice, I. C., Guoyu, R., Changqing, S., Sugita,S., Xiangjun, S., Lingyu, T., Van Campo, E., Yumei, X., Qinghai,X., Shun, Y., Xiangdong, Y., and Zhuo, Z.: Palaeovegetation ofChina: a pollen data-based synthesis for the mid-Holocene andlast glacial maximum, J. Biog., 27, 635–664, 2001.
Xelhuantzi-Lopez, M. S.: Palynologie et paleoenvironment dubassin de Zacapu, Michoancan, Mexique, depuis 8000 ans, Ge-ofisica Internacional., 34, 239–248, 1995.
www.clim-past.net/5/725/2009/ Clim. Past, 5, 725–767, 2009