political support in hard times: do people care about ... people expressed their dissatisfaction...
TRANSCRIPT
(WZB) Berlin Social Science Center Research Area Markets and Choice Research Unit Market Behavior
Put your Research Area and Unit
Jana Friedrichsen Philipp Zahn Political Support in Hard Times: Do People Care about National Welfare?
Discussion Paper
SP II 2013–212 December 2013
Wissenschaftszentrum Berlin für Sozialforschung gGmbH Reichpietschufer 50 10785 Berlin Germany www.wzb.eu
Jana Friedrichsen, Philipp Zahn Political Support in Hard Times: Do People Care about National Welfare?
Affiliation of the authors:
Jana Friedrichsen WZB and Humboldt University Berlin
Philipp Zahn University of Mannheim
Copyright remains with the author(s).
Discussion papers of the WZB serve to disseminate the research results of work in progress prior to publication to encourage the exchange of ideas and academic debate. Inclusion of a paper in the discussion paper series does not constitute publication and should not limit publication in any other venue. The discussion papers published by the WZB represent the views of the respective author(s) and not of the institute as a whole.

Wissenschaftszentrum Berlin für Sozialforschung gGmbH Reichpietschufer 50 10785 Berlin Germany www.wzb.eu
Abstract
Political Support in Hard Times: Do People Care about National Welfare?
by Jana Friedrichsen and Philipp Zahn*
During the Great Recession mass demonstrations indicated weakened political support in Europe. We show that growing dissatisfaction often reflects poor economic conditions and unemployment is particularly important. Using individual level data for 16 Western European countries for 1976–2010, we �find that national economic performance matters even beyond personal economic outcomes. Finally, while the effects of growth and unemployment rates are the same across demographic subsets, the effect of inflation is heterogeneous. Well-educated or working individuals put a relatively higher weight on price stability than the less skilled or not working. Our �findings reinforce the political importance of employment and growth policies.
Keywords: political support, satisfaction with democracy, growth, unemployment, collectivism
JEL classification: H11, O43, P16
* E-mail: [email protected], [email protected].
We thank Hans-Peter Grüner for encouraging this work as well as Dirk Engelmann, Lisandra Flach, Christina Gathmann, Niklas Potrafke, Benjamin Protte and seminar participants at the University of Mannheim, the 2010 Silvaplana Workshop on Political Economy, the ECPR graduate conference 2010 (Dublin), and the annual meeting of the Verein für Socialpolitik 2011 (Frankfurt) for helpful discussions and comments. We are thankful to two anonymous referees for their comments that helped improve the paper and to Jennifer Rontganger for the professional proofreading. Johannes Bubeck, Kira Gährken, Gesa Langer, Signe Moe, and Alexander Volkmann provided excellent research assistance. We gratefully acknowledge �financial support from the Deutsche Forschungsgemeinschaft (DFG) through SFB 884 �Political Economy of Reforms.�
1. Introduction
During the Great Recession of 2007 several European countries experienced a phase
of economic hardship unprecedented in recent decades. The economic downturn
came with political repercussions: Mass demonstrations took place in many cities
as people expressed their dissatisfaction with the economic situation and how it was
being dealt with.1 By late 2011 the �ve EU member countries which had been hit the
hardest economically, Greece, Ireland, Italy, Portugal, and Spain, had overturned
their governments. Political actors as well as observers noted that democratic insti-
tutions themselves could su�er under adverse economic conditions. In summer 2010,
the president of the European Commission, José Manuel Barroso, even expressed
his fear that �democracy might disappear� in the most heavily a�ected Southern
European countries; he feared that macroeconomic conditions could worsen to an
extent that would be impossible for governments to deal with and would therefore
make them susceptible to popular uprisings (Groves, 2010). In Italy, the political
crisis deepened with the national elections held in early 2013 when the Five Star
Movement gained 25% of the vote but refused to support the government (Moody,
2013). Survey data from the Eurobarometer shows indeed that since the phase of
economic downturn peoples' attitudes toward their political system have worsened
substantially. In Spain, for instance, satisfaction with democracy (SWD) decreased
by about 20 percentage points between 2006 and 2010.
In this paper we show that the economic harshness during the last years can, to
a large extent, explain the observed deterioration of political support as measured
by the SWD. Combining individual-level survey data on SWD with country-level
data on growth, in�ation, and unemployment from 1976 to 2010 for 16 Western
European countries, we �nd that the macroeconomy a�ects individuals' attitudes
toward democracy and the e�ects are non-negligible in size. Using estimates from
pre-crisis data, we predict decreases in SWD in the order of 15 to 23 percentage
points as a consequence of poor economic conditions during the Great Recession.
These estimates compare well with the decreases of around 20 percentage points
measured for Ireland, Greece, and Spain. We also correctly predict Portugal to
be an outlier; while the observed decrease was 4 percentage points, we estimate a
decrease of close to 5 percentage points in satisfaction scores.
Even though we �nd both growth and unemployment rates to be signi�cant, the
latter are quantitatively much more important. When the growth rate decreases
by one standard deviation, the SWD is on average 2.5 percentage points lower; a
1The protests have received large media coverage, e.g., in Donadio & Sayare (2011) and Tremlett& Hooper (2011).
1

standard deviation increase in unemployment, however, comes about with a de-
crease of 7 percentage points in SWD. Politicians might therefore want to focus on
employment policies to ensure citizens' support because �jobless growth� appears
to be an undesirable policy outcome. In�ation, while signi�cant in analyses us-
ing a country panel, does not have a robust e�ect when we use individual level
data. This result, however, hides heterogeneity across subgroups of the population.
Higher educated and working individuals seem to care much more about in�ation
than do the unskilled or unemployed. In contrast, growth and unemployment rates
exhibit homogeneous e�ects on SWD throughout the population, even though the
real implications di�er across its subgroups. We argue that a pure self-interest ex-
planation of political support will not easily explain this observation. Resorting to
individual level data uncovers important drivers of SWD which remain undetected
in national-level analyses. In particular, individual unemployment, education, age,
and perceived life satisfaction are signi�cant correlates.
In section 2, we relate our research to the existing literature. In section 3 we
summarize our hypotheses (3.1), describe the dataset (3.2), and introduce our em-
pirical model (3.3). We present our results in section 4 and discuss implications
with respect to a self-interest explanation of political support and a policy trade-
o� between in�ation and unemployment (Phillips curve) in section 5. We present
robustness checks in section 6 and conclude in section 7. Appendix C contains
additional tables and is available online.
2. Related literature
According to Easton (1957, p. 391) �support is fed into the political system in
relation to three objects: the community, the regime, and the government�2 and
can derive from satisfaction with its outputs (Easton, 1957). Research on political
support often focuses on government popularity and thus refers to the most speci�c
dimension of political support (see Norris, 1999a, for an introduction). However,
during severe economic crises more than the competence of current governments is
questioned. We therefore use the variable `satisfaction with democracy' (SWD) as
an indicator of a more di�use dimension of political support.
SWD derives from the survey question �On the whole, are you very satis�ed,
fairly satis�ed, not very satis�ed or not at all satis�ed with the way democracy
works in <country>?� and provides an instrumental evaluation of the performance
2Similarly, Norris (1999b, p. 10, 16�20) distinguishes �ve layers of political support, the politicalcommunity, regime principles, regime performance, regime institutions, and political actors.
2
of democracy (Dalton, 1999, p. 58). However, the di�erent dimensions of political
support are interdependent and, indeed, SWD is shown to correlate with all three
dimensions of Easton's support classi�cation (Clarke et al., 1993). Linde & Ekman
(2003) argue, that �'satisfaction with the way democracy works' is . . . an item that
taps the level of support for the way the democratic regime works in practice.�
Complementary research using Latin-American data indicates that satisfaction with
democracy does indeed measure support for government rather than satisfaction
with the idea of democracy (see Graham & Suktahnkar, 2004, p. 372 and Sars�eld
& Echegaray, 2006). This seems natural as how the system is working depends on
incumbent politicians. In contrast to trust in politicians or government, SWD has
the advantage of being less in�uenced by personal sympathy for politicians or an
ideological attachment to a speci�c party.
Previous work on satisfaction with democracy typically relies on national level
data or covers relatively short time periods (Clarke et al., 1993; Wagner et al.,
2009).3 Results thereby rely to a large extent on cross-country variation and in-
dividual characteristics are ignored.4 Furthermore, there is hardly any systematic
evidence on the role of macroeconomic factors. We are aware of only three studies
of SWD employing individual-level data: Halla et al. (2013) investigate the role of
environmental policy, Wells & Krieckhaus (2006) the e�ect of corruption on SWD,
and Lühiste (forthcoming) the role of social protection. The latter two studies use
only a few points in time and cannot properly take into account changes in national
economic conditions over time.5 Halla et al. (2013) employ individual level data with
a long time dimension but their data ends in 2001. Neither of these studies discusses
the economic relevance and relation between di�erent measures of macroeconomic
performance systematically.
Revolutionary action or political extremism are likely to indicate the absence of
political support and constitute another facet of the related literature. Brückner &
Grüner (2010) �nd a negative relationship between growth and right-wing extremist
voting at the aggregate level for 16 Western European countries. Using German
data, Falk et al. (2011) �nd that the regional unemployment rate has a positive and
statistically signi�cant e�ect on right-wing extremist crimes. Moving to the micro-
level, Lubbers et al. (2002) show how support of extreme right-wing parties increases
with unemployment for the same set of countries. MacCulloch & Pezzini (2007)
3The study by Wagner et al. (2009) uses the average of the ordinal SWD score as dependentvariable. Due to the ordinality of SWD it is problematic to interpret their results quantitatively.
4While aggregate-level analyses can, in principle, incorporate individual characteristics as aver-ages, the individual dimension is usually left out completely.
5All of these studies use data from the Eurobarometer for Western European countries. Wells &Krieckhaus (2006) also consider Central and Eastern European countries.
3

employ survey data from 64 countries and provide evidence that the preference for
revolution increases when the economy performs poorly.6
More generally, this research relates to the literature on economic voting. There
is evidence that voters evaluate macroeconomic outcomes retrospectively and vote
accordingly in subsequent elections but also prospective voting has been proposed
as an explanation and has received empirical support. Since this literature is very
broad, we refer the interested reader to the survey on vote and popularity functions
by Nannestad & Paldam (1994) and to �Voting and the Macroeconomy� by Hibbs
(2006).
3. Hypotheses, data, and model speci�cation
3.1. Hypotheses
Earlier research posited a link from macroeconomic performance to political support
based on the presumption that �voters hold the government responsible for economic
events� (Lewis-Beck & Paldam, 2000). This can be based on self-interest: Economic
conditions determine future well-being. Growth increases expected income, in�a-
tion reduces the real value of wealth and income, and higher unemployment implies
higher risk of job or income loss. Therefore, individuals value, e.g., high growth as an
indicator of increasing national welfare, and high in�ation and high unemployment
as signs of decreasing welfare. Going beyond the theory of pure self-interest, indi-
viduals may also care about the well-being of others. Macroeconomic performance
may increase an individual's satisfaction with democracy because it illustrates the
democratic system's capacity to provide collective well-being in the future.7
Based on the preceding argument we expect that, ceteris paribus, an individual's
SWD is
• increasing in national growth,
• decreasing in in�ation and unemployment.
Furthermore, we expect that individual income and employment status have similar
e�ects, i.e., an individual's SWD is
6Both, Lubbers et al. (2002) and Brückner & Grüner (2010), use data from the Eurobarometer.While the latter only rely on a few data points in time, the former use the Mannheim trend�le covering 1970 to 2002. MacCulloch & Pezzini (2007) base their analysis on three waves ofthe World Value Survey.
7We are not positing a link between democratic and economic development. Rather, we arguethat generally, a better performing system will enjoy greater support. As a matter of fact, inour sample we only look at democratic systems.
4

• increasing in individual income,
• lower in case of personal unemployment.
Regarding other individual characteristics, we expect that an individual's SWD
is higher if he or she is better educated, younger, or male as documented in Bäck &
Kestilä (2009).
Empirically, we �nd a strong positive correlation between general life satisfaction
and SWD.8 Part of the reason for this correlation could be individual di�erences in
interpreting satisfaction questions which we would ideally control for with individual-
level �xed e�ects. This is infeasible because the data is a repeated cross-section.
However, by controlling for individual life satisfaction we can control for part of these
individual di�erences. Moreover, since existing studies show that life satisfaction
reacts to macroeconomic variables (e.g., Di Tella et al., 2003), not including it as an
explanatory variable induces an omitted variable bias into the estimation.
3.2. Data
Our data set combines survey data with national macroeconomic data for 16 coun-
tries and up to 33 years. Speci�cally, it covers France, Belgium, The Netherlands,
Germany (1976�2010, since 1991 including East Germany), Italy, Luxembourg, Den-
mark, Ireland, the United Kingdom, Greece (1981�2010), Spain and Portugal (1985�
2010), Norway (1990�1995), Finland (1993�2010), Sweden and Austria (1995�2010).
We obtain individual level data from the Mannheim Eurobarometer Trend File
1970�2002 (European Commission, Brussels, 2008) and nine additional Eurobarom-
eter waves that extend the dataset until 2010 (European Commission, Brussels,
2002, 2003, 2004a,b, 2006, 2007, 2009, 2010). The Eurobarometer survey covers
about 1,000 respondents per country per wave in a repeated cross-section. The in-
dicator SWD is based on the survey question: �On the whole, are you very satis�ed,
fairly satis�ed, not very satis�ed or not at all satis�ed with the way democracy
works in <country>?�9 which was asked every year from 1976 to 2010 except for
1996 and 2008. Figure 1 illustrates that SWD varies over time.
GDP per capita, GDP growth rates, in�ation rates, and unemployment rates
stem from the OECD Economic Outlook, growth projections from the database
OECD.StatExtracts. For robustness checks we used information on national budget
8Because of the empirically strong correlation, SWD could have similar determinants as has lifesatisfaction (see for instance Frey & Stutzer, 2002a). Bäck & Kestilä (2009) �nd that indeedthe e�ects for age and education go in the same direction. However, a gender e�ect appearswith the opposite sign: females have a lower SWD (Bäck & Kestilä, 2009).
9<country> is replaced by the name of the country in which the respondent was interviewed.
5

0.5
10
.51
0.5
10
.51
1980 1990 2000 2010 1980 1990 2000 2010 1980 1990 2000 2010 1980 1990 2000 2010
FRANCE BELGIUM NETHERLANDS GERMANY
ITALY LUXEMBOURG DENMARK IRELAND
UK GREECE SPAIN PORTUGAL
NORWAY FINLAND SWEDEN AUSTRIA
Per
cent
age
satis
fied
with
way
dem
ocra
cy w
orks
year (1976-2010)
Figure 1: Percentage of individuals satis�ed with democracy over time (weightedusing Eurobarometer sample weights)
de�cits, national government debt, and the share of social transfers from Armingeon
et al. (2013). Exact variable de�nitions can be found in table C.1, descriptive
statistics for all included national and individual variables in tables C.2 and C.3.
3.3. Model setup and speci�cation
We estimate a linear probability model using the following equation:
SWDitc = β0 +macrotcβ1 + individualitcβ2 + fet + fec + uitc (1)
where observations are indexed by i for individuals, by c for the country in which
the individual participated in the survey, and by t for the year of the survey. SWD
is a dummy derived from the question how satis�ed an individual is with the way
democracy works in his or her country. It collapses answers `very satis�ed' and
`fairly satis�ed' into `satis�ed' (SWD=1) and answers `not very satis�ed' and `not
at all satis�ed' into `not satis�ed' (SWD=0).
6
The dependent variable SWD as well as individual controls vary at the individual
level nested in years and countries, indexed by itc. Macro controls only vary at the
year-country level, indexed by tc. All estimations include country �xed e�ects fecand survey year �xed e�ects fet, and we correct standard errors for clustering at the
country level.
4. Results
We �rst address the impact of macroeconomic variables (Subsection 4.1) and then
the e�ects of individual level variables (Subsection 4.2). Individual unemployment,
education, income, and age are likely to be relevant for SWD and are not captured
in aggregates. Neglecting individual variables therefore means neglecting potentially
important driving factors of SWD and their interaction with aggregate factors. We
�nd that individual characteristics matter indeed and should therefore be taken
into account in studies that assess the implications of macroeconomic factors on
satisfaction with democracy.
4.1. Macroeconomic variables
Our main interest lies in growth, in�ation, and unemployment, which vary substan-
tially over time, which are responsive to economic policy in the short to medium
run, and are likely to be targeted by policy makers. Moreover, these variables have
been proven to be in�uential in previous studies on SWD (Wagner et al., 2009) and
right-wing extremism (Knigge, 1998; Brückner & Grüner, 2010). Since a large lit-
erature on the relationship between democracy and economy focuses on GDP (e.g.,
Przeworski, 2000; Acemoglu et al., 2008), we control for the GDP per head.10 The
following results are summarized in table 1.
National unemployment is highly statistically signi�cant in all speci�cations. Eco-
nomic growth is signi�cant most of the time but turns insigni�cant in the subsample
for which income is available (1976 to 2003). The sign of the coe�cients is, as ex-
pected, positive for growth and negative for the unemployment rate. In�ation gains
marginal signi�cance only if income is included. Per capita income does not gain
signi�cance.11
10For details on the determinants of democracy see Acemoglu & Robinson (2006); Acemoglu et al.(2008); Gassebner et al. (2013) and references therein.
11Our study analyzes well-established democracies and di�ers conceptually from studies on demo-cratic development. Still, these results are consistent with recent insights on the determinantsof democratization. Using extreme bounds analysis, Gassebner et al. (2013) �nd that neitherin�ation nor GDP per capita have a robust relationship with the emergence or survival of
7

Table 1: Impact of macroeconomic and individual level variables on SWD (individual data)
dependent: SWD (1) (2) (3) (4) (5) (6) (7)
macroeconomic variablesGDP/head 0.0045 0.0044 0.0009 0.0009 0.0011 0.0035 0.0034
(0.003) (0.003) (0.003) (0.003) (0.003) (0.002) (0.003)growth 0.0128*** 0.0138*** 0.0100*** 0.0101** 0.0110*** 0.0055 0.0050
(0.004) (0.003) (0.003) (0.004) (0.003) (0.003) (0.004)in�ation -0.0099 -0.0141 -0.0151 -0.0150 -0.0175 -0.0063*
(0.012) (0.010) (0.010) (0.011) (0.010) (0.003)in�ation2 0.0005 0.0005 0.0005 0.0005 0.0005 0.0005
(0.000) (0.000) (0.000) (0.000) (0.000) (0.000)UE rate -0.0176*** -0.0199*** -0.0194*** -0.0181*** -0.0183***
(0.003) (0.003) (0.003) (0.003) (0.004)individual variablesunemployed -0.0509*** -0.0511*** -0.0479*** -0.1097*** -0.1134*** -0.0404*** -0.0353***
(0.006) (0.006) (0.006) (0.009) (0.009) (0.008) (0.007)outo�f -0.0020 -0.0022 -0.0015 -0.0043 -0.0052 -0.0014 0.0021
(0.004) (0.004) (0.004) (0.005) (0.005) (0.005) (0.004)married 0.0001 0.0003 0.0012 0.0262*** 0.0271*** -0.0003 -0.0042
(0.004) (0.004) (0.004) (0.004) (0.004) (0.005) (0.006)male 0.0068* 0.0067* 0.0070* 0.0036 0.0034 0.0061 0.0061
(0.004) (0.004) (0.003) (0.004) (0.004) (0.004) (0.004)age -0.0023*** -0.0024*** -0.0025*** -0.0050*** -0.0052*** -0.0025*** -0.0026***
(0.001) (0.001) (0.001) (0.001) (0.001) (0.001) (0.001)age2 2.56e-05*** 2.62e-05*** 2.75e-05 *** 5.25e-05*** 5.5e-05*** 2.7e-05*** 2.91e-05***
(6.23e-06) (6.14e-06) (6.15e-06) (5.93e-06) (5.85e-06) (7.44e-06) (6.80e-06)poor -0.0095
(0.006)rich 0.0141**
(0.005)educationintermediate 0.0094 0.0092 0.0085 0.0213** 0.0216*** 0.0072 0.0043
(0.007) (0.007) (0.007) (0.008) (0.007) (0.009) (0.008)higher 0.0282* 0.0274* 0.0269* 0.0514*** 0.0516*** 0.0160 0.0108
(0.014) (0.014) (0.013) (0.013) (0.014) (0.016) (0.014)still studying 0.0297* 0.0289* 0.0280* 0.0595*** 0.0600*** 0.0154 0.0102
(0.014) (0.014) (0.014) (0.016) (0.016) (0.017) (0.015)life satisfactionnot at all . . . -0.3405*** -0.3410*** -0.3378*** -0.3533*** -0.3503***
(0.024) (0.024) (0.023) (0.029) (0.029)not very . . . -0.2478*** -0.2477*** -0.2456*** -0.2643*** -0.2625***
(0.017) (0.017) (0.016) (0.020) (0.020)very . . . 0.0751*** 0.0748*** 0.0745*** 0.0802*** 0.0791***
(0.005) (0.005) (0.004) (0.006) (0.005). . . satis�ed
survey FE yes yes yes yes yes yes yesnation FE yes yes yes yes yes yes yes
N 607486 607486 607486 665495 607486 353132 353132adj. R2 0.139 0.139 0.143 0.097 0.096 0.150 0.150
* p<0.10, ** p<0.05, *** p<0.01, standard errors are corrected for clustering at nation level.Column 3 is our main speci�cation and is used as a benchmark for our robustness checks. In (4) we exclude life satisfactionfrom the estimation. In (5) we restrict attention to the subsample were life satisfaction is available. (6) is estimated on thereduced sample where income is available, (7) controls for income groups.
8

Quantitatively, unemployment is much more important than growth. An increase
by one percentage point in the unemployment rate comes on average with a decrease
of 1.8 percentage points in satisfaction with democracy, a one percentage point
decrease in growth only with a decrease by 1 percentage point. If the growth rate
increased by one standard deviation, this would imply an increase in SWD of about
2.5 percentage points.12 If instead the unemployment rate increased by one standard
deviation, SWD would be on average 7 percentage points lower. Thus, the e�ect of
unemployment is almost three times as large as that of growth.13
Since unemployment and in�ation are both negatively correlated with growth in
our dataset, the coe�cient on growth is upward biased if we omit those. Without
other macroeconomic controls except for per capita GDP a one percentage point
higher growth comes on average with a 1.3 percentage points higher probability
of satisfaction (column 1). When all three macroeconomic variables are included,
growth obtains a smaller coe�cient than before but remains signi�cant at the 5%
level (column 3).
4.2. Individual characteristics
It is evident that the respondents' views on the democratic system were not only
a�ected by the national labor market but in addition by the individual situation.
Individual unemployment, education, and age are signi�cant and the coe�cients
have the expected signs. An unemployed respondent was 4.8 percentage points less
likely to be satis�ed with democracy than an employed one (table 1, column 3).
Education was included in dummy categories. The results indicate that those with
higher education (�nished school at the age of 20 or later) and those still studying
evaluated democracy more favorably than those with only basic or no full-time
education at all. The in�uence of age is U-shaped. Relatively young age individuals
become, on average, less satis�ed as they get older, but as they get old enough the
democracy whereas growth has but that growth improves the chances of both democracy andautocracy surviving. Thus, growth seems to improve �political support� in both democraciesand non-democracies. The study does not include unemployment rates. Using data from 14transition countries for the period 1991�2004, Golinelli & Rovelli (2013) �nd that citizens aremore likely to support reforms if growth is higher and unemployment lower. The insigni�canceof GDP per capita for democratic development had previously been shown also by Acemogluet al. (2008).
12The standard deviation of growth is 2.54 in our sample and that of the unemployment rate is3.99.
13We thank an anonymous referee for pointing out that the result might hide a threshold e�ect.More generally, if the true e�ect of growth is nonlinear, the linear model would not be a correctrepresentation of the marginal e�ect of growth.
9
relationship reverses. The estimates from Column 3, Table 1 imply that around the
age of 45 individuals start to become more satis�ed with democracy.
As in Bäck & Kestilä (2009), the male dummy obtained a signi�cant, positive
coe�cient whereas it is often negative in happiness studies (see e.g., Frey & Stutzer,
2002a). Economically, however, gender is negligible; being male is associated with
not even a one percentage point higher probability of being satis�ed with democracy.
Those who were out of the labor force did not evaluate democracy signi�cantly
di�erently than those who were employed. Marital status did not reach signi�cance
either.
Life satisfaction is strongly positively correlated with SWD. This indicates a close
link between the perceived personal situation and the view on the democratic system.
Those who were not at all satis�ed with their lives were much less likely to state
that they were satis�ed with the way democracy worked (-34 percentage points)
than those who were fairly satis�ed with their lives (omitted category). Those who
stated being not very satis�ed with their life in general were much less likely to be
satis�ed with democracy (-25 percentage points) and those who were very satis�ed
with their life were in contrast more likely to be also satis�ed with democracy (+7
percentage points).
Life satisfaction as well as SWD are subjective measures and we are aware of con-
cerns regarding the use of subjective variables as dependent and explanatory at the
same time (Bertrand & Mullainathan, 2001). However, many studies indicate that
macroeconomic variables also a�ect individual life satisfaction and happiness (see
e.g., Di Tella et al., 2001, 2003; Deaton, 2008; Dreher & Öhler, 2011). Ignoring this
will likely introduce a bias into the results, in particular, since life satisfaction is also
known to be correlated with other individual characteristics (see for instance Frey
& Stutzer, 2002b). In our case, quantitative �ndings from the speci�cation with life
satisfaction are more conservative than they are without it. Comparing column 3
(with life satisfaction) with columns 4 and 5 (without) in table 1, we conclude that
the e�ects of unemployment, age, marital status, and education are probably over-
estimated when life satisfaction is not included. The coe�cients of macroeconomic
variables change very little; growth and unemployment slightly increase when life
satisfaction is not included.14
We do not control for income in our main analysis because we are in particu-
lar interested in including the recent recessionary years but details of income were
requested only up to 2004. If we still include income, we �nd a small e�ect. Rich
14Note that changes in coe�cients are not due to a selection e�ect. In column 5 we show resultsfrom the model without life satisfaction in the sample where the variable is available. There ishardly any di�erence between column 4 (full sample) and column 5 (restricted sample).
10

people have a slightly higher probability of being satis�ed with democracy compared
to middle income earners. There is no signi�cant e�ect of low income. The results
regarding other individual characteristics remain una�ected beyond a selection ef-
fect that is driven by the availability of the income measure as can be seen from
columns 6 (subsample for which income is available, not controlling for income) and
7 (controlling for income) in table 1.
With respect to individual characteristics our results are very similar to Halla et al.
(2013), qualitatively. The signs of all coe�cients are the same with one exception:
In contrast to Halla et al. (2013) we do not �nd a signi�cantly positive e�ect of
being married on SWD. This di�erence is most likely due to the omission of life
satisfaction in their study (see table 1). As discussed above, life satisfaction should
be included in analyses of SWD because an omitted variable bias is likely to occur
otherwise (see also section 3.1).
5. Discussion
5.1. Economic relevance: satisfaction scores during the Great
Recession
Our results suggest that, on average, satisfaction with democracy should have de-
creased by non-negligible numbers during the Great Recession. We estimated our
model on pre-crisis data and computed predicted changes in satisfaction with democ-
racy due to worsening economic conditions. Using data until 2006, we estimate the
coe�cients to be signi�cant at 0.0089 for growth (standard error: 0.003) and at
-0.0170 for unemployment (standard error: 0.004). In�ation and per capita GDP
remain insigni�cant. Based on these coe�cients we predict that the observed de-
velopments of growth and unemployment rates between 2006 and 2010 would have
led to decreases in SWD by about 21 (Ireland), 24 (Spain) and 15 (Greece) percent-
age points. In 2010, the average SWD in these countries had actually decreased by
about 20 percentage points as compared to the situation prior to the Great Reces-
sion. In Ireland, satisfaction with democracy fell from 0.78 in 2006 to 0.58 in 2010
according to Eurobarometer data; in Spain in the same period from 0.74 to 0.53, in
Greece from 0.54 to 0.30. For Portugal, where SWD decreased by only 4 percentage
points from 0.31 to 0.27, we compute an expected decrease in SWD of just below 5
percentage points.15
15Changes in growth rates between 2006 and 2010 were -6.4 percentage points for Ireland, -4.4 forSpain, -10.5 for Greece, and +0.5 for Portugal. Unemployment rates increased by 9.1 percentage
11
Even though the above calculations match surprisingly well with the actual de-
velopment, they are rough estimates with important caveats. First, our predictions
consider only macroeconomic variables. Thus, we ignore the e�ects running through
changes in individual variables (which are likely to aggravate results). Second, the
coe�cients are based on annual data. If macroeconomic conditions are poor over
longer time periods, our simple calculation may be inappropriate. It is possible
that people adapt to worsening economic conditions such that their satisfaction is
on average a�ected less than if there is only a short downturn. It is, however, also
imaginable that individuals become increasingly dissatis�ed if the macroeconomy
fails to recover for several years. Our approach cannot speak for these hypotheses.
5.2. Channels of in�uence: Micro or macro? Sel�sh citizens
or collectivist concerns?
Unemployment manifests itself not only at the national but also directly at the indi-
vidual level because a change in the national unemployment rate leads to a change
in employment status for some citizens. At the individual level, being unemployed
is associated with a 4.79 percentage point decrease in satisfaction with democracy.
To have the same e�ect, the national unemployment rate would have to increase by
substantial 2.7 percentage points. Suppose unemployment increases by 1 percent-
age point. When we aggregate the individual e�ects of being unemployed on the
SWD for those who become unemployed at the national level, this indirect e�ect
amounts to a change of −0.05 percentage points in SWD whereas the direct e�ect
of the increase in national unemployment is −1.76 percentage points and the total
e�ect is the sum of the two.16 An additional indirect e�ect coming from changes
in life satisfaction will further aggravate the e�ect of rising unemployment since the
unemployed are on average less satis�ed with their lives.
This comparison of individual versus national level determinants takes into ac-
count only one period. Taking a longer-term perspective, the e�ect of individual
unemployment is likely larger. Since unemployed individuals are less satis�ed with
democracy (and their lives) than their employed peers, a change in national unem-
ployment implies a persistent level e�ect in SWD. Even when unemployment rates
do not worsen in subsequent periods, as long as unemployment is not cut back again,
points in Ireland, by 11.6 in Spain, by 3.1 in Greece, and by 3.1 in Portugal between 2006 and2010 (OECD, 2011).
16Coe�cients are taken from table 1, column 3. In line with this calculation, the e�ect of unem-ployment in the aggregate level regression without individual controls is greater than in theindividual level estimation (table 4, column 3).
12
those who have become unemployed remain less satis�ed and imply on average a
lower SWD in every period after the change.
The above comparison con�rms that national level variables are relevant for an
individual's satisfaction with democracy but does not tell us why. The in�uence of
national unemployment rates can be consistent with pure self-interest. For instance,
unemployment rates are indicative of the risk of becoming unemployed, of wage de-
velopments, or upcoming job opportunities. Similarly, growth rates being signi�cant
does not imply that individuals care about the performance of their country as a
greater good. Possibly, they value growth as an indicator of higher transfers, better
public services, lower taxes, or other outcomes that materialize at the individual
level and represent the self-interest dimension of national performance.
By analyzing subpopulations, we show that the e�ects we �nd are unlikely to be
explained by simple self-interest alone. We focus on subsamples which di�er with
respect to education and labor market status so that the labor market chances of the
resulting groups are objectively di�erent (tables 2 and 3). Surprisingly, the e�ects of
growth and unemployment rates are signi�cant for all groups and not signi�cantly
di�erent in size across groups (see table 2). Unemployed versus employed, low-skilled
versus high-skilled, and those in or out of the labor force are di�erently exposed to
labor market conditions such that we would have expected heterogeneous e�ects
according to the self-interest model. Not �nding such di�erences suggests other
factors are at work.
One explanation is collectivist welfare concerns. Individuals may believe democ-
racy to be the system that is best able to provide collective welfare. Growth and
low unemployment are success indicators of this system's performance and make
individuals be satis�ed with democracy even when it does not directly maximize
their expected personal income since their `true preference' implies a concern for
collective welfare (see Sen, 1977, for a similar argument). Another explanation is
that individuals take general equilibrium e�ects and their consequences at the indi-
vidual level into account. For instance, they anticipate cuts in transfers or increases
in taxes when the economic situation is worsening.17
5.3. Heterogeneous e�ects and the trade-o� between
unemployment and in�ation
An enduring economic policy debate concerns a possible trade-o� between in�ation
and unemployment which societies may face. We use our estimation results to
17For the e�ects to be similar across groups these general e�ects must outweigh any di�erentiale�ect stemming from, e.g., individual labor market prospects.
13

Table 2: Analysis of subgroups - Subsamples
dependent: SWD (1) (2) (3)subsample lowedu=1 unemployed out of LF
macroeconomic variablesGDP/head 0.0053 0.0008 0.0021
(0.003) (0.003) (0.003)growth 0.0102** 0.0089*** 0.0096***
(0.004) (0.003) (0.003)in�ation -0.0110 -0.0107 -0.0124
(0.013) (0.009) (0.009)in�ation2 0.0003 0.0004 0.0004
(0.000) (0.000) (0.000)UE rate -0.0195*** -0.0181*** -0.0179***
(0.003) (0.002) (0.003)individual characteristicsunemployed -0.0396***
(0.009)out of LF 0.0003
(0.005)
ind. controls yes yes yessurvey FE yes yes yesnation FE yes yes yes
N 203908 35594 267832adj. R2 0.152 0.146 0.135
Chow test: subsample versus full sample (Prob > χ2)growth 0.8983 0.5064 0.4604UE rate 0.1981 0.7987 0.7503Chow test: subsample versus complementary sample (Prob > χ2)growth 0.8762 0.3852 0.4398UE rate 0.1787 0.7635 0.8163
* p<0.10, ** p<0.05, *** p<0.01, standard errors are correctedfor clustering at nation level.The test against full sample compares coe�cients from an estima-tion on the subsample to those from the benchmark estimation intable 1, column 3. Complementary subsamples are low educationversus high education, unemployed versus employed, and out oflabor force versus in the labor force.
14
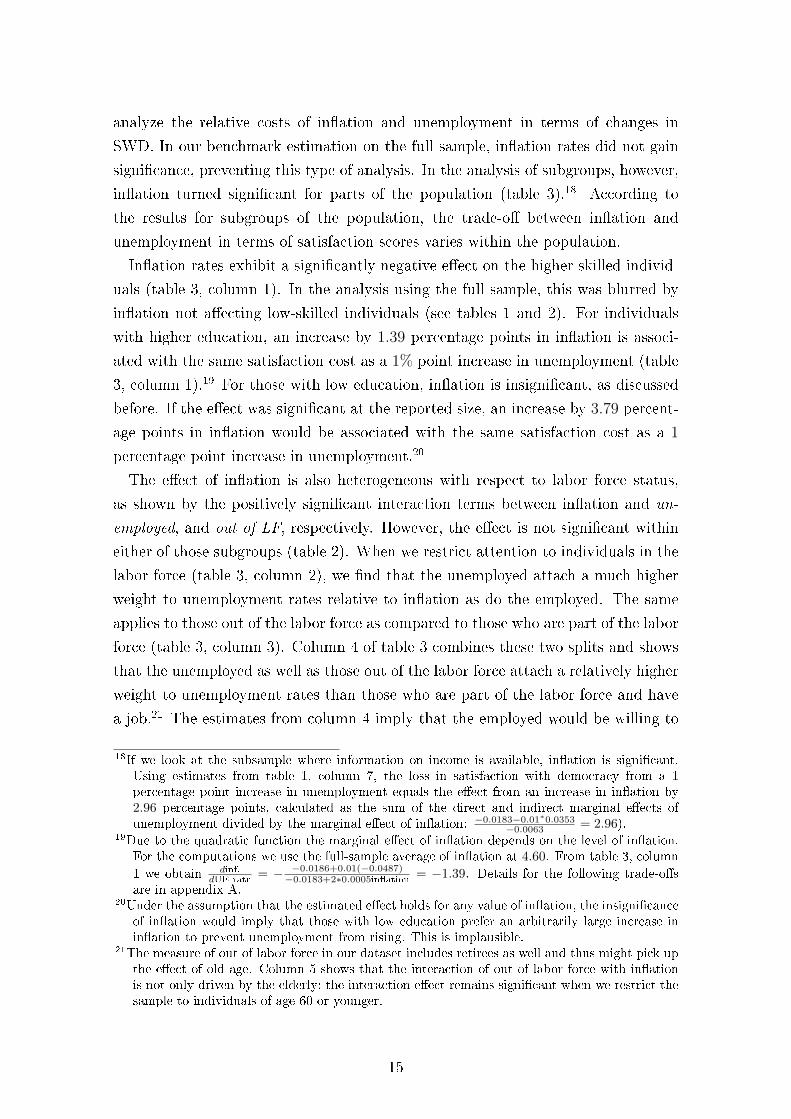
analyze the relative costs of in�ation and unemployment in terms of changes in
SWD. In our benchmark estimation on the full sample, in�ation rates did not gain
signi�cance, preventing this type of analysis. In the analysis of subgroups, however,
in�ation turned signi�cant for parts of the population (table 3).18 According to
the results for subgroups of the population, the trade-o� between in�ation and
unemployment in terms of satisfaction scores varies within the population.
In�ation rates exhibit a signi�cantly negative e�ect on the higher skilled individ-
uals (table 3, column 1). In the analysis using the full sample, this was blurred by
in�ation not a�ecting low-skilled individuals (see tables 1 and 2). For individuals
with higher education, an increase by 1.39 percentage points in in�ation is associ-
ated with the same satisfaction cost as a 1% point increase in unemployment (table
3, column 1).19 For those with low education, in�ation is insigni�cant, as discussed
before. If the e�ect was signi�cant at the reported size, an increase by 3.79 percent-
age points in in�ation would be associated with the same satisfaction cost as a 1
percentage point increase in unemployment.20
The e�ect of in�ation is also heterogeneous with respect to labor force status,
as shown by the positively signi�cant interaction terms between in�ation and un-
employed, and out of LF, respectively. However, the e�ect is not signi�cant within
either of those subgroups (table 2). When we restrict attention to individuals in the
labor force (table 3, column 2), we �nd that the unemployed attach a much higher
weight to unemployment rates relative to in�ation as do the employed. The same
applies to those out of the labor force as compared to those who are part of the labor
force (table 3, column 3). Column 4 of table 3 combines these two splits and shows
that the unemployed as well as those out of the labor force attach a relatively higher
weight to unemployment rates than those who are part of the labor force and have
a job.21 The estimates from column 4 imply that the employed would be willing to
18If we look at the subsample where information on income is available, in�ation is signi�cant.Using estimates from table 1, column 7, the loss in satisfaction with democracy from a 1percentage point increase in unemployment equals the e�ect from an increase in in�ation by2.96 percentage points, calculated as the sum of the direct and indirect marginal e�ects ofunemployment divided by the marginal e�ect of in�ation: −0.0183−0.01
∗0.0353−0.0063 = 2.96).
19Due to the quadratic function the marginal e�ect of in�ation depends on the level of in�ation.For the computations we use the full-sample average of in�ation at 4.60. From table 3, column
1 we obtain dinf.dUE rate
= − −0.0186+0.01(−0.0487)−0.0183+2∗0.0005in�ation = −1.39. Details for the following trade-o�s
are in appendix A.20Under the assumption that the estimated e�ect holds for any value of in�ation, the insigni�cance
of in�ation would imply that those with low education prefer an arbitrarily large increase inin�ation to prevent unemployment from rising. This is implausible.
21The measure of out of labor force in our dataset includes retirees as well and thus might pick upthe e�ect of old age. Column 5 shows that the interaction of out of labor force with in�ationis not only driven by the elderly; the interaction e�ect remains signi�cant when we restrict thesample to individuals of age 60 or younger.
15

Table 3: Analysis of subgroups - Interaction e�ects
dependent: SWD (1) (2) (3) (4) (5)groups w.r.t. education labor market status
macroeconomic variablesGDP/head 0.0009 -0.0000 0.0009 0.0010 0.0006
(0.003) (0.003) (0.003) (0.003) (0.003)growth 0.0090** 0.0103*** 0.0096*** 0.0096** 0.0093**
(0.003) (0.003) (0.003) (0.003) (0.004)in�ation -0.0183** -0.0162 -0.0164* -0.0173* -0.0165*
(0.008) (0.010) (0.009) (0.009) (0.009)in�ation2 0.0005** 0.0006* 0.0006* 0.0006* 0.0006*
(0.000) (0.000) (0.000) (0.000) (0.000)UE rate -0.0186*** -0.0176*** -0.0180*** -0.0181*** -0.0175***
(0.003) (0.003) (0.003) (0.003) (0.003)lowedu*growth 0.0017
(0.002)lowedu*UE rate 0.0021
(0.003)lowedu*in�ation 0.0105*
(0.006)lowedu*in�ation2 -0.0002
(0.000)unemployed*growth -0.0004 0.0001 -0.0001
(0.001) (0.001) (0.001)unemployed*UE rate 0.0008 0.0007 0.0012
(0.002) (0.002) (0.002)unemployed*in�ation 0.0084** 0.0081** 0.0077*
(0.004) (0.004) (0.004)unemployed*in�ation2 -0.0003* -0.0003* -0.0003
(0.000) (0.000) (0.000)out of LF*growth 0.0008 0.0009 0.0011
(0.001) (0.001) (0.001)out of LF*UE rate 0.0009 0.0010 0.0000
(0.001) (0.001) (0.001)out of LF*in�ation 0.0052*** 0.0061*** 0.0031**
(0.002) (0.002) (0.001)out of LF*in�ation2 -0.0002* -0.0002* -0.0001
(0.000) (0.000) (0.000)individual variablesunemployed -0.0487*** -0.0742*** -0.0481*** -0.0782*** -0.0808***
(0.005) (0.025) (0.006) (0.025) (0.025)out of LF 0.0012 -0.0295** -0.0330** -0.0080
(0.004) (0.013) (0.015) (0.012)lowedu -0.0812**
(0.031)
education dummies no yes yes yes yesind. controls yes yes yes yes yes
survey FE yes yes yes yes yescountry FE yes yes yes yes yes
Sample education available labor force full sample full sample age ≤ 60N 607486 339654 607486 607486 474658adj. R2 0.144 0.151 0.143 0.143 0.149
* p<0.10, ** p<0.05, *** p<0.01, standard errors are corrected for clustering at nation level.The dummy low education takes a value of 1 for basic education and 0 for higher education or stillstudying.
16

tolerate an increase in in�ation of 1.60 percentage points for a 1 percentage point
lower unemployment rate, those out of the labor force would accept an increase
by 2.51 percentage points in in�ation, and the unemployed would even tolerate an
increase by 2.93 for a decrease in the unemployment rate by 1 percentage point.
These numbers can be interpreted as marginal rates of substitution between in�a-
tion and unemployment. Looking at subgroups of the population is instructive: the
trade-o�s we estimated for population splits along the lines of education and labor
market status are in line with expected di�erences in the labor market perspectives of
the respective groups. If the labor market prospects are poorer as for the low-skilled
or unemployed, the relative weight put on unemployment rates is higher. According
to our analysis, the higher educated and those in the labor market and employed
are willing to accept relatively higher unemployment rates and desire lower in�ation,
as compared to the less educated and those unemployed or out of the labor force,
respectively. The estimated trade-o�s enclose the results from to Di Tella et al.
(2001) who use Eurobarometer data from 1975�1991 to estimate a marginal rate of
substitution between in�ation and unemployment of 1.66 in terms of life satisfaction.
When we aggregate our results to the full population, however, we obtain a higher
marginal rate of substitution indicating that for satisfaction with democracy in our
sample in�ation is less important than for life satisfaction in Di Tella et al. (2001)
(see appendix A).
5.4. Aggregate level regressions
Even though satisfaction with democracy is determined at the individual level, pre-
vious studies on SWD have concentrated on country averages. They collapse either
the ordered data to an average or a binary recode to a percentage measure of sup-
port; changes in these national averages can come by various channels hidden in the
aggregates. When we use the year-wise country average of SWD as the dependent
variable and estimate a linear probability model, the results are broadly consistent
with studies by other authors: growth is signi�cantly positive, unemployment and
in�ation are signi�cantly negative (compare for instance Clarke et al., 1993; Wagner
et al., 2009).
Comparing the results in table 4 with those from individual level data (table
1), however, we observe qualitative di�erences as GDP/head and in�ation become
signi�cant. The coe�cients of growth and unemployment using country-level data
have the same sign and are also of similar size as those in the individual-level data.
When we include the average score of life satisfaction (column 5), its e�ect is positive
17

and highly signi�cant as in the individual-level analysis. Moreover, all coe�cients
become smaller (in absolute terms) if life satisfaction is controlled for.
Table 4: Impact of macroeconomic variables on SWD(country panel)
dependent: SWD percentage SWD average SWD score(2) (3) (5) (6)
GDP/head 0.0024** 0.0017* 0.0030 0.0018
(0.001) (0.001) (0.002) (0.002)
growth 0.0083*** 0.0075*** 0.0151*** 0.0132***(0.002) (0.002) (0.004) (0.004)
in�ation -0.0141*** -0.0114*** -0.0297*** -0.0245***(0.004) (0.004) (0.006) (0.006)
in�ation2 0.0004** 0.0004** 0.0008*** 0.0008***(0.000) (0.000) (0.000) (0.000)
UE rate -0.0211*** -0.0142*** -0.0355*** -0.0239***(0.002) (0.002) (0.003) (0.003)
Avg. life satisfct. score 0.4650*** 0.8030***(0.045) (0.080)
ind. controls yes yes yes yessurvey FE yes yes yes yescountry FE yes yes yes yes
N 432 410 432 410adj. R2 0.783 0.833 0.796 0.839
* p<0.10, ** p<0.05, *** p<0.01, standard errors are corrected for clusteringat nation levels.Dependent variable is the average of the SWD dummy in a given country.
6. Robustness
Previous studies are inconclusive regarding an e�ect of in�ation on SWD. Halla
et al. (2013) �nd in�ation in levels to be signi�cant while the logarithm of in�ation
is insigni�cant in Wagner et al. (2009). A series of robustness checks regarding the
functional form of in�ation indicate that our results do not depend on choosing a
speci�c function of in�ation. Time trends do not seem to be crucial for our �ndings
either. A general time trend does not a�ect our results at all. In a model including
country-speci�c time trends, our results regarding growth and unemployment rates
are con�rmed but, in addition, in�ation becomes signi�cant. For details see table
C.4 and C.11.
We further show that our �ndings are robust with respect to including growth
lags, leads or forecasts and with respect to using non-linear models. Moreover,
we illustrate that our results are not driven by omitting indicators of institutional
quality or economic policy.
18
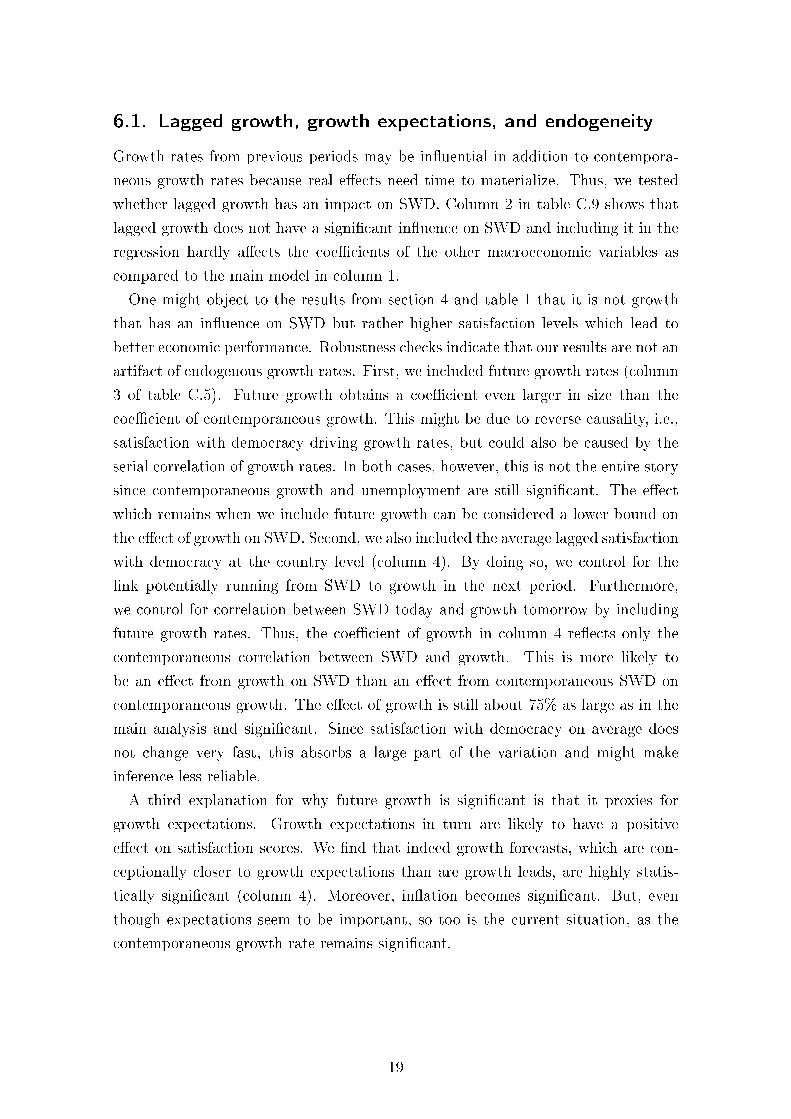
6.1. Lagged growth, growth expectations, and endogeneity
Growth rates from previous periods may be in�uential in addition to contempora-
neous growth rates because real e�ects need time to materialize. Thus, we tested
whether lagged growth has an impact on SWD. Column 2 in table C.9 shows that
lagged growth does not have a signi�cant in�uence on SWD and including it in the
regression hardly a�ects the coe�cients of the other macroeconomic variables as
compared to the main model in column 1.
One might object to the results from section 4 and table 1 that it is not growth
that has an in�uence on SWD but rather higher satisfaction levels which lead to
better economic performance. Robustness checks indicate that our results are not an
artifact of endogenous growth rates. First, we included future growth rates (column
3 of table C.5). Future growth obtains a coe�cient even larger in size than the
coe�cient of contemporaneous growth. This might be due to reverse causality, i.e.,
satisfaction with democracy driving growth rates, but could also be caused by the
serial correlation of growth rates. In both cases, however, this is not the entire story
since contemporaneous growth and unemployment are still signi�cant. The e�ect
which remains when we include future growth can be considered a lower bound on
the e�ect of growth on SWD. Second, we also included the average lagged satisfaction
with democracy at the country level (column 4). By doing so, we control for the
link potentially running from SWD to growth in the next period. Furthermore,
we control for correlation between SWD today and growth tomorrow by including
future growth rates. Thus, the coe�cient of growth in column 4 re�ects only the
contemporaneous correlation between SWD and growth. This is more likely to
be an e�ect from growth on SWD than an e�ect from contemporaneous SWD on
contemporaneous growth. The e�ect of growth is still about 75% as large as in the
main analysis and signi�cant. Since satisfaction with democracy on average does
not change very fast, this absorbs a large part of the variation and might make
inference less reliable.
A third explanation for why future growth is signi�cant is that it proxies for
growth expectations. Growth expectations in turn are likely to have a positive
e�ect on satisfaction scores. We �nd that indeed growth forecasts, which are con-
ceptionally closer to growth expectations than are growth leads, are highly statis-
tically signi�cant (column 4). Moreover, in�ation becomes signi�cant. But, even
though expectations seem to be important, so too is the current situation, as the
contemporaneous growth rate remains signi�cant.
19

6.2. Logit and ordered logit
In the preceding analysis, we have estimated a linear probability model with a binary
recode of SWD as the dependent variable. The advantages in terms of interpretation
and simplicity of the linear model seem to outweigh potential gains from a nonlinear
model (for a discussion see also Angrist & Pischke, 2009). Results from a logit
model that explicitly takes the domain restriction of the dependent variable into
account are qualitatively the same and quantitatively close to those from the linear
probability model. All marginal e�ects lie above the coe�cients from the linear
model so that our results are rather conservative. For details see tables C.6 and C.7.
We also analyzed determinants of SWD using the original, ordered outcome which
may contain more information but is supposedly more noisy (Veenhoven, 1996).
All variables which obtained signi�cance in the main analysis are signi�cant in the
ordered logit with the same sign. In addition and in line with results from an ordered
logit model in Halla et al. (2013), in�ation becomes marginally signi�cant.22 The
marginal e�ects are consistent with the view that the results in the binary recode
are driven by individuals switching from being not satis�ed to being satis�ed with
the way democracy works and vice versa. For details see table C.8.
6.3. Institutional quality
Our analysis assumes that democratic institutions in Western Europe did not change
over the relevant time horizon. This is not restrictive for several reasons. First, the
binary Democracy-Dictatorship measure (Cheibub et al., 2009) is constant for all
country-year pairs in our sample and indicates stable democracies. Consequently,
our results would remain the same if we controlled for institutional quality in this
sense. Second, controlling for either the Polity IV index (Marshall et al., 2011) or the
Freedom House index (Freedom House, 2011) does not a�ect our �ndings and the
indicators remain insigni�cant (table C.9). 23 Alternative indicators have not gained
signi�cance in studies using similar covariates either (e.g., elective fractionalization
in Halla et al., 2013, or the BERI index and others in Wagner et al., 2009) so we
refrain from additional tests. Third, Grosjean & Senik (2011) �nd no signi�cant
e�ect of market liberalization on support for democracy in Central and Eastern
Europe. We therefore do not expect any e�ect in Western European countries even
22While Halla et al. (2013) control for GDP and population and �nd both signi�cant with oppositesigns, we �nd that GDP per head never gains signi�cance. This is consistent with each otherand therefore not discussed further.
23Both indicators have often been used but are also criticized, e.g., by Cheibub et al. (2009).
20

if there have been major changes, for example, in the organization of the European
common market.
6.4. Policy measures
Obviously, it could be that not the macroeconomic outcomes in�uence citizens'
satisfaction but instead policies implemented by their governments (see e.g., Lühiste
(forthcoming) on the role of social protection for SWD). We therefore test for the
e�ects of debt and de�cit levels and also include two measures which proxy for social
spending, (1) the population aged 65 and above as a percentage of total population
and (2) social security transfers as a percentage of GDP. To be able to assess the
relevance of policy measures, we �rst estimate the main model on the subsample for
which all policy variables are available and then include the policy measures. The
inclusion of policy measures hardly a�ects the results. In contrast to Halla et al.
(2013), none of the policy variables gains signi�cance. Detailed results are provided
in table C.10.
7. Conclusion
The European debt crisis has had a severe impact on European democracies. In the
�ve most heavily a�ected EU member countries, Greece, Ireland, Italy, Portugal, and
Spain, governments have been voted out of o�ce. But the demands by the various
protestors went beyond the deselection of governments and people's perception of
the democratic system have changed in the course of the crisis, not only in Greece
and Italy but also in many other European countries.24
This paper shows that the changing attitudes toward democracy were to be ex-
pected as a consequence of extremely poor national economic performance. Lower
growth rates and higher unemployment rates were both associated with fewer respon-
dents stating they were satis�ed with the way democracy works in a representative
survey of European citizens. For drops in growth rates and rise in unemployment
rates as experienced, for example, by Spain or Ireland, our simple annual estimate
of a drop in satisfaction with democracy by 15 to 23 percentage points is close to
actual changes in satisfaction with democracy, which were around -20 percentage
points.
24The most recent example is Giuseppe Grillo's Five Star Movement in Italy, which gained 25%in the Italian elections in February 2013, refused to cooperate with other parties, and openlyexpressed discontent with the current state of Italian democracy (Moody, 2013).
21

Our analysis uncovered important new aspects. First, growth and unemployment
rates are simultaneously signi�cant correlates of SWD and, in contrast to previous
research, in�ation is insigni�cant. The insigni�cance of in�ation hides important
heterogeneity, though. While not signi�cant overall, in�ation has a signi�cantly neg-
ative e�ect on the SWD of individuals who are higher skilled or have a job. Second,
our results show that individual variables, in particular individual unemployment,
education and age, are important drivers of satisfaction with democracy. Moreover,
perceived life satisfaction has a strong e�ect and its inclusion increased explana-
tory power substantially (with respect to R2). Finally, while individual controls are
important, macroeconomic variables remain very relevant. National unemployment
and growth rates have a signi�cant e�ect. It is beyond the scope of this paper to
provide a clear-cut answer as to why national indicators are signi�cant. However, if
people's evaluation of democracy was driven by pure self-interest, we would expect
a di�erential e�ect of growth and unemployment across subgroups of the population
(for instance, skilled versus unskilled). Not �nding such di�erences may suggest
that collectivist concerns for national economic performance play a role.
Some tentative implications for economic policies can be drawn from our results.
Economic policies that result in good economic performance can increase peoples'
political support directly via national economic performance and indirectly when
the e�ects materialize at the individual level. Moreover, our analysis shows that the
unemployment rate is substantially more important than the in�ation rate in shaping
attitudes toward the democratic system and also more important than the growth
rate. From that perspective any policy intended to improve people's satisfaction
with the democratic system should prioritize job creation. Our results, however,
also reveal a limitation to these policies. Crucial for political support is personal life
satisfaction which cannot be easily addressed by economic policy and might not be
an appropriate political target either.
Appendix
A. The unemployment-in�ation trade-o�
We compute the marginal rates of substitution (MRS) between in�ation and unem-
ployment as
22
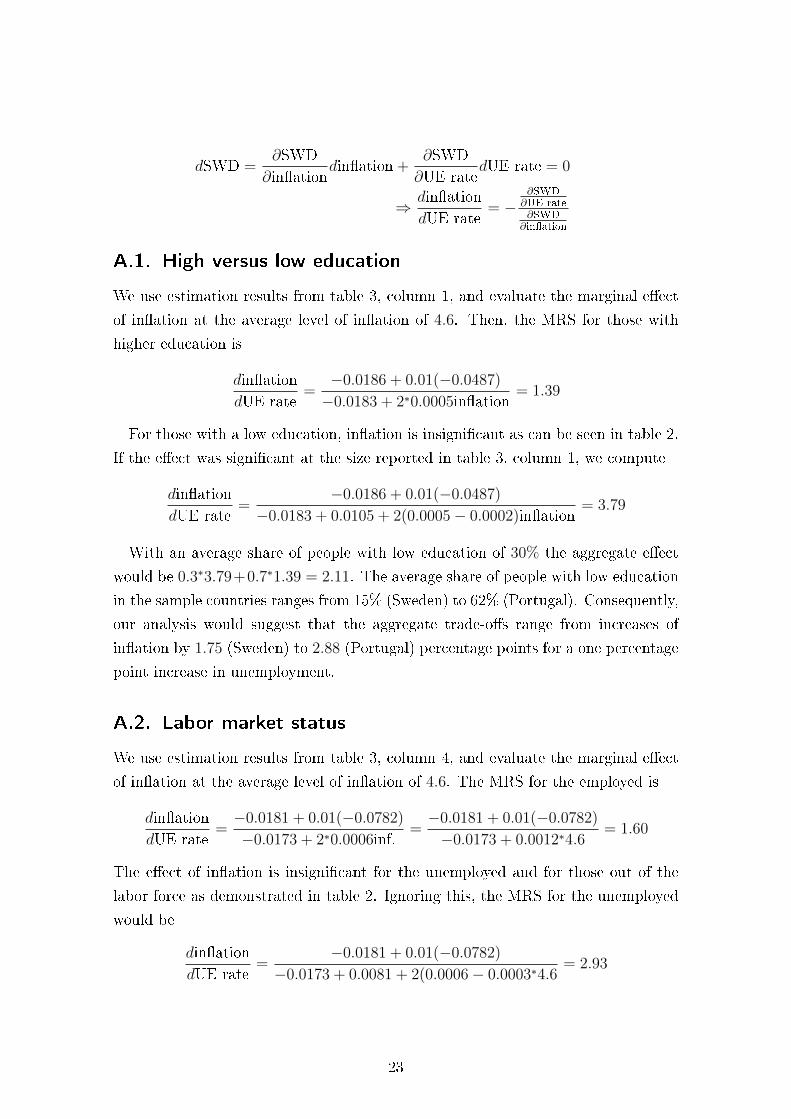
dSWD =∂SWD∂in�ation
din�ation+∂SWD∂UE rate
dUE rate = 0
⇒ din�ationdUE rate
= −∂SWD∂UE rate∂SWD∂in�ation
A.1. High versus low education
We use estimation results from table 3, column 1, and evaluate the marginal e�ect
of in�ation at the average level of in�ation of 4.6. Then, the MRS for those with
higher education is
din�ationdUE rate
=−0.0186 + 0.01(−0.0487)−0.0183 + 2∗0.0005in�ation
= 1.39
For those with a low education, in�ation is insigni�cant as can be seen in table 2.
If the e�ect was signi�cant at the size reported in table 3, column 1, we compute
din�ationdUE rate
=−0.0186 + 0.01(−0.0487)
−0.0183 + 0.0105 + 2(0.0005− 0.0002)in�ation= 3.79
With an average share of people with low education of 30% the aggregate e�ect
would be 0.3∗3.79+0.7∗1.39 = 2.11. The average share of people with low education
in the sample countries ranges from 15% (Sweden) to 62% (Portugal). Consequently,
our analysis would suggest that the aggregate trade-o�s range from increases of
in�ation by 1.75 (Sweden) to 2.88 (Portugal) percentage points for a one percentage
point increase in unemployment.
A.2. Labor market status
We use estimation results from table 3, column 4, and evaluate the marginal e�ect
of in�ation at the average level of in�ation of 4.6. The MRS for the employed is
din�ationdUE rate
=−0.0181 + 0.01(−0.0782)−0.0173 + 2∗0.0006inf.
=−0.0181 + 0.01(−0.0782)−0.0173 + 0.0012∗4.6
= 1.60
The e�ect of in�ation is insigni�cant for the unemployed and for those out of the
labor force as demonstrated in table 2. Ignoring this, the MRS for the unemployed
would be
din�ationdUE rate
=−0.0181 + 0.01(−0.0782)
−0.0173 + 0.0081 + 2(0.0006− 0.0003∗4.6= 2.93
23
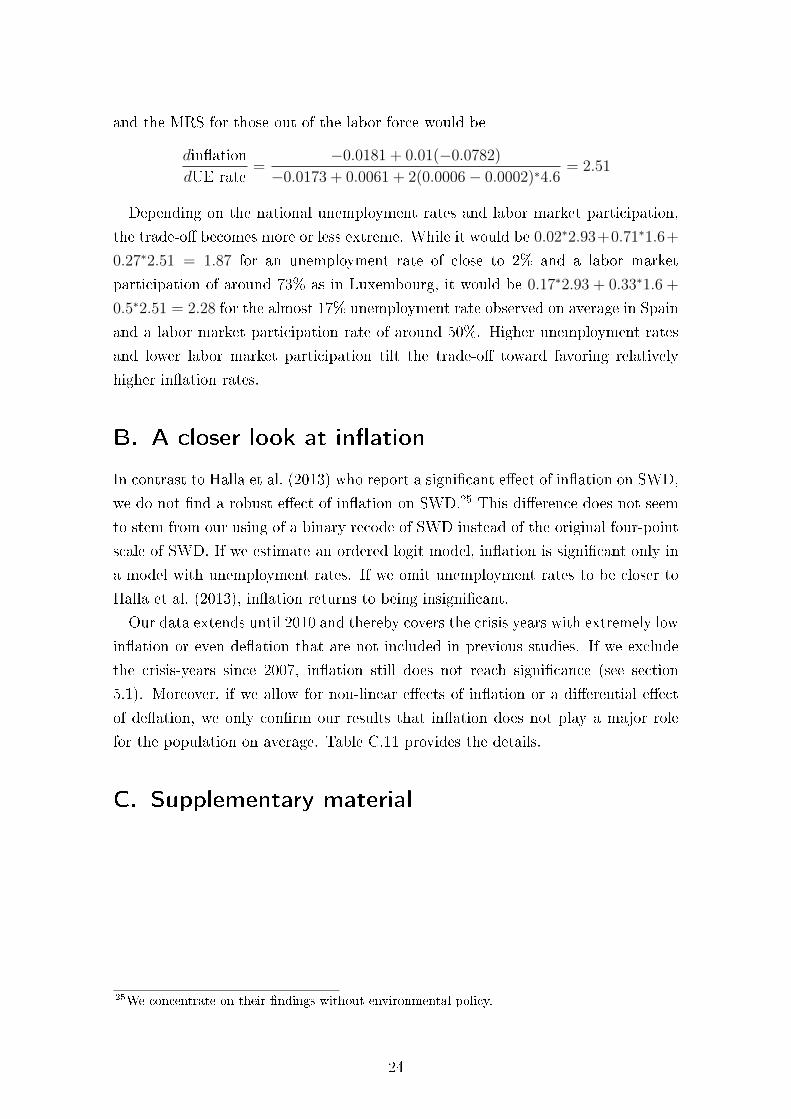
and the MRS for those out of the labor force would be
din�ationdUE rate
=−0.0181 + 0.01(−0.0782)
−0.0173 + 0.0061 + 2(0.0006− 0.0002)∗4.6= 2.51
Depending on the national unemployment rates and labor market participation,
the trade-o� becomes more or less extreme. While it would be 0.02∗2.93+0.71∗1.6+
0.27∗2.51 = 1.87 for an unemployment rate of close to 2% and a labor market
participation of around 73% as in Luxembourg, it would be 0.17∗2.93 + 0.33∗1.6 +
0.5∗2.51 = 2.28 for the almost 17% unemployment rate observed on average in Spain
and a labor market participation rate of around 50%. Higher unemployment rates
and lower labor market participation tilt the trade-o� toward favoring relatively
higher in�ation rates.
B. A closer look at in�ation
In contrast to Halla et al. (2013) who report a signi�cant e�ect of in�ation on SWD,
we do not �nd a robust e�ect of in�ation on SWD.25 This di�erence does not seem
to stem from our using of a binary recode of SWD instead of the original four-point
scale of SWD. If we estimate an ordered logit model, in�ation is signi�cant only in
a model with unemployment rates. If we omit unemployment rates to be closer to
Halla et al. (2013), in�ation returns to being insigni�cant.
Our data extends until 2010 and thereby covers the crisis years with extremely low
in�ation or even de�ation that are not included in previous studies. If we exclude
the crisis-years since 2007, in�ation still does not reach signi�cance (see section
5.1). Moreover, if we allow for non-linear e�ects of in�ation or a di�erential e�ect
of de�ation, we only con�rm our results that in�ation does not play a major role
for the population on average. Table C.11 provides the details.
C. Supplementary material
25We concentrate on their �ndings without environmental policy.
24

Table C.5: De�nitions of variables usedvariable name series name / explanation source
macroeconomic variablesGDP per head Gross domestic product: GDP per head, US$, constant prices,
constant PPPs, OECD base year; rescaled by factor 1/1000OECD (2011)
UE rate Rate of unemployment as % of civilian labor force OECD (2011)growth GDP, growth rate OECD (2011)growth forecast Growth forecasts were calculated using projections of GDP con-
tained in the Economic Outlook Series of the OECD for theyears 1987-2010. For 1992-2010: projections for GDP per head( US$, constant prices, constant PPPs, OECD base year). For1987-1991: For Economic Outlook 49 and earlier GDP projec-tions are only available in local currency. Also note that thebase year changed over time. For the years 1970-1986, we usedprojected growth rates as stated in the OECD Economic Out-look directly.
OECD (1976�2009),OECD (2011)
in�ation Percentage change in Consumer price index CPI from previousperiod
OECD (2011)
polity4 Index of institutional quality which is originally coded on a scalefrom 0 to 10 (highest quality). Since in our sample the indexonly varies from 8 to 10 we recode as follows: polity4==2 ifpolity takes the highest value of 10, polity4==1 if polity takesthe value 9, polity4==0 if polity takes the lowest value of 8 inour sample.
Marshall et al. (2011)
polrights Measures political rights on a one-to-seven scale, with one rep-resenting the highest degree of Freedom and seven the lowest.
Freedom House (2011)
civillib Measures civil liberties on a one-to-seven scale, with one repre-senting the highest degree of Freedom and seven the lowest.
Freedom House (2011)
debt Gross government debt (�nancial liabilities) as a percentage ofGDP
Armingeon et al. (2013)
de�cit Annual de�cit (government primary balance) as a percentage ofGDP
Armingeon et al. (2013)
elderly Population 65 and over as a percentage of population Armingeon et al. (2013)sstran Social security transfers as a percentage of GDP Armingeon et al. (2013)individual variablesSWD Answer to the question �On the whole, are you very satis�ed,
fairly satis�ed, not very satis�ed, or not at all satis�ed withthe way democracy works in <country>? Would you say youare . . . ?�, 1=not at all satis�ed, 2=not very satis�ed, 3=fairlysatis�ed, 4=very satis�ed
Eurobarometer
SWD dummy SWD dummy=1 if (SWD=3 or SWD=4); SWD dummy=0 if(SWD=2 or SWD=1)
own calculation
unempl dummy for those being unemployed at the time of the survey Eurobarometerout of LF dummy for those not in the labor force, subsuming housewives,
students, military, and retiredEurobarometer
married dummy for being `married' or `living as married' Eurobarometermale dummy for males Eurobarometerage age of the respondent in years Eurobarometereducation age when full-time education was �nished. We use this variable
to construct 5 dummies as described below.Eurobarometer
basic education age when full-time education was �nished: `up to 15 years' or`no full-time education'
Eurobarometer
intermediate educ. age when full-time education was �nished: 16 to 19 years Eurobarometerhigher education age when full-time education was �nished: 20 years or older Eurobarometerstill studying age when full-time education was �nished: still studying Eurobarometerincome Income is coded in categories which vary over time and from
country to country. We use this variable to defer the relativepositions of individuals in the income distribution.
Eurobarometer
poor dummy for individuals whose income is in the lowest three in-come deciles
Eurobarometer
middle income dummy for individuals whose income is in the four middle in-come deciles
Eurobarometer
rich dummy for individuals whose income is in the three highestincome deciles
Eurobarometer
life satisfaction Answer to the question �On the whole, are you very satis�ed,fairly satis�ed, not very satis�ed, or not at all satis�ed with thelife you lead? Would you say you are . . . ?� 1=not at all satis�ed,2=not very satis�ed, 3=fairly satis�ed, 4=very satis�ed. Weuse this variable to construct 4 dummies corresponding to the4 answer categories.
Eurobarometer
25

TableC.6:Su
mmarystatistics
forthemacro
variables
MACRO
FB
NL
DI
LDK
IRL
UK
GR
EP
NFIN
SA
GDP/head($)
24.63
25.93
28.05
26.26
23.60
46.39
26.87
22.88
24.47
19.30
22.77
18.47
34.83
27.43
30.28
32.31
(3.8)
(4.79)
(5.67)
(4.6)
(4.02)
(16.07)
(4.78)
(10.58)
(5.84)
(3.44)
(3.99)
(3.21)
(2.04)
(3.99)
(3.21)
(2.51)
growth
(%)
2.14
2.13
2.33
2.06
2.01
4.21
1.97
4.63
2.42
1.73
2.93
2.68
3.43
2.81
3.04
2.14
(1.5)
(1.69)
(1.82)
(2.06)
(2.09)
(3.12)
(2.21)
(3.81)
(2.04)
(2.74)
(2.14)
(2.6)
(1.09)
(3.47)
(2.65)
(1.98)
in�ation
4.41
3.40
2.87
2.50
7.00
3.48
4.48
5.87
5.26
11.37
4.19
6.04
2.67
1.37
1.13
1.68
(4.07)
(2.47)
(2.07)
(1.64)
(5.92)
(2.62)
(3.51)
(5.9)
(4.8)
(8.05)
(2.2)
(4.92)
(0.96)
(0.85)
(0.99)
(0.68)
growth
forecast
2.30
2.14
2.14
2.32
2.04
2.89
2.12
3.97
2.00
2.38
2.96
2.72
3.05
3.24
2.65
2.32
(0.89)
(0.74)
(1.07)
(0.81)
(0.96)
(1.72)
(0.97)
(2.16)
(1.05)
(1.24)
(0.97)
(0.93)
(0.69)
(1.00)
(0.82)
(0.75)
UErate
(%)
8.29
9.69
6.41
7.12
9.57
1.83
7.04
10.49
7.46
8.63
16.61
6.40
5.56
10.53
7.24
4.30
(1.74)
(2.3)
(2.88)
(2.15)
(1.87)
(0.94)
(2.05)
(4.61)
(2.41)
(2.09)
(4.93)
(1.89)
(0.42)
(3.12)
(1.55)
(0.5)
debt(%
)52.23
106.51
72.41
49.31
105.89
11.53
66.63
71.40
48.19
86.52
57.32
67.19
32.20
54.01
63.76
70.32
(19.86)
(23.21)
(14.37)
(16.48)
(16.48)
(5.40)
(14.57)
(26.60)
(9.91)
(35.95)
(10.10)
(11.87)
(5.29)
(6.76)
(11.67)
(3.59)
de�cit(%
)-1.02
1.15
0.05
-0.30
-0.62
0.77
1.48
-0.43
-0.73
-1.98
-1.22
-1.44
-2.10
0.88
1.72
0.06
(1.51)
(4.07)
(2.22)
(1.80)
(3.47)
(2.14)
(3.79)
(6.57)
(3.09)
(3.41)
(3.65)
(2.21)
(2.32)
(4.68)
(2.64)
(1.63)
elderly
(%)
14.80
15.47
12.92
16.56
15.77
13.71
15.04
11.07
15.45
15.43
15.29
15.20
16.16
15.33
17.49
16.00
(1.35)
(1.32)
(1.17)
(1.95)
(2.64)
(0.36)
(0.60)
(0.26)
(0.48)
(2.13)
(1.74)
(1.95)
(0.15)
(1.02)
(0.32)
(0.86)
sstran(%
)17.26
16.62
15.45
17.20
15.87
17.10
16.60
12.43
13.21
14.55
14.13
12.45
16.34
18.18
15.88
19.06
(1.01)
(1.08)
(3.38)
(1.04)
(1.40)
(4.10)
(1.48)
(2.89)
(1.34)
(1.68)
(2.29)
(2.03)
(0.63)
(2.72)
(0.86)
(0.52)
#N
33
33
33
33
33
33
33
33
33
29
24
24
616
14
14
Standard
deviationsin
bracketsbelow
estimates.
Calculationsuse
only
theyears
usedfortheregressions,i.e.
1976-2010;1996and2008are
missing.
Countriesare
abbreviatedaccordingto
internationalvehicleregistrationcodes.Since
1991East-G
ermanyisincluded.Before
data
refers
only
toWest-Germany.
GDPper
headin
US$1000,constantprices,constantPPPs,reference
year2000.
ForItaly,Luxem
bourg,Denmark,andIrelandsomepolicy
variablesare
notavailableforallyears.
Sources:OECD,fordetailsseetableC.5.
26

TableC.7:Su
mmarystatistics
fortheindividual
variables
FB
NL
DI
LDK
IRL
UK
GR
EP
NFIN
SA
SWD
0.519
0.573
0.685
0.600
0.276
0.772
0.773
0.651
0.569
0.500
0.592
0.536
0.765
0.689
0.702
0.688
(0.500)
(0.495)
(0.4644)
(0.490)
(0.447)
(0.420)
(0.419)
(0.477)
(0.495)
(0.500)
(0.491)
(0.499)
(0.424)
(0.463)
(0.457)
(0.463)
unem
pl
0.059
0.074
0.043
0.077
0.051
0.015
0.056
0.072
0.067
0.042
0.072
0.049
0.052
0.071
0.049
0.036
(0.235)
(0.261)
(0.203)
(0.266)
(0.220)
(0.122)
(0.229)
(0.258)
(0.250)
(0.200)
(0.258)
(0.216)
(0.221)
(0.257)
(0.216)
(0.187)
outofLF
0.418
0.436
0.491
0.403
0.480
0.479
0.374
0.454
0.427
0.492
0.504
0.440
0.381
0.446
0.388
0.393
(0.493)
(0.496)
(0.500)
(0.491)
(0.500)
(0.500)
(0.484)
(0.498)
(0.495)
(0.500)
(0.500)
(0.496)
(0.486)
(0.497)
(0.487)
(0.488)
married
0.648
0.644
0.676
0.608
0.590
0.650
0.659
0.581
0.628
0.659
0.584
0.626
0.609
0.595
0.627
0.611
(0.478)
(0.479)
(0.468)
(0.488)
(0.492)
(0.477)
(0.474)
(0.493)
(0.483)
(0.474)
(0.493)
(0.484)
(0.488)
(0.491)
(0.484)
(0.488)
male
0.489
0.497
0.482
0.487
0.482
0.507
0.502
0.495
0.485
0.491
0.478
0.475
0.531
0.456
0.507
0.465
(0.500)
(0.500)
(0.500)
(0.500)
(0.500)
(0.500)
(0.500)
(0.500)
(0.500)
(0.500)
(0.500)
(0.499)
(0.499)
(0.498)
(0.500)
(0.499)
age
42.973
44.166
43.182
45.4
42.939
43.767
44.895
41.953
44.615
43.775
43.29
44.322
41.619
47.207
48.111
44.765
(17.817)
(17.907)
(17.031)
(17.606)
(17.472)
(17.296)
(18.012)
(17.765)
(18.535)
(17.861)
(18.799)
(18.787)
(17.454)
(18.461)
(18.051)
(17.027)
education
basic
0.258
0.246
0.227
0.322
0.472
0.253
0.257
0.286
0.389
0.441
0.472
0.628
0.140
0.173
0.158
0.278
(0.437)
(0.431)
(0.419)
(0.467)
(0.499)
(0.435)
(0.437)
(0.452)
(0.488)
(0.497)
(0.499)
(0.483)
(0.347)
(0.379)
(0.365)
(0.448)
interm
.0.411
0.414
0.387
0.435
0.256
0.395
0.233
0.518
0.436
0.278
0.239
0.176
0.291
0.278
0.294
0.486
(0.492)
(0.493)
(0.487)
(0.496)
(0.436)
(0.489)
(0.423)
(0.500)
(0.496)
(0.448)
(0.426)
(0.381)
(0.454)
(0.448)
(0.456)
(0.500)
higher
0.241
0.256
0.286
0.175
0.156
0.255
0.411
0.106
0.118
0.182
0.164
0.098
0.428
0.423
0.431
0.158
(0.428)
(0.437)
(0.452)
(0.380)
(0.363)
(0.436)
(0.492)
(0.308)
(0.323)
(0.386)
(0.370)
(0.298)
(0.495)
(0.494)
(0.495)
(0.365)
stillstud.
0.090
0.084
0.100
0.068
0.116
0.095
0.095
0.089
0.056
0.098
0.119
0.094
0.140
0.125
0.117
0.076
(0.286)
(0.277)
(0.299)
(0.251)
(0.320)
(0.293)
(0.293)
(0.285)
(0.231)
(0.298)
(0.323)
(0.291)
(0.347)
(0.331)
(0.321)
(0.266)
nofull-tim
e0.000
0.000
0.000
0.000
0.000
0.001
0.003
0.000
0.000
0.000
0.006
0.004
0.000
0.000
0.000
0.001
(0.015)
(0.009)
(0.013)
(0.008)
(0.021)
(0.037)
(0.057)
(0.010)
(0.007)
(0.019)
(0.079)
(0.062)
(0.00)
(0.00)
(0.015)
(0.037)
life
satfct.
...satis�ed
notatall
0.060
0.032
0.011
0.032
0.065
0.013
0.006
0.039
0.031
0.118
0.036
0.083
0.013
0.012
0.007
0.017
(0.238)
(0.177)
(0.103)
(0.176)
(0.247)
(0.113)
(0.079)
(0.193)
(0.174)
(0.323)
(0.185)
(0.276)
(0.113)
(0.109)
(0.085)
(0.128)
notvery
0.171
0.109
0.051
0.160
0.208
0.054
0.031
0.092
0.092
0.266
0.175
0.256
0.052
0.069
0.041
0.114
(0.376)
(0.311)
(0.220)
(0.367)
(0.406)
(0.227)
(0.172)
(0.289)
(0.289)
(0.442)
(0.380)
(0.437)
(0.222)
(0.254)
(0.198)
(0.318)
fairly
0.625
0.583
0.491
0.633
0.601
0.520
0.358
0.518
0.550
0.478
0.577
0.607
0.485
0.623
0.533
0.602
(0.484)
(0.493)
(0.500)
(0.482)
(0.490)
(0.500)
(0.479)
(0.500)
(0.498)
(0.500)
(0.494)
(0.489)
(0.500)
(0.485)
(0.499)
(0.490)
very
0.144
0.276
0.448
0.175
0.125
0.412
0.605
0.351
0.327
0.138
0.213
0.054
0.450
0.296
0.419
0.267
(0.351)
(0.447)
(0.497)
(0.380)
(0.330)
(0.492)
(0.489)
(0.477)
(0.469)
(0.345)
(0.409)
(0.227)
(0.498)
(0.456)
(0.493)
(0.443)
incomerich
0.237
0.268
0.255
0.264
0.251
0.239
0.241
0.230
0.252
0.255
0.213
0.270
0.264
0.268
0.233
0.228
(0.425)
(0.443)
(0.436)
(0.441)
(0.434)
(0.426)
(0.428)
(0.421)
(0.434)
(0.436)
(0.410)
(0.444)
(0.441)
(0.443)
(0.423)
(0.420)
middle
0.423
0.378
0.403
0.397
0.358
0.416
0.423
0.419
0.419
0.385
0.447
0.403
0.401
0.393
0.346
0.401
(0.494)
(0.485)
(0.491)
(0.489)
(0.480)
(0.493)
(0.494)
(0.493)
(0.493)
(0.487)
(0.497)
(0.491)
(0.490)
(0.488)
(0.476)
(0.490)
poor
0.340
0.354
0.342
0.338
0.391
0.345
0.336
0.350
0.330
0.360
0.339
0.327
0.335
0.339
0.421
0.371
(0.474)
(0.478)
(0.474)
(0.473)
(0.488)
(0.475)
(0.472)
(0.477)
(0.470)
(0.480)
(0.474)
(0.469)
(0.472)
(0.473)
(0.494)
(0.483)
#obs
47412
46998
48621
69794
50307
19368
48355
46047
61610
42448
34969
33672
7401
16589
16741
17161
Statisticsare
unweighted.N
are
only
included
when
allvariablesare
notmissing(asin
theregressions).Asincomeisonly
available
from
1973to
1994andfrom
1997to
2003thereported
statisticsof`rich',`m
iddle',and`poor'refertoN
whereincomeisalsoavailable.
Standard
deviationsin
bracketsbelow
estimates.
Countriesare
abbreviatedaccordingto
internationalvehicleregistrationcodes.Since
1991East-G
ermanyisincluded.Before
data
refers
only
toWest-Germany.
Source:
Eurobarometer.
27
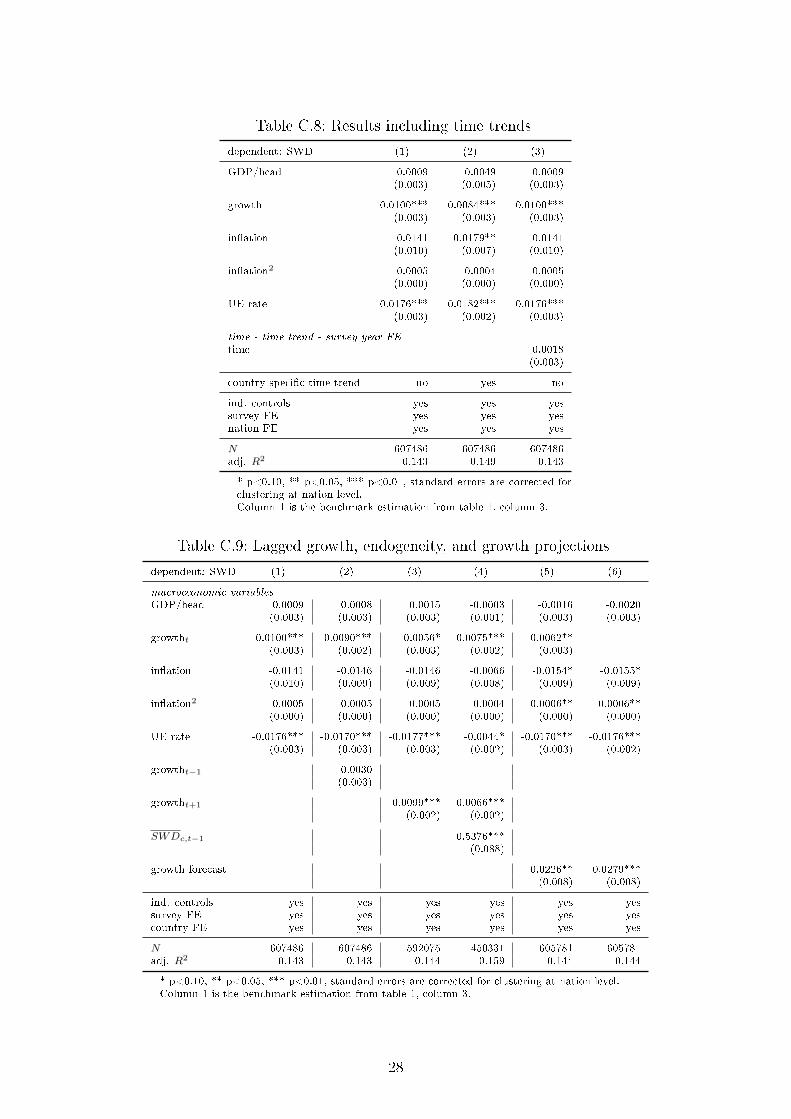
Table C.8: Results including time trends
dependent: SWD (1) (2) (3)
GDP/head 0.0009 -0.0049 0.0009(0.003) (0.005) (0.003)
growth 0.0100*** 0.0084*** 0.0100***(0.003) (0.003) (0.003)
in�ation -0.0141 -0.0179** -0.0141(0.010) (0.007) (0.010)
in�ation2 0.0005 0.0004 0.0005(0.000) (0.000) (0.000)
UE rate -0.0176*** -0.0182*** -0.0176***(0.003) (0.002) (0.003)
time - time trend - survey year FEtime 0.0018
(0.003)
country speci�c time trend no yes no
ind. controls yes yes yessurvey FE yes yes yesnation FE yes yes yes
N 607486 607486 607486adj. R2 0.143 0.149 0.143
* p<0.10, ** p<0.05, *** p<0.01, standard errors are corrected forclustering at nation level.Column 1 is the benchmark estimation from table 1, column 3.
Table C.9: Lagged growth, endogeneity, and growth projections
dependent: SWD (1) (2) (3) (4) (5) (6)
macroeconomic variablesGDP/head 0.0009 0.0008 0.0015 -0.0003 -0.0016 -0.0020
(0.003) (0.003) (0.003) (0.001) (0.003) (0.003)
growtht 0.0100*** 0.0090*** 0.0056* 0.0075*** 0.0062**(0.003) (0.002) (0.003) (0.002) (0.003)
in�ation -0.0141 -0.0146 -0.0146 -0.0066 -0.0154* -0.0155*(0.010) (0.009) (0.009) (0.008) (0.009) (0.009)
in�ation2 0.0005 0.0005 0.0005 0.0004 0.0006** 0.0006**(0.000) (0.000) (0.000) (0.000) (0.000) (0.000)
UE rate -0.0176*** -0.0170*** -0.0177*** -0.0044* -0.0170*** -0.0176***(0.003) (0.003) (0.003) (0.002) (0.003) (0.002)
growtht−1 0.0030(0.003)
growtht+1 0.0099*** 0.0066***(0.002) (0.002)
SWDc,t−1 0.5376***(0.088)
growth forecast 0.0226** 0.0279***(0.008) (0.008)
ind. controls yes yes yes yes yes yessurvey FE yes yes yes yes yes yescountry FE yes yes yes yes yes yes
N 607486 607486 592075 450331 605781 605781adj. R2 0.143 0.143 0.144 0.159 0.144 0.144
* p<0.10, ** p<0.05, *** p<0.01, standard errors are corrected for clustering at nation level.Column 1 is the benchmark estimation from table 1, column 3.
28
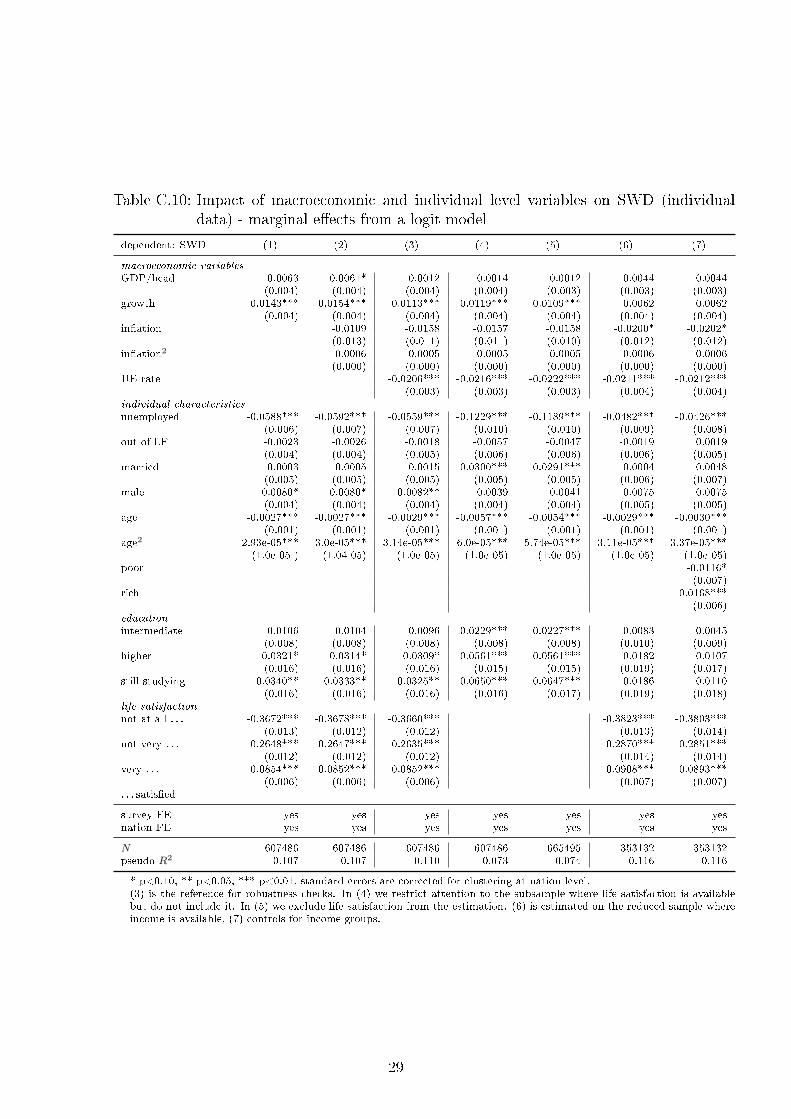
Table C.10: Impact of macroeconomic and individual level variables on SWD (individualdata) - marginal e�ects from a logit model
dependent: SWD (1) (2) (3) (4) (5) (6) (7)
macroeconomic variablesGDP/head 0.0063 0.0061* 0.0012 0.0014 0.0012 0.0044 0.0044
(0.004) (0.004) (0.004) (0.004) (0.003) (0.003) (0.003)growth 0.0143*** 0.0154*** 0.0113*** 0.0119*** 0.0109*** 0.0062 0.0062
(0.004) (0.004) (0.004) (0.004) (0.004) (0.004) (0.004)in�ation -0.0109 -0.0158 -0.0157 -0.0158 -0.0200* -0.0202*
(0.013) (0.011) (0.011) (0.010) (0.012) (0.012)in�ation2 0.0006 0.0005 0.0005 0.0005 0.0006 0.0006
(0.000) (0.000) (0.000) (0.000) (0.000) (0.000)UE rate -0.0206*** -0.0216*** -0.0222*** -0.0211*** -0.0212***
(0.003) (0.003) (0.003) (0.004) (0.004)individual characteristicsunemployed -0.0588*** -0.0592*** -0.0559*** -0.1229*** -0.1189*** -0.0482*** -0.0426***
(0.006) (0.007) (0.007) (0.010) (0.010) (0.009) (0.008)out of LF -0.0023 -0.0026 -0.0018 -0.0057 -0.0047 -0.0019 0.0019
(0.004) (0.004) (0.005) (0.006) (0.006) (0.006) (0.005)married 0.0003 0.0005 0.0015 0.0300*** 0.0291*** -0.0004 -0.0048
(0.005) (0.005) (0.005) (0.005) (0.005) (0.006) (0.007)male 0.0080* 0.0080* 0.0082** 0.0039 0.0041 0.0075 0.0075
(0.004) (0.004) (0.004) (0.004) (0.004) (0.005) (0.005)age -0.0027*** -0.0027*** -0.0029*** -0.0057*** -0.0054*** -0.0029*** -0.0030***
(0.001) (0.001) (0.001) (0.001) (0.001) (0.001) (0.001)age2 2.93e-05*** 3.0e-05*** 3.14e-05*** 6.0e-05*** 5.74e-05*** 3.11e-05*** 3.37e-05***
(1.0e-05 ) (1.04-05) (1.0e-05) (1.0e-05) (1.0e-05) (1.0e-05) (1.0e-05)poor -0.0116*
(0.007)rich 0.0168***
(0.006)educationintermediate 0.0106 0.0104 0.0096 0.0229*** 0.0227*** 0.0083 0.0045
(0.008) (0.008) (0.008) (0.008) (0.008) (0.010) (0.009)higher 0.0321* 0.0314* 0.0309* 0.0561*** 0.0561*** 0.0182 0.0107
(0.016) (0.016) (0.016) (0.015) (0.015) (0.019) (0.017)still studying 0.0340** 0.0333** 0.0325** 0.0650*** 0.0647*** 0.0186 0.0110
(0.016) (0.016) (0.016) (0.016) (0.017) (0.019) (0.018)life satisfactionnot at all . . . -0.3672*** -0.3678*** -0.3660*** -0.3823*** -0.3803***
(0.013) (0.012) (0.012) (0.013) (0.014)not very . . . -0.2648*** -0.2647*** -0.2635*** -0.2870*** -0.2851***
(0.012) (0.012) (0.012) (0.014) (0.014)very . . . 0.0854*** 0.0852*** 0.0852*** 0.0908*** 0.0893***
(0.006) (0.006) (0.006) (0.007) (0.007). . . satis�ed
survey FE yes yes yes yes yes yes yesnation FE yes yes yes yes yes yes yes
N 607486 607486 607486 607486 665495 353132 353132pseudo R2 0.107 0.107 0.110 0.073 0.074 0.116 0.116
* p<0.10, ** p<0.05, *** p<0.01, standard errors are corrected for clustering at nation level.(3) is the reference for robustness checks. In (4) we restrict attention to the subsample where life satisfaction is availablebut do not include it. In (5) we exclude life satisfaction from the estimation. (6) is estimated on the reduced sample whereincome is available, (7) controls for income groups.
29

Table C.11: Lagged growth, endogeneity, and growth projections - marginale�ects from a logit model
dependent: SWD (1) (2) (3) (4) (5) (6)
macroeconomic variablesGDP/head 0.0012 0.0010 0.0019 -0.0000 -0.0020 -0.0023
(0.004) (0.004) (0.004) (0.002) (0.004) (0.005)
growth 0.0113*** 0.0103*** 0.0062* 0.0086*** 0.0067**(0.004) (0.003) (0.004) (0.002) (0.003)
in�ation -0.0158 -0.0162 -0.0165 -0.0069 -0.0173* -0.0174*(0.011) (0.011) (0.011) (0.009) (0.010) (0.010)
infsqr 0.0005 0.0006 0.0006 0.0004 0.0007** 0.0007**(0.000) (0.000) (0.000) (0.000) (0.000) (0.000)
UE rate -0.0206*** -0.0200*** -0.0207*** -0.0045* -0.0199*** -0.0206***(0.003) (0.003) (0.003) (0.003) (0.003) (0.003)
growthlag 0.0031(0.003)
growthfut1 0.0114*** 0.0072***(0.002) (0.003)
SWDc,t−1 0.6180***(0.098)
growth forecast 0.0272*** 0.0330***(0.010) (0.010)
ind. controls yes yes yes yes yes yessurvey FE yes yes yes yes yes yescountry FE yes yes yes yes yes yes
N 607486 607486 592075 450331 605781 461544pseudo R2 0.110 0.110 0.111 0.123 0.111 0.111
* p<0.10, ** p<0.05, *** p<0.01, standard errors are corrected for clustering at nation level.Column 1 is the benchmark estimation from table C.10, column 1.
30
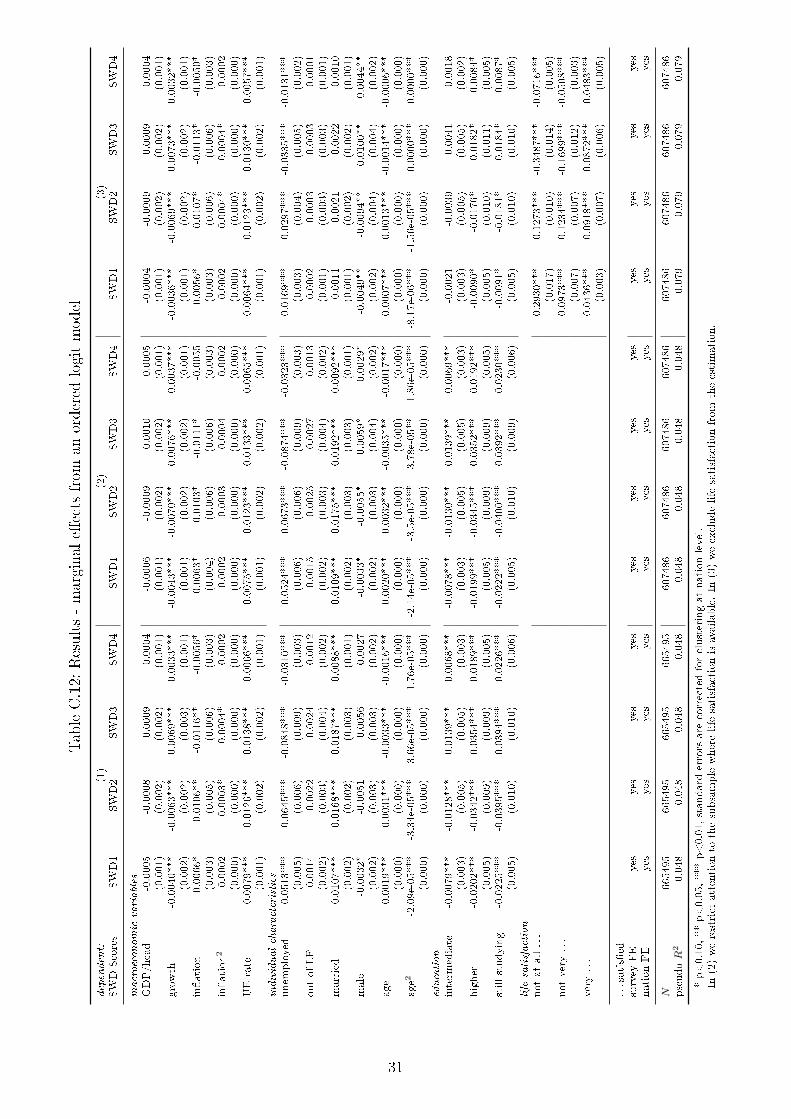
TableC.12:
Results
-marginale�ects
from
anorderedlogitmodel
depen
den
t:(1)
(2)
(3)
SWDScores
SWD1
SWD2
SWD3
SWD4
SWD1
SWD2
SWD3
SWD4
SWD1
SWD2
SWD3
SWD4
macroeconomic
variables
GDP/head
-0.0005
-0.0008
0.0009
0.0004
-0.0006
-0.0009
0.0010
0.0005
-0.0004
-0.0009
0.0009
0.0004
(0.001)
(0.002)
(0.002)
(0.001)
(0.001)
(0.002)
(0.002)
(0.001)
(0.001)
(0.002)
(0.002)
(0.001)
growth
-0.0040***
-0.0063***
0.0069***
0.0033***
-0.0043***
-0.0070***
0.0076***
0.0037***
-0.0036***
-0.0069***
0.0073***
0.0032***
(0.002)
(0.002)
(0.003)
(0.001)
(0.001)
(0.002)
(0.002)
(0.001)
(0.001)
(0.002)
(0.002)
(0.001)
in�ation
0.0066*
0.0106**
-0.0116**
-0.0056*
0.0063*
0.0103*
-0.0111*
-0.0055
0.0056*
0.0107*
-0.0113*
-0.0050*
(0.003)
(0.005)
(0.006)
(0.003)
(0.004)
(0.006)
(0.006)
(0.003)
(0.003)
(0.006)
(0.006)
(0.003)
in�ation2
-0.0002
-0.0003*
0.0004*
0.0002
-0.0002
-0.0003
0.0004
0.0002
-0.0002
-0.0004*
0.0004*
0.0002
(0.000)
(0.000)
(0.000)
(0.000)
(0.000)
(0.000)
(0.000)
(0.000)
(0.000)
(0.000)
(0.000)
(0.000)
UErate
0.0079***
0.0126***
-0.0138***
-0.0066***
0.0075***
0.0123***
-0.0133***
-0.0065***
0.0064***
0.0123***
-0.0130***
-0.0057***
(0.001)
(0.002)
(0.002)
(0.001)
(0.001)
(0.002)
(0.002)
(0.001)
(0.001)
(0.002)
(0.002)
(0.001)
individualcharacteristics
unem
ployed
0.0513***
0.0645***
-0.0848***
-0.0310***
0.0524***
0.0673***
-0.0874***
-0.0323***
0.0169***
0.0297***
-0.0335***
-0.0131***
(0.005)
(0.006)
(0.009)
(0.003)
(0.006)
(0.006)
(0.009)
(0.003)
(0.003)
(0.004)
(0.005)
(0.002)
outofLF
0.0014
0.0022
-0.0024
-0.0012
0.0015
0.0025
-0.0027
-0.0013
0.0002
0.0003
-0.0003
-0.0001
(0.002)
(0.003)
(0.004)
(0.002)
(0.002)
(0.003)
(0.004)
(0.002)
(0.001)
(0.003)
(0.003)
(0.001)
married
-0.0107***
-0.0168***
0.0187***
0.0088***
-0.0109***
-0.0175***
0.0192***
0.0092***
0.0011
0.0021
-0.0022
-0.0010
(0.002)
(0.002)
(0.003)
(0.001)
(0.002)
(0.003)
(0.003)
(0.001)
(0.001)
(0.002)
(0.002)
(0.001)
male
-0.0032*
-0.0051
0.0056
0.0027
-0.0033*
-0.0055*
0.0059*
0.0029*
-0.0049**
-0.0094**
0.0100**
0.0044**
(0.002)
(0.003)
(0.003)
(0.002)
(0.002)
(0.003)
(0.004)
(0.002)
(0.002)
(0.004)
(0.004)
(0.002)
age
0.0019***
0.0031***
-0.0033***
-0.0016***
0.0020***
0.0032***
-0.0035***
-0.0017***
0.0007***
0.0013***
-0.0014***
-0.0006***
(0.000)
(0.000)
(0.000)
(0.000)
(0.000)
(0.000)
(0.000)
(0.000)
(0.000)
(0.000)
(0.000)
(0.000)
age2
-2.09e-05***
-3.34e-05***
3.66e-05***
1.76e-05***
-2.14e-05***
-3.5e-05***
3.78e-05**
1.86e-05***
-8.17e-06***
-1.56e-05***
0.0000***
0.0000***
(0.000)
(0.000)
(0.000)
(0.000)
(0.000)
(0.000)
(0.000)
(0.000)
(0.000)
(0.000)
(0.000)
(0.000)
education
interm
ediate
-0.0079***
-0.0128***
0.0139***
0.0068***
-0.0078***
-0.0130***
0.0139***
0.0069***
-0.0021
-0.0039
0.0041
0.0018
(0.003)
(0.005)
(0.005)
(0.003)
(0.003)
(0.005)
(0.005)
(0.003)
(0.003)
(0.005)
(0.005)
(0.002)
higher
-0.0202***
-0.0342***
0.0354***
0.0189***
-0.0199***
-0.0345***
0.0352***
0.0192***
-0.0090*
-0.0176*
0.0182*
0.0084*
(0.005)
(0.009)
(0.009)
(0.005)
(0.005)
(0.009)
(0.009)
(0.005)
(0.005)
(0.010)
(0.011)
(0.005)
stillstudying
-0.0225***
-0.0395***
0.0394***
0.0226***
-0.0222***
-0.0400***
0.0392***
0.0230***
-0.0091*
-0.0181*
0.0184*
0.0087*
(0.005)
(0.010)
(0.010)
(0.006)
(0.005)
(0.010)
(0.009)
(0.006)
(0.005)
(0.010)
(0.010)
(0.005)
life
satisfaction
notatall...
0.2930***
0.1273***
-0.3487***
-0.0716***
(0.017)
(0.010)
(0.014)
(0.005)
notvery...
0.0973***
0.1234***
-0.1699***
-0.0508***
(0.007)
(0.007)
(0.012)
(0.003)
very...
-0.0436***
-0.0918***
0.0872***
0.0483***
(0.003)
(0.007)
(0.006)
(0.005)
...satis�ed
survey
FE
yes
yes
yes
yes
yes
yes
yes
yes
yes
yes
yes
yes
nationFE
yes
yes
yes
yes
yes
yes
yes
yes
yes
yes
yes
yes
N665495
665495
665495
665495
607486
607486
607486
607486
607486
607486
607486
607486
pseudoR
20.048
0.048
0.048
0.048
0.048
0.048
0.048
0.048
0.079
0.079
0.079
0.079
*p<0.10,**p<0.05,***p<0.01,standard
errors
are
correctedforclusteringatnationlevel.
In(2)werestrict
attentionto
thesubsamplewherelifesatisfactionisavailable.In
(3)weexcludelifesatisfactionfrom
theestimation.
31

Table C.13: In�uence of institutional quality: Polity IV index andFreedomhouse data
dependent: SWD (1) (2) (3) (4) (5)
GDP/head 0.0009 0.0003 0.0008 0.0015 0.0015(0.003) (0.003) (0.003) (0.002) (0.002)
growth 0.0100*** 0.0108*** 0.0100*** 0.0090** 0.0091**(0.003) (0.003) (0.003) (0.004) (0.004)
in�ation -0.0141 -0.0082 -0.0134 -0.0167 -0.0170(0.010) (0.010) (0.009) (0.011) (0.011)
in�ation2 0.0005 0.0002 0.0004 0.0006 0.0006(0.000) (0.000) (0.000) (0.000) (0.000)
UE rate -0.0176*** -0.0174*** -0.0172*** -0.0172*** -0.0172***(0.003) (0.003) (0.003) (0.003) (0.002)
institutional qualitypolity4 -0.0193
(0.031)
polrights 0.0200(0.056)
civillib 0.0010(0.016)
ind. controls yes yes yes yes yessurvey FE yes yes yes yes yesnation FE yes yes yes yes yes
N 607486 549741 607486 576656 576656adj. R2 0.143 0.149 0.143 0.144 0.144
* p<0.10, ** p<0.05, *** p<0.01, standard errors are corrected for clustering at nationlevel.Column 1 is the benchmark estimation from table 1, column 3. (2) is estimated onthe reduced sample for which the polity IV index is equal to its highest value 10. (3)controls for the polity4 score. (4) and (5) control for the indicators `political rights',and `civil liberties' respectively. `Political rights' and `civil liberties' are measured on aone-to-seven scale, with one representing the highest degree of Freedom and seven thelowest.
32

Table C.14: Impact of policy variables
dependent: SWD (1) (2) (3) (4) (5) (6)
macroeconomic variablesGDP/head 0.0009 -0.0022 -0.0041 -0.0016 -0.0032 -0.0025
(0.003) (0.003) (0.004) (0.003) (0.004) (0.003)
growth 0.0100*** 0.0112*** 0.0116*** 0.0108*** 0.0111*** 0.0107***(0.003) (0.003) (0.003) (0.003) (0.003) (0.003)
in�ation -0.0141 -0.0145 -0.0146 -0.0152 -0.0149 -0.0152(0.010) (0.010) (0.010) (0.009) (0.009) (0.010)
in�ation2 0.0005 0.0005 0.0005 0.0006 0.0005 0.0005(0.000) (0.000) (0.000) (0.000) (0.000) (0.000)
UE rate -0.0176*** -0.0193*** -0.0169*** -0.0183*** -0.0192*** -0.0182***(0.003) (0.003) (0.003) (0.003) (0.003) (0.004)
policy variablesdebt -0.0007
(0.001)
de�cit 0.0026(0.002)
elderly -0.0051(0.013)
sstran -0.0025(0.005)
ind. controls yes yes yes yes yes yessurvey FE yes yes yes yes yes yesnation FE yes yes yes yes yes yes
N 607486 594479 594479 594479 594479 594479adj. R2 0.143 0.143 0.143 0.143 0.143 0.143
* p<0.10, ** p<0.05, *** p<0.01, standard errors are corrected for clustering at nation level.Column 1 is the benchmark estimation from table 1, column 3. (2) is estimated on reduced samplewhere debt, de�cit, elderly, and sstran is available.
33
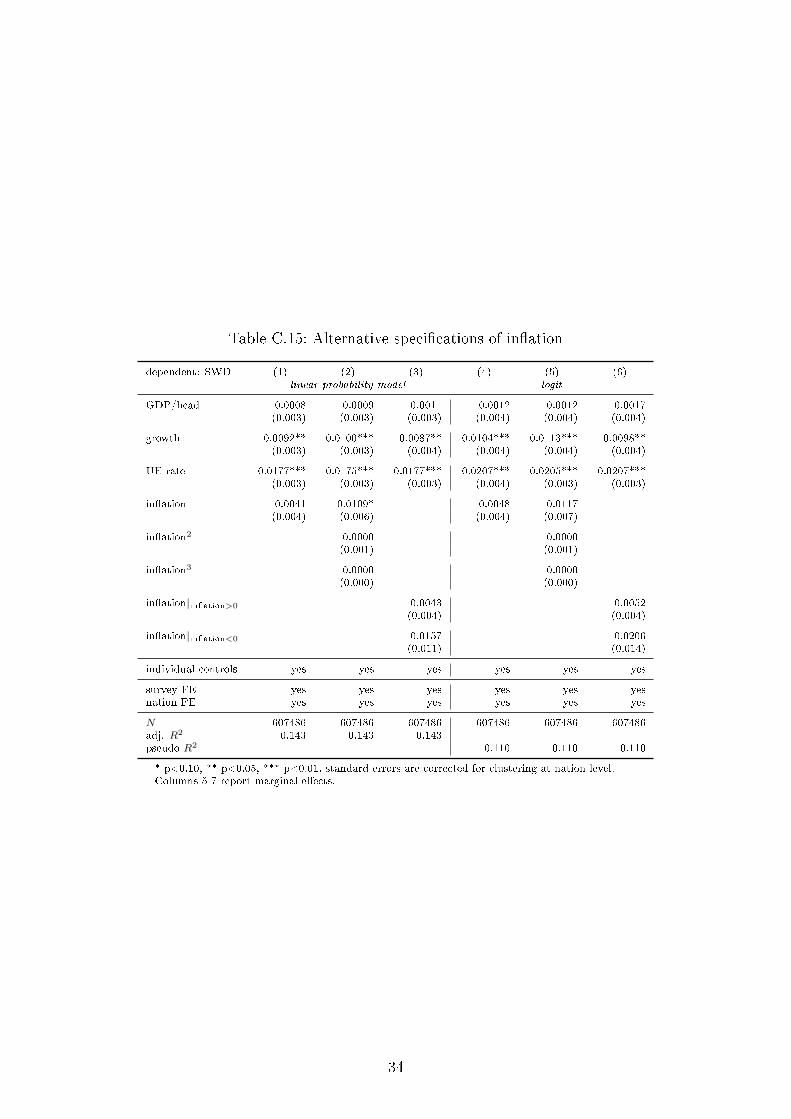
Table C.15: Alternative speci�cations of in�ation
dependent: SWD (1) (2) (3) (4) (5) (6)linear probability model logit
GDP/head 0.0008 0.0009 0.0011 0.0012 0.0012 0.0017(0.003) (0.003) (0.003) (0.004) (0.004) (0.004)
growth 0.0092** 0.0100*** 0.0087** 0.0104*** 0.0113*** 0.0098**(0.003) (0.003) (0.004) (0.004) (0.004) (0.004)
UE rate -0.0177*** -0.0175*** -0.0177*** -0.0207*** -0.0205*** -0.0207***(0.003) (0.003) (0.003) (0.004) (0.003) (0.003)
in�ation -0.0041 -0.0109* -0.0048 -0.0117(0.004) (0.006) (0.004) (0.007)
in�ation2 0.0000 -0.0000(0.001) (0.001)
in�ation3 0.0000 0.0000(0.000) (0.000)
in�ation|in�ation>0 -0.0043 -0.0052(0.004) (0.004)
in�ation|in�ation<0 0.0157 0.0206(0.011) (0.014)
individual controls yes yes yes yes yes yes
survey FE yes yes yes yes yes yesnation FE yes yes yes yes yes yes
N 607486 607486 607486 607486 607486 607486adj. R2 0.143 0.143 0.143pseudo R2 0.110 0.110 0.110
* p<0.10, ** p<0.05, *** p<0.01, standard errors are corrected for clustering at nation level.Columns 5-7 report marginal e�ects.
34

References
Acemoglu, D., & Robinson, J. A. (2006). Economic Origins of Dictatorship and
Democracy . Cambridge: Cambridge University Press, 1st ed.
Acemoglu, D., Johnson, S., Robinson, J. A., & Yared, P. (2008). Income and Democ-racy. American Economic Review , 3 (98), 808�842.
Angrist, J. D., & Pischke, J.-S. (2009). Mostly Harmless Econometrics. An Empiri-
cist's Companion. Princeton, New Jersey: Princeton University Press.
Armingeon, K., Knöpfel, L., Weisstanner, D., Engler, S., Potolidis, P., & Gerber,M. (2013) Comparative Political Data Set I 1960-2011. Tech. rep., Institute ofPolitical Science, University of Berne.
Bäck, M., & Kestilä, E. (2009). Social Capital and Political Trust in Finland: anIndividual-Level Assessment. Scandinavian Political Studies , 32 (2), 171�194.
Bertrand, M., & Mullainathan, S. (2001). Do People Mean What They Say? Im-plications for Subjective Survey Data. American Economic Review, Papers and
Proceedings , 91 (2), 67�72.
Brückner, M., & Grüner, H.-P. (2010). Economic Growth and the Rise of PoliticalExtremism: Theory and Evidence. CEPR Discussion Paper , (No. DP7723).
Cheibub, J. A., Gandhi, J., & Vreeland, J. R. (2009). Democracy and DictatorshipRevisited. Public Choice, 143 (1-2), 67�101.
Clarke, H. D., Dutt, N., & Kornberg, A. (1993). The Political Economy of Attitudestoward Polity and Society in Western European Democracies. The Journal of
Politics , 55 (4), 998�1021.
Dalton, R. J. (1999). Political Support in Advanced Industrial Democracies. InP. Norris (Ed.) Critical Citizens: Global Support for Democratic Government ,(pp. 57�77). Oxford: Oxford University Press.
Deaton, A. (2008). Income, Health, and Well-Being Around the World: Evidencefrom the Gallup World Poll. Journal of Economic Perspectives , 22 (2), 53�72.
Di Tella, R., MacCulloch, R. J., & Oswald, A. J. (2001). Preferences Over In�ationand Unemployment: Evidence from Surveys of Happiness. American Economic
Review , 91 (1), 335�341.
Di Tella, R., MacCulloch, R. J., & Oswald, A. J. (2003). The Macroeconomics ofHappiness. The Review of Economics and Statistics , 85 (4), 809�827.
Donadio, R., & Sayare, S. (2011). Violent Clashes in the Streets of Athens.The New York Times (June 29, 2011), http://www.nytimes.com/2011/06/30/world/europe/30athens.html (accessed: July 29, 2011).
Dreher, A., & Öhler, H. (2011). Does Government Ideology A�ect Personal Happi-ness? A Test. Economics Letters , 111 (2), 161�165.
35
Easton, D. (1957). An Approach to the Analysis of Political Systems. World Politics ,9 (3), 383�400.
European Commission, Brussels (2002). Eurobarometer 58.1: The Euro, EuropeanEnlargement, and Financial Services. GESIS Data Archive for the Social Sciences:ZA3693, data set version 1.0.0, GESIS - Leibniz Institute for the Social Sciences,Cologne, doi:10.4232/1.3693.
European Commission, Brussels (2003). Eurobarometer 60.1 Citizenship and Senseof Belonging, Fraud, and the European Parliament. GESIS Data Archive for theSocial Sciences: ZA3938, data set version 1.0.0, GESIS - Leibniz Institute for theSocial Sciences, Cologne, doi:10.4232/1.3938.
European Commission, Brussels (2004a). Eurobarometer 62.0 Standard EuropeanUnion Trend Questions and Sport. GESIS Data Archive for the Social Sciences:ZA4229, data set version 1.0.0, GESIS - Leibniz Institute for the Social Sciences,Cologne, doi:10.4232/1.4229.
European Commission, Brussels (2004b). Eurobarometer 62.2 Agricultural Policy,Development Aid, Social Capital, and Information and Communication Technol-ogy. GESIS Data Archive for the Social Sciences: ZA4231, data set version 1.0.0,GESIS - Leibniz Institute for the Social Sciences, Cologne, doi:10.4232/1.4231.
European Commission, Brussels (2006). Eurobarometer 65.2: The European Consti-tution, Social and Economic Quality of Life, Avian In�uenza, and Energy Issues.TNS Opinion & Social, Brussels [Producer]; GESIS, Cologne [Publisher]: ZA4506,data set version 1.0.0, GESIS pre-release edition, doi:10.4232/1.4506.
European Commission, Brussels (2007). Eurobarometer 68.1: The European Par-liament and Media Usage, September-November 2007. TNS Opinion & Social,Brussels [Producer]; GESIS, Cologne [Publisher]: ZA4565, data set version 1.0.0,GESIS pre-release edition, doi:10.4232/1.10126.
European Commission, Brussels (2008). The Mannheim Eurobarometer Trend File1970-2002. Computer �le, GESIS Study ZA3521, 2nd ed. (2.91), Cologne, Ger-many, doi:10.4232/1.10074.
European Commission, Brussels (2009). Eurobarometer 72.4 Globalization, Finan-cial and Economic Crisis, Social Change and Values, EU Policies and DecisionMaking, and Global Challenges: October-November 2009. TNS Opinion & So-cial, Brussels [Producer]; GESIS, Cologne [Publisher]: ZA4994, data set version1.0.0, GESIS pre-release edition, doi:10.4232/1.10236.
European Commission, Brussels (2010). Eurobarometer 73.4: May 2010. TNSOpinion & Social, Brussels [Producer]; GESIS, Cologne [Publisher]: ZA5234, dataset version 1.0.0, GESIS pre-release edition, doi:10.4232/1.10197.
Falk, A., Kuhn, A., & Zweimüller, J. (2011). Unemployment and Right-wing Ex-tremist Crime. Scandinavian Journal of Economics , 113 (2), 260�285.
36

Freedom House (2011). Freedom in the World Comparative and Historical Data.http://www.freedomhouse.org/template.cfm?page=439 (accessed: August 25,2011).
Frey, B. S., & Stutzer, A. (2002a). The Economics of Happiness. World Economics ,3 (1), 1�17.
Frey, B. S., & Stutzer, A. (2002b). What Can Economists Learn from HappinessResearch? Journal of Economic Literature, 40 (2), 402�435.
Gassebner, M., Lamla, M. J., & Vreeland, J. R. (2013). Extreme Bounds of Democ-racy. Journal of Con�ict Resolution, 57 (2), 171�197.
Golinelli, R., & Rovelli, R. (2013). Did Growth and Reforms Increase Citizens'Support for the Transition? European Journal of Political Economy , 30 , 112�137.
Graham, C., & Suktahnkar, S. (2004). Does Economic Crisis Reduce Support forMarkets and Democracy in Latin America? Some Evidence from Surveys of PublicOpinion and Well Being. Journal of Latin American Studies , 36 (2), 349�377.
Grosjean, P., & Senik, C. (2011). Democracy, Market Liberalization, and PoliticalPreferences. Review of Economics and Statistics , 93 (1), 365�381.
Groves, J. (2010). Nightmare Vision for Europe As EU ChiefWarns 'Democracy Could Disappear' in Greece, Spain and Por-tugal. MailOnline, Associated Newspapers Ltd, (June 15, 2010)http://www.dailymail.co.uk/news/worldnews/article-1286480/
EU-chief-warns-democracy-disappear-Greece-Spain-Portugal.html
(acessed: June 17, 2010).
Halla, M., Schneider, F., & Wagner, A. (2013). Satisfaction with Democracy andCollective Action Problems: the Case of the Environment. Public Choice, 155(1-2), 109�137.
Hibbs, D. A. (2006). Chapter 31. Voting and the Macroeconomy. In B. R. Weingast,& D. A. Wittman (Eds.) The Oxford Handbook of Political Economy , (pp. 565�586). Oxford: Oxford University Press.
Knigge, P. (1998). The Ecological Correlates of Right-Wing Extremism in WesternEurope. European Journal of Political Research, 34 , 249�279.
Lewis-Beck, M. S., & Paldam, M. (2000). Economic Voting: an Introduction. Elec-toral Studies , (19), 113�121.
Linde, J., & Ekman, J. (2003). Satisfaction with Democracy: a Note on a FrequentlyUsed Indicator in Comparative Politics. European Journal of Political Research,42 , 391�408.
Lubbers, M., Gijsberts, M., & Scheepers, P. (2002). Extreme Right-Wing Voting inWestern Europe. European Journal of Political Research, 41 (3), 345�378.
37

Lühiste, K. (forthcoming). Social Protection and Satisfaction with Democracy: aMulti-level Analysis. Political Studies.
MacCulloch, R., & Pezzini, S. (2007). Money, Religion and Revolution. Economics
of Governance, 8 (1), 1�16.
Marshall, M. G., Jaggers, K., & Gurr, T. R. (2011). Polity IV Project:Political Regime Characteristics and Transitions, 1800-2010. http://www.
systemicpeace.org/polity/polity4.htm (accessed: July 8, 2011).
Moody, B. (2013). Italy's Political Crisis Deepens, Grillo Refuses to SupportGovernment. Thomson Reuters (February 27, 2013), http://www.reuters.
com/article/2013/02/27/us-italy-vote-idUSBRE91M0EB20130227 (accessed:April 10, 2013).
Nannestad, P., & Paldam, M. (1994). The VP-function: a Survey of the Literatureon Vote and Popularity Functions after 25 Years. Public Choice, (79), 213�245.
Norris, P. (1999a). Critical Citizens: Global Support for Democratic Government .Oxford: Oxford University Press.
Norris, P. (1999b). Introduction: the Growth of Critical Citizens? In P. Norris(Ed.) Critical Citizens: Global Support for Democratic Government , (pp. 1�27).Oxford: Oxford University Press.
OECD (1976�2009). OECD Economic Outlook Vol. 1976-2009, OECD Publishing.
OECD (2011). Oecd.statextracts. http://stats.oecd.org (accessed: February 22,2013).
Przeworski, A. (Ed.) (2000). Democracy and Development . Cambridge Studies inthe Theory of Democracy. Cambridge: Cambridge University Press, 1. publ. ed.
Sars�eld, R., & Echegaray, F. (2006). Opening the Black Box: how SatisfactionWith Democracy and Its Perceived E�cacy A�ect Regime Preference in LatinAmerica. International Journal of Public Opinion Research, 18 (2), 153�173.
Sen, A. (1977). Rational Fools: a Critique of the Behavioral Foundations of Eco-nomic Theory. Philosophy & Public A�airs , 6 (4), 317�344.
Tremlett, G., & Hooper, J. (2011). Protest in the Med: Rallies Against Cuts andCorruption Spread. The Guardian (May 19, 2011), http://www.guardian.co.uk/world/2011/may/19/protest-med-cuts-corruption-spain (accessed: July29, 2011).
Veenhoven, R. (1996). Developments in Satisfaction-Research. Social Indicators
Research, 37 (1), 1�46.
Wagner, A. F., Schneider, F., & Halla, M. (2009). The Quality of Institutions andSatisfaction With Democracy in Western Europe: a Panel Analysis. European
Journal of Political Economy , 25 (1), 30�41.
38

Wells, J. M., & Krieckhaus, J. (2006). Does National Context In�uence DemocraticSatisfaction? A Multi-Level Analysis. Political Research Quarterly , 59 (4), 569�578.
39

All discussion papers are downloadable: http://www.wzb.eu/en/publications/discussion-papers/markets-and-choice
Discussion Papers of the Research Area Markets and Choice 2013
Research Unit: Market Behavior
Nadja Dwenger, Dorothea Kübler, Georg Weizsäcker SP II 2013-201 Preference for Randomization: Empirical and Experimental Evidence
Kai A. Konrad, Thomas R. Cusack SP II 2013-202 Hanging Together or Being Hung Separately: The Strategic Power of Coalitions where Bargaining Occurs with Incomplete Information
David Danz, Frank Hüber, Dorothea Kübler, Lydia Mechtenberg, Julia Schmid
SP II 2013-203
‘I’ll do it by myself as I knew it all along’: On the failure of hindsight-biased principals to delegate optimally
David Hugh-Jones, Morimitsu Kurino, Christoph Vanberg SP II 2013-204 An Experimental Study on the Incentives of the Probabilistic Serial Mechanism
Yan Chen, Onur Kesten SP II 2013-205 From Boston to Chinese Parallel to Deferred Acceptance: Theory and Experiments on a Family of School Choice Mechanisms
Thomas de Haan, Roel van Veldhuizen SP II 2013-206 Willpower Depletion and Framing Effects
Christine Binzel, Dietmar Fehr SP II 2013-207 Giving and sorting among friends: evidence from a lab-in-the-field experiment
Volker Benndorf, Dorothea Kübler, Hans-Theo Normann Privacy Concerns, Voluntary Disclosure of Information, and Unravelling: An Experiment
SP II 2013-208
Rebecca B. Morton, Marco Piovesan, Jean-Robert Tyran Biased Voters, Social Information, and Information Aggregation Through Majority Voting
SP II 2013-209
Roel van Veldhuizen The influence of wages on public officials’ corruptibility: a laboratory investigation
SP II 2013-210
Jana Friedrichsen Image concerns and the provision of quality
SP II 2013-211
Jana Friedrichsen, Philipp Zahn Political Support in Hard Times: Do People Care about National Welfare?
SP II 2013-212

All discussion papers are downloadable: http://www.wzb.eu/en/publications/discussion-papers/markets-and-choice
Research Unit: Economics of Change
Luisa Herbst, Kai A. Konrad, Florian Morath SP II 2013-301 Endogenous Group Formation in Experimental Contests
Kai A. Konrad, Florian Morath SP II 2013-302 Evolutionary Determinants of War
Armin Falk, Nora Szech SP II 2013-303 Organizations, Diffused Pivotality and Immoral Outcomes
Maja Adena, Steffen Huck, Imran Rasul SP II 2013-304 Charitable Giving and Nonbinding Contribution-Level Suggestions. Evidence from a Field Experiment
Dominik Rothenhäusler, Nikolaus Schweizer, Nora Szech SP II 2013-305 Institutions, Shared Guilt, and Moral Transgression
Dietmar Fehr, Steffen Huck SP II 2013-306 Who knows it is a game? On rule understanding, strategic awareness and cognitive ability
Maja Adena, Michal Myck SP II 2013-307 Poverty and Transitions in Health
Friedel Bolle, Jano Costard SP II 2013-308 Who Shows Solidarity with the Irresponsible?
Kai A. Konrad SP II 2013-309 Affection, Speed Dating and Heart Breaking
Maja Adena, Ruben Enikolopov, Maria Petrova, Veronica Santarosa, and Ekaterina Zhuravskaya
SP II 2013-310
Radio and the Rise of the Nazis in Pre-war Germany
Perdro Dal Bó, Guillaume R. Fréchette SP II 2013-311 Strategy Choice In The Infinitely Repeated Prisoners’ Dilemma
Steffen Huck, Gabriele K. Lünser, Jean-Robert Tyran SP II 2013-312 Price Competition and Reputation in Markets for Experience Goods: An Experimental Study
Rune Midjord, Tomás Rodríguez Barraquer, Justin Valasek SP II 2013-313 Over-Caution of Large Committees of Experts
Steffen Huck, Julia Schmid, Brian Wallace SP II 2013-314 Price Framing
Pio Baake, Steffen Huck SP II 2013-315 Crop Failures and Export Tariffs
All discussion papers are downloadable: http://www.wzb.eu/en/publications/discussion-papers/markets-and-choice
WZB Junior Research Group: Risk and Development
Lubomír Cingl, Peter Martinsson, Hrvoje Stojic, Ferdinand M. Vieider SP II 2013-401 Separating attitudes towards money from attitudes towards probabilities: stake effects and ambiguity as a test for prospect theory