political risk, development banks and the choice of ... risk, development banks and the choice ......
TRANSCRIPT

Political Risk, Development Banks and the Choice of Recourse in
Syndicated Lending♣
Christa Hainz♦
Stefanie Kleimeier♠
Abstract: How should loan contracts to finance projects in countries with high political
risk be designed? We argue that limited-recourse loans and the participation of develop-
ment banks in the loan syndicate help to mitigate political risk. We test these arguments
in a sample of 4,978 loans made to borrowers in 64 countries. Our results show that if in-
vestment-related political risk is higher, the use of limited-recourse loans and the partici-
pation of development banks are more likely. For general political risk, the participation
of development banks is most useful. We demonstrate that the terms of the loan contract
depend on political risk as well as the legal and institutional environment.
Keywords: Project finance, syndicated loans, political risk
JEL-Codes: F34, G21, G32
♣ The authors would like to thank the Editor and two anonymous referees, Elena Carletti, Stefano Gatti,
Clara Graciano, Victoria Ivashina, Luc Laeven, Michael Lemmon, William Megginson, Sven Rady, Monika Schnitzer, Drew Winters, Bernard Yeung as well as seminar and conference participants for helpful comments and suggestions. The usual disclaimer applies. Christa Hainz gratefully acknowl-edges financial support by the German Science Foundation, under SFB-Transregio 15.
♦ ifo Institute for Economic Research, Poschingerstraße 5, 81679 Munich, Germany, [email protected] ♠ Maastricht University, Tongersestraat 53, 6211 LM Maastricht, The Netherlands,

1
1. Introduction
How should a company finance a project located in a country where political risk is high
and where investor protection is weak? Such a project will only be realized if the risk can be re-
duced to a bearable level. Coasian bargaining theory and a growing empirical literature on law,
institutions, and finance clearly show that loan contracts can be designed to mitigate deficits in
the legal and institutional environment and thereby provide the project with access to finance.
The following case illustrates how a loan contract can help to mitigate political risk:
The South African petrochemical group Sasol opts for a unique hybrid project finance structure to finance a gas field project in Mozambique. Under this hybrid structure, lenders initially have full recourse to Sasol, which assumes almost all project related risks. The sole – but important – exception is the project’s political risk. The loan contract specifies that, if well-defined political risk events occur, the financing structure automatically changes from the full-recourse structure to a project-finance structure under which lenders have recourse only to the project but no longer have recourse to Sasol. Cadwalader (2004), the project’s legal consultant, em-phasizes the role of development banks in actively mitigating political risk: “Sasol would like to maximize the influence that the political risk providers […] bring to the deal – their ability to exert political pressure on, in this case, the Mozambican gov-ernment to prevent or cure a political risk event. […].”
This case shows that there are two important features of the loan contract for managing political
risk. First, it is the degree of recourse that the lender has. We discriminate between full-recourse
loans und non-recourse project finance loans.1 Second, the inclusion of development banks in the
syndicate granting the loan provides a so-called “political umbrella” as these banks can use their
leverage to influence governmental decision and deter adverse events that would negatively af-
fect the project’s outcome.2
1 In this study, we will use the terms ‘project finance’ and ‘non-recourse loan’ synonymously and contrast it with ‘full-recourse loan’. 2 However, there are two arguments against a state-contingent financing structure, which may explain why this deal structure is not commonly used. First, it is not obvious how to define specific political risk events ex ante. Second, the switching provision limits the incentives of banks to mitigate political risk to

2
This paper analyzes the determinants of these two important features of the loan contract,
that is, its recourse structure and the participation of a development bank in the loan syndicate.
We base our tests on a sample of 4,978 loans raised by borrowers in 64 countries between 1996
and 2005. We run logit and multinominal logit regressions explaining how the two loan characte-
ristics depend on political risk as well as the legal and institutional environment. The results
clearly show that higher political risk renders the use of project finance loans and the participa-
tion of development banks in the syndicate more likely. We also show which type of develop-
ment bank is actually able to mitigate political risk. Therefore, our study demonstrates that it is
not only the legal and institutional environment but also political risk that determines the design
of a loan contract.
In this way, our study contributes to the growing literature on how country-level risks in-
fluence the design of loan contracts. Some studies investigate how law and institutions determine
one particular feature of the contract. In particular, Esty and Megginson (2003) show that strong
creditor rights and reliable legal enforcement are correlated with smaller and more concentrated
syndicates. Other (more recent) studies emphasize that it is important to study more dimensions
of the loan contract to capture its complexity. Qian and Strahan (2007) provide evidence that
stronger creditor rights lead to a more concentrated syndicate structure, longer maturity, and
lower interest rate. Bae and Goyal (2009) show that not only creditor rights but also the enfor-
ceability of contracts matters for loan size, maturity, and interest rate. However, none of these
papers explicitly addresses the role of political risk. Only for the rating and pricing of corporate
bonds is there evidence that political risk matters (Qi et al., 2010).
As the Sasol case shows, political risk is of outstanding importance for the design of the
situations in which a predefined risk event occurs and thus does not exploit the political umbrella of the development banks.

3
loan contract, in particular in risky countries. Therefore, we add to the literature by investigating
how political risk influences two important features of a loan contract. The first important feature
is the recourse structure. Our paper is closely related to that by Subramanian and Tung (2009).
They show that project finance loans are more often used in countries with weak creditor rights
and poor protection against insider stealing. In contrast, we investigate political risk in more de-
tail and do not solely explain the recourse structure but also the participation of development
banks. This is the second important contractual feature because development bank are able to
mitigate political risk. This feature has so far been not considered in the literature, apart from
Esty and Megginson (2003), who use it as an explanatory variable when explaining the syndicate
structure of project finance loans.
Our study yields three main results. First, we show that projects in countries with higher
political risk are more likely structured as a project finance deal and development banks more
likely participate in the syndicate. Second, when we disentangle different components of political
risk, we discover differences between both risk management strategies. We distinguish between
a country’s investment-related political risk and general political risk. Our results show that
project finance loans are used more often when investment-related political risk is high. This
suggests that the more transparent structure of the project finance deal helps to reduce interven-
tions by the government that are at the detriment of the firm’s success. However, the use of
project finance is not affected by general political risk. In contrast, the participation of develop-
ment banks is more likely for both a higher level of investment-related risk and general political
risk. Therefore, it seems that the leverage that the development banks have vis-à-vis the national
governments can be exerted in many different circumstances. Development banks can use their
power when investment-related risk occurs but some development banks, in particular the World

4
Bank, are influential when any other form of political risk materializes. Third, by controlling for
legal environment we find that the probability that a project finance loan is used is lower if legal
provisions regarding corporate governance are better and, for example, reduces the risk that a
manager expropriates the firm. The use of project finance is higher for better creditor rights.
However, the participation of development banks depends neither on creditor rights nor on cor-
porate governance provisions.
Our study proceeds as follows. We present in section 2 our key country-level variables, in
particular political risk and law and institutions, and argue how the risks involved can be ad-
dressed by either a project finance structure or the participation of a development bank. In sec-
tion 3, we describe the data and methodology. In section 4, we discuss the results, and in section
5, we conclude.
2. The Impact of Political Risk and Law & Institutions on the Loan Contract
2.1. Features of the loan contract
When a firm applies for a loan, the riskiness of the project to be financed is evaluated.
Depending on the results, different measures are taken to reduce the risk that the bank has to
bear. As a result, each loan contract has many features that jointly reflect the riskiness of the
project to be financed. Not only are the risk management measures different in nature, they also
differ in the way that they are related to the project’s riskiness. They can address the probability
of default, the loss given default, or both at the same time. Two important measures are the deci-
sion of which legal entity receives the loan for a particular project, that is, how the contract is
structured, and the participation of a development bank. When all these risk management tools

5
have been used in an efficient manner, other features, in particular the interest rate, will be ad-
justed such that the lenders are willing to bear the remaining risk and therefore grant the loan
(Corielli et al., 2010; Nevitt and Fabozzi, 1995).
2.1.1. Limited recourse project finance loans
The parties involved in the loan may decide to create a legally independent project com-
pany. It is financed with equity from one or more of the sponsoring firms but raises the bulk of
its financing needs in the form of bank loans. This structure ensures that liability is limited so
that lenders have no or only limited recourse to the sponsoring firms (Esty, 2004). In contrast, a
traditional full-recourse loan allows the lender access to all the assets of the project and the spon-
soring firm. Project finance loans are supported by a host of contractual arrangements geared
toward risk management. In this way, project finance allows the allocation of specific project
risks (i.e., completion and operating risk, revenue and price risk) to those parties best able to
manage them. Ultimately, the contract structure reduces project risk and agency costs and in-
creases transparency about the project (Corielli et al., 2010; Brealey et al., 2000). For example,
financial transactions become transparent through cash waterfalls that summarize a project’s
cash flow and assign priority to each cash inflow and outflow. This implies that, in contrast to a
loan to a diversified firm, cash flows cannot easily be shifted between different divisions or di-
verted by the management. Moreover, interventions from, for example, the government become
easily observable.

6
2.1.2. Participation of development banks
As Esty and Megginson (2003) show, the structure of the syndicate is used to manage
risks. One particularly important member of a syndicate is a development bank. In contrast to
commercial banks, the development banks (DBs) have a special status. Buiter and Fries (2002)
argue that multilateral development banks’ “(…) support for private sector projects can be in-
strumental in mitigating risks associated with government policies and practices.” Therefore,
multilateral development banks are also known as political umbrellas (Buljevich and Park
1999).3 Among all lenders, multilateral development banks such as the International Financial
Corporation (IFC), a member of the World Bank Group, have high bargaining power because, as
they finance many projects and also provide financial aid, they frequently interact with the gov-
ernment.4 Therefore, these two risk management strategies are instrumental in dealing with polit-
ical risk and (most likely) other risks that arise on the country level.
2.2. Country-level risks
2.2.1. Political risk
Political risk in the host country is a very important factor influencing the probability that
a loan is serviced as scheduled. In general, political risk can be divided into three broad catego-
ries: traditional political risk, regulatory risk, and quasi-commercial risk (Smith 1997). The tradi-
3 According to the World Bank’s definition, multilateral development banks are “institutions that provide financial support and professional advice for economic and social development activities in developing countries.” Multilateral financial institutions also lend to developing countries but have a more narrow country-membership structure and/or a focus on specific sectors or activities. 4 As an example for bank influence, consider the Russian A.O. Volga project, financed by Dresdner Bank Kleinwort Benson and the IFC. When this project suffered due to the Russian crisis and the moratorium in 1998, bank influence was evident in the fact that “the IFC umbrella regarding transfer and convertibil-ity risk has remained effective, since IFC’s loans were explicitly exempted from the moratorium” (Laza-rus, 2001, p. 119).
7
tional political risk category addresses risks relating to expropriation, to the convertibility and
transferability of currency, and to political violence. The regulatory risk category covers risks
arising from unanticipated regulatory changes. These risks include changes in taxation or foreign
investment laws. The quasi-commercial risk category reflects those risks that arise when the
project contends with state-owned suppliers or customers whose ability or willingness to fulfill
their contractual obligations towards the project may become questionable.
This definition already shows that political risk comprises a broad range of different
risks. Some of them are easy to identify ex post, such as restrictions on transferability, whereas
others, such as changes in the tax law that may lead to creeping expropriation, are not.5 Moreo-
ver, some risks can be very closely related to individual businesses, such as expropriation or reg-
ulatory changes. Others apply to the whole society, such as corruption, but may negatively im-
pact a firm’s performance. Accordingly, one could discriminate between investment-related po-
litical risk and general political risk.
We expect that a project finance structure helps to deal with political risk. Financial flows
become highly transparent for project finance loans. In their model, Subramanian and Tung
(2009) argue that project finance renders a project’s cash flow verifiable. Thereby the incentive
of a manager to default strategically disappears. This argument can be applied to government
interventions as well. If cash flows are verifiable, government interventions affecting them be-
come visible. However, this implies that the intervention potentially becomes public and the po-
litical costs of an intervention increase. Consequently, the government’s incentive to intervene
should be lower in the case of project finance. This argument applies in particular to investment-
related political risk. For general political risk, the impact of government action on cash flow is
5 Actually, creeping expropriation has become much more common, whereas total expropriation has be-come relatively rare (Esty, 2003).

8
less direct; therefore, project finance may be less potent in deterring them.
The participation of development banks should help to mitigate both investment-related
and general political risk. Development banks provide a political umbrella because they fre-
quently interact with the different bodies of government. In case an adverse government inter-
vention jeopardizes the success of a project, a development bank can use the leverage stemming
from its special status. As the government knows about the negative effect such an intervention
has on the loan (partially) granted by the development bank, it may recognize the negative effect
the intervention has on its reputation at the development bank. Ultimately, this might deter gov-
ernment intervention.6 The International Country Risk Guide (ICRG) provides various measures
of political risk that fit our perception of these risk categories very well. These measures are bu-
reaucracy quality, corruption, democratic accountability, ethnic tensions, external conflict, gov-
ernment stability, internal conflict, investment profile, law and order, military in politics, reli-
gious tensions, and socioeconomic conditions. We use these indicators in two different manners.
First, we take the ICRG’s overall Political Risk Rating as our main measure of political risk.
Second, we differentiate “investment profile” as a measure for investment-related political risk
from the other political risk measures. Investment profile captures as subcategories contract via-
bility/expropriation, profit repatriation, and payment delays.7
6 Esty (2003, p. 9) supports this argument: “The historical record shows that governments gave higher priority to obligations from multilateral lending institutions such as the World Bank Group when they could not service all of their external debt. One of the main reasons why they have received preferential treatment was because they are often the only source of new lending to countries in financial distress.” 7 In the ICRG’s original scale, the Political Risk Rating ranges from 0 to 100 and the subcategories range from 0 to 12, with higher values indicating lower risk. For comparability, we rescale the political risk proxies from 0 to 10, with higher values indicating more risk.

9
2.2.2. Law and Institutions
The literature has highlighted the important role of legal and institutional provisions for
the design of loan contracts. We expect that these risks can, in particular, be managed by the use
of project finance. Here the two important characteristics of project finance, the high transparen-
cy of cash flows and limited recourse, are instrumental. First, the fact that the project is incorpo-
rated separately and heavily financed with debt can be employed by the headquarters to commit
itself to monitoring the project. In this way, the project manager’s incentives are aligned (Laux,
2001). Second, with project finance financial flows become transparent. Subramanian and Tung
(2009) show in their model that with verifiable cash flows, the manager’s behavior does not de-
pend on the legal and institutional environment. Therefore, these two theoretical models would
predict that a project finance structure can influence incentives if the legal and institutional envi-
ronment is not able to shape them. Moreover, increased transparency renders some legal provi-
sions more easily applicable. It allows, for instance, the use of off-shore accounts, which limits
the convertibility risk and is more effective for projects than for diversified firms, where the as-
sets of different divisions may be offset. However, limited recourse also implies that the lender
only has access to the project’s assets in the case of a default. If these assets are poorly protected,
the lender’s payoff in this case will be very low. This may render using a project finance loan
unattractive.
In contrast to their ability to manage political risk, development banks find it more diffi-
cult to address problems in the legal and institutional environment. Legal provisions in corporate
law cannot be as easily changed as, for instance, a particular tax rate and these changes often
need a legal infrastructure, such as well-functioning courts, to be made. Moreover, besides the
“law in the book”, its implementation is important. However, it is even more difficult to address

10
the latter from “outside” because it is performed by the (potentially independent) judiciary.
We capture two different aspects of law and institutions in our analysis. The first is a
country’s corporate governance system because it shapes the framework in which a firm oper-
ates. It is measured with Djankov et al.’s (2008) index of ex-post control over self-dealing trans-
actions. This index reflects the legal protection of minority shareholders against expropriation by
corporate insiders and measures the disclosure or approval of transactions as well as the scope
for private litigation or public enforcement. Self-dealing includes “executive perquisites, exces-
sive compensation, transfer pricing, appropriation of corporate opportunities, self-serving finan-
cial transactions such as directed equity issuance or personal loans to insiders, and outright theft
of corporate assets” (Djankov et al., 2008, p. 431).
Second, we capture a country’s creditor rights because they specify what happens in the
case of default. We measure the strength of creditor rights by Djankov et al.’s (2007) index of
aggregate creditor rights. Following La Porta et al. (1998) “A score of one is assigned when each
of the following rights of secured lenders is defined in laws and regulations: First, there are re-
strictions, such as creditor consent or minimum dividends, for a debtor to file for reorganization.
Second, secured creditors are able to seize their collateral after the reorganization petition is ap-
proved, i.e., there is no automatic stay or asset freeze. Third, secured creditors are paid first out
of the proceeds of liquidating a bankrupt firm, as opposed to other creditors such as government
or workers. Finally, if management does not retain administration of its property pending the
resolution of the reorganization” (Djankov et al., 2007, p. 303). In a separate proxy, we also
measure the time needed to resolve insolvency in years taken from the World Development Indi-
cators. A longer duration of the bankruptcy process leads to the creditors’ having a weaker posi-
tion.
11
2.2.3. Other country level control variables
Next to political risk, corporate governance, and creditor rights, there are other country
features that explain the workings of the financial system and that might therefore affect the loan
contract with respect to the choice of recourse and participation of development banks. Studies
into the determinants of loan contract design consider, for example, various aspects of legal en-
forcement and the rule of law, shareholder rights, country risk, corruption, financial or economic
development (Bae and Goyal, 2009; Esty and Megginson, 2003; Qian and Strahan, 2007; Sub-
ramanian and Tung, 2009). Including these or other country features can improve the empirical
model by reducing the potentially omitted variables problem. However, including many country
features introduces multicollinearity, which in turn leads to model instability. To find a balance
between the omitted variables problem and model instability, we consider the following four
additional country features.
First, we use Euromoney’s “Economic Performance Index” as our proxy for the econom-
ic development of the borrower’s country. This annual index is based on the current GDP per
capita figures and on a poll of economic projections. Therefore, it contains not only current but
also forward-looking information, which is especially useful to us when we consider the me-
dium- to long-term nature of loan finance.8 Second, we obtain two proxies for financial devel-
opment from the World Development Indicators: Domestic credit provided by the banking sector
in percent of GDP and the percent of adults covered by a private credit bureau. As we focus on
loans, measures of banking sector development better capture financial development than stock
market-based proxies. Similarly, we prefer our domestic bank credit proxy over, for example, the
alternative proxy of domestic credit to the private sector because it measures loans by banks and 8 Similar to political risk, we scale our three country-level control variables from 0 to 10, with higher values indicating stronger corporate governance, stronger creditor rights or stronger economic perfor-mance.

12
not all types of financial institutions. Moreover, it captures different types of borrowers and this
mirrors very well what happens in our sample in which infrastructure projects are often asso-
ciated with the public sector. Third, we want to control for loan demand and follow Berger and
Hannan (1989) and Neuberger and Zimmermann (1990) who propose the annual growth rate of a
banking product as a proxy for demand and supply conditions in this market segment. Therefore,
we measure the annual growth rate of bank lending based on the World Development Indicators’
local currency volume of domestic credit provided by banking sector. Finally, we include dum-
mies for the country’s legal origin as British, French, German, and Scandinavian from La Porta
et al. (1999, 2008). La Porta et al. (2008) show that legal origin influences a country’s regula-
tions, institutions, and economic outcomes including, for example, procedural formalism, corrup-
tion, unemployment, stock market development or private credit. Consequently and in line with
Qian and Strahan (2007) we include legal origin dummies as proxies for possible omitted va-
riables.
3. Data and Methodology
We obtain our sample from the Dealscan database, which provides a comprehensive
record of global syndicated loan transactions. From Dealscan we collect a sample of asset-based
loans signed between January 1, 1996, and December 31, 2005. Dealscan classifies loans accord-
ing to purpose (e.g., trade finance, working capital, and general corporate purpose) and type
(e.g., term loan, bridge loan, and credit line) and includes information about the size of each loan
and the overall size of all loans belonging to the same deal. We differentiate between project
finance loans and full-recourse loans based on loan purpose. To ensure that we focus on invest-

13
ments for which the firm truly has a choice between a project finance and a full-recourse loan,
we consider only asset-based loans whose purpose is “project finance” and contrast them with
loans whose purpose is “capital expenditure”, “equipment purchase”, “telecom build-out”, “air-
craft and ship finance”, “leasing”, “real estate” or “corporate purposes”. Loans with the latter
purpose might not necessarily be asset based. We therefore impose two additional requirements
for these loans. First, these loans have to be of a sufficient size; that is, they have to be larger
than the smallest project finance loan. Second, the deal to which this loan belongs has to include
at least one term loan.9
Dealscan also contains detailed information about the loan syndicate including the names
of all lenders. We use this information to identify whether a development bank participates in a
deal or not. We classify lenders as development banks based on the World Bank’s definition of
multilateral development banks (MDBs) and multilateral financial institutions (MFIs) but also
consider prominent national development banks (NDBs), such as export-import banks. We in-
clude these latter lenders if they have a substantial share in the syndicated loan market and might
therefore have substantial influence over the host government. In particular, we select national
development banks that fund asset-based loans worth at least $500 million in real terms between
1991 and 2005.
As outlined above, we explain the choice of project finance and the participation of de-
velopment banks by country characteristics. The result of Doidge et al. (2007) that country cha-
racteristics explain much more (39%-73%) of the variance of governance ratings than observed
firm characteristics (4%-22%) justifies this approach. Although borrower-specific proxies, for
example, regarding corporate governance might nevertheless be preferable, only some corporate
governance provisions can be obtained on the firm level and only for full-recourse loans. The 9 Subramanian and Tung (2009) use a similar approach.

14
borrower of a project finance loan is a newly established company for which financial statements
or other records are neither available at the time of loan signing nor afterwards, as project
finance companies are usually not publicly listed. Nevertheless, we control for investment cha-
racteristics. Based on the Dealscan record of each loan, we can use the total size of all loans that
finance a given deal (in billions of real 2005 US$) as an indicator of the size of the investment.
Similarly, we measure the life of the investment with the maximum maturity in years among all
loans that finance a given asset. Additionally, we can identify the borrower’s industry as a rough
proxy for the asset’s technology. Based on the borrower’s 2-digit SIC code, we create six indus-
try groups: Mining including oil and gas (10-14), construction (15-19), manufacturing (20-39),
transportation and public utilities (40-49), and ‘other’ for the remaining SIC codes, which cover
agriculture, trade, financial services, and public administration. To nevertheless capture some
further borrower characteristics in an indirect manner, we apply a two-stage regression approach
as in Esty and Megginson (2003). First, we regress the loan spread on loan features that might
influence the spread (loan size and maturity, dummies indicating whether the loan is priced over
LIBOR, is guaranteed, has financial or general covenants, or is denominated in a currency differ-
ent from home currency of borrower) and on our country and investment proxies. The error term
of this regression reflects unexplained, residual borrower risk. It is uncorrelated with the other
independent variables and can be included as an indirect measure of borrower characteristics.
Overall, we have complete information for 4,978 asset-based loans signed by borrowers
from 64 countries (excluding the US) during our sample period of 1996 to 2005.10 Of these,
1,549 are project finance loans, and 3,429 are full-recourse loans. Development banks are part of
the syndicate for 545 of these loans. We define our dependent variables as 0/1 dummies. The
10 In line with the literature, we exclude loans to US borrowers (see Qian and Strahan, 2007). The results with US borrowers are discussed in section 4.3. on robustness.

15
loan dummy takes the value of one for a project finance loan and zero for a full-recourse asset-
based loan. The bank dummy takes the value of one if a development bank participates and zero
otherwise. We first model the loan and bank choice in a reduced form by estimating two separate
logit regressions. In line with Qian and Strahan (2007) we recognize that the loan and bank
choice might be jointly made. If this is the case, our regressions are no pure reduced forms, and
conclusions should be carefully drawn focusing on the relationship between financing structure
and political risk or law and institutions rather than on causality. Next, we explicitly consider this
joint decision of loan-bank choice and estimate a multinomial logit model. Instead of defining
two separate dummies, we now consider an indicator that takes the value of one for a project
finance loans with development banks, the value of two for a project finance loan without devel-
opment bank, the value of three for a full-recourse loan with development bank, and the value of
four for a full-recourse loan without development bank. Although the interpretation of the re-
gression coefficients is more complex, the multinomial logit model has the advantage of taking
the jointness of the loan and bank choice into account. Finally, as many of our proxies vary only
on the country and year levels and not on the loan level, we cluster standard errors by country.
This results in more conservative estimates of the significance of the independent variables.
4. Results
4.1. The Use of Project Finance and the Participation of Development Banks
Between January 1996 and December 2005, companies raised $982,035 million in real
terms in the global syndicated loan market to finance asset-based projects. As Panel A of Table 1

16
shows, about one third of these are project finance loans worth $287,037 million on a real basis.
Borrowers in industrialized countries raise most asset-based syndicated loans. Western Europe
and Canada alone account for 56% of the total loan volume. Looking at a country’s project
finance share indicates that this financing structure is least important in Western Europe but most
important for borrowers from Africa and the Middle East. Regarding development banks, Panel
B shows that development banks participate in 545 asset-based loans worth $124,870. About
85% of these asset-based loans are funded by national development banks with the Kreditanstalt
für Wiederaufbau (KfW) and Korea Development Bank (KDB) as the most active lenders. The
most active multilateral financial institution is the European Investment Bank who participates in
31 loans worth $9,550 million. Among the MDBs, the European Bank for Reconstruction and
Development (EBRD, 41 loans worth $ 5,598 million) and World Bank (55 loans worth $ 3,873
million) dominate.
[Insert Table 1 about here]
Table 2 provides a closer look at the loan and bank choice in relation to the borrower
country and investment characteristics. Panel A shows that in comparison to full-recourse loans,
project finance loans fund assets in countries that are politically riskier and have weaker corpo-
rate governance systems. Project finance is associated with stronger creditor rights. Moreover,
the use of project finance increases with longer time to resolve insolvencies, less developed
banking markets, and better credit bureau coverage. It is also more widely used if economic per-
formance is weak and loan growth is strong. Project finance loans are more prominent in coun-
tries with a French legal origin, reflecting in part the importance of project finance for African
countries as documented in Table 1. In contrast to other lenders, development banks can be asso-
ciated with investments in countries that have higher political risk and weaker corporate gover-

17
nance. They are also more likely to participate in countries with lengthier insolvency resolution,
poorer economic performance, less developed banking markets, and stronger loan growth. De-
velopment banks are also lending more to countries of German legal origin.11 This is mostly dri-
ven by the Korean Development Bank. A total of 80% of its loans funds investments in countries
with German legal origin including South Korea, Taiwan, and China. To a lesser extent, the
EBRD (44%) and KfW (65%) also matter in aggregate, as they have a geographic focus in Eu-
rope. These patterns are confirmed when looking at the combination of loan and bank choice. In
comparison to the three other financing choices, full-recourse loans without development banks
fund investments in countries that are politically safer, have stronger governance, equal or poorer
creditor rights, shorter insolvency resolution, stronger economic performance, larger banking
markets, and weaker loan growth. With 3,135 loans, full-recourse loans without development
banks account for the largest financing type in our sample. The 545 loans with development
banks are about equally split into project finance and full-recourse loans indicating that as a
group, development banks have no preference for project finance loans over full-recourse loans
or vice versa. Regarding investment features, Panel B shows that both project finance loans and
development bank participation are associated with larger, riskier longer-term investments, with
many loans going to the transportation sector and public utilities. Project finance loans are fur-
thermore more frequent in the mining and construction industries but less frequent in manufac-
turing. Overall, these observations from Table 1 and 2 give us a first indication that managing
political risk and risks stemming from the legal and institutional environment influence the pre-
ference for project finance loans and development bank participation.
11 On the one hand, British common law is more oriented towards market institutions. On the other hand, French civil law is more oriented towards state intervention. German and Scandinavian civil law can be categorized in-between with somewhat less orientation to state intervention. For details see Beck et al. (2003).
18
Finally, Panel C of Table 2 provides descriptive statistics for our explanatory variables
for all 4,978 asset-based loans. As shown, there is substantial variation in political risk, corporate
governance, creditor rights, insolvency resolution, economic performance, and banking market
characteristics despite the fact that these proxies only vary across countries and years. To illu-
strate, Italy in 2005 reflects the average level of political risk (2.25), corporate governance
(6.75), and creditor rights (5.00) relatively well. One standard deviation more political risk can
be found in Peru in 2001, whereas Germany in 2002 and Australia in 1999 show one standard
deviation less political risk. The highest level of political risk can be found in Nigeria followed
by Colombia and Pakistan. Compared to Italy in 2005 one standard deviation away are UK in
2004 with better corporate governance and The Philippines in 2004 with weaker corporate go-
vernance as well as Australia in 1999 with better creditor rights versus The Philippines in 2004
with weaker creditor rights. Panel C also shows that the standard deviations of our proxies differ
substantially. When interpreting our regression results in the next section, we will therefore focus
not only on the sign and significance of the coefficients but also on the effect that a one-
standard-deviation change in the explanatory variable has on the likelihood of an investment
being financed with project finance and/or development banks. For all dummy variables, we
consider a change from 0 to 1. In this way, the effects of our proxies become comparable. We
report odds ratios and marginal effects for completeness. Marginal effects are calculated for the
average loan; that is, we assume that all independent variables are at their mean values. As we
believe that project finance and development banks are most useful for highly politically risky
investments, the marginal effects might understate the importance of political risk.
[Insert Table 2 about here]

19
4.2. The Relevance of Political Risk and Law and Institutions
We argue above that project finance is more valuable when the political risk is higher and
law and institutions are weaker. We also expect that development banks are more likely to partic-
ipate when political risk is higher. The results in Table 3 confirm these expectations. The correla-
tion between project finance and political risk and our other explanatory proxies is found in re-
gressions (1) to (3) of Panel A. We first run a regression including only political risk and invest-
ment characteristics. We then add country characteristics in regression (2) and finally legal origin
and industry dummies in regression (3). The coefficient of political risk is significant and posi-
tive and stable across these three specifications indicating that our results are not driven by mul-
ticollinearity. Our preferred specification is regression (3). Here, for the average asset-based
loan, the predicted probability of being a project finance loan is 27.3%, which is close to the
sample frequency of 31.1%.12 For this average loan, the results indicate that the marginal effect
of an increase in political risk is 0.0784 or 7.84%. A one-standard-deviation discrete increase in
political risk is associated with an increase in the probability of a loan being financed with
project finance by 7.30%.13 Finally, a one-standard-deviation increase in political risk is asso-
ciated with an increase in the odds of project finance by a factor of 1.45 or 45%.14 All three
12 The predicted probability of a loan being a project finance loan is calculated as
)ˆˆ(
1
1ˆi
iZ
e∑
+=
+− βαπ , where
α̂ and β̂ are the estimated coefficients of the intercept and independent variables Zi of regression (1). 13 More specifically, we consider an increase in political risk by one standard deviation from 1.77 to 2.70, measuring an increase from a level half a standard deviation below the mean to a level half a standard deviation above the mean. In this case, the probability of a loan being financed as project finance increas-es by 7.30% from 23.79% to 31.09%. All other variables are held at their mean values. Panel B of Table 3 reports these detailed results. Throughout the paper, we apply this one-standard-deviation change centered on the mean to continuous independent variables when we report discrete changes in predicted probabili-ties. For dummy independent variables we consider a change from 0 to 1. 14 An odds ratio is defined as the probability of a loan being structured as a project finance loan divided by the probability of a loan being structured as a full-recourse loan. The odds ratio reflects a factor change

20
measures indicate an economically significant effect of political risk. Among the other country
characteristics, the results imply that the use of project finance is correlated with corporate go-
vernance and creditor rights. A one-standard-deviation improvement in corporate governance
and creditor rights is associated with a change in the predicted probability of project finance by -
6.01% and +6.28% for the average observation, respectively. In this sense, project finance is
most sensitive to political risk but is slightly less sensitive to creditor rights and corporate gover-
nance. The higher likelihood of project finance under poor corporate governance is consistent
with an interpretation that the contractual framework of project finance can serve as a substitute
for weak legal environments. In contrast, we find a positive correlation between project finance
and stronger creditor rights.15 Creditor rights measure what happens in the case of bankruptcy.
For a project finance loan, the creditor’s payoff in the case of bankruptcy stems from the project
only. Therefore, in a country with weak creditor rights, this payoff may be negligible. As a re-
sult, the incentive to use a project finance loan may increase with better creditor rights.
Moreover, we find that the use of project finance is correlated to loan growth but is unre-
lated to insolvency resolution, economic performance, banking market development or our broad
legal origin indicators. Regarding the industries dummies and project specific control variables,
we can observe that borrowers in the mining and construction sectors strongly prefer project
finance. This, for example, explains the high project finance shares of 50% in Australia, 75% in
Nigeria or 67% in the Middle East, which are substantially higher than those of other countries
or regions. Furthermore, borrowers are more likely to use project finance for riskier investments
with a longer life. This pattern is consistent with Kleimeier and Megginson (2000), who report
but can be converted into a percentage change by calculating %odds = (odds-ratio-1)*100. Note that the odds ratio does not depend on the value of the other variables in the model. 15 Note that Subramanian and Tung (2009) find a negative coefficient in their sample (which, unlike ours, includes US borrowers).

21
that project finance loans have a median size similar to that of fixed asset-based loans but a long-
er maturity.
Regressions (4) to (6) in Panel A analyze the participation of development banks. Again,
the results are stable across the three specifications, and regression (6) presents our preferred
model. For the average asset-based loan, the predicted probability of having a development bank
in the syndicate is 5.5%, which is somewhat lower than the sample frequency of 10.9%. From
the country characteristics included in regression (6), we learn that development banks are more
associated with projects in countries with higher political risk and stronger creditor rights. The
link between political risk and development bank participation is strong; a one-standard-
deviation increase in political risk is associated with a change in the odds of development bank
participation by 65%. Panel B confirms this strong relationship: A one-standard-deviation in-
crease in political risk increases the predicted probability of development bank participation from
4.30% to 6.91% for the average loan. We interpret this result as a clear indication development
banks provide a “political umbrella.” However, the participation of development banks is not
related to corporate governance provisions. Development banks are less likely to participate
when banking markets are more developed and in markets where there is stronger loan growth.
Development bank participate more frequently in less developed banking markets, in countries
with weaker loan growth, and of French or German legal origin. For the loan level characteris-
tics, we observe that development banks focus less on other industry sectors which includes agri-
culture, trade, financial services, and public administration. Furthermore, development banks are
more associated with larger investments with longer lives.
[Insert Table 3 about here]

22
4.2.1. Individual Development Banks
Given the importance of development banks in managing political risk documented in
Table 3, we wish to examine this relation in greater detail. In Table 4, we thus consider two
groups of development banks – multilateral development banks (MDBs) and multilateral finan-
cial institutions (MFIs) such as supra-national development banks versus national development
banks (NDBs) – as well as individual development banks if they participate in at least 40 loans in
our sample. At first sight, regressions (1) and (2) of Table 4 indicate that national development
banks can act as political umbrellas, whereas multilateral financial institutions and multilateral
development banks cannot. However, regressions (4) to (8) show that individual development
banks are very heterogeneous. For example, although the Korean Development Bank (KDB) and
the German Kreditanstalt für Wiederaufbau (KfW) participate less frequently in loans with better
corporate governance and economic performance, the lending policies of the other development
banks are not related to these country characteristics. This heterogeneity is most likely due to the
individual policy focus of each development bank, which results in a bank-specific loan portfo-
lio.16 Regarding political risk, only the World Bank is able to act as a political umbrella, whereas
the KfW, KDB and Export Development Canada (EDC) are not. The likelihood of the EBRD’s
participation even drops as political risk increases, indicating that the EBRD’s policy focus steers
it away from politically risky countries. The insignificant coefficient for political risk of all mul-
tilateral development banks and multilateral financial institutions as a group in regression (1)
16 We sometimes observe rather larger marginal effects and odds ratios for some of the dummy variables. For NDBs in regression (2), for example, the German legal origin dummy has an odds ratio of 12.91 and a marginal effect of 0.2199. Such results, however, have to be interpreted with care, as development banks can have a policy-driven focus on certain countries or industries. A discrete change from 0 to 1 for the German legal origin dummy implies a discrete change in the predicted probability of NDB participa-tion from 2.4% to 24.3%. As such, the results are reasonable. We also replicate regression (2) of Table 3 for all development bank groups and find that the coefficients of the continuous independent variables are stable across the two regressions. Therefore, the independent dummy variables do not affect our results.

23
might thus be driven by the opposing effects of the EBRD on the one hand and the World Bank
on the other. To filter out the impact of these two development banks, we estimate regression (3),
where we consider all multilateral financial institutions, multilateral development banks, and
national development banks as a group but exclude the EBRD and World Bank. From regression
(3), a more differentiated picture emerges. Taking all development banks except the World Bank
and EBRD together, they are able to manage political risk. However, only the World Bank is
able to do so individually. Its political umbrella is particularly strong. A one-standard-deviation
increase in political risk increases the odds for World Bank participation by 239% compared to
79% for development banks as a group. This result points to the important and dominant role of
the World Bank as the political umbrella.
[Insert Table 4 about here]
4.2.2. Disentangling Political Risk
Table 5 reports the results of our in-depth analysis of political risk by looking at the indi-
vidual components of our political risk index. Our political risk proxy combines various elements
of political risk. The results in Table 3 indicate that political risk can be managed both with
project finance and by development banks. To analyze the effect of political risk on the financ-
ing choice in greater detail, we differentiate between investment-related political risk and general
(or residual) political risk. The investment profile measures the government’s attitude towards
investments and covers the risks associated with expropriation or contract viability, repatriation,
and payment delays. General political risk combines ICRG’s remaining political risk indicators
including, among others, government stability, corruption in the political system, law and order,
and bureaucratic quality. The positive and significant coefficient of investment profile in regres-

24
sion (1) of Table 5 implies that project finance is used to manage this part of political risk. Lend-
ers who face an adverse attitude of the government towards investments try to minimize their
exposure by creating explicit contracts under a project finance structure. However, general polit-
ical risk does not have any significant impact on the use of project finance loans. In contrast to
Table 3, there is no longer any relationship between corporate governance and project finance
once we control for both types of political risk separately. The results of regressions (2) and (3)
indicate that development banks can minimize investment-related political risk but not general
political risk. Again, the World Bank plays an important role: it is the only development bank
that can manage general political risk.
[Insert Table 5 about here]
4.2.3. Multinominal Logit
The financing structure decision regarding project finance and development banks is
jointly taken. As such, we observe four combinations: project finance with development banks in
the syndicate, project finance without development banks, full-recourse loans with development
banks and full-recourse loans without development banks. Some of the effects of political risk
observed in the loan-type regressions above might thus be at least partly driven by the develop-
ment bank participation in these loans, or vice versa. To disentangle these effects more clearly,
we jointly consider the four financing choices in a multinominal logit framework. Table 6 reports
the results, taking full-recourse loans without development banks in the syndicate as the baseline
choice. Our specification includes a single political risk proxy and should thus be compared to
the results of the single logit regression in Table 3. Table 6 indicates that higher political risk is
associated with a higher likelihood of all three financing choices relative to full-recourse loans

25
without development banks. We thus conclude that both the project financing loan structure and
the participation of development banks help to manage political risk. The larger odds ratios for
the two financing choices involving development banks is taken as evidence that political risk
can be managed more strongly by development banks than by the project finance structure. Fig-
ure 1 shows why this is the case. We see the likelihood of each financing choice at different le-
vels of political risk. The likelihood of using a full-recourse loan without a development bank
decreases steadily with increasing political risk. For full-recourse and project finance loans, the
likelihood of development bank participation increases steadily with increasing political risk
indicating that development banks can manage political risk at all levels. The likelihood of
project finance without development banks first increases as political risk increases up to level of
about 6.0 (Indonesia in 1998) but falls as political risk increase further. The country with the
highest level of political risk in our sample is Nigeria in 2002 with a political risk level of 6.12.
For these high levels of political risk, the likelihood of using a full-recourse loan with develop-
ment banks actually increases more strongly compared to lower levels of political risk up to 4.0
(Turkey in 2000 or Argentina in 2003).17 Project finance thus seems to be most effective at low
to moderate levels of political risk, whereas development bank participation is especially valua-
ble at high levels of political risk. Figure 2 reports the corresponding effects when we split polit-
ical risk into investment-related political risk and general political risk.18 The decreasing effec-
tiveness of project finance to manage political risk is driven by general political risk as shown in
Panel B. However, the likelihood of all three financing choices increases in investment-related
political risk. These findings provide further support for our conclusion that the political umbrel- 17 Beyond the maximum political risk of 6.12 for Nigeria in 2002, the continuing drop in the li-kelihood of a project finance loans without development banks shown in Figure 1 is based on out-of-sample projections and is as such less certain, i.e. the confidence interval widens for high-er levels of political risk. 18 Regression results are presented in Table A1 in the appendix.

26
la of development bank encompasses all types of political risk. Project finance is most valuable
in managing investment-related political risk and – at moderate levels – general political risk.
[Insert Table 6 and Figures 1 and 2 about here]
4.3. Robustness Checks
We conduct additional analyses to test whether our main results of Tables 3 to 6 are ro-
bust.19 First, we consider a reduced sample that does not include loans with the purpose of ‘real
estate’ and thus excludes 470 loans. Although project finance has been applied to real estate
projects, the fact that the physical real estate asset provides excellent collateral in the event of
default favors the use of full-recourse loans (Beidleman et al. 1990). Therefore, this loan purpose
might bias our original sample against the use of project finance. The results obtained from this
reduced sample are consistent with the results presented in this paper, but the significance of the
political risk proxies tends to be slightly higher, whereas the significance of corporate gover-
nance tends to be slightly lower.
Second, we use a sample including US loans. Including loans to US borrowers increases
our sample size by 12,811 observations, of which 529 are project finance loans and 59 have de-
velopment banks in their syndicate. With 12,240 observations, 95.5% of US loans are full-
recourse loans without development banks compared to only 63% in our original sample. We
therefore have to conclude that the US market is substantially different from other markets with
respect to the use of project finance and development banks. In the extended sample, US loans
account for 72% of all observations and our results might thus be strongly driven by these US
loan observations. We therefore add a US borrower dummy to all regressions. The results are 19 Detailed results are available upon request.
27
generally robust but the coefficients of political risk, are less significant. This effect is most pro-
nounced in the project finance regressions when only the overall political risk proxy is used.
Thus, the large number of full-recourse US loans without development banks seems to affect the
results.
5. Conclusions
We started our paper with the question of how to finance a project in a politically risk
country. We investigate the use of a project finance structure versus a full recourse loan and the
participation of a development bank. These two features of a loan contract may be used to man-
age political risk and thereby make the financing of projects also feasible in high-risk environ-
ments. Our results clearly show that the use of project finance loans and the participation of de-
velopment banks are more likely in politically risky countries.
From our study, we can derive the following suggestions for the parties involved in fi-
nancing an investment. First, if the investment-related political risk, such as risks related to ex-
propriation or profit repatriation, is high, both a project finance structure and the participation of
development banks can be remedies. Second, if general political risk, such as corruption or gov-
ernment instability, is high, the best measure to deal with it is to have a development bank
among the participating banks. Therefore, our results are in line with the notion that development
banks stretch a political umbrella over the project. Moreover, they suggest that in particular, the
political umbrella of the World Bank is most valuable for mitigating general political risk.
The other contribution of our paper is to show that not only law and institutions influence
the loan contract but also political risk. So far, existing studies focused on the effect of law and
institutions on the loan contract. We use political risk as well as law and institutions as explana-
28
tory variables and find that the influence of political risk is actually more important than that of
law and institutions. With respect to law and institutions, we show that the use of project finance
increases for better creditor rights. Therefore, in a country with weak creditor rights, a project’s
payoff may be negligible, which renders a project finance structure unattractive for creditors be-
cause they do not have any additional recourse. However, better corporate governance provisions
decrease the use of project finance. This suggests that the complex contractual framework of
project finance can serve as a substitute for weak legal environments.
Appendix
[Insert Table A1 here]

29
References
Bae, K.-H., Goyal, V., 2009. Creditor rights, enforcement and costs of loan finance. Journal of
Finance 64, 823-860.
Beck, T., Demirgüç-Kunt, A., Levine, R., 2003. Law and finance: why does legal orgin matter?
Journal of Comparative Economics 31, 653-675.
Beidleman, C.R., Fletcher, D., Veshosky, D., 1990. On allocating risk: the essence of project
finance. Sloan Management Review 31, 47-55.
Berger, A.N., Hannan, T.H., 1989. The price-concentration relationship in banking. Review of
Economics and Statistics 72, 291-299.
Brealey, R., Cooper, I., Habib, M., 2000. Financing of Large Engineering Projects, in: Miller, R.,
Lessard, D. (Eds.), Strategic Management of Large Engineering Projects. MIT Press, Cam-
bridge, Massachusetts, pp. 165-180.
Buiter, W., Fries, S., 2002. What should the multilateral development bank do? Working paper
No. 74. European Bank for Reconstruction and Development, London.
Buljevich, E.C., Park, Y.S., 1999. Project Financing and the International Financial Markets.
Kluwer Academic Publishers, Norwell, MA.
Cadwalader, 2004. Clients&Friends Memo: Moving Towards Hybrid Project Financing. Cadwa-
lader, Wickersham & Taft LLP, New York.
Corielli, F., Gatti, S., Steffanoni, A., 2010. Risk shifting through nonfinancial contracts: effects
on loan spreads and capital structure of project finance deals. Journal of Money, Credit and
Banking 42, 1295-1320.
Djankov, S., McLiesh, C., Shleifer, A., 2007. Private credit in 129 countries. Journal of Financial
Economics 84, 299-329.

30
Djankov, S., LaPorta, R., Lopez-de-Silanes, F., Shleifer, A., 2008. The law and economics of
self-dealing. Journal of Financial Economics 88, 430-465.
Doidge, C., Karolyi, G.A., Stulz, R.M., 2007. Why do countries matter so much for corporate
governance? Journal of Financial Economics 86, 1-39.
Esty, B.C., 2003. Financing the Mozal Project. Harvard Business School Publishing, Boston,
MA.
Esty, B.C., 2004. Why study large projects? An introduction to research on project finance. Eu-
ropean Financial Management 10, 213–224.
Esty, B.C., Megginson W.L., 2003. Creditor rights, enforcement, and debt ownership structure:
Evidence from the global syndicated loan market. Journal of Quantitative and Financial
Analysis 38, 37-59.
Kleimeier, S., Megginson W.L., 2000. Are project finance loans different from other syndicated
credits? Journal of Applied Corporate Finance 13, 75-87.
La Porta, R., Shleifer A., Lopez-de-Silanes F., Vishny R., 1998. Law and finance. Journal of
Political Economy, 106, 1113-1155.
La Porta, R., Shleifer A., Lopez-de-Silanes F., Vishny R., 1999. The quality of government.
Journal of Law, Economics and Organization 15, 222–79.
La Porta, R., Shleifer A., Lopez-de-Silanes F., Vishny R., 2008. The economics consequences of
legal origins. Journal of Economic Literature 46, 285–332.
Laux, C., 2001. Project-specific external financing and headquarters monitoring incentives.
Journal of Law, Economics, and Organization 17, 397-412.
Lazarus, S., 2001. IFC and its role in globalization: highlights from IFC's participants meeting
Washington, D.C. June 6-7, 2001. International Finance Corporation, Washington, D.C.

31
Neuberger, J.A., Zimmermann, G.C., 1990. Bank pricing of retail deposit account and “The Cali-
fornia Rate Mystery”. Federal Reserve Bank of San Francisco Economic Review, Spring(2),
3-16.
Nevitt, P.K., Fabozzi, F., 1995, Project Financing. Euromoney Publications, Nestor House, UK.
Qi, Y., Roth, L., Wald, J.K., 2010. Political rights and the cost of debt. Journal of Financial Eco-
nomics 95, 202-226.
Qian, J., Strahan P.E., 2007. How laws & institutions shape financial contracts: the case of bank
loans. Journal of Finance 62, 2803-34.
Smith, W., 1997. Covering political and regulatory risks: Issues and options for private infra-
structure arrangements, in: Irwin, T. (Ed.), Dealing with Pubic Risk in Private Infrastructure.
International Bank for Reconstruction and Development, Washington D.C., pp. 45-88.
Subramanian, K.V., Tung, R., 2009. Law and project finance. Unpublished manuscript. Boston
University School of Law.

32
Table 1 Asset-based lending The table reports descriptive statistics for 4,578 asset-based loans signed between January 1, 1996, and December 31, 2005. We report number of loans and loan volumes in terms of real 2005 US dollars. Panel A focuses on the geographic distribution of project finance and full-recourse loans. We show the total lending volumes by region and for individual countries with at least $10 billion in total loan vo-lume. For African countries we report the three countries with highest loan volume. Panel B lists finan-cial institutions, which we categorize according to World Bank's guidelines as multilateral develop-ment banks (MDBs) or multilateral financial institutions (MFIs) and their total syndicated lending ac-tivities. The table also lists all national development banks (NDBs) with more than $500 million in funding during this period. We only report those institutions that participate in the syndicate of at least one of our 4,978 asset-based loans. We assign the full amount of the loan to each development bank.
Panel A: The geographic distribution of asset-based lending
borrower locationproject finance full-recourse
project finance full-recourse
Western Europe 129,102 383,405 550 1,159 United Kingdom 40,005 115,143 169 309 Spain 26,819 57,079 166 237 Italy 24,987 46,957 74 73 France 5,922 52,664 18 164 Germany 4,874 40,265 17 82 The Netherlands 2,895 20,952 16 76 Greece 3,995 10,336 15 65 Finland 5,506 4,837 5 16
Asia 85,407 153,510 651 1,371 Hong Kong 14,594 28,550 64 215 South Korea 13,179 24,540 98 248 Australia 17,480 14,797 103 90 Japan 237 25,034 2 192 China 6,525 12,461 84 144 Singapore 4,300 12,956 35 123 Indonesia 11,889 3,321 107 45 Malaysia 4,673 8,843 30 69 India 2,108 10,568 25 104 Philippines 4,257 6,208 54 83
The Americas and Carribean 37,293 119,590 143 656 Canada 5,823 37,806 17 212 Mexico 10,096 29,843 30 152 Chile 3,566 21,632 14 96 Brazil 5,292 11,115 25 57 Argentina 3,479 10,195 19 82
Eastern Europe and Russia 18,541 29,814 110 180 Russia 7,221 10,156 24 53 Poland 4,535 8,162 33 35
Middle East 13,991 5,266 78 39 Turkey 7,999 2,529 48 18
Africa 2,704 3,413 17 24 South Africa 374 2,313 6 16 Nigeria 1,131 103 3 1 Morocco 827 232 4 1
Global 287,037 694,998 1,549 3,429
loan volume (real $ mio) number of loans

33
Table 1 continued
Panel B: Lending by development banks
development banks categoryloan volume (real $ mio)
number of loans
all development banks 124,870 545
all national development banks (NDBs) 106,928 414all multilateral development banks (MDBs) 12,168 116all multinational financail institutions (MFIs) 13,743 56
individual development banks:Kreditanstalt für Wiederaufbau (KfW) NDB 51,001 129Korea Development Bank (KDB) NDB 30,113 184Export Development Canada (EDC) NDB 15,512 59European Investment Bank MFI 9,550 31Japan Bank for International Cooperation (JBIC) NDB 8,901 27European Bank for Reconstruction & Development (EBRD) MDB 5,599 41Internationale Nederlanden Bank NV NDB 3,976 23World Bank (WB, incl. IBRD and IFC) MDB 3,874 55Export-Import Bank of Korea NDB 2,437 21Corporacion Andina de Fomento MDB (subregional) 1,906 9Export-Import Bank of the Republic of China NDB 987 4Asian Development Bank MDB 828 10China Development Bank NDB 713 6Inter-American Development Bank MDB 345 5Islamic Development Bank MFI 216 2

34
Table 2 Descriptive statistics for different financing structures This table describes country and investment characteristics in relationship to the financing choice of loan and bank type. We diffe-rentiate asset-based loans as project finance or full-recourse loans and consider whether one or more development banks (DB) are part of the syndicate. In Panels A and B, we use a two-sided t-test to test for differences in mean between project finance and full-recourse loans, between loans with versus without development banks, and between full-recourse loans without development banks and the other three financing choices. ***, ** and * indicate that means are significantly different at the 1%, 5%, and 10% levels, respectively.
all loans 4,978 2.23 1.93 2.27 6.30 5.51 2.32 6.23 110.21 6.43 0.13 41% 22% 2% 35%
project finance loans 1,549 2.37 *** 2.24 *** 2.39 *** 6.01 *** 5.90 *** 2.49 *** 6.12 *** 98.57 *** 7.37 *** 0.15 *** 46% *** 19% *** 1% 34%full-recourse loans 3,429 2.17 1.78 2.22 6.44 5.33 2.25 6.28 115.47 6.00 0.11 39% 23% 2% 36%
loans with DB 545 2.66 *** 2.71 *** 2.65 *** 5.38 *** 5.40 2.92 *** 5.62 *** 80.97 *** 4.31 *** 0.15 *** 44% 41% *** 1% *** 14% ***loans without DB 4,433 2.18 1.83 2.22 6.42 5.52 2.25 6.30 113.80 6.69 0.12 41% 19% 2% 38%
project finance loans with DB 251 2.68 *** 2.64 *** 2.68 *** 5.06 *** 5.16 3.05 *** 5.44 *** 81.95 *** 5.11 0.15 *** 50% *** 35% *** 0% *** 15% ***project finance loans without DB 1,298 2.31 *** 2.16 *** 2.33 *** 6.19 *** 6.04 *** 2.39 *** 6.25 101.78 *** 7.80 *** 0.16 *** 45% *** 16% *** 2% 38%full-recourse loans with DB 294 2.65 *** 2.78 *** 2.63 *** 5.66 *** 5.60 * 2.81 *** 5.77 *** 80.13 *** 3.62 *** 0.16 *** 39% 46% *** 1% 14% ***full-recourse loans without DB 3,135 2.12 1.69 2.18 6.51 5.31 2.19 6.33 118.78 6.22 0.11 39% 21% 2% 38%
Scandi- navian Britishoverall
invest- ment
related general
private credit
bureau coverage
Panel A: Country characteristics
number of
loans
average fraction of sample with legal originpolitical risk corpo-
rate gover- nance
creditor rights
time to resolve insol- vency
econo- mic
perfor- mance
banking market
develop- ment
annual loan
growth French German

3
Table 2 continued
all loans 4,978 407.74 7.54 0.000 7% 38% 28% 6% 21%
project finance loans 1,549 422.95 11.10 *** 0.008 *** 10% *** 44% *** 17% *** 14% *** 15% ***full-recourse loans 3,429 400.87 5.93 -0.004 6% 35% 33% 2% 24%
loans with DB 545 456.12 * 11.12 *** 0.011 6% 55% *** 23% *** 8% ** 8% ***loans without DB 4,433 401.80 7.10 -0.001 7% 35% 29% 6% 23%
project finance loans with DB 251 459.04 * 13.40 *** 0.020 ** 9% * 48% *** 21% *** 15% *** 7% ***project finance loans without DB 1,298 415.97 10.66 *** 0.006 ** 10% *** 43% *** 16% *** 14% *** 17% ***full-recourse loans with DB 294 453.62 9.17 *** 0.003 4% 61% *** 25% *** 3% 8% ***full-recourse loans without DB 3,135 395.93 5.62 -0.004 6% 32% 34% 2% 25%
Panel B: Investment characteristicsaverage
transpor- tation & utilities
manufac- turing construction other
fraction of sample in industry
number of loans
investment size
($ mio real)
investment life
(years) investment
risk mining
overall
invest- ment
related generalsize ($
mio real)life
(years) riskmean 2.23 1.93 2.27 6.30 5.51 2.32 6.23 110.21 6.43 0.13 407.74 7.54 0.00median 2.05 1.67 2.27 6.75 5.00 1.50 6.70 103.82 0.00 0.10 171.94 5.08 -0.02minimum 0.39 0.00 0.42 0.25 0.00 0.40 1.77 8.60 0.00 -0.16 0.65 0.25 -0.36maximum 6.12 7.50 6.11 10.00 10.00 10.00 10.00 312.78 64.00 1.34 19,492.86 40.00 2.03standard deviation 0.93 1.74 0.92 2.38 2.96 2.20 1.72 58.80 13.73 0.15 915.05 5.44 0.12
Panel C: Variations in country and investment characteristics across all asset-based loanspolitical risk
corporate gover- nance
creditor rights
time to resolve
insolvency (years)
economic perfor- mance
banking market
develop- ment
annual loan
growth
investmentprivate credit
bureau coverage

36
Table 3 The determinants of the financial contract Panel A shows logit regression results. For each independent variable, we report in the top row the estimated coefficient and in the bottom row the χ2-statistic as well as marginal effects and odds ratios. *, **, and *** indicate significance at the 10%, 5% and 1% levels, respectively. Standard errors are heteroskedasticity robust and clustered by country. The odds ratio indicates the change in the odds for the average loan to be financed as project finance (or with a development bank) given a standard deviation increase in the independent variable. For dummy variables, a change from 0 to 1 is considered. In regressions 1 to 3, our dependent variable is a dummy which takes the value of 1 for a project finance loan and 0 for a full-recourse loan. In regressions 4 to 6, the dependent dummy variable takes the value of 1 if at least one development bank is part of the deal’s syndi-cate. Panel B shows the predicted probabilities of project finance and development bank participation based on regressions 3 and 6, respectively, when the independent variable is valued at a level of half a standard deviation below the mean (from) compared to half a standard deviation above its mean (to). The difference expresses the change in probability for this one standard deviation change. For independent dummy variables a change from 0 to 1 is considered. All other independent variables are held at their mean values.

37
Table 3 continued
regression dependent variable
marginal effect
odds ratio
marginal effect
odds ratio
marginal effect
odds ratio
marginal effect
odds ratio
marginal effect
odds ratio
marginal effect
odds ratio
intercept -3.38 *** -3.17 *** -3.22 ** -4.39 *** -2.31 *** -4.02 ***-5.70 -3.00 -2.32 -8.71 -3.37 -5.35
country characteristics political risk 0.45 *** 0.0920 1.52 0.36 ** 0.0726 1.40 0.40 ** 0.0784 1.45 0.67 *** 0.0515 1.87 0.44 *** 0.0280 1.50 0.54 *** 0.0277 1.65
3.05 2.06 2.22 4.24 2.74 2.71 corporate governance -0.09 * -0.0177 0.81 -0.13 * -0.0252 0.74 -0.10 -0.0063 0.79 0.05 0.0023 1.11
-1.85 -1.66 -1.49 0.49 creditor rights 0.11 *** 0.0223 1.39 0.11 ** 0.0212 1.37 0.08 0.0050 1.26 0.07 * 0.0036 1.23
2.92 2.53 1.28 1.68 time to resolve insolvency -0.02 -0.0042 0.96 -0.02 -0.0040 0.96 -0.04 -0.0025 0.92 -0.02 -0.0009 0.96
-0.38 -0.35 -0.51 -0.44 economic performance 0.05 0.0102 1.09 0.07 0.0130 1.12 0.00 0.0000 1.00 -0.04 -0.0020 0.94
0.46 0.58 0.01 -0.64 banking market development -0.01 -0.0009 0.76 0.00 -0.0008 0.80 -0.01 ** -0.0008 0.49 -0.01 *** -0.0006 0.50
-1.39 -1.27 -2.36 -3.60 private credit bureau coverage 0.01 0.0011 1.08 0.00 0.0005 1.03 -0.01 -0.0008 0.84 -0.01 -0.0005 0.89
1.50 0.34 -1.05 -0.73 annual loan growth 1.02 ** 0.2035 1.16 0.98 * 0.1938 1.15 -0.68 -0.0437 0.91 -1.10 * -0.0569 0.85
2.20 1.73 -1.29 -1.94 French legal origin -0.29 -0.0573 0.75 0.99 * 0.0565 2.68
-0.54 1.72 German legal origin -0.46 -0.0850 0.63 1.99 *** 0.1789 7.32
-1.03 4.08 Scandinavian legal origin -0.12 -0.0225 0.89 0.76 0.0546 2.14
-0.19 0.93investment characteristics ln(investment size) 0.07 0.0151 1.10 0.06 0.0128 1.09 0.06 0.0118 1.08 0.22 * 0.0165 1.33 0.23 ** 0.0145 1.35 0.29 *** 0.0151 1.47
1.07 0.99 0.80 1.94 2.07 4.51 investment life 0.21 *** 0.0432 3.16 0.20 *** 0.0408 3.03 0.21 *** 0.0410 3.08 0.12 *** 0.0088 1.88 0.12 *** 0.0079 1.95 0.12 *** 0.0063 1.95
5.18 4.80 5.35 5.90 8.07 8.84 investment risk 1.07 ** 0.2188 1.14 1.03 ** 0.2067 1.13 1.07 ** 0.2130 1.14 0.68 * 0.0520 1.09 0.60 * 0.0387 1.08 0.43 0.0223 1.05
2.26 2.45 2.55 1.92 1.78 0.98industry dummies mining 0.95 *** 0.2163 2.59 -0.37 -0.0167 0.69
3.79 -1.57 transportation & utilities 0.18 0.0359 1.20 0.13 0.0067 1.14
0.65 0.52 construction 2.15 *** 0.4903 8.56 0.12 0.0066 1.13
7.93 0.35 other -0.05 -0.0093 0.95 -0.95 ** -0.0395 0.39
-0.16 -2.40
number of observations 4,978 4,978 4,978 4,978 4,978 4,978log likelihood -2,515.8 -2,452.7 -2,331.7 -1,510.0 -1,442.9 -1,332.3pseudo R2 0.288 0.316 0.368 0.162 0.211 0.289sample probability 31.1% 31.1% 31.1% 10.9% 10.9% 10.9%predicted probability 28.7% 27.7% 27.3% 8.3% 6.9% 5.5%
project finance dummy development bank dummycoeffi- cient
coeffi- cient
coeffi- cient
coeffi- cient
coeffi- cient
coeffi- cient
Panel A: Regression results(1) (2) (3) (4) (5) (6)

38
Table 3 continued
from to difference from to differenceone-standard deviation change in:
political risk 23.79% 31.09% 7.30% 4.30% 6.91% 2.60%corporate governance 30.40% 24.39% -6.01% 5.19% 5.75% 0.56%creditor rights 24.26% 30.54% 6.28% 4.95% 6.02% 1.08%time to resolve insolvency 27.73% 26.85% -0.88% 5.56% 5.36% -0.20%economic performance 26.19% 28.42% 2.24% 5.63% 5.29% -0.34%banking market development 29.56% 25.13% -4.44% 7.58% 3.91% -3.68%private credit bureau coverage 26.96% 27.63% 0.67% 5.79% 5.15% -0.63%annual loan growth 25.90% 28.73% 2.83% 5.89% 5.06% -0.83%ln(investment size) 26.52% 28.08% 1.56% 4.54% 6.55% 2.00%investment life 17.63% 39.70% 22.07% 3.97% 7.47% 3.50%investment risk 26.02% 28.60% 2.58% 5.33% 5.60% 0.27%
change from 0 to 1 in:French legal origin 29.73% 24.00% -5.73% 3.72% 9.37% 5.65%German legal origin 29.31% 20.81% -8.50% 3.61% 21.50% 17.89%Scandinavian legal origin 27.34% 25.08% -2.25% 5.39% 10.84% 5.46%mining industry 26.00% 47.63% 21.63% 5.59% 3.93% -1.67%transportation & utilities industry 25.97% 29.57% 3.59% 5.22% 5.89% 0.67%construction industry 24.76% 73.79% 49.03% 5.42% 6.08% 0.66%other industry 27.49% 26.56% -0.93% 6.61% 2.65% -3.95%
27.3% 5.5%predicted probability for average loan observation
Panel B: Discrete changes in the financing choice's predicted probability predicted probability of
project finance development bank participation

39
Table 4 The political umbrella of different development banks This table shows logit regression results. For each independent variable, we report in the top row the estimated coefficient and in the bottom row the χ2-statistic as well as marginal effects and odds ratios. *, **, and *** indicate significance at the 10%, 5% and 1% levels, respectively. Standard errors are heteroskedastici-ty robust and clustered by country. The odds ratio indicates the change in the odds for the average loan to be financed as project finance (or with a development bank) given a standard deviation increase in the independent variable. For dummy variables, a change from 0 to 1 is considered. Our dependent variable is a dummy takes the value of 1 if at least one development bank (DB) is part of the deal’s syndicate. Different dummies are created for multilateral development banks (MDBs) plus multinational financial institutions (MFIs), for national development banks (NDBs), and for individual development banks. For the group of “DBs excl EBRD, WB”, the dummy only takes the value of 1 if the participating development banks do not include the EBRD or the World Bank. KDB and WB do not make loans to borrowers in countries of Scandinavian legal origin. In regressions (5) and (8), a value of 1 for the Scandinavian legal origin dummy pre-dicts the value of 0 for the dependent variable perfectly, and all observations with Scandinavian legal origin dummy equal to 1 are therefore excluded from the sample. The EDC does not make loans to borrowers in construction and other industries or in countries with Scandinavian legal origin, and the respective obser-vations are excluded from the sample. The EBRD does not make loans to borrowers in other industries or in countries with Scandinavian legal origin, and the respective observations are excluded from the sample.

40
Table 4 continued
regression
dependent variable marginal
effectodds ratio
marginal effect
odds ratio
marginal effect
odds ratio
marginal effect
odds ratio
marginal effect
odds ratio
marginal effect
odds ratio
marginal effect
odds ratio
marginal effect
odds ratio
intercept -2.59 * -5.29 *** -5.83 *** -1.10 -12.75 *** -2.93 -8.77 *** 11.07 ***-1.80 -5.18 -5.28 -0.89 -6.38 -1.10 -5.55 3.20
country characteristics political risk 0.35 0.0029 1.39 0.45 ** 0.0174 1.52 0.63 *** 0.0277 1.79 -0.13 -0.0016 0.88 0.66 0.0000 1.83 0.18 0.0006 1.19 1.32 *** 0.0016 3.39 -2.31 *** 0.0000 0.12
1.26 2.26 3.19 -0.60 1.61 0.30 3.75 -4.33 corporate governance -0.12 -0.0010 0.75 0.13 0.0051 1.37 0.10 0.0044 1.27 -0.26 ** -0.0031 0.54 0.44 0.0000 2.85 0.01 0.0000 1.02 -0.22 -0.0003 0.60 -0.48 ** 0.0000 0.32
-0.98 1.25 0.88 -1.99 1.59 0.05 -0.86 -2.21 creditor rights -0.13 * -0.0011 0.68 0.16 *** 0.0061 1.60 0.12 ** 0.0053 1.43 0.09 0.0010 1.29 0.31 ** 0.0000 2.51 0.05 0.0001 1.14 -0.17 * -0.0002 0.60 0.26 ** 0.0000 2.08
-1.95 3.10 2.16 1.32 2.09 0.43 -1.73 2.16 time to resolve insolvency 0.05 0.0004 1.11 -0.02 -0.0009 0.95 -0.03 -0.0013 0.94 0.05 0.0006 1.11 0.12 0.0000 1.30 0.00 0.0000 0.99 0.08 0.0001 1.20 0.03 0.0000 1.08
0.78 -0.43 -0.51 0.56 1.06 -0.03 1.24 0.18 economic performance -0.04 -0.0003 0.94 -0.07 -0.0028 0.88 0.04 0.0019 1.08 -0.26 ** -0.0031 0.64 0.10 0.0000 1.18 -0.42 -0.0013 0.48 0.28 0.0003 1.61 -1.39 *** 0.0000 0.09
-0.27 -1.25 0.62 -2.11 0.57 -1.55 0.90 -5.92 banking market development -0.02 *** -0.0001 0.36 -0.01 ** -0.0004 0.56 -0.01 *** -0.0004 0.57 0.00 0.0000 1.16 -0.01 0.0000 0.74 -0.02 0.0000 0.40 0.00 0.0000 1.07 -0.08 *** 0.0000 0.01
-3.30 -2.55 -2.62 0.63 -1.00 -1.15 0.14 -4.89 private credit bureau coverage 0.01 0.0001 1.16 -0.02 * -0.0008 0.75 -0.01 -0.0002 0.94 -0.01 -0.0001 0.93 -4.34 ** 0.0000 0.00 0.00 0.0000 0.98 -0.02 0.0000 0.75 -0.19 *** 0.0000 0.08
0.64 -1.76 -0.37 -0.54 -2.19 -0.07 -0.87 -3.29 annual loan growth 0.45 0.0037 1.07 -1.68 *** -0.0649 0.78 -1.72 *** -0.0762 0.78 -0.80 -0.0096 0.89 3.14 * 0.0000 1.57 -2.01 -0.0061 0.75 -4.05 ** -0.0049 0.56 6.75 *** 0.0000 2.63
0.53 -2.62 -2.69 -0.48 1.67 -1.51 -2.21 3.56 French legal origin -0.34 -0.0027 0.72 1.72 *** 0.0833 5.56 1.49 * 0.0791 4.43 0.27 0.0034 1.32 3.47 ** 0.0000 32.26 1.91 0.0078 6.72 -0.52 -0.0006 0.59 -2.38 * 0.0000 0.09
-0.40 2.63 2.22 0.46 2.85 1.59 -0.43 -1.81 German legal origin -0.11 -0.0009 0.89 2.65 *** 0.2268 14.14 2.44 *** 0.2197 11.52 0.54 0.0076 1.72 5.15 *** 0.0000 171.63 -0.12 -0.0004 0.89 -2.65 ** -0.0020 0.07 -0.54 0.0000 0.58
-0.15 4.87 4.34 0.98 5.84 -0.08 -2.24 -0.48 Scandinavian legal origin -0.64 -0.0039 0.53 1.42 0.1057 4.15 1.06 0.0759 2.90 1.05 0.0212 2.85
-0.56 1.45 0.99 0.83investment characteristics ln(investment size) 0.12 0.0009 1.16 0.34 *** 0.0131 1.57 0.38 *** 0.0166 1.65 0.65 *** 0.0078 2.38 0.45 *** 0.0000 1.81 0.33 0.0010 1.55 -0.31 -0.0004 0.66 0.14 0.0000 1.20
0.75 4.38 4.73 4.31 4.14 1.68 -1.38 0.30 investment life 0.11 *** 0.0009 1.83 0.11 *** 0.0041 1.79 0.11 *** 0.0048 1.80 0.05 ** 0.0006 1.32 0.08 *** 0.0000 1.56 0.02 0.0001 1.10 0.19 ** 0.0002 2.80 0.21 *** 0.0000 3.00
5.16 7.31 8.69 2.17 2.62 0.46 2.50 4.05 investment risk 1.43 *** 0.0118 1.19 -0.55 -0.0214 0.94 -0.18 -0.0078 0.98 -1.39 * -0.0166 0.85 -0.66 0.0000 0.92 -0.87 -0.0026 0.90 1.37 *** 0.0016 1.18 3.64 *** 0.0000 1.54
3.77 -1.16 -0.38 -1.66 -1.52 -0.98 3.79 2.76industry dummies mining -0.50 -0.0034 0.61 -0.11 -0.0041 0.90 -0.14 -0.0058 0.87 -0.48 -0.0047 0.62 -0.21 0.0000 0.81 0.63 0.0025 1.88 -1.34 * -0.0010 0.26 -0.56 0.0000 0.57
-0.98 -0.43 -0.58 -0.88 -0.49 1.55 -1.72 -0.42 transportation & utilities 0.65 * 0.0060 1.92 0.08 0.0032 1.09 0.15 0.0067 1.16 0.41 0.0052 1.51 -0.49 0.0000 0.61 0.85 0.0026 2.33 -0.52 -0.0006 0.59 0.75 0.0000 2.11
1.92 0.29 0.52 1.12 -1.19 2.23 -1.17 0.89 construction 1.25 ** 0.0188 3.50 -0.21 -0.0074 0.81 0.14 0.0066 1.15 0.34 0.0048 1.41 -0.22 0.0000 0.81 -0.44 -0.0004 0.65 0.16 0.0000 1.17
1.98 -0.67 0.37 0.56 -0.64 -0.44 0.11 other -1.39 ** -0.0083 0.25 -0.82 * -0.0262 0.44 -0.68 -0.0254 0.51 -0.40 -0.0043 0.67 -3.59 *** 0.0000 0.03 -4.07 -0.0028 0.02
-2.06 -1.78 -1.48 -0.64 -2.91 -1.24
number of observations 4,978 4,978 4,978 4,978 4,882 3,545 4,882 3,921log likelihood -553.9 -1,108.8 -1,191.0 -506.2 -410.9 -229.5 -209.3 -90.0pseudo R2 0.246 0.274 0.263 0.170 0.516 0.251 0.319 0.619sample probability 2.3% 8.3% 9.9% 2.6% 3.8% 1.7% 1.1% 1.0%predicted probability 0.8% 4.0% 4.6% 1.2% 0.0% 0.3% 0.1% 0.0%
coeffi- cient
coeffi- cient
coeffi- cient
coeffi- cient
individual development banks(4) (5) (6) (7)
KfW KDB EDC WB EBRDcoeffi- cient
(8)(1) (3)
coeffi- cient
coeffi- cient
MDB+MFI DB excl WB, EBRDdevelopment bank groups
NDBcoeffi- cient
(2)

41
Table 5 This table shows logit regression results. For each independent variable, we report in the top row the estimated coefficient and in the bottom row the χ2-statistic as well as marginal effects and odds ratios. *, **, and *** indi-cate significance at the 10%, 5% and 1% levels, respectively. Standard errors are heteroskedasticity robust and clustered by country. The odds ratio indicates the change in the odds for the average loan to be financed as project finance (or with a development bank) given a standard deviation increase in the independent variable. For dummy variables, a change from 0 to 1 is considered. In regression (1), our dependent variable is a dummy which takes the value of 1 for a project finance (PF) loan and 0 for a full-recourse loan. In regression (2), the dependent dum-my variable takes the value of 1 if at least one development bank (DB) is part of the deal’s syndicate. In regres-sions (3) to (6) different dummies are created for multilateral development banks (MDBs) plus multinational fi-nancial institutions (MFIs) as well as for national development banks (NDBs). The World Bank (WB) is consi-dered individually. For the group of “DBs excluding WB”, the dummy only takes the value of 1 if the participat-ing development banks do not include the World Bank. The World Bank does not make loans to countries of Scandinavian legal origin. In regression (6), a value of 1 for the Scandinavian legal origin dummy predicts the value of 0 for the WB dummy perfectly and all observations with Scandinavian legal origin dummy equal to 1 are therefore excluded from the regression sample.

42
Table 5 continued
regression dependent variable
marginal effect
odds ratio
marginal effect
odds ratio
marginal effect
odds ratio
marginal effect
odds ratio
marginal effect
odds ratio
intercept -2.86 ** -3.70 *** -5.36 *** -9.25 *** 11.08 ***-2.01 -4.72 -4.87 -4.53 3.06
country characteristics political risk: investment-related 0.17 *** 0.0332 1.34 0.15 ** 0.0078 1.30 0.21 *** 0.0092 1.44 0.07 0.0001 1.12 -0.48 ** -1.2E-06 0.43
1.77 2.45 3.09 0.45 -2.35 political risk: general 0.15 0.0294 1.15 0.33 0.0169 1.35 0.33 0.0144 1.36 1.35 *** 0.0016 3.41 -1.96 *** -4.8E-06 0.16
0.78 1.60 1.57 2.79 -4.02 corporate governance -0.11 -0.0213 0.77 0.05 0.0028 1.14 0.12 0.0050 1.32 -0.25 -0.0003 0.55 -0.46 * -1.1E-06 0.34
-1.40 0.60 1.04 -0.92 -1.90 creditor rights 0.11 ** 0.0217 1.38 0.07 * 0.0034 1.22 0.12 ** 0.0051 1.41 -0.16 -0.0002 0.62 0.29 ** 7.0E-07 2.28
2.50 1.68 2.26 -1.61 2.09 time to resolve insolvency -0.03 -0.0057 0.94 -0.02 -0.0011 0.95 -0.04 -0.0015 0.93 0.10 0.0001 1.25 0.01 3.1E-08 1.03
-0.50 -0.57 -0.68 1.29 0.06 economic performance 0.00 0.0000 1.00 -0.08 -0.0042 0.87 -0.03 -0.0011 0.96 0.34 0.0004 1.80 -1.39 *** -3.4E-06 0.09
0.00 -1.09 -0.28 1.01 -5.79 banking market development 0.00 -0.0006 0.84 -0.01 *** -0.0006 0.51 -0.01 ** -0.0004 0.60 0.00 0.0000 1.07 -0.09 *** -2.1E-07 0.01
-1.02 -3.60 -2.56 0.13 -4.54 private credit bureau coverage 0.00 0.0002 1.02 -0.01 -0.0005 0.87 -0.01 -0.0003 0.92 -0.02 0.0000 0.77 -0.22 *** -5.3E-07 0.05
0.14 -0.86 -0.52 -0.73 -2.74 annual loan growth 0.97 * 0.1929 1.15 -1.04 * -0.0537 0.86 -1.63 ** -0.0714 0.79 -4.39 ** -0.0052 0.53 6.89 *** 1.7E-05 2.68
1.66 -1.89 -2.54 -2.15 3.67 French legal origin -0.10 -0.0195 0.91 1.07 ** 0.0619 2.91 1.63 ** 0.0878 5.09 -0.62 -0.0007 0.54 -2.20 * -5.4E-06 0.11
-0.18 1.89 2.48 -0.48 -1.66 German legal origin -0.45 -0.0839 0.64 1.96 *** 0.1748 7.12 2.41 *** 0.2130 11.12 -2.64 ** -0.0020 0.07 -0.64 -1.3E-06 0.53
-0.98 4.24 4.61 -2.12 -0.57 Scandinavian legal origin -0.08 -0.0153 0.93 0.70 0.0491 2.02 1.00 0.0684 2.71
-0.13 0.89 0.97investment characteristics ln(investment size) 0.07 0.0128 1.09 0.30 *** 0.0154 1.49 0.39 *** 0.0172 1.68 -0.31 -0.0004 0.66 0.12 2.9E-07 1.17
0.88 4.57 4.95 -1.39 0.26 investment life 0.21 *** 0.0413 3.11 0.12 *** 0.0064 1.96 0.11 *** 0.0048 1.81 0.19 *** 0.0002 2.79 0.20 *** 5.0E-07 2.92
5.28 8.87 8.65 2.58 4.03 investment risk 0.91 ** 0.1812 1.12 0.36 0.0187 1.05 -0.28 -0.0122 0.97 1.54 *** 0.0018 1.21 3.85 *** 9.3E-06 1.58
2.15 0.81 -0.61 4.08 2.80industry dummies mining 0.92 *** 0.2078 2.50 -0.40 * -0.0177 0.67 -0.18 -0.0075 0.83 -1.29 * -0.0009 0.28 -0.46 -9.4E-07 0.63
3.75 -1.71 -0.78 -1.65 -0.35 transportation & utilities 0.14 0.0281 1.15 0.10 0.0053 1.11 0.11 0.0050 1.12 -0.48 -0.0006 0.62 0.81 2.1E-06 2.24
0.52 0.41 0.39 -1.07 0.96 construction 2.14 *** 0.4890 8.50 0.13 0.0068 1.13 0.15 0.0070 1.16 -0.45 -0.0004 0.64 0.30 8.4E-07 1.35
7.95 0.37 0.40 -0.45 0.21 other -0.01 -0.0025 0.99 -0.93 ** -0.0386 0.40 -0.64 -0.0239 0.53 -4.04 -0.0028 0.02
-0.04 -2.39 -1.42 -1.27
number of observations 4,978 4,978 4,978 4,882 3,921log likelihood -2,323.8 -1,329.2 -1,184.0 -209.3 -89.4pseudo R2 0.371 0.291 0.269 0.319 0.621sample probability 31.1% 10.9% 9.9% 1.1% 1.0%predicted probability 27.3% 5.4% 4.6% 0.1% 0.0%
(5)EBRD
coeffi- cient
(4)(1) (2) (3)
coeffi- cient
PF DB DBs excluding EBRD, WB WBcoeffi- cient
coeffi- cient
coeffi- cient
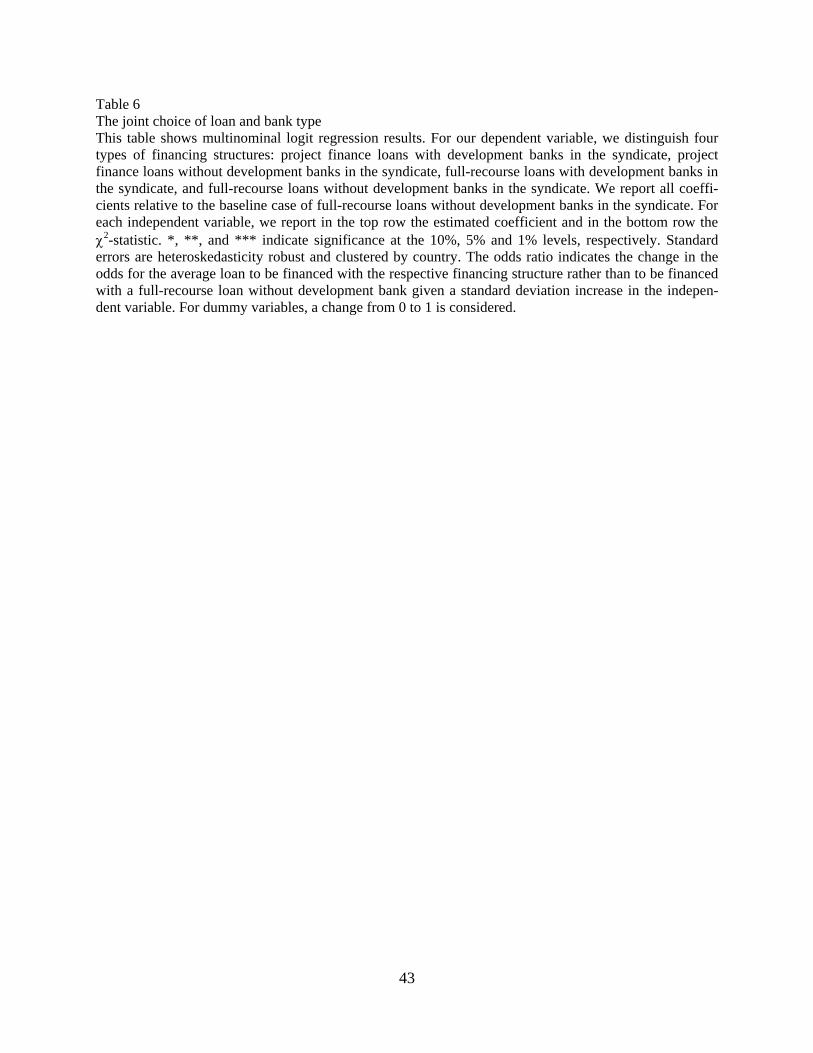
43
Table 6 The joint choice of loan and bank type This table shows multinominal logit regression results. For our dependent variable, we distinguish four types of financing structures: project finance loans with development banks in the syndicate, project finance loans without development banks in the syndicate, full-recourse loans with development banks in the syndicate, and full-recourse loans without development banks in the syndicate. We report all coeffi-cients relative to the baseline case of full-recourse loans without development banks in the syndicate. For each independent variable, we report in the top row the estimated coefficient and in the bottom row the χ2-statistic. *, **, and *** indicate significance at the 10%, 5% and 1% levels, respectively. Standard errors are heteroskedasticity robust and clustered by country. The odds ratio indicates the change in the odds for the average loan to be financed with the respective financing structure rather than to be financed with a full-recourse loan without development bank given a standard deviation increase in the indepen-dent variable. For dummy variables, a change from 0 to 1 is considered.

44
Table 6 continued
marginal effect
odds ratio
marginal effect
odds ratio
marginal effect
odds ratio
intercept -5.85 *** -4.20 *** -6.14 ***-4.20 -3.32 -5.51
country characteristics political risk 0.76 *** 0.0056 2.03 0.51 ** 0.0894 1.61 0.86 *** 0.0254 2.22
2.58 3.09 4.09 corporate governance -0.15 -0.0012 0.70 -0.08 -0.0154 0.84 0.13 0.0053 1.35
-1.38 -0.93 1.47 creditor rights 0.10 0.0005 1.32 0.14 *** 0.0246 1.50 0.17 *** 0.0047 1.66
1.59 3.18 3.19 time to resolve insolvency 0.01 0.0002 1.02 -0.05 -0.0088 0.90 -0.09 -0.0027 0.82
0.10 -0.92 -1.33 economic performance 0.00 -0.0002 0.99 0.08 0.0151 1.14 -0.01 -0.0010 0.99
-0.03 0.77 -0.09 banking market development -0.01 ** -0.0001 0.52 -0.01 ** -0.0009 0.72 -0.02 *** -0.0006 0.36
-2.51 -2.07 -3.79 private credit bureau coverage -0.01 -0.0001 0.87 0.00 0.0004 1.02 -0.01 -0.0003 0.90
-0.59 0.21 -0.55 annual loan growth -0.37 -0.0063 0.95 1.25 ** 0.2501 1.20 -0.75 -0.0391 0.90
-0.50 2.19 -1.18 French legal origin 0.52 0.0048 1.67 -0.10 -0.0344 0.90 1.20 ** 0.0510 3.33
0.71 -0.18 2.19 German legal origin 1.44 *** 0.0180 4.22 -0.16 -0.0761 0.86 2.27 *** 0.1648 9.69
2.90 -0.37 5.02 Scandinavian legal origin -37.44 *** -0.0194 0.00 0.25 0.0040 1.29 1.94 ** 0.1604 6.98
-34.17 0.36 2.39investment characteristics ln(investment size) 0.30 ** 0.0025 1.49 0.08 0.0119 1.12 0.36 *** 0.0119 1.61
2.30 1.06 4.17 investment life 0.34 *** 0.0025 6.38 0.24 *** 0.0431 3.62 0.20 *** 0.0047 2.95
8.76 7.03 6.36 investment risk 1.67 ** 0.0130 1.22 1.05 ** 0.1994 1.14 0.09 -0.0079 1.01
2.37 2.41 0.14industry dummies mining 0.46 0.0009 1.59 1.04 *** 0.2376 2.83 -0.40 -0.0210 0.67
1.38 3.92 -0.79 transportation & utilities -0.13 -0.0020 0.88 0.30 0.0552 1.34 0.33 0.0092 1.39
-0.27 1.07 0.97 construction 2.02 *** 0.0118 7.56 2.30 *** 0.4980 9.94 0.58 -0.0165 1.79
4.10 8.18 1.39 other -1.45 *** -0.0098 0.24 0.03 0.0133 1.03 -0.60 -0.0185 0.55
-2.70 0.09 -1.25
number of observations 4,978log likelihood -3,586.3pseudo R2 0.445sample probability 5.0% 26.1% 5.9%predicted probability 1.0% 26.4% 3.7%
project finance loan with development bank
project finance loan without development bank
full-recourse loan with development bank
coeffi- cient
coeffi- cient
coeffi- cient

45
Figure 1 The joint choice of project finance and development bank participation at different levels of political risk This figure shows the coefficient of political risk from the multinominal logit model estimated in Table 6 at different levels of political risk. The four financing choices that are modeled are project finance with development banks (PF with DB), project finance without development banks (PF w/o DB), full-recourse loan with development bank (FR with DB), and full-recourse loan without development bank (FR w/o DB). The x-axis shows the level of political risk, with higher numbers indicating higher risk. The y-axis shows the summed probability of the financ-ing choices being used.
0.1
.2.3
.4.5
.6.7
.8.9
1S
umm
ed p
roba
bilit
y
0 2 4 6 8 10political risk
PF with DB PF w/o DBFR with DB FR w/o DB

46
Figure 2 The joint choice of project finance and development bank participation at different levels of in-vestment-related and general political risk This figure shows the coefficient of political risk from the multinominal logit model estimated in Table A1 at different levels of investment- related and general political risk. The four financing choices that are modeled are project finance with development banks (PF with DB), project finance without development banks (PF w/o DB), full-recourse loan with development bank (FR with DB), and full-recourse loan without development bank (FR w/o DB). The x-axis shows the level of political risk, with higher numbers indicating higher risk. The y-axis shows the summed probability of the financing choices being used.
Panel A: Investment-related political risk
0.1
.2.3
.4.5
.6.7
.8.9
1S
umm
ed p
roba
bilit
y
0 2 4 6 8 10Political risk: investment-related
PF with DB PF w/o DBFR with DB FR w/o DB
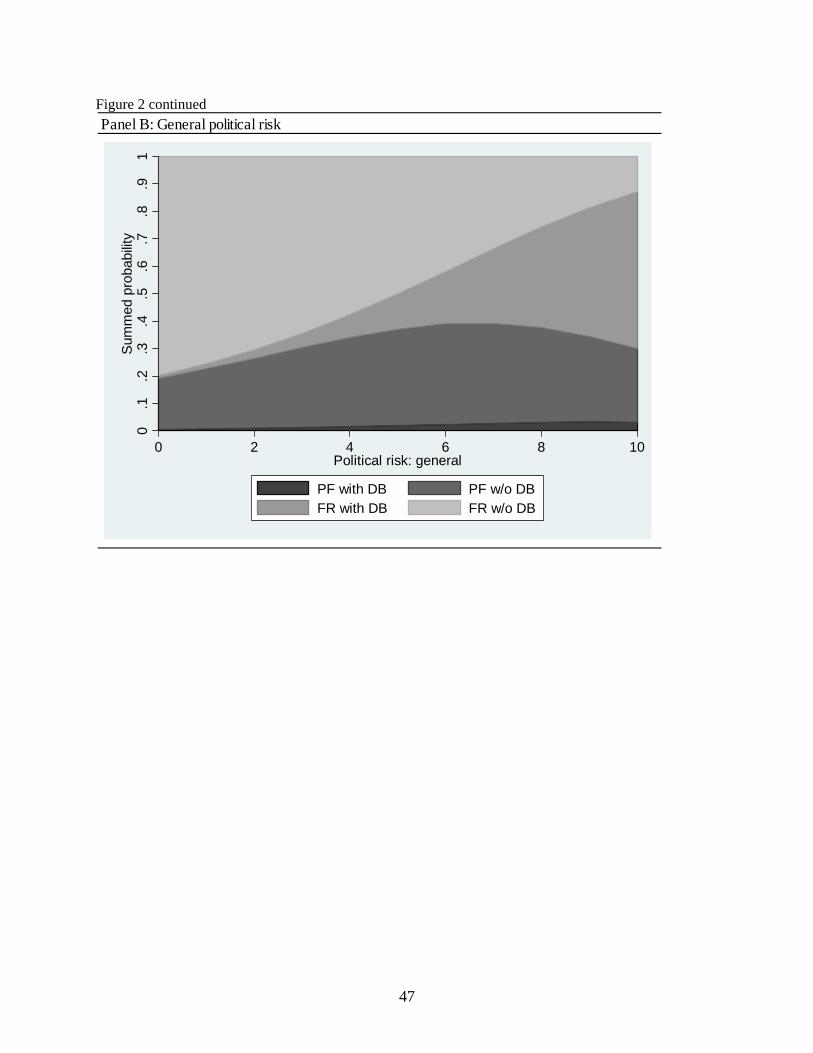
47
Figure 2 continued
Panel B: General political risk0
.1.2
.3.4
.5.6
.7.8
.91
Sum
med
pro
babi
lity
0 2 4 6 8 10Political risk: general
PF with DB PF w/o DBFR with DB FR w/o DB

48
Appendix - Table A1 The joint choice of loan and bank type for different types of political risk See notes to Tables 5 and 6.
marginal effect
odds ratio
marginal effect
odds ratio
marginal effect
odds ratio
intercept -5.19 *** -3.81 *** -5.79 ***-3.70 -2.84 -5.17
country characteristics political risk: investment-related 0.27 *** 0.0022 1.60 0.21 ** 0.0375 1.44 0.23 ** 0.0059 1.48
2.57 2.22 2.36 political risk: general 0.36 0.0030 1.39 0.22 0.0362 1.23 0.57 *** 0.0182 1.70
1.36 1.14 2.69 corporate governance -0.12 -0.0012 0.74 -0.05 -0.0110 0.88 0.14 0.0054 1.38
-1.27 -0.66 1.60 creditor rights 0.09 * 0.0005 1.32 0.14 *** 0.0253 1.52 0.17 *** 0.0047 1.66
1.65 3.20 3.33 time to resolve insolvency -0.01 0.0001 0.99 -0.06 -0.0110 0.87 -0.10 -0.0028 0.81
-0.10 -1.17 -1.51 economic performance -0.10 -0.0010 0.85 0.00 0.0010 1.00 -0.06 -0.0021 0.90
-0.59 0.01 -0.83 banking market development -0.01 ** -0.0001 0.54 -0.01 * -0.0007 0.76 -0.02 *** -0.0005 0.37
-2.13 -1.78 -3.68 private credit bureau coverage -0.01 -0.0001 0.84 0.00 0.0001 1.00 -0.01 -0.0003 0.89
-0.78 -0.02 -0.68 annual loan growth -0.35 -0.0068 0.95 1.20 ** 0.2416 1.19 -0.80 -0.0402 0.89
-0.49 2.00 -1.16 French legal origin 0.75 0.0075 2.12 0.14 0.0094 1.15 1.34 ** 0.0542 3.83
1.07 0.25 2.56 German legal origin 1.43 *** 0.0203 4.17 -0.14 -0.0734 0.87 2.25 *** 0.1608 9.48
3.11 -0.33 5.27 Scandinavian legal origin -30.45 *** -0.0194 0.00 0.31 0.0179 1.37 1.90 ** 0.1500 6.66
-29.47 0.46 2.34investment characteristics ln(investment size) 0.31 ** 0.0029 1.51 0.09 0.0133 1.13 0.38 *** 0.0124 1.65
2.38 1.17 4.30 investment life 0.34 *** 0.0029 6.50 0.24 *** 0.0436 3.69 0.20 *** 0.0047 2.99
8.72 7.07 6.51 investment risk 1.46 ** 0.0132 1.19 0.87 * 0.1643 1.11 -0.04 -0.0104 1.00
2.08 1.91 -0.06industry dummies mining 0.41 0.0007 1.51 1.00 *** 0.2277 2.71 -0.43 -0.0211 0.65
1.26 3.85 -0.85 transportation & utilities -0.19 -0.0028 0.83 0.25 0.0465 1.28 0.30 0.0085 1.35
-0.40 0.90 0.88 construction 2.02 *** 0.0134 7.53 2.29 *** 0.4946 9.87 0.60 -0.0161 1.82
4.12 8.16 1.41 other -1.39 *** -0.0109 0.25 0.07 0.0213 1.07 -0.56 -0.0176 0.57
-2.60 0.21 -1.18
number of observations 4,978log likelihood -3,572.5pseudo R2 0.449sample probability 5.0% 26.1% 5.9%predicted probability 1.1% 26.4% 3.7%
project finance loan with development bank
project finance loan without development bank
full-recourse loan with development bank
coeffi- cient
coeffi- cient
coeffi- cient