political reality checks - rbc wealth management
TRANSCRIPT
August 2020
For important and required non-U.S. analyst disclosures, see page 23.Produced: Aug 5, 2020 12:12ET; Disseminated: Aug 5, 2020 15:30ET
Global equityA long and winding road
Global fixed incomeChange of pace
Political reality checksOur overview of plausible U.S. election outcomes highlights the checks and balances that could limit the impact of politics on financial markets.
Bogdanova & Allworth | Page 4
Investment and insurance products offered through RBC Wealth Management are not insured by the FDIC or any other federal government agency, are not deposits or other obligations of, or guaranteed by, a bank or any bank affiliate, and are subject to investment risks, including possible loss of the principal amount invested.
Focus articleHow good is gold?
Key forecasts

2 Global Insight | August 2020
Table of contents4 Political reality checksAs the U.S. elections approach, we look at how the candidates’ policy prescriptions
could play out under the most plausible election outcome scenarios, and highlight the
checks and balances that could limit the impact of politics on financial markets.
13 How good is gold?The price of gold has reached new highs against a backdrop of investor uncertainty,
market volatility, and central bank stimulus. What are its prospects for the rest of the
year and beyond, and how might it be impacted by monetary and fiscal policy?
17 Global equity: A long and winding roadWe have pushed back the timing for full economic recovery by major economies, and
would not rule out some GDP potholes along the way. But we believe the recovery is
happening, with Europe’s pandemic response particularly encouraging.
18 Global fixed income: Change of paceThe Jackson Hole Economic Symposium has been replaced, but questions regarding
policy strategy remain. We expect inflation to be a focus at the new event.
Inside the markets 3 RBC’s investment stance
17 Global equity
18 Global fixed income
20 Key forecasts
21 Market scorecard
All values in U.S. dollars and priced as of market close, July 31, 2020, unless otherwise stated.
Global Insight August 2020

3 Global Insight | August 2020
Views explanation (+/=/–) represents the Global Portfolio Advisory Committee’s (GPAC) view over a 12-month investment time horizon.
+ Overweight implies the potential for better-than-average performance for the asset class or for the region relative to other asset classes or regions.
= Market Weight implies the potential for average performance for the asset class or for the region relative to other asset classes or regions.
– Underweight implies the potential for below-average performance for the asset class or for the region relative to other asset classes or regions.
Global asset views
Source - RBC Wealth Management
Asset Class
View
— = +Equities
Fixed Income
See “Views explanation” below for details
Expect below- average
performance
Expect above-average performance
RBC’s investment stanceEquities • Equity markets have continued to climb as economies have started to rebound with
the help of unprecedented monetary and fiscal stimulus. But the question of how long
it will be before the long-term potential economic/earnings growth rate is back in
gear remains unanswered. The path toward economic recovery seems the smoothest
in China and has improved in the European Union due to a recent landmark fiscal
agreement, but our expectation for a return to pre-pandemic levels has been pushed
out somewhat for the U.S. (to mid-2022 from late 2021).
• Some GDP backsliding along the way is not out of the question. Markets usually
navigate through such periods reasonably well, but like the recovery itself, the
market’s progress is likely to be uneven. We would hold overall equity exposure in
portfolios modestly below the benchmark target weight.
Fixed income • The Fed’s pledge to maintain rates at 0% for years to come, and market expectations
for further monetary stimulus measures to be announced at the September meeting,
are pushing Treasury yields across many parts of the curve to new record lows. We
expect a prolonged period of low rates and would position to lock in current yields
and coupons. Though risks remain, current market valuations still offer attractive risk/
reward profiles in certain fixed income sectors, specifically in corporate credit.
• We maintain our Market Weight in global fixed income. Global demand for assets
seen as safe remains robust and with markets already priced for a short, but steep,
recession, we maintain a broad Overweight to corporate credit.
Global asset class view

4 Global Insight | August 2020
Focus article
Political reality checksAs the U.S. prepares to go to the polls amid a global pandemic and economic recession, we look at how the candidates’ policy prescriptions could play out under the most plausible election outcome scenarios. Despite strong sentiments across the political spectrum, we argue that the American system includes robust guardrails that limit the ability of any individual, or political party, to impose sweeping change.
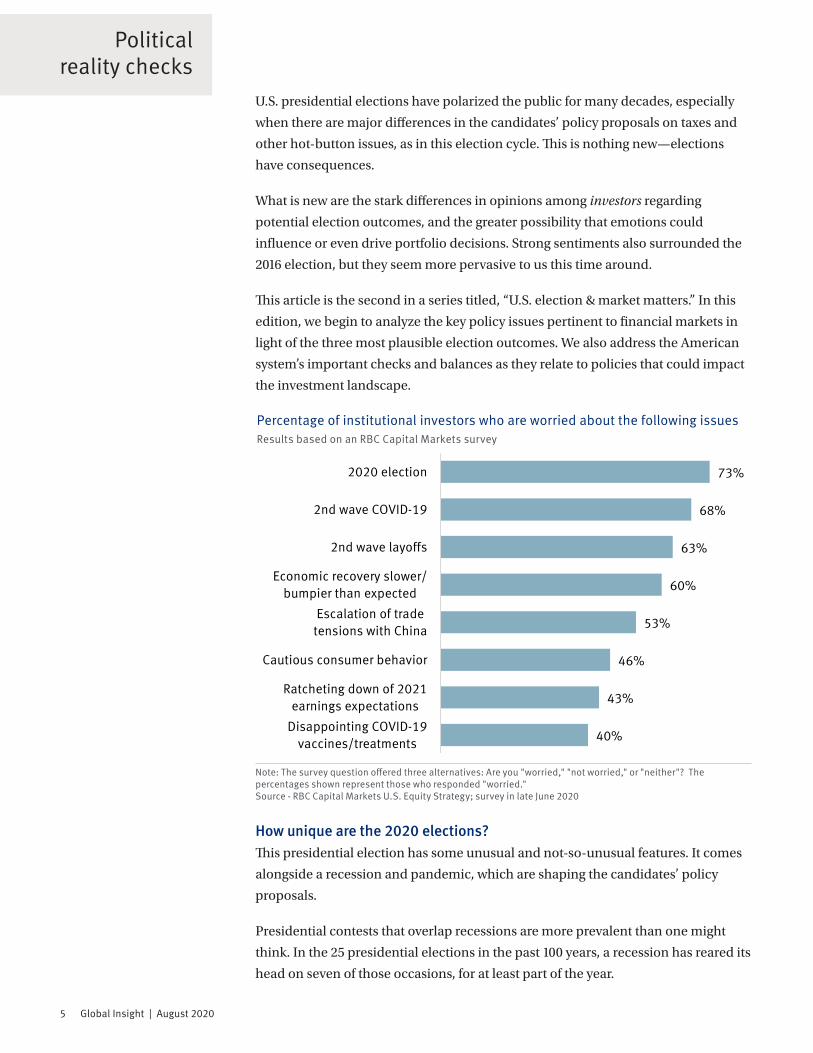
• Institutional investors are more concerned about the 2020 elections than any
other issue, according to an RBC Capital Markets' survey.
• Recessions have been unkind to incumbent political parties. Party control of
the White House changed in five of the last seven presidential contests that
overlapped a recession.
• We think there are three plausible election outcomes for investors to focus
on: The status quo with Trump and a divided Congress; Biden and a divided
Congress; and a “blue wave” with the Democrats controlling the presidency and
both chambers of Congress. These scenarios could impact the economy, markets,
industries, and tax structure somewhat differently.
• A blue wave scenario that also includes the removal of the filibuster rule could be
the most challenging for the equity market.
• But would it mean gloom and doom? While it could usher in some volatility or
even a selloff, we doubt it would be long lasting because the American system’s
formal and informal checks and balances act as guardrails, mitigating sweeping
policy outcomes.
• An overlooked guardrail is the business lobby. We would not underestimate its
power and creativity. We think business interests (which overlap many investor
interests) would still have a prominent seat at the table, regardless of the election
outcome.
Election angst, and then some It is safe to say opinions and emotions about the U.S. elections are running hot.
The angst seems to be spilling over into the investment sphere, with people
across the political spectrum concerned that various election outcomes could be
detrimental to financial markets—or worse.
Jim AllworthVancouver, Canada
Kelly BogdanovaSan Francisco, United States
5 Global Insight | August 2020
U.S. presidential elections have polarized the public for many decades, especially
when there are major differences in the candidates’ policy proposals on taxes and
other hot-button issues, as in this election cycle. This is nothing new—elections
have consequences.
What is new are the stark differences in opinions among investors regarding
potential election outcomes, and the greater possibility that emotions could
influence or even drive portfolio decisions. Strong sentiments also surrounded the
2016 election, but they seem more pervasive to us this time around.
This article is the second in a series titled, “U.S. election & market matters.” In this
edition, we begin to analyze the key policy issues pertinent to financial markets in
light of the three most plausible election outcomes. We also address the American
system’s important checks and balances as they relate to policies that could impact
the investment landscape.
How unique are the 2020 elections?This presidential election has some unusual and not-so-unusual features. It comes
alongside a recession and pandemic, which are shaping the candidates’ policy
proposals.
Presidential contests that overlap recessions are more prevalent than one might
think. In the 25 presidential elections in the past 100 years, a recession has reared its
head on seven of those occasions, for at least part of the year.
Political reality checks
40%
43%
46%
53%
60%
63%
68%
73%
Disappointing COVID-19vaccines/treatments
Ratcheting down of 2021earnings expectations
Cautious consumer behavior
Escalation of tradetensions with China
Economic recovery slower/bumpier than expected
2nd wave layoffs
2nd wave COVID-19
2020 election
Percentage of institutional investors who are worried about the following issuesResults based on an RBC Capital Markets survey
Note: The survey question offered three alternatives: Are you "worried," "not worried," or "neither"? The percentages shown represent those who responded "worried." Source - RBC Capital Markets U.S. Equity Strategy; survey in late June 2020

6 Global Insight | August 2020
American elections have often been referendums on the economy, and this may
be why recessions have been unkind to incumbent political parties. Since 1920,
the incumbent party lost the White House in five of the seven instances when
a recession was ongoing during the election year, most recently amid the Great
Recession in 2008.
To understand the potential effects of the unusual COVID-19 pandemic, one
historical precedent offers the best analogy: the so-called Spanish flu, a global
pandemic that began in early 1918 and lasted into the spring of 1920. It’s difficult to
gauge that pandemic’s impact as there were other economic crosscurrents at the
time and it overlapped World War I. But it’s worth noting that the U.S. succumbed
to a recession toward the tail end of the flu pandemic in January 1920, and the
recession lasted into the next year. The incumbent Democratic Party lost the White
House in 1920.
None of these data points are enough to base current investment decisions on. They
are too few in number to be statistically significant, and each episode had unique
contours. But the recession track record is something to keep in mind.
Elections scenarios & key issues that are in playWe think there are three plausible election outcomes for investors to focus on,
each of which could impact the economy, markets, industries, and tax structure
somewhat differently.
Status quo – Trump and a divided Congress: President Donald Trump is re-elected, and the balance of power in Congress
stays the same with Democrats in control of the House of Representatives and
Republicans leading the Senate by a slim margin.
• Key initiatives: Thus far, Trump’s re-election pitch is similar to the one he ran
on in 2016 and the policies he has governed on since. He would focus on growing
the economy and creating jobs; further deregulating the business landscape;
restraining immigration and continuing border wall construction; seeking to
pass an infrastructure bill; inking more bilateral rather than multilateral trade
deals within an overarching light-protectionist trade policy framework; limiting
companies based in rival countries from interacting in key global industries
through economic sanctions; and challenging China.
• More heat on China: Trump has been more aggressive with China following the
bilateral trade deal in late 2019 and since the onset of the COVID-19 pandemic.
While some observers see this merely as a convenient election-year tactic,
aggressive stances have also been taken recently by the secretary of state,
national security advisor, Pentagon leaders, attorney general, FBI director, and
some Republican senators. In our view, their collective speeches, policy papers,
Political reality checks

7 Global Insight | August 2020
Political reality checks
and actions go well beyond election year rhetoric. They seem to be laying the
foundation for Republican Party policy—at the very least.
We think a second Trump administration would once again attempt to exert
pressure on China through its economic policies and sanctions, as well as by
seeking to influence Chinese domestic issues via geopolitical and strategic
initiatives. We see no evidence to suggest China would bend to U.S. pressure; in
fact, the country’s leadership is already pushing back methodically and calmly.
In late July the CEO of the Atlantic Council, a NATO think tank, told CNBC
regarding the rivalry, “Well, I think this is going to be decided in decades and not
in presidential terms.”
If the U.S.-China confrontations intensify, the conflict could create volatility
for equity markets at times. If the showdown between these two economic
powerhouses threatens to constrain global commerce on an ongoing basis, a
“Cold War 2.0” risk premium may ultimately get factored into equity valuations.
• Tax cuts likely to stay, but … Trump continues to tout the sweeping corporate
and individual tax cuts passed in 2017, strongly implying he would not seek to
unwind them in a second term. Most of the tax cuts on individuals are scheduled
to stay in place through at least 2025, when they begin to sunset by law (new
legislation would need to be passed to renew them); the corporate tax cuts are
“permanent” unless they are reversed by new legislation. We think keeping tax
rates low, especially surrounding the deep COVID-19 recession, would help
support U.S. economic growth as well as the equity and corporate bond markets.
$21.34 $21.34
$14.22
$27.30
Nominal GDP Purchasing Power Parity GDP*
U.S. China
The U.S.-China rivalry is partly fueled by economic competition: The U.S. is larger based on nominal GDP, but not by PPP GDP2019 GDP comparison in trillions of U.S. dollars
* GDP measured by Purchasing Power Parity (PPP) is calculated according to a "basket of goods" method, which attempts to take into account exchange rates, economic productivity, and standard of living. This method can provide more of an apples-to-apples comparison of different economies. Source - RBC Wealth Management, International Monetary Fund's World Economic Outlook database, Investopedia
8 Global Insight | August 2020
Political reality checks
On the flip side, however, sky-high annual deficits and rising federal debt as a
percentage of GDP likely would be negative over the longer term—even if the
economy were to grow somewhat faster with the assistance of lower tax rates than
without.
Also, the high deficit and debt remind us of a similar, but less acute episode. After
former President Ronald Reagan and Congress cut taxes aggressively in 1981—a
modern analog of the Trump tax cuts—major battles ensued on the budget due
to surging deficits (to which high spending on defense and social services also
contributed). In 1986, in a new tax “reform” bill, Reagan and Congress cut tax
rates on individuals and expanded tax credits and exemptions, while at the same
time hitting investors with higher capital gains and alternative minimum taxes
and eliminating a number of important tax deductions and shelters. The Trump
administration has floated the idea of a second round of tax cuts, but so far does
not seem to be contemplating a 1986-style about-face that would raise investor
taxes to offset the new cuts. We can’t completely rule this out, however, with
the deficit and debt so high and the federal government’s mounting obligations
(Social Security, Medicare, and Medicaid).
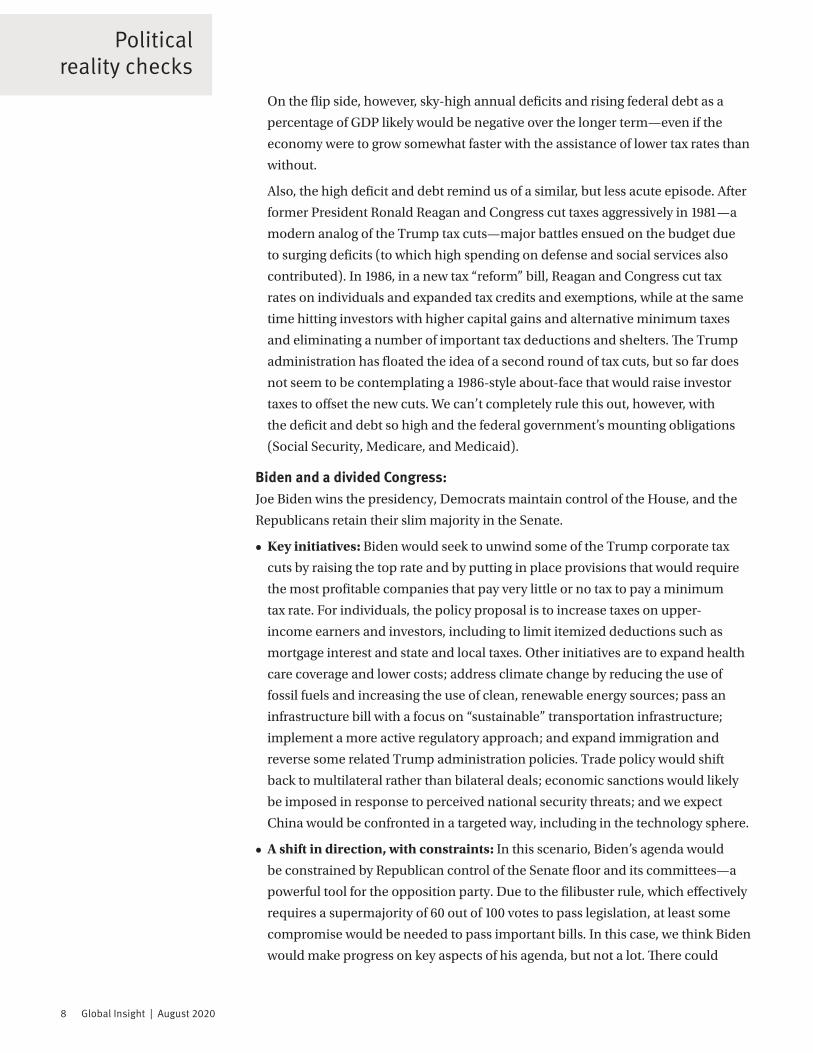
Biden and a divided Congress: Joe Biden wins the presidency, Democrats maintain control of the House, and the
Republicans retain their slim majority in the Senate.
• Key initiatives: Biden would seek to unwind some of the Trump corporate tax
cuts by raising the top rate and by putting in place provisions that would require
the most profitable companies that pay very little or no tax to pay a minimum
tax rate. For individuals, the policy proposal is to increase taxes on upper-
income earners and investors, including to limit itemized deductions such as
mortgage interest and state and local taxes. Other initiatives are to expand health
care coverage and lower costs; address climate change by reducing the use of
fossil fuels and increasing the use of clean, renewable energy sources; pass an
infrastructure bill with a focus on “sustainable” transportation infrastructure;
implement a more active regulatory approach; and expand immigration and
reverse some related Trump administration policies. Trade policy would shift
back to multilateral rather than bilateral deals; economic sanctions would likely
be imposed in response to perceived national security threats; and we expect
China would be confronted in a targeted way, including in the technology sphere.
• A shift in direction, with constraints: In this scenario, Biden’s agenda would
be constrained by Republican control of the Senate floor and its committees—a
powerful tool for the opposition party. Due to the filibuster rule, which effectively
requires a supermajority of 60 out of 100 votes to pass legislation, at least some
compromise would be needed to pass important bills. In this case, we think Biden
would make progress on key aspects of his agenda, but not a lot. There could
9 Global Insight | August 2020
Political reality checks
be some tinkering with the tax code, although we would not expect big changes
initially.
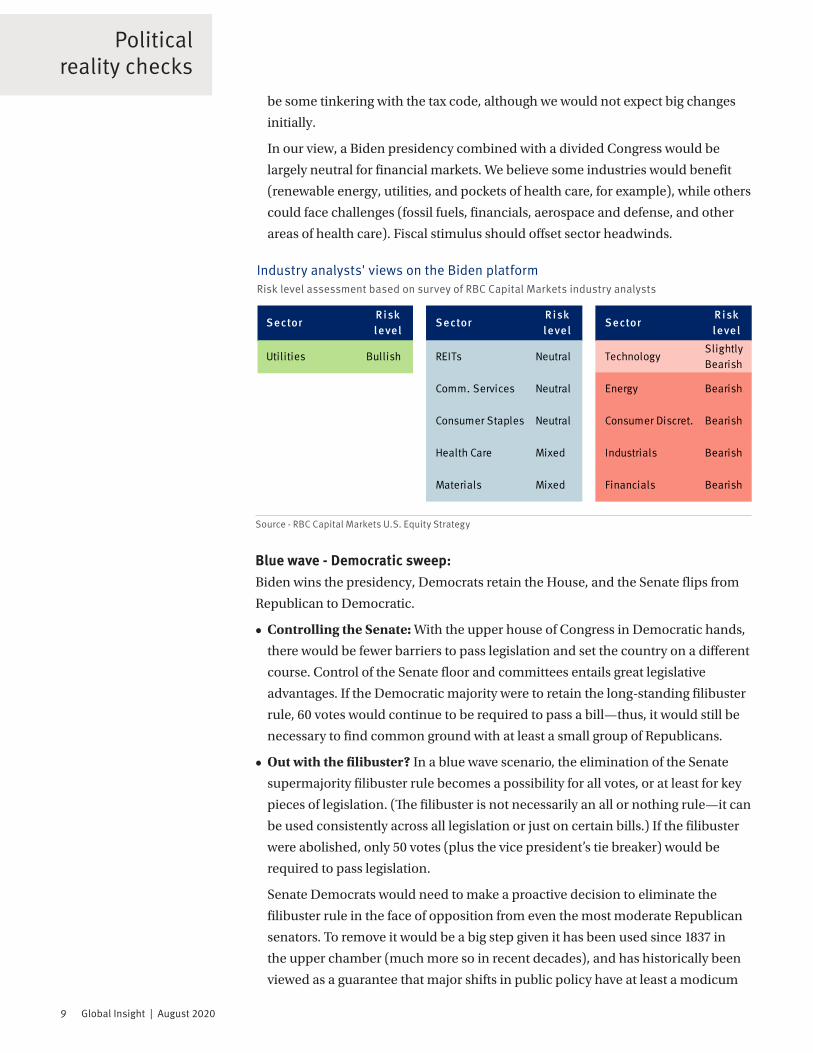
In our view, a Biden presidency combined with a divided Congress would be
largely neutral for financial markets. We believe some industries would benefit
(renewable energy, utilities, and pockets of health care, for example), while others
could face challenges (fossil fuels, financials, aerospace and defense, and other
areas of health care). Fiscal stimulus should offset sector headwinds.
Blue wave - Democratic sweep: Biden wins the presidency, Democrats retain the House, and the Senate flips from
Republican to Democratic.
• Controlling the Senate: With the upper house of Congress in Democratic hands,
there would be fewer barriers to pass legislation and set the country on a different
course. Control of the Senate floor and committees entails great legislative
advantages. If the Democratic majority were to retain the long-standing filibuster
rule, 60 votes would continue to be required to pass a bill—thus, it would still be
necessary to find common ground with at least a small group of Republicans.
• Out with the filibuster? In a blue wave scenario, the elimination of the Senate
supermajority filibuster rule becomes a possibility for all votes, or at least for key
pieces of legislation. (The filibuster is not necessarily an all or nothing rule—it can
be used consistently across all legislation or just on certain bills.) If the filibuster
were abolished, only 50 votes (plus the vice president’s tie breaker) would be
required to pass legislation.
Senate Democrats would need to make a proactive decision to eliminate the
filibuster rule in the face of opposition from even the most moderate Republican
senators. To remove it would be a big step given it has been used since 1837 in
the upper chamber (much more so in recent decades), and has historically been
viewed as a guarantee that major shifts in public policy have at least a modicum
SectorRisk level
SectorRisk level
SectorRisk level
Utilities Bullish REITs Neutral TechnologySlightly Bearish
Comm. Services Neutral Energy Bearish
Consumer Staples Neutral Consumer Discret. Bearish
Health Care Mixed Industrials Bearish
Materials Mixed Financials Bearish
Industry analysts' views on the Biden platformRisk level assessment based on survey of RBC Capital Markets industry analysts
Source - RBC Capital Markets U.S. Equity Strategy

10 Global Insight | August 2020
Political reality checks
of bipartisanship. Such a change could sow discord in the Senate for years to
come, and invite retaliation should Republicans regain control of the chamber
in the future. For these reasons, eliminating the filibuster is not a fait accompli.
But both parties are already using it as a weapon in their campaign rhetoric, and
the push for its removal gained traction recently when former President Barack
Obama endorsed ending the practice.
Without the filibuster, a blue wave could be more challenging for the equity
market as we think it would generate greater concern about tax policy for upper-
income earners and investors. It would also likely impact corporate earnings.
Based on RBC Capital Markets' polling of its industry analysts and institutional
investors, the blue wave/no filibuster scenario is the most bearish for the equity
market and select industries.
For example, if half of the Trump corporate tax cuts were reversed and the top rate
raised—as Biden seeks to do—S&P 500 profits could be about 5.5 to 9.0 percent
lower during the first year of implementation, according to estimates from our
national research correspondent and RBC Capital Markets. Furthermore, the
industries and sectors that would be most at risk of major regulatory and/or
legislative changes in a blue wave scenario could face more pressure if the filibuster
were removed. All of this could add to market volatility and downside risk.
Checks and balancesWould a blue wave with no filibuster necessarily mean gloom and doom for the U.S.
economy and stock market? While it could usher in some volatility or even a selloff,
we doubt it would be long lasting for reasons even beyond the fact that high fiscal
spending could partly offset some of the potential economic pressure.
$163
$125
$148-$154$163
2019actual EPS
2020consensus EPS
2021if corporatetax hikes*
2021if no corporate
tax hikes
Earnings would take a hit if corporate taxes are raisedS&P 500 annual earnings per share (EPS)
* Represents the percentage loss (5.5% to 9%) during the first year of higher corporate tax rates compared to if rates are not raised. Note: 2021 estimates are based on the consensus forecasts Source - RBC Wealth Management, RBC Capital Markets, national research correspondent, Refinitiv I/B/E/S

11 Global Insight | August 2020
Political reality checks
Under all three likely party control scenarios, the American system’s formal
government checks and balances can act as guardrails. The separation of powers
into three co-equal branches (executive, legislative, and judicial) restrains the
ability of a particular president or Congress to take the country in a drastically
different direction in one fell swoop—regardless of how candidates and political
parties promise that they can in nearly every campaign season.
In the past, the checks and balances have worked to varying degrees, depending
on the historical circumstances. We acknowledge they are not foolproof; if a
Democratic blue wave were accompanied by the removal of the filibuster rule, then
the legislative guardrails would be lower. In that case, however, other unofficial
checks and balances would still remain that investors should take into account.
A powerful—and often overlooked—guardrail is the collective voice of business
interests. We’ve yet to witness a legislative cycle where business groups didn’t
achieve at least some of their lobbying objectives, often to the benefit of investors.
In the last few presidential cycles, for example, controversial initiatives such as
Trump’s trade deal with China and Obama’s Affordable Care Act were greatly
influenced by negotiations with the corporate sector. There were times when both
agreements generated enough volatility to test the nerves of investors, but in the
end compromises were struck to the satisfaction of multiple parties.
We would not underestimate the power and creativity of the business lobby. Should
the Senate remove the filibuster, we think business interests (which overlap many
investor interests) would still have a prominent seat at the table.
The Federal Reserve and the natural ebb and flow of the economic cycle are also
“checks” on government power, and we think they actually influence financial
markets more than the president or Congress. In a previous article, we explained
why these forces are so relevant. The re-election or defeat of Donald Trump, and
the continuation of the status quo in Congress or its realignment by a blue wave, are
outcomes that will have comparatively little impact next to the outsized roles that
the Fed and economic cycle play.
Bigger than the Oval OfficeWe have a hard time believing the slow-moving supertanker that is the U.S.
federal government will suddenly start veering like a speedboat following the 2020
elections, regardless of the outcome. The checks and balances embedded in the
American system—both formal and informal—mitigate far-reaching, sweeping
policy outcomes.
These are among the practical reasons we think the most acute partisan fears about
various election outcomes are unlikely to be realized. The U.S. economic system is

12 Global Insight | August 2020
Political reality checks
bigger than the presidency and those who control the levers of power on Capitol
Hill.
There are certainly risks for financial markets associated with the 2020 elections.
We think it prudent to remain at least moderately Underweight U.S. equities
in portfolios, by positioning holdings somewhat below the long-term strategic
allocation.
In this article we have touched on the broad electoral issues that could impact
markets. In future editions of our “U.S. election & market matters” series, we
will address some of these issues in depth, such as Biden’s tax proposal, both
candidates’ trade policies, their economic policy differences, and the risks and
opportunities for key sectors and industries.
2020 election checklist: A summary of key issues
Source - RBC Wealth Management
Tax rate uncertainty
2017 tax cuts likely to stay in place under Trump. Biden would unwind some by raising taxes on upper-income individuals and investors, and on corporations.
Filibuster or not?In a Democratic blue wave, the removal of the Senate filibuster rule is a risk for the equity market, but not a fait accompli. Also, there are other checks and balances.
“Big business” will still flex its muscles
In any reasonable election scenario, the business lobby will have a seat at the table. Don’t underestimate its power and creativity, which can benefit investors.
Major shift for energy policy?
Trump would continue to promote fossil fuels (oil and natural gas), while Biden would shift away from them and toward renewables. Climate change funding and regulatory changes under Biden.
Infrastructure unites
An infrastructure bill is a goal under any outcome, but would likely be “greener” under Biden.
China in focusU.S. policy toward China would be confrontational in any outcome, but more aggressive, combative, and comprehensive under Trump. The latter could create periodic market volatility.
Trade deals and sanctions in different flavors
Bilateral deals with countries and large entities under Trump, with a dash of light protectionism and a heavy dose of sanctions. Multilateral deals under Biden, and a willingness to use targeted sanctions against so-called adversaries.

13 Global Insight | August 2020
Focus article
How good is gold?Volatility, inflation, and the outlook for gold prices
Against a backdrop of investor uncertainty, market volatility, and central bank stimulus, the price of gold has reached new heights in 2020. RBC Capital Markets, LLC Commodity Strategist Christopher Louney discusses gold’s prospects in the second half of the year and beyond, and the precious metal’s relationship to macro trends.
• We believe investor uncertainty is the key factor driving record increases in gold
holdings so far in 2020.
• While consumer demand for gold has declined in important demand centers like
China and India, investor demand has continued to support gold prices.
• The shape of the economic recovery from the COVID-19 pandemic will play an
important role in determining future gold prices.
Global Insight's Richard Tan: Many rationales have been put forward to account for the strong rise in gold prices in 2020. Do you see one overarching factor?
Christopher Louney: We believe gold’s price action this year has largely been
about uncertainty. Other macro factors—including low or negative interest rates,
which are keeping gold elevated—are playing important roles, but a number of the
biggest headline issues driving new and growing allocations to gold boil down to
uncertainty. Volatility in equity markets, despite buoyant valuations in a number
of areas, has come with inherent uncertainty. The prospects for economic recovery
and the COVID-19 pandemic itself are almost certainly a key factor in investors’
appreciation of gold too. This, in our view, is the main reason gold exchange-traded-
product (ETP) holdings have risen by record volumes this year. It is uncertainty that
has brought investors to the gold space in great numbers this year, and it is likely
what is going to keep them there.
What about demand for gold in the real economy—for example, in jewelry? Have higher prices weakened that demand?
Data for early 2020 revealed a massive decline in most components of physical
demand for gold. In the largest consumer markets, China and India, we saw year-
over-year (y/y) declines of 46 percent and 17 percent, respectively, in consumer
demand in the first quarter. Jewelry demand alone fell 39 percent y/y on a global
basis, and industrial demand (admittedly, a much smaller component) did not fare
As a lead analyst on RBC Capital Markets’ Global Commodity Strategy team, Christopher
Louney is responsible for metals and energy coverage as well as
analyzing cross-commodity investor activity. He is frequently quoted in
financial news media and has been featured as a commodities expert on television networks including
CNBC, Bloomberg, and BNN.
Christopher LouneyRBC Capital Markets, LLC New York, United States
Richard Tan, CFA Toronto, Canada

14 Global Insight | August 2020
well either in Q1; nor was data for H1 overall inspiring. In a normal environment,
it would be easy to attribute most of the decline to the price-sensitive nature of
a number of consumer demand categories, and of course, that has played a role
this year. Gold has reached record highs, and because consumer demand is price-
responsive, it can be held back by worsening economic prospects and uncertainty
about income growth. That will likely remain a theme for the rest of the year.
However, when it comes to jewelry as well as retail bar and coin demand, the
closure of retail outlets and the significant friction within the retail supply chain
due to stay-at-home orders was the bigger factor as COVID-19 became a global
pandemic.
Central banks have accumulated record amounts of gold in recent years. What are your views on Russia halting gold purchases in April, and on the impact of gold demand from oil-dependent nations?
Demand from central banks had been remarkably strong for some time. Having
reached an all-time high in recent years, it appeared to be set for sustained,
elevated volumes. This sector has accounted for as much as 14 percent of demand
in recent years, so a slowdown would be significant. While we continue to expect
central bank demand to remain mostly buoyant, news that Russia was halting gold
purchases starting in April, and our own view that central banks in oil-dependent
countries may be unable to sustain large purchases given the state of oil markets,
has wiped out a share of the growth we had expected previously. While some would
argue that the current economic crisis may lead some countries to liquidate their
holdings due to their indebtedness, the reality is that gold holdings would not make
a dent in most countries’ debt levels, even if fully monetized. In that context, we still
think demand from central banks will remain relatively healthy.
How good is gold?
$1,000
$1,200
$1,400
$1,600
$1,800
$2,000
Jul-16 Jul-17 Jul-18 Jul-19 Jul-201,5001,7502,0002,2502,5002,7503,0003,2503,500
S&P 500 (RHS) Gold ($/oz, LHS)
Gold rallies alongside equitiesPrice of gold vs. S&P 500
Source - Bloomberg, RBC Capital Markets; data through 7/10/20
The performance of gold has decoupled from its historical negative correlation with the S&P 500.

15 Global Insight | August 2020
Some market participants have suggested that recent fiscal and monetary measures could result in higher inflation. Can we learn anything about gold and its correlation to inflation from the financial crisis of 2008–2009?
As was true following the last crisis, many are now wondering whether current
fiscal and monetary policies will eventually give rise to material inflation, and
thus to runaway gold prices. Many investors see gold as a hedge against inflation,
based on an assumption that its value can increase as the purchasing power of the
dollar falls. Some feared that an inflation explosion would arrive in the wake of
the 2008–2009 financial crisis and the unprecedented easy monetary policy that
followed for several years. That inflation surge never came to pass, but gold rallied
for a time anyways. In our view, something similar is unfolding now: governments
have adopted “whatever it takes” stimulus packages, central bank balance sheets
continue to expand, and the world continues to amass negative-yielding debt.
Central banks continue to pump money into the economy through strategies such
as quantitative easing, and nations continue to take on debt in order to support
their economies. Some analysts expect this level of borrowing around the world to
eventually result in material inflation. While our base scenario does not assume
such outsized inflation, that would be a factor in gold getting to our high scenario.
Bullion’s gains have pushed it toward your Q3 high-scenario price of $2,086/oz. Your low scenario would see it fall below $1,700/oz. What would it take to get us to that level, and how likely do you think that is?
We assign a probability of just 10 percent to our low scenario. The shape of the
economic recovery is the swing factor between our gold price scenarios; like the
upside risks, the downside risks also center on COVID-19 and its economic impact,
as well as the monetary and fiscal policies meant to mitigate that impact. The
current resurgence of COVID-19 in the U.S. suggests to us that our low probability
How good is gold?
$1,000
$1,200
$1,400
$1,600
$1,800
$2,000
Jul-16 Jul-17 Jul-18 Jul-19 Jul-200.0%0.5%1.0%1.5%2.0%2.5%3.0%3.5%
10-yr U.S. Treasuries (RHS) Gold ($/oz, LHS)
Gold shines as yield fadesPrice of gold vs. 10-year U.S. Treasury note yield
Source - Bloomberg, RBC Capital Markets; data through 7/10/20
The opportunity cost of owning gold diminishes in a low-real-rate environment.

16 Global Insight | August 2020
How good is gold?
assignment for our low scenario is appropriate. But we also need to ask what could
unwind gold’s year-to-date strength. For example, what if things suddenly get much
better? Although we view that outcome as unlikely, it would probably center on a
vaccine narrative, and is still something to keep in mind given the rapid changes
that are possible on that front.
What is your outlook for the back half of 2020 and into 2021?
We see a 90 percent chance of gold trading in our base/mid to high scenario range.
In our base case, gold averages $1,942/oz in Q4, but in our high scenario, we have
gold averaging over $2,400/oz in the last quarter of 2020 and over $3,000/oz in
early 2021. Currently, with gold now trading firmly above previous record prices it
is difficult to understate just how far gold has come in 2020. ETP inflows have been
setting records amid all of the uncertainty. We continue to watch the response of
states and regions facing a rise in COVID-19 cases given the economic impact of
the pandemic and its effect on gold. Risks have grown to the upside, and while the
upside is not necessarily unlimited, in our view, there are ways to build sustainably
into our high scenario. Of course, we must state clearly—at this time, we remain
confident in our base/mid to high scenario view overall.
RBC Capital Markets’ period average price scenarios for gold
A: actual; E: estimated; F: forecast. Source - Bloomberg (historical), RBC Capital Markets; as of 8/3/20
Price scenario
Assigned probability
2020 2021
Q1 A Q2 E Q3 F Q4 F Full year F Q1 F
High 40% – – $2,086 $2,440 $1,956 $3,060
Base/mid 50% $1,582 $1,714 $1,859 $1,942 $1,774 $2,012
Low 10% – – $1,644 $1,726 $1,666 $1,739
17 Global Insight | August 2020
Global equity
Jim Allworth Vancouver, Canada [email protected]
A long and winding road
all. That will be especially true in the run-
up to the U.S. elections and probably for
some considerable time after. It seems
likely investors will be confronted by a
formidable wall of worry for at least as
long as policymakers feel the need to keep
monetary and fiscal stimulus set at “high,”
which we reckon will be the case for the next
several years at least.
Markets usually navigate through such
periods reasonably well and, overall, we
believe stocks will work their way through
this one, too. However, like the recovery
itself, the market’s progress is likely to be
uneven. In our view, this is a time to put
away emotive verbs like “plunge” and “soar.”
Markets can also “advance,” “eke out gains,”
“consolidate,” “pull back,” and “correct”—all
of which are likely to feature in what we
expect will be a more workmanlike progress
higher over the next couple of years.
For global portfolios, we would keep
equity commitments modestly below the
benchmark target weight, acknowledging
that the pandemic could still throw
curveballs capable of unsettling financial
markets for some time yet. We have
recently raised Europe from Underweight
to Market Weight, prompted by the region’s
sustained management and containment
of the pandemic as well as the vigour of its
economic recovery.
At the bottom of the waterfall decline in
late March, stocks were being valued as if
the COVID-19 pandemic was going to be
followed by many years of unusually weak
economic and earnings growth. But the
strong rally from March into July has left
most markets trading at valuations that
imply the global economy will resume
growing at its long-term potential rate
once the pandemic has passed, driven
as ever by growth in global population,
productivity, and prosperity.
For our part, we think today’s valuations
and the economic and earnings outcomes
they imply are more appropriate, as they
have the weight of historical experience
behind them.
However, it’s also true that stocks at
today’s levels are less compelling than
they were at their fear-driven lows back in
March. Underscoring this, the question of
how long it will be before that long-term
potential economic/earnings growth rate
is back in gear remains unanswered.
We expect the horrible second quarter of
2020 will prove to be the low for the major
developed economies, and we believe the
recovery is underway. However, we expect
the path to regaining the lost ground will
be a long and bumpy one. We recently
revised our forecasts for how long it will
take major economies to move beyond
the previous economic cycle’s high-water
mark, which for most was the fourth
quarter of 2019. We now see most of these
economies taking until the middle of 2022
to fully recover—about half a year longer
than our previous view.
Some GDP backsliding along the way
is not out of the question. The tentative
nature of this economic advance is
likely to provoke plenty of debate about
whether the recovery is happening at
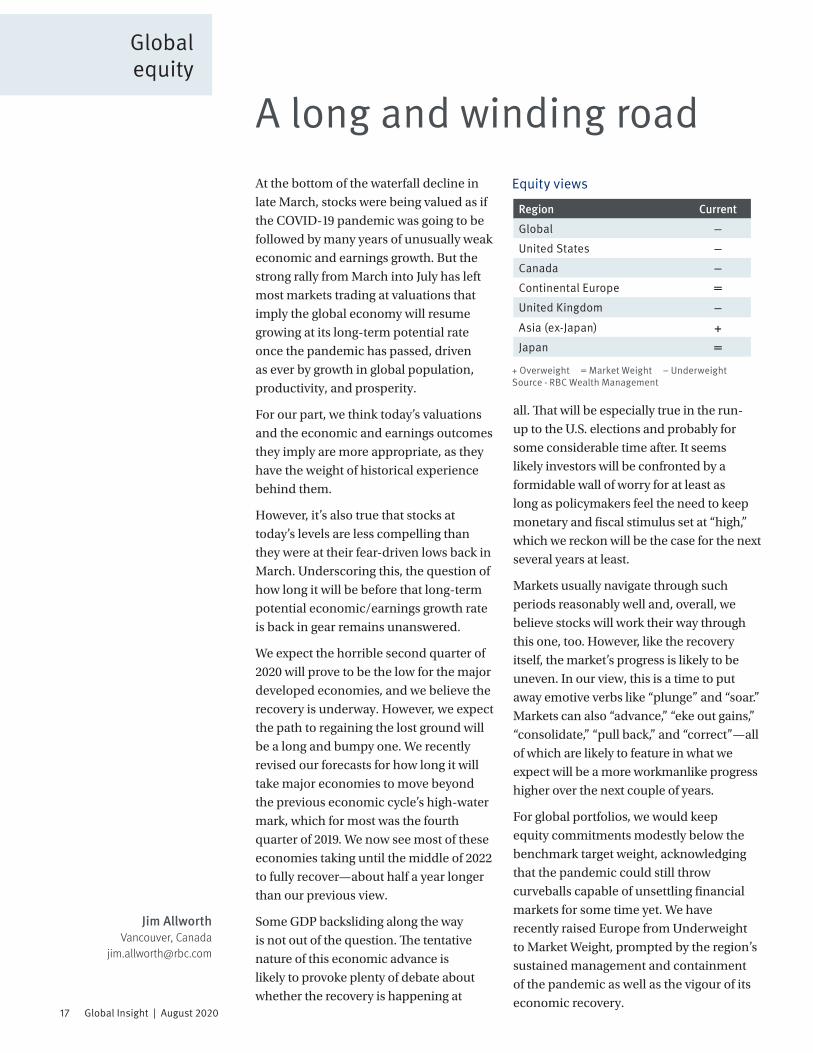
Equity views
+ Overweight = Market Weight – Underweight Source - RBC Wealth Management
Region Current
Global −United States −Canada −Continental Europe = United Kingdom −Asia (ex-Japan) +Japan =
18 Global Insight | August 2020
Global fixed income
Change of pace Global central banks have struggled
for years to hit inflation targets, and
stable price growth has proved elusive
as disinflationary forces have persisted.
Though neither the Federal Reserve nor
the European Central Bank is scheduled
to meet this month, August may set
the stage for an important September,
particularly for the Fed and the outlook
for monetary policy.
The Fed has been undergoing a policy
strategy review since 2018, with the
findings expected to be released to the
public soon. The first clues as to how
the Fed might change its approach to
achieving its dual mandate of stable
prices and maximum employment could
come from the 2020 Economic Policy
Symposium “Navigating the Decade
Ahead: Implications for Monetary Policy,”
scheduled for the end of this month. It
has replaced the annual Jackson Hole
Economic Symposium—an important
venue central banks have used to prepare
markets for notable policy shifts.
Undoubtedly the focus will be on
inflation. The Fed targets 2% inflation on
a sustained basis and the ECB below, but
near, 2%. Markets will be looking for clues
that central banks may be on the verge
of a policy change. One option would
include “making up” for past shortfalls,
or even an explicit willingness to allow
the pace of inflation to overshoot 2% for
a period of time. The ECB’s own policy
review was placed on hold due to the
pandemic with the findings now expected
to be revealed around this time next year,
and is largely expected to take its cues
from the Fed.
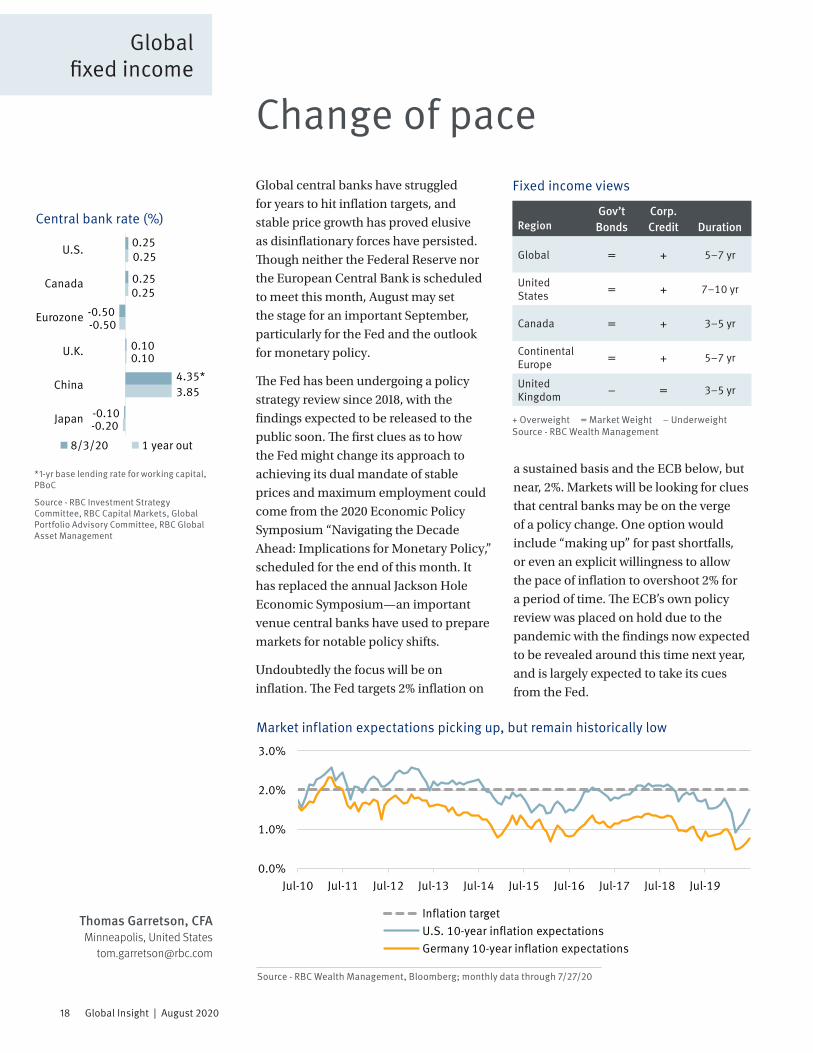
-0.20
3.85
0.10
-0.50
0.25
0.25
-0.10
4.35*
0.10
-0.50
0.25
0.25
Japan
China
U.K.
Eurozone
Canada
U.S.
8/3/20 1 year out
*1-yr base lending rate for working capital, PBoC
Source - RBC Investment Strategy Committee, RBC Capital Markets, Global Portfolio Advisory Committee, RBC Global Asset Management
Central bank rate (%)
Fixed income views
+ Overweight = Market Weight – Underweight Source - RBC Wealth Management
Region
Gov’t Bonds
Corp. Credit
Duration
Global = + 5–7 yr
United States = + 7–10 yr
Canada = + 3–5 yr
Continental Europe = + 5–7 yr
United Kingdom – = 3–5 yr
Thomas Garretson, CFAMinneapolis, United States
Market inflation expectations picking up, but remain historically low
Source - RBC Wealth Management, Bloomberg; monthly data through 7/27/20
0.0%
1.0%
2.0%
3.0%
Jul-10 Jul-11 Jul-12 Jul-13 Jul-14 Jul-15 Jul-16 Jul-17 Jul-18 Jul-19
Inflation targetU.S. 10-year inflation expectationsGermany 10-year inflation expectations

19 Global Insight | August 2020
Global fixed income
Note: Eurozone utilizes German Bunds.
Source - RBC Investment Strategy Committee, RBC Capital Markets, Global Portfolio Advisory Committee, RBC Global Asset Management
10-year rate (%)
-0.20
0.40
-0.30
0.75
0.75
0.01
2.96
0.11
-0.51
0.47
0.57
Japan
China
U.K.
Eurozone
Canada
U.S.
8/3/20 1 year out
Regardless, any changes are only likely to
signal that monetary policy will remain
on easy street for years to come, which
continues to weigh on global yields as the
amount of debt trading to negative yields
is once again increasing, rising back to
$14.8 trillion from $7.7 trillion in March.
Low government yields are driving record
inflows into corporate credit, pushing the
yield on U.S. investment-grade corporate
bonds to a record low of just 1.9%.
Sovereign yield curves
0.53
0.48
0.10
-0.5%
0.0%
0.5%
1.0%
1.5%
1Y 2Y 5Y 10Y
20Y
30Y
U.S.CanadaUK
Source - Bloomberg; data through 7/31/20

20 Global Insight | August 2020
Key forecasts
Source - RBC Investment Strategy Committee, RBC Capital Markets, Global Portfolio Advisory Committee, RBC Global Asset Management (RBC GAM), Bloomberg consensus estimates
Real GDP growth Inflation rate
United States – Historic drop in GDP Q2 GDP down 32% annualized. Jobless claims ticking higher as some states reinstate lockdowns. Consumer optimism is waning amid mounting cases, and could fall further in August if Congress does not meaningfully extend unemployment benefits. The housing market continues resilient as historically low borrowing rates coupled with increased demand for suburban housing keep sales and starts high.
2.9% 2.3%
2.0% 1.8%
-6.0%
3.4%0.0%
1.0%
2018 2019 2020E 2021E
Canada – Recovery in retail sales Retail sales rebounded 18.7% in May with vehicle sales the largest contributor. The unemployment rate edged lower to 12.3%. Consumer confidence crept higher but has a long way to go to reach pre-COVID-19 levels. May GDP rose by 4.5% but remains 15% below pre-COVID-19 Feb. peak. The BoC indicated it will be cutting the purchases of short-term government debt in half as market conditions have stabilized.
1.9% 1.6%
2.0% 2.0%
-7.0%
4.5%0.0%
1.0%
2018 2019 2020E 2021E
Eurozone – Economy looking brighterThe unemployment rate rose marginally but remains near historic lows at 7.4%. After a strong rebound in June, PMI rose further in July into expansion territory. Retail sales rose sharply as stores across the area reopened. Industrial production boomed, reaching a record high. The euro neared a two-year high against the dollar as COVID-19 infections remained subdued compared to the U.S.
1.8% 1.2%
1.6% 1.2%
-7.0%
3.3%-0.5%
0.5%
2018 2019 2020E 2021E
UK – Households loosen the purse stringsConsumer sentiment improved as some pandemic restrictions were lifted. In a further sign of improving consumer confidence, mortgage approvals jumped to 40,000, the highest since March. Recent activity in UK bonds is signaling investors believe a Bank of England rate cut leading to sub-zero rates is more probable than additional QE, causing yields on 5-year bonds to fall several times during the month.
1.4% 1.3%
2.0% 1.8%
-9.0%
5.2%
0.0%
1.0%
2018 2019 2020E 2021E
China – Mfg. rebound momentum to continueChina’s manufacturing rebound is expected to gain momentum into H2 as global economies continue reopening. Manufacturing PMI remained in expansion territory in July, rising to 51.2, beating consensus estimates. Heavy flooding in central and southern China and recent clusters of COVID-19 outbreaks have caused some disruptions but are not expected to significantly impact H2 manufacturing expansion.
6.6% 6.1%
1.9%2.9% 1.3%
8.0%
2.0% 2.5%
2018 2019 2020E 2021E
Japan – Recovery subduedThe country’s economic recovery has been hampered by heavy rainfall in western areas and an increase in COVID-19 cases. Weak consumer spending through June showed some improvement in July. Public transportation usage in Tokyo has almost returned to pre-outbreak levels. The Bank of Japan remained on hold, signaling greater confidence in the country’s economic trajectory.
0.8% 1.2%
0.3% 0.5%
-5.3%
1.8%1.4%
0.0%
2018 2019 2020E 2021E
21 Global Insight | August 2020
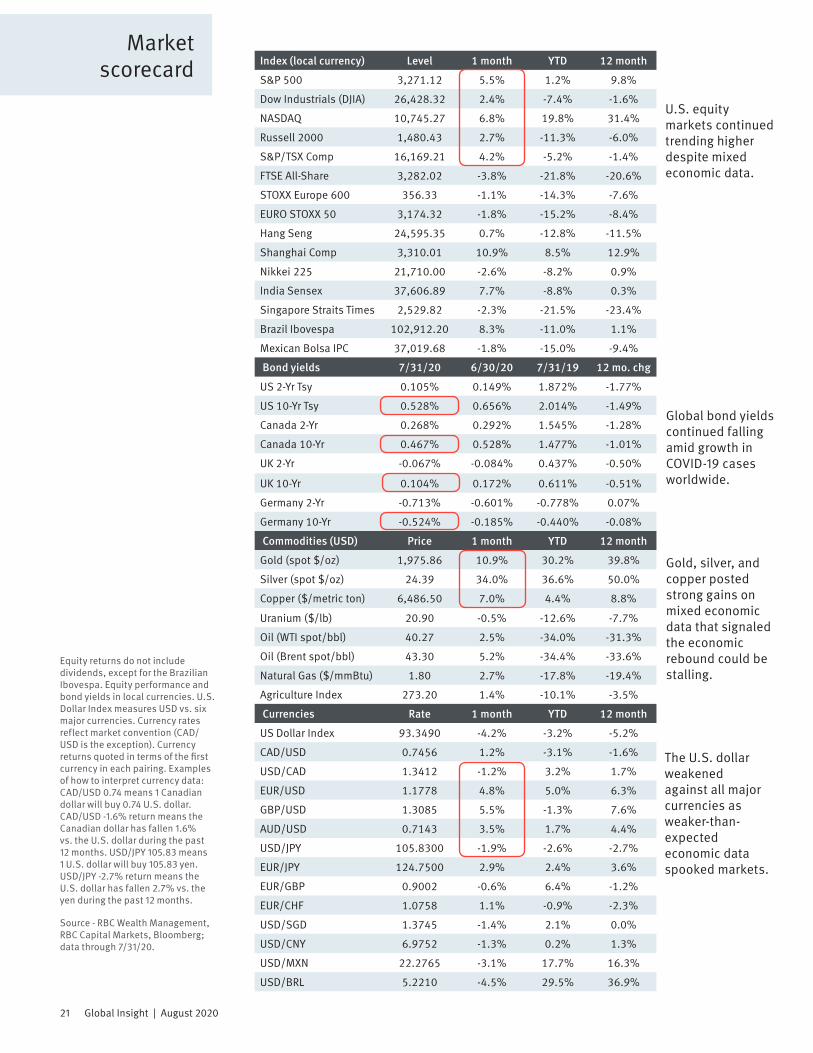
Index (local currency) Level 1 month YTD 12 month
S&P 500 3,271.12 5.5% 1.2% 9.8%
Dow Industrials (DJIA) 26,428.32 2.4% -7.4% -1.6%
NASDAQ 10,745.27 6.8% 19.8% 31.4%
Russell 2000 1,480.43 2.7% -11.3% -6.0%
S&P/TSX Comp 16,169.21 4.2% -5.2% -1.4%
FTSE All-Share 3,282.02 -3.8% -21.8% -20.6%
STOXX Europe 600 356.33 -1.1% -14.3% -7.6%
EURO STOXX 50 3,174.32 -1.8% -15.2% -8.4%
Hang Seng 24,595.35 0.7% -12.8% -11.5%
Shanghai Comp 3,310.01 10.9% 8.5% 12.9%
Nikkei 225 21,710.00 -2.6% -8.2% 0.9%
India Sensex 37,606.89 7.7% -8.8% 0.3%
Singapore Straits Times 2,529.82 -2.3% -21.5% -23.4%
Brazil Ibovespa 102,912.20 8.3% -11.0% 1.1%
Mexican Bolsa IPC 37,019.68 -1.8% -15.0% -9.4%
Bond yields 7/31/20 6/30/20 7/31/19 12 mo. chg
US 2-Yr Tsy 0.105% 0.149% 1.872% -1.77%
US 10-Yr Tsy 0.528% 0.656% 2.014% -1.49%
Canada 2-Yr 0.268% 0.292% 1.545% -1.28%
Canada 10-Yr 0.467% 0.528% 1.477% -1.01%
UK 2-Yr -0.067% -0.084% 0.437% -0.50%
UK 10-Yr 0.104% 0.172% 0.611% -0.51%
Germany 2-Yr -0.713% -0.601% -0.778% 0.07%
Germany 10-Yr -0.524% -0.185% -0.440% -0.08%
Commodities (USD) Price 1 month YTD 12 month
Gold (spot $/oz) 1,975.86 10.9% 30.2% 39.8%
Silver (spot $/oz) 24.39 34.0% 36.6% 50.0%
Copper ($/metric ton) 6,486.50 7.0% 4.4% 8.8%
Uranium ($/lb) 20.90 -0.5% -12.6% -7.7%
Oil (WTI spot/bbl) 40.27 2.5% -34.0% -31.3%
Oil (Brent spot/bbl) 43.30 5.2% -34.4% -33.6%
Natural Gas ($/mmBtu) 1.80 2.7% -17.8% -19.4%
Agriculture Index 273.20 1.4% -10.1% -3.5%
Currencies Rate 1 month YTD 12 month
US Dollar Index 93.3490 -4.2% -3.2% -5.2%
CAD/USD 0.7456 1.2% -3.1% -1.6%
USD/CAD 1.3412 -1.2% 3.2% 1.7%
EUR/USD 1.1778 4.8% 5.0% 6.3%
GBP/USD 1.3085 5.5% -1.3% 7.6%
AUD/USD 0.7143 3.5% 1.7% 4.4%
USD/JPY 105.8300 -1.9% -2.6% -2.7%
EUR/JPY 124.7500 2.9% 2.4% 3.6%
EUR/GBP 0.9002 -0.6% 6.4% -1.2%
EUR/CHF 1.0758 1.1% -0.9% -2.3%
USD/SGD 1.3745 -1.4% 2.1% 0.0%
USD/CNY 6.9752 -1.3% 0.2% 1.3%
USD/MXN 22.2765 -3.1% 17.7% 16.3%
USD/BRL 5.2210 -4.5% 29.5% 36.9%
Equity returns do not include dividends, except for the Brazilian Ibovespa. Equity performance and bond yields in local currencies. U.S. Dollar Index measures USD vs. six major currencies. Currency rates reflect market convention (CAD/USD is the exception). Currency returns quoted in terms of the first currency in each pairing. Examples of how to interpret currency data: CAD/USD 0.74 means 1 Canadian dollar will buy 0.74 U.S. dollar. CAD/USD -1.6% return means the Canadian dollar has fallen 1.6% vs. the U.S. dollar during the past 12 months. USD/JPY 105.83 means 1 U.S. dollar will buy 105.83 yen. USD/JPY -2.7% return means the U.S. dollar has fallen 2.7% vs. the yen during the past 12 months.
Source - RBC Wealth Management, RBC Capital Markets, Bloomberg; data through 7/31/20.
U.S. equity markets continued trending higher despite mixed economic data.
Gold, silver, and copper posted strong gains on mixed economic data that signaled the economic rebound could be stalling.
Market scorecard
Global bond yields continued falling amid growth in COVID-19 cases worldwide.
The U.S. dollar weakened against all major currencies as weaker-than-expected economic data spooked markets.
22 Global Insight | August 2020
Research resourcesThis document is produced by the Global Portfolio Advisory Committee within RBC Wealth Management’s Portfolio
Advisory Group. The RBC Wealth Management Portfolio Advisory Group provides support related to asset allocation and
portfolio construction for the firm’s investment advisors / financial advisors who are engaged in assembling portfolios
incorporating individual marketable securities. The Committee leverages the broad market outlook as developed by the
RBC Investment Strategy Committee, providing additional tactical and thematic support utilizing research from the RBC
Investment Strategy Committee, RBC Capital Markets, and third-party resources.
Global Portfolio Advisory Committee members:
Jim Allworth – Co-chair; Investment Strategist, RBC Dominion Securities Inc.
Kelly Bogdanova – Co-chair; Portfolio Analyst, RBC Wealth Management Portfolio Advisory Group U.S.,
RBC Capital Markets, LLC
Frédérique Carrier – Co-chair; Managing Director & Head of Investment Strategies, RBC Europe Limited
Mark Bayko, CFA – Head, Portfolio Management, RBC Dominion Securities Inc.
Janet Engels – Head, Portfolio Advisory Group U.S., RBC Wealth Management, RBC Capital Markets, LLC
Thomas Garretson, CFA – Fixed Income Senior Portfolio Strategist, RBC Wealth Management Portfolio Advisory Group,
RBC Capital Markets, LLC
Christopher Girdler, CFA – Fixed Income Portfolio Advisor, RBC Wealth Management Portfolio Advisory Group,
RBC Dominion Securities Inc.
Patrick McAllister, CFA – Manager, Equity Advisory & Portfolio Management, Portfolio Advisory Group, RBC Dominion
Securities Inc.
Alan Robinson – Portfolio Analyst, RBC Wealth Management Portfolio Advisory Group – U.S. Equities,
RBC Capital Markets, LLC
Michael Schuette, CFA – Multi-Asset Portfolio Strategist, RBC Wealth Management Portfolio Advisory Group – U.S.,
RBC Capital Markets, LLC
Alastair Whitfield – Head of Fixed Income – British Isles, RBC Wealth Management, RBC Europe Limited
The RBC Investment Strategy Committee (RISC) consists of senior investment professionals drawn from individual,
client-focused business units within RBC, including the Portfolio Advisory Group. The RISC builds a broad global
investment outlook and develops specific guidelines that can be used to manage portfolios. The RISC is chaired by
Daniel Chornous, CFA, Chief Investment Officer of RBC Global Asset Management Inc.
Additional Global Insight contributors:
Richard Tan, CFA – Canadian Equities Portfolio Advisor, RBC Wealth Management Portfolio Advisory Group – Equities,
RBC Dominion Securities Inc.
Christopher Louney – Commodity Strategist, RBC Capital Markets, LLC

23 Global Insight | August 2020
Required disclosuresAnalyst Certification All of the views expressed in this report accurately reflect the personal views of the responsible analyst(s) about any and all of the subject securities or issuers. No part of the com-pensation of the responsible analyst(s) named herein is, or will be, directly or indirectly, related to the specific recom-mendations or views expressed by the responsible analyst(s) in this report.
Important DisclosuresIn the U.S., RBC Wealth Management operates as a division of RBC Capital Markets, LLC. In Canada, RBC Wealth Manage-ment includes, without limitation, RBC Dominion Securities Inc., which is a foreign affiliate of RBC Capital Markets, LLC. This report has been prepared by RBC Capital Markets, LLC which is an indirect wholly-owned subsidiary of the Royal Bank of Canada and, as such, is a related issuer of Royal Bank of Canada.
Non-U.S. Analyst Disclosure: Jim Allworth, Mark Bayko, Christopher Girdler, Patrick McAllister, and Richard Tan, employees of RBC Wealth Management USA’s foreign affiliate RBC Dominion Securities Inc.; Frédérique Carrier and Alastair Whitfield, employees of RBC Wealth Management USA’s for-eign affiliate RBC Europe Limited; contributed to the prepar-ation of this publication. These individuals are not registered with or qualified as research analysts with the U.S. Financial Industry Regulatory Authority (“FINRA”) and, since they are not associated persons of RBC Wealth Management, they may not be subject to FINRA Rule 2241 governing com-munications with subject companies, the making of public appearances, and the trading of securities in accounts held by research analysts.
In the event that this is a compendium report (covers six or more companies), RBC Wealth Management may choose to provide important disclosure information by reference. To access current disclosures, clients should refer to https://www.rbccm.com/GLDisclosure/PublicWeb/Disclosure Lookup.aspx?EntityID=2 to view disclosures regarding RBC Wealth Management and its affiliated firms. Such informa-tion is also available upon request to RBC Wealth Manage-ment Publishing, 60 South Sixth St, Minneapolis, MN 55402.
References to a Recommended List in the recommendation history chart may include one or more recommended lists or model portfolios maintained by RBC Wealth Management or one of its affiliates. RBC Wealth Management recommended lists include the Guided Portfolio: Prime Income (RL 6), the Guided Portfolio: Dividend Growth (RL 8), the Guided Port-folio: ADR (RL 10), and the Guided Portfolio: All Cap Growth (RL 12). RBC Capital Markets recommended lists include the Strategy Focus List and the Fundamental Equity Weightings (FEW) portfolios. The abbreviation ‘RL On’ means the date a security was placed on a Recommended List. The abbrevia-
tion ‘RL Off’ means the date a security was removed from a Recommended List.
Distribution of RatingsFor the purpose of ratings distributions, regulatory rules require member firms to assign ratings to one of three rating categories - Buy, Hold/Neutral, or Sell - regardless of a firm’s own rating categories. Although RBC Capital Markets’ ratings of Outperform (O), Sector Perform (SP), and Underperform (U) most closely correspond to Buy, Hold/Neutral and Sell, respectively, the meanings are not the same because our ratings are determined on a relative basis.
Explanation of RBC Capital Markets, LLC Equity Rating SystemAn analyst’s “sector” is the universe of companies for which the analyst provides research coverage. Accordingly, the rating assigned to a particular stock represents solely the analyst’s view of how that stock will perform over the next 12 months relative to the analyst’s sector average.
Outperform (O): Expected to materially outperform sec-tor average over 12 months. Sector Perform (SP): Returns expected to be in line with sector average over 12 months. Underperform (U): Returns expected to be materially below sector average over 12 months. Restricted (R): RBC policy precludes certain types of communications, including an investment recommendation, when RBC is acting as an ad-visor in certain merger or other strategic transactions and in certain other circumstances. Not Rated (NR): The rating, price targets and estimates have been removed due to applicable legal, regulatory or policy constraints which may include when RBC Capital Markets is acting in an advisory capacity involving the company.
As of March 31, 2020, RBC Capital Markets discontinued its Top Pick rating. Top Pick rated securities represented an ana-lyst’s best idea in the sector; expected to provide significant absolute returns over 12 months with a favorable risk-reward ratio. Top Pick rated securities have been reassigned to our Outperform rated securities category, which are securities expected to materially outperform sector average over 12 months.
Risk Rating: The Speculative risk rating reflects a security’s lower level of financial or operating predictability, illiquid share trading volumes, high balance sheet leverage, or lim-
As of June 30, 2020
Rating Count Percent Count PercentBuy [Outperform] 776 51.63 238 30.67Hold [Sector Perform] 635 42.25 130 20.47Sell [Underperform] 92 6.12 12 13.04
Investment Banking Services Provided During Past 12 Months
Distribution of Ratings - RBC Capital Markets, LLC Equity Research

24 Global Insight | August 2020
ited operating history that result in a higher expectation of financial and/or stock price volatility.
Valuation and Risks to Rating and Price TargetWhen RBC Wealth Management assigns a value to a com-pany in a research report, FINRA Rules and NYSE Rules (as incorporated into the FINRA Rulebook) require that the basis for the valuation and the impediments to obtaining that valuation be described. Where applicable, this information is included in the text of our research in the sections en-titled “Valuation” and “Risks to Rating and Price Target”, respectively.
The analyst(s) responsible for preparing this research report have received (or will receive) compensation that is based upon various factors, including total revenues of RBC Capital Markets, LLC, and its affiliates, a portion of which are or have been generated by investment banking activities of RBC Capital Markets, LLC and its affiliates.
Other DisclosuresPrepared with the assistance of our national research sources. RBC Wealth Management prepared this report and takes sole responsibility for its content and distribution. The content may have been based, at least in part, on material provided by our third-party correspondent research servi-ces. Our third-party correspondent has given RBC Wealth Management general permission to use its research reports as source materials, but has not reviewed or approved this report, nor has it been informed of its publication. Our third-party correspondent may from time to time have long or short positions in, effect transactions in, and make markets in securities referred to herein. Our third-party correspond-ent may from time to time perform investment banking or other services for, or solicit investment banking or other business from, any company mentioned in this report.
RBC Wealth Management endeavors to make all reasonable efforts to provide research simultaneously to all eligible cli-ents, having regard to local time zones in overseas jurisdic-tions. In certain investment advisory accounts, RBC Wealth Management or a designated third party will act as overlay manager for our clients and will initiate transactions in the securities referenced herein for those accounts upon receipt of this report. These transactions may occur before or after your receipt of this report and may have a short-term impact on the market price of the securities in which transactions occur. RBC Wealth Management research is posted to our proprietary Web sites to ensure eligible clients receive cover-age initiations and changes in rating, targets, and opinions in a timely manner. Additional distribution may be done by sales personnel via e-mail, fax, or regular mail. Clients may also receive our research via third-party vendors. Please con-tact your RBC Wealth Management Financial Advisor for more information regarding RBC Wealth Management research.
Conflicts Disclosure: RBC Wealth Management is registered with the Securities and Exchange Commission as a broker/dealer and an investment adviser, offering both brokerage and investment advisory services. RBC Wealth Manage-
ment’s Policy for Managing Conflicts of Interest in Relation to Investment Research is available from us on our website at https://www.rbccm.com/GLDisclosure/PublicWeb/Disclo-sureLookup.aspx?EntityID=2. Conflicts of interests related to our investment advisory business can be found in Part 2A Appendix 1 of the Firm’s Form ADV or the RBC Advisory Programs Disclosure Document. Copies of any of these documents are available upon request through your Finan-cial Advisor. We reserve the right to amend or supplement this policy, Part 2A Appendix 1 of the Form ADV, or the RBC Advisory Programs Disclosure Document at any time.
The authors are employed by one of the following entities: RBC Wealth Management USA, a division of RBC Capital Markets, LLC, a securities broker-dealer with principal offices located in Minnesota and New York, USA; by RBC Dominion Securities Inc., a securities broker-dealer with principal offices located in Toronto, Canada; by RBC Investment Servi-ces (Asia) Limited, a subsidiary of RBC Dominion Securities Inc., a securities broker-dealer with principal offices located in Hong Kong, China; by Royal Bank of Canada, Singapore Branch, a licensed wholesale bank with its principal office located in Singapore; and by RBC Europe Limited, a licensed bank with principal offices located in London, United King-dom.
Third-party disclaimersThe Global Industry Classification Standard (“GICS”) was developed by and is the exclusive property and a service mark of MSCI Inc. (“MSCI”) and Standard & Poor’s Financial Services LLC (“S&P”) and is licensed for use by RBC. Neither MSCI, S&P, nor any other party involved in making or compiling the GICS or any GICS classifications makes any express or implied warranties or representations with respect to such standard or classification (or the results to be obtained by the use thereof), and all such parties hereby expressly disclaim all warranties of originality, accuracy, completeness, merchantability and fitness for a particular purpose with respect to any of such standard or classification. Without limiting any of the foregoing, in no event shall MSCI, S&P, any of their affiliates or any third party involved in making or compiling the GICS or any GICS classifications have any liability for any direct, indirect, special, punitive, consequential or any other damages (including lost profits) even if notified of the possibility of such damages.
References herein to “LIBOR”, “LIBO Rate”, “L” or other LIBOR abbreviations means the London interbank offered rate as administered by ICE Benchmark Administration (or any other person that takes over the administration of such rate).
DisclaimerThe information contained in this report has been compiled by RBC Wealth Management, a division of RBC Capital Markets, LLC, from sources believed to be reliable, but no representation or warranty, express or implied, is made by Royal Bank of Canada, RBC Wealth Management, its affiliates or any other person as to its accuracy, completeness or correctness. All opinions and estimates contained in this report constitute RBC Wealth Management’s judg-ment as of the date of this report, are subject to change without notice and are provided in good faith but without legal responsibility. Past performance is not a guide to future performance, future returns are not guaranteed, and a loss of original capital may occur. Every province in Canada, state in the U.S., and most countries throughout the world have their own laws regulating the types of securities and other investment products which may be offered to their residents, as well as the process for doing so. As a result, the securities discussed in this report may not be eligible for sale in some jurisdictions. This report is not, and under no circumstances should be construed as, a solicitation to act as securities broker or dealer in any jurisdiction by any

25 Global Insight | August 2020
person or company that is not legally permitted to carry on the business of a securities broker or dealer in that jurisdiction. Nothing in this report constitutes legal, accounting or tax advice or individually tailored investment advice. This material is prepared for general circulation to clients, including clients who are affiliates of Royal Bank of Canada, and does not have regard to the particular circumstances or needs of any specific person who may read it. The investments or services contained in this report may not be suitable for you and it is recommended that you consult an independent investment advisor if you are in doubt about the suitability of such investments or servi-ces. To the full extent permitted by law neither Royal Bank of Canada nor any of its affiliates, nor any other person, accepts any liability whatsoever for any direct, indirect or consequential loss arising from, or in connection with, any use of this report or the information contained herein. No matter contained in this document may be reproduced or copied by any means without the prior written consent of Royal Bank of Canada in each instance. In the U.S., RBC Wealth Management operates as a division of RBC Capital Markets, LLC. In Canada, RBC Wealth Management includes, without limitation, RBC Dominion Securities Inc., which is a foreign affiliate of RBC Capital Markets, LLC. This report has been prepared by RBC Capital Markets, LLC. Additional information is available upon request.
To U.S. Residents: This publication has been approved by RBC Capital Mar-kets, LLC, Member NYSE/FINRA/SIPC, which is a U.S. registered broker-dealer and which accepts responsibility for this report and its dissemination in the United States. RBC Capital Markets, LLC, is an indirect wholly-owned subsidiary of the Royal Bank of Canada and, as such, is a related issuer of Royal Bank of Canada. Any U.S. recipient of this report that is not a registered broker-dealer or a bank acting in a broker or dealer capacity and that wishes further information regarding, or to effect any transaction in, any of the securities discussed in this report, should contact and place orders with RBC Capital Markets, LLC. International investing involves risks not typically as-sociated with U.S. investing, including currency fluctuation, foreign taxation, political instability and different accounting standards.
To Canadian Residents: This publication has been approved by RBC Dominion Securities Inc. RBC Dominion Securities Inc.* and Royal Bank of Canada are separate corporate entities which are affiliated. *Member-Canadian Investor
Protection Fund. ®Registered trademark of Royal Bank of Canada. Used under license. RBC Wealth Management is a registered trademark of Royal Bank of Canada. Used under license.
RBC Wealth Management (British Isles): This publication is distributed by RBC Europe Limited and RBC Investment Solutions (CI) Limited. RBC Europe Limited is authorised by the Prudential Regulation Authority and regulated by the Financial Conduct Authority and the Prudential Regulation Authority (FCA registration number: 124543). Registered office: 100 Bishopsgate, London, EC2N 4AA, UK. RBC Investment Solutions (CI) Limited is regulated by the Jersey Financial Services Commission in the conduct of investment business in Jersey. Registered office: Gaspé House, 66-72 Esplanade, St Helier, Jersey JE2 3QT, Channel Islands, registered company number 119162.
To Hong Kong Residents: This publication is distributed in Hong Kong by Royal Bank of Canada, Hong Kong Branch which is regulated by the Hong Kong Monetary Authority and the Securities and Futures Commission (‘SFC’), and RBC Investment Services (Asia) Limited, which is regulated by the SFC.
To Singapore Residents: This publication is distributed in Singapore by the Royal Bank of Canada, Singapore Branch, a registered entity licensed by the Monetary Authority of Singapore. This material has been prepared for general circulation and does not take into account the objectives, financial situa-tion, or needs of any recipient. You are advised to seek independent advice from a financial adviser before purchasing any product. If you do not obtain independent advice, you should consider whether the product is suitable for you. Past performance is not indicative of future performance. If you have any questions related to this publication, please contact the Royal Bank of Canada, Singapore Branch. Royal Bank of Canada, Singapore Branch accepts responsibility for this report and its dissemination in Singapore.
© 2020 RBC Capital Markets, LLC – Member NYSE/FINRA/SIPC © 2020 RBC Dominion Securities Inc. – Member Canadian Investor Protection Fund © 2020 RBC Europe Limited © 2020 Royal Bank of Canada All rights reserved RBC1524