political environment and congressional breakdown charts · 0 49 98 apr-17 jul-17 aug-17 sep-17...
TRANSCRIPT

Political Environment and Congressional Breakdown ChartsNovember 14, 2017

Presidential Job Approval: Gallup PollingGallup Weekly Presidential Job Approval Ratings: YTD
“Do you approve or disapprove of the way Donald Trump is handling his job as president?”
56%Disapprove
38%Approve
-18%Net
Gallup Presidential Approval Ratings, November 13, 2017
30
40
50
60
Jan
20-2
9, 2
017
Jan
30-F
eb 5
Feb
6-12
Feb
13-19
Feb
20-2
6Fe
b 27
-Mar
5M
ar 6
-12M
ar 13
-19M
ar 2
0-26
Mar
27-
Apr 2
Apr 3
-9Ap
r 10-
16Ap
r 17-
23Ap
r 24-
30M
ay 1-
7M
ay 8
-14M
ay 15
-21
May
22-
28M
ay 2
9-Ju
n 4
Jun
5-11
Jun
12-18
Jun
19-2
5Ju
n 26
-Jul
2Ju
l 3-9
Jul 1
0-16
Jul 1
7-23
Jul 2
4-30
Jul 3
1-Aug
6Au
g 7-
13Au
g 14
-20
Aug
21-2
7Au
g 28
-Sep
3Se
p 4-
10Se
p 11-
17Se
p 18
-24
Sep
25-O
ct 1
Oct
2-8
Oct
9-15
Oct
16-2
2O
ct 2
3-29
Oct
30-
Nov
5N
ov 6
-12
Approve Disapprove Trump 2016 Win Percentage (46.1%)
-26
-13
0
Jan
20-2
9, 2
017
Jan
30-F
eb 5
Feb
6-12
Feb
13-19
Feb
20-2
6Fe
b 27
-Mar
5M
ar 6
-12M
ar 13
-19M
ar 2
0-26
Mar
27-
Apr 2
Apr 3
-9Ap
r 10-
16Ap
r 17-
23Ap
r 24-
30M
ay 1-
7M
ay 8
-14M
ay 15
-21
May
22-
28M
ay 2
9-Ju
n 4
Jun
5-11
Jun
12-18
Jun
19-2
5Ju
n 26
-Jul
2Ju
l 3-9
Jul 1
0-16
Jul 1
7-23
Jul 2
4-30
Jul 3
1-Aug
6Au
g 7-
13Au
g 14
-20
Aug
21-2
7Au
g 28
-Sep
3Se
p 4-
10Se
p 11-
17Se
p 18
-24
Sep
25-O
ct 1
Oct
2-8
Oct
9-15
Oct
16-2
2O
ct 2
3-29
Oct
30-
Nov
5N
ov 6
-12
Net (% Approval - % Disapproval)

Gallup Presidential Job Approval by PartyGallup Weekly Presidential Job Approval Ratings: YTD
“Do you approve or disapprove of the way Donald Trump is handling his job as president?”
82%Republican Approval
33%Independent Approval
8%Democratic Approval
33%Independent Approval
Zoom on Independents
Gallup Presidential Approval Ratings, November 13, 2017
0
20
40
60
80
100
Jan
20-2
9, 2
017
Jan
30-F
eb 5
Feb
6-12
Feb
13-19
Feb
20-2
6Fe
b 27
-Mar
5M
ar 6
-12M
ar 13
-19M
ar 2
0-26
Mar
27-
Apr 2
Apr 3
-9Ap
r 10-
16Ap
r 17-
23Ap
r 24-
30M
ay 1-
7M
ay 8
-14M
ay 15
-21
May
22-
28M
ay 2
9-Ju
n 4
Jun
5-11
Jun
12-18
Jun
19-2
5Ju
n 26
-Jul
2Ju
l 3-9
Jul 1
0-16
Jul 1
7-23
Jul 2
4-30
Jul 3
1-Aug
6Au
g 7-
13Au
g 14
-20
Aug
21-2
7Au
g 28
-Sep
3Se
p 4-
10Se
p 11-
17Se
p 18
-24
Sep
25-O
ct 1
Oct
2-8
Oct
9-15
Oct
16-2
2O
ct 2
3-29
Oct
30-
Nov
5N
ov 6
-12
Republicans Independents Democrats
28
35
42
Jan
20-2
9, 2
017
Jan
30-F
eb 5
Feb
6-12
Feb
13-19
Feb
20-2
6Fe
b 27
-Mar
5M
ar 6
-12M
ar 13
-19M
ar 2
0-26
Mar
27-
Apr 2
Apr 3
-9Ap
r 10-
16Ap
r 17-
23Ap
r 24-
30M
ay 1-
7M
ay 8
-14M
ay 15
-21
May
22-
28M
ay 2
9-Ju
n 4
Jun
5-11
Jun
12-18
Jun
19-2
5Ju
n 26
-Jul
2Ju
l 3-9
Jul 1
0-16
Jul 1
7-23
Jul 2
4-30
Jul 3
1-Aug
6Au
g 7-
13Au
g 14
-20
Aug
21-2
7Au
g 28
-Sep
3Se
p 4-
10Se
p 11-
17Se
p 18
-24
Sep
25-O
ct 1
Oct
2-8
Oct
9-15
Oct
16-2
2O
ct 2
3-29
Oct
30-
Nov
5N
ov 6
-12

0
49
98
Apr-17 Jul-17 Aug-17 Sep-17 Nov-17
Approve Strongly Approve SomewhatDisapprove Somewhat Disapprove Strongly
0
24.5
49
73.5
98
Jan-17 Mar-17 Aug-17 Sep-17 Oct-17 Nov-17
Approve Strongly Approve ModeratelyDisapprove Moderately Disapprove Strongly
0
45
90
Jun-17 Aug-17 Sep-17 Oct-17
Strongly Approve Somewhat ApproveSomewhat Disapprove Strongly Disapprove
0
47.5
95
Feb-17 Mar-17 Apr-17 May-17 Jun-17 Jul-17 Aug-17 Sep-17 Oct-17
Strongly Approve Somewhat ApproveSomewhat Disapprove Strongly Disapprove
Presidential Job Approval: Other Polls to WatchIntensity Polling
57%Total Disapprove
Fox NewsOctober 22-24, 2017 | 1,017 Registed Voters
58%Total Disapprove
NBC/Wall Street JournalOctober 23-26, 2017 | 900 Adults
CNNOctober2-5 2017 | 1,021 Adults
57%Total Disapprove
37%Total Approve
ABC-Washington PostOctober 29 - November 1, 2017 | 1,005 Adults
38%Total Approve
59%Total Disapprove
37%Total Approve
38%Total Approve
49%
9%
16%
22%
49%
8%
12%
25%
48%
9%
10%
25%
50%
8%
12%
25%

Presidential Job Approval vs. Midterm Results Senate and House Midterm Seat Losses Since 1966
Current Trump Approval
38%Gallup November 6-12, 2017
Job Approval Avg. Change House Avg. Change Senate
Over 60% +3 Seats -2 Seats
50%-60% -12 Seats - 1 Seat
Under 50% -40 Seats - 5 Seats
Gallup Presidential Approval Ratings, November 13, 2017
-70
0
70
1966 1970 1974 1978 1982 1986 1990 1994 1998 2002 2006 2010 2014
House Seats Presidential Approval
42%45%
39%
63%66%
46%
58%
63%
43%
52%
47%
57%
49%
-13
-63
-30
85
-54
-8-5
-26
-15
-48
-12
-48
49%
57%
47%
52%
43%
63%
58%
46%
66%63%
39%
45%42%

Direction of the CountryNBC News/Wall Street Journal: Right Direction/Wrong Track Polling
59%Off on the wrong track
34%Headed in the right direction
-25%Net
“All in all, do you think things in the nation are generally headed in the right direction, or do you feel things are off on the wrong track?”
NBC/WSJ, April 17-20, 2017
0%
25%
50%
75%
100%
Jan
2012
Apr 2
012
Jun
2012
Aug
2012
Sep
2012
Nov
201
2
Jan
2013
Apr 2
013
Jul 2
013
Oct
201
3
Dec
201
3
Mar
201
4
Jun
2014
Sep
2014
Oct
201
4
Dec
201
4
Mar
ch 2
015
June
201
5
Sept
201
5
Oct
201
5
Jan
2016
June
201
6
Aug
2016
Oct
201
6
Jan
2017
Right Direction Undecided Wrong Track
-75
-50
-25
0
Jan
2012
Apr 2
012
Jun
2012
Aug
2012
Sep
2012
Nov
201
2
Jan
2013
Apr 2
013
Jul 2
013
Oct
201
3
Dec
201
3
Mar
201
4
Jun
2014
Sep
2014
Oct
201
4
Dec
201
4
Mar
ch 2
015
June
201
5
Sept
201
5
Oct
201
5
Jan
2016
June
201
6
Aug
2016
Oct
201
6
Jan
2017
Net (% Right Direction - % Wrong Direction)
Hart Research Associates (D)Public Opinion Stratagies (R)

Party IdentificationGallup Polling: Party Affiliation
24%Republicans
42%Independents
31%Democrats
-7%Net
“In politics, as of today, do you consider yourself a Republican, a Democrat or an independent?”
-15
10
2004
Jan
2004
Mar
2004
May
2004
Aug
2004
Oct
2005
Jan
2005
Mar
2005
May
2005
Jul
2005
Sep
2005
Nov
2006
Jan
2006
Mar
2006
Jun
2006
Aug
2006
Nov
2007
Feb
2007
May
2007
Sep
2007
Dec
2008
Feb
2008
May
2008
Sep
2008
Nov
2009
Mar
2009
Jul
2009
Dec
2010
May
2010
Sep
2010
Nov
2011
Apr
2011
Aug
2012
Jan
2012
Jun
2012
Nov
2013
Jan
2013
Jul
2014
Feb
2014
Aug
2015
Jan
2015
Aug
2016
Feb
2016
Jul
2016
Dec
2017
Jul
Net (% Republican - % Democrat)
0
25
50
75
100
2004
Jan
2004
Mar
2004
May
2004
Aug
2004
Oct
2005
Jan
2005
Mar
2005
May
2005
Jul
2005
Sep
2005
Nov
2006
Jan
2006
Mar
2006
Jun
2006
Aug
2006
Nov
2007
Feb
2007
May
2007
Sep
2007
Dec
2008
Feb
2008
May
2008
Sep
2008
Nov
2009
Mar
2009
Jul
2009
Dec
2010
May
2010
Sep
2010
Nov
2011
Apr
2011
Aug
2012
Jan
2012
Jun
2012
Nov
2013
Jan
2013
Jul
2014
Feb
2014
Aug
2015
Jan
2015
Aug
2016
Feb
2016
Jul
2016
Dec
2017
Jul
Republicans Independent Democrats
Gallup Party Affiliation, October, 2017

c+51+40Party Favorable/Unfavorable
Fox
Oct 22-24, 20171,005 Registered Voters
51%
40%
Democrats +9c+41+29CNN
September 17-20, 20171,056 Adults
41%
29%
Democrats +12c+32+29NBC/WSJ
August 5-8, 20171,200 Adults
34%
29%
Democrats +3c+45+40Pew April 5-8, 2017 1,501 Adults
45%
40%
Democrats +5c+38+38Quinnipiac
March 1-3, 20171,283 Registered Voters
38%
38%
Republicans +0
Democratic % Favorable
Republican % Favorable
*NBC asks Positive/Negative
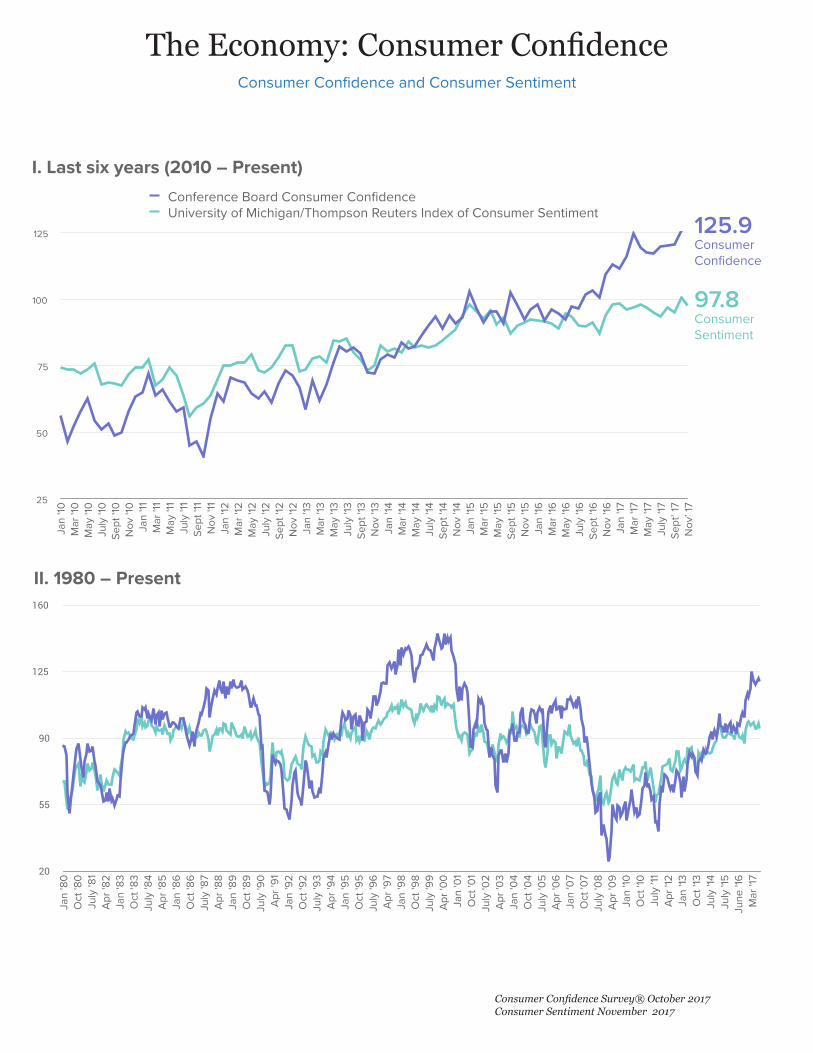
The Economy: Consumer Confidence Consumer Confidence and Consumer Sentiment
125.9ConsumerConfidence
97.8ConsumerSentiment
II. 1980 – Present
I. Last six years (2010 – Present)
Consumer Confidence Survey® October 2017Consumer Sentiment November 2017
20
55
90
125
160
Jan
'80
Oct
'80
July
'81
Apr '
82Ja
n '8
3O
ct '8
3Ju
ly '8
4Ap
r '85
Jan
'86
Oct
'86
July
'87
Apr '
88Ja
n '8
9O
ct '8
9Ju
ly '9
0Ap
r '91
Jan
'92
Oct
'92
July
'93
Apr '
94Ja
n '9
5O
ct '9
5Ju
ly '9
6Ap
r '97
Jan
'98
Oct
'98
July
'99
Apr '
00Ja
n '0
1O
ct '0
1Ju
ly '0
2Ap
r '03
Jan
'04
Oct
'04
July
'05
Apr '
06Ja
n '0
7O
ct '0
7Ju
ly '0
8Ap
r '09
Jan
'10O
ct '1
0Ju
ly '1
1Ap
r '12
Jan
'13O
ct '1
3Ju
ly '1
4Ju
ly '1
5Ju
ne '1
6M
ar '1
7
25
50
75
100
125
Jan
'10M
ar '1
0M
ay '1
0Ju
ly '1
0Se
pt '1
0N
ov '1
0Ja
n '11
Mar
'11
May
'11
July
'11
Sept
'11
Nov
'11
Jan
'12M
ar '1
2M
ay '1
2Ju
ly '1
2Se
pt '1
2N
ov '1
2Ja
n '13
Mar
'13
May
'13
July
'13
Sept
'13
Nov
'13
Jan
'14M
ar '1
4M
ay '1
4Ju
ly '1
4Se
pt '1
4N
ov '1
4Ja
n '15
Mar
'15
May
'15
Sept
'15
Nov
'15
Jan
'16M
ar '1
6M
ay '1
6Ju
ly '1
6Se
pt '1
6N
ov '1
6Ja
n '17
Mar
'17
May
'17
July
'17
Sept
’ 17
Nov
’ 17
Conference Board Consumer ConfidenceUniversity of Michigan/Thompson Reuters Index of Consumer Sentiment

Obamacare: Tracking Public AttitudesThe Kaiser Family Foundation Health Tracking Poll
“As you may know, a health reform bill was signed into law in 2010. Given what you know about the health reform law, do you have a generally (favorable) or generally (unfavorable) opinion of it?” (Rotated - Participants then asked to choose between very/somewhat favorable/unfavorable)”
40%Total Negative
51%Total Positive
+11%Net
Kaiser Health Tracking Poll: October 2017
0
25
50
75
100
03/13
06/13
09/13 11/13
01/14
03/14
05/14
07/14
10/14
12/14
03/15
06/0
9/15
08/15
10/15
12/15
02/16
04/16
07/16
09/16 11/16
02/17
04/17
05/17
07/17
09/17
Very Favorable Somewhat Favorable Don’t know/Refused Somewhat Unfavorable Very Unfavorable
-20
-8.333
3.333
15
03/13
06/13
09/13 11/13
01/14
03/14
05/14
07/14
10/14
12/14
03/15
06/0
9/15
08/15
10/15
12/15
02/16
04/16
07/16
09/16 11/16
02/17
04/17
05/17
07/17
09/17
Net (% Positive - % Negative)

Tota
l
0 100
43516461223
Democrat-Held Seats Not on BallotSolid Democrat Likely DemocratLean DemocratToss UpLean Republican Likely RepublicanSolid Republican Republican Held Seats Not on Ballot
“What it Takes:” 2018 Senate MathCan Democrats take the Senate Majority in 2018?
Current Senate Breakdown by Party
Cook Political Report Senate Math for 2018
Bottom Line: Democrats need at least three seats to take the Senate. To do that they need to hold all 25 of their
seats up for reelection and win the three Republican seats in the Toss Up column.
Tota
l
0 100
5248
Democrats Republicans
Two Independents - King (ME) and Sanders (VT) caucus with the Democrats
Last Ratings Change: October 27, 2017
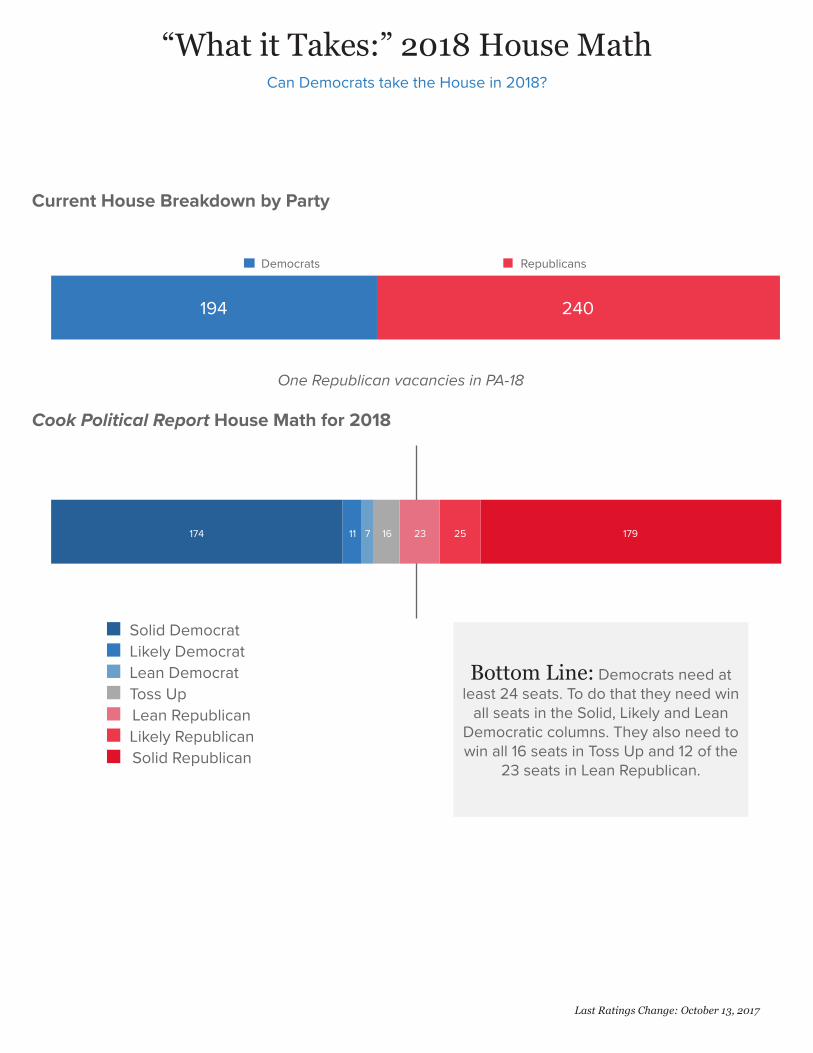
“What it Takes:” 2018 House MathCan Democrats take the House in 2018?
Current House Breakdown by Party
Cook Political Report House Math for 2018
One Republican vacancies in PA-18
Last Ratings Change: October 13, 2017
Tota
l
0 435
179252316711174
Solid DemocratLikely DemocratLean DemocratToss UpLean Republican Likely RepublicanSolid Republican
Bottom Line: Democrats need at least 24 seats. To do that they need win
all seats in the Solid, Likely and Lean Democratic columns. They also need to win all 16 seats in Toss Up and 12 of the
23 seats in Lean Republican.
Tota
l
0 108.75 217.5 326.25 435
240194
Democrats Republicans